
Abstract
Urban inequality is a major challenge for cities in the 21st century. This inequality is reflected in the spatial income structure of cities which evolves in time through various processes. Gentrification is a well-known illustration of these dynamics in which the population of a low-income area changes as wealthier residents arrive and old-settled residents are expelled. Less understood but very important is the reverse process of gentrification through which areas of cities get impoverished. Gentrification has been widely studied among social sciences, especially in case studies, but there have been fewer quantitative analyses of this phenomenon, and more generally about the spatial dynamics of income in cities. Here, we first propose a quantitative analysis of these income dynamics in cities based on household incomes in 45 American and nine French Functional Urban Areas (FUA). We found that an important ingredient that determines the evolution of the income level of an area is the income level of its immediate neighboring areas. This empirical finding leads to the idea that these dynamics can be modeled by the voter model of statistical physics. We show that such a model constitutes an interesting tool for both describing and predicting evolution scenarios of urban areas with a very limited number of parameters (two for the United States and one for France). We illustrate our results by computing the probability that areas will change their income status in the case of Boston and Paris at the horizon of 2030.
Introduction
Urban inequality is a crucial topic in social studies (Nijman and Wei, 2020) and represents a primary challenge for the development of cities. In particular, the spatial dynamics of inequality are often seen through the lens of gentrification. This phenomenon is the multistage process through which low-income areas transform with the influx of more affluent residents (Lees et al., 2013; Lees et al., 2010). As the new population settles in, the economic value of the area increases, new businesses develop and real estate prices go up while long-established populations eventually have to move out due to the rise of rents (Freeman and Braconi, 2004; Atkinson et al., 2011). This process goes along gentrification which has been widely studied over the past 40 years (Smith, 1979) for specific cases (Freeman and Braconi, 2004; Fujitsuka, 2005; Clerval, 2008; Torrens and Nara, 2007; Pattaroni et al., 2012; Venerandi et al., 2017; Doring and Ulbricht, 2018), or about the role of public investment (Zuk et al., 2018) and its impact on health, for example (Gibbons et al., 2018). The inverse process of gentrification (Atkinson, 2004; Douglas and Massey, 1993; Lobmayer and Wilkinson, 2002), through which districts become impoverished has been, however, far less conceptualized, leading previous authors to question the relevance of the concept of gentrification per se (Bourdin, 2008). The two phenomena are however correlated as the outflow of people generated by gentrification generally results in other processes (urban sprawl, impoverishment) somewhere else in the city. More generally, a major question in urban studies is then to understand why and how certain districts can become richer or poorer (Rosenthal and Ross, 2015), and what governs the household demand (Ioannides and Zabel, 2008). In the following, we will reduce this complex issue which has multiple social, demographic, cultural, or economic implications, to the more quantitative and tractable problem of local income dynamics, thus putting aside qualitative aspects of gentrification and impoverishment.
Most quantitative studies of income dynamics in cities (such as Rey and Montouri, 1999, Torrens and Nara, 2007, and Pattaroni et al., 2012, for example) rely on econometric tools (such as multivariate regression for example). We propose here a completely different approach, coming from statistical physics. New approaches, in particular those using statistical physics tools have proven to be very fruitful to describe social phenomena such as opinion, cultural and language dynamics, crowd behavior, humans dynamics or social spreading, for example (Castellano et al., 2009). The common focus of these studies is to understand the emergence of collective phenomena from the interactions of individuals. Such an approach was also initiated in sociology with the famous example of the Schelling model for segregation (Schelling, 1971). We propose here a model in the same spirit for the income dynamics in urban areas. This model is parsimonious, based on a simple rule and is not purely descriptive. We show that at the simplest level the probability for a specific neighborhood to change its income level is mainly governed by the income level of its neighbors, and the resulting model is known as the voter model in the statistical physics literature (Holley and Liggett, 1975; Krapivsky et al., 2010). Although this model is very simple, it is particularly well-suited to describe and predict the local dynamics of household incomes in cities. We show that the social evolution of a district significantly depends on the economic level of its direct neighbors and that such a representation is sufficient enough to statistically predict the social dynamics of incomes in cities.
Household income in US cities
We use household income data at the tract level for FUAs in the United States and at the IRIS level in France. This allows us to study the income level dynamics at this small spatial scale. More precisely, our analysis is based on the open datasets of median household incomes in American census tracts for each year between 2010 and 2019 (Manson et al., 2021) (these values are obtained as interpolation between successive censuses) and median household income in French IRIS (a French equivalent of tracts) between 2001 and 2017 (Anon., 2022) (note that for both cases, these income values are before taxes). In the United States, we crossed these data with boundaries of FUAs and kept FUAs with more than 200 tracts, leading to a final set of 45 urban areas. In France, we crossed these data with boundaries of FUAs and kept FUAs with more than 150 IRIS, leading to a final set of nine cities. In each city, we compute every year the average of the median household incomes at the tract level


Since we observe unusual one-year drops of household incomes in the data, we use a convolution regularization (see Methods) to smooth out one-year outliers. This classification hence gives a very simple city-relative definition of area wealth. Every city has tracts in both sets with a relative share of each category close to 50%. Although very basic, this definition is enough to track local evolutions of income over time and to single out significant and consistent changes.
In our datasets, we can follow the share of each group over 10 years. In particular, we note that in most American cities the share of people living in below-average tracts has decreased over 10 years (on average by 0.6%) but in more than 42% of cities it has increased (see Figure 1), from which we conclude that there is no global and steady tendency toward an increase or a decrease of social segregation based on income level at the US scale. Distribution of the shift of the share of people living in tracts below average income between 2010 and 2019 in American FUAs. For example, three cities have experienced during this time a decrease larger than 4%. On average, the number of people living in tracts below average income has decreased from 53.6% to 53.0%. Yet, in 42% of American FUAs, this share has increased (here, “pp” stands for percentage point where a percentage point or percent point is the arithmetic difference between two percentages).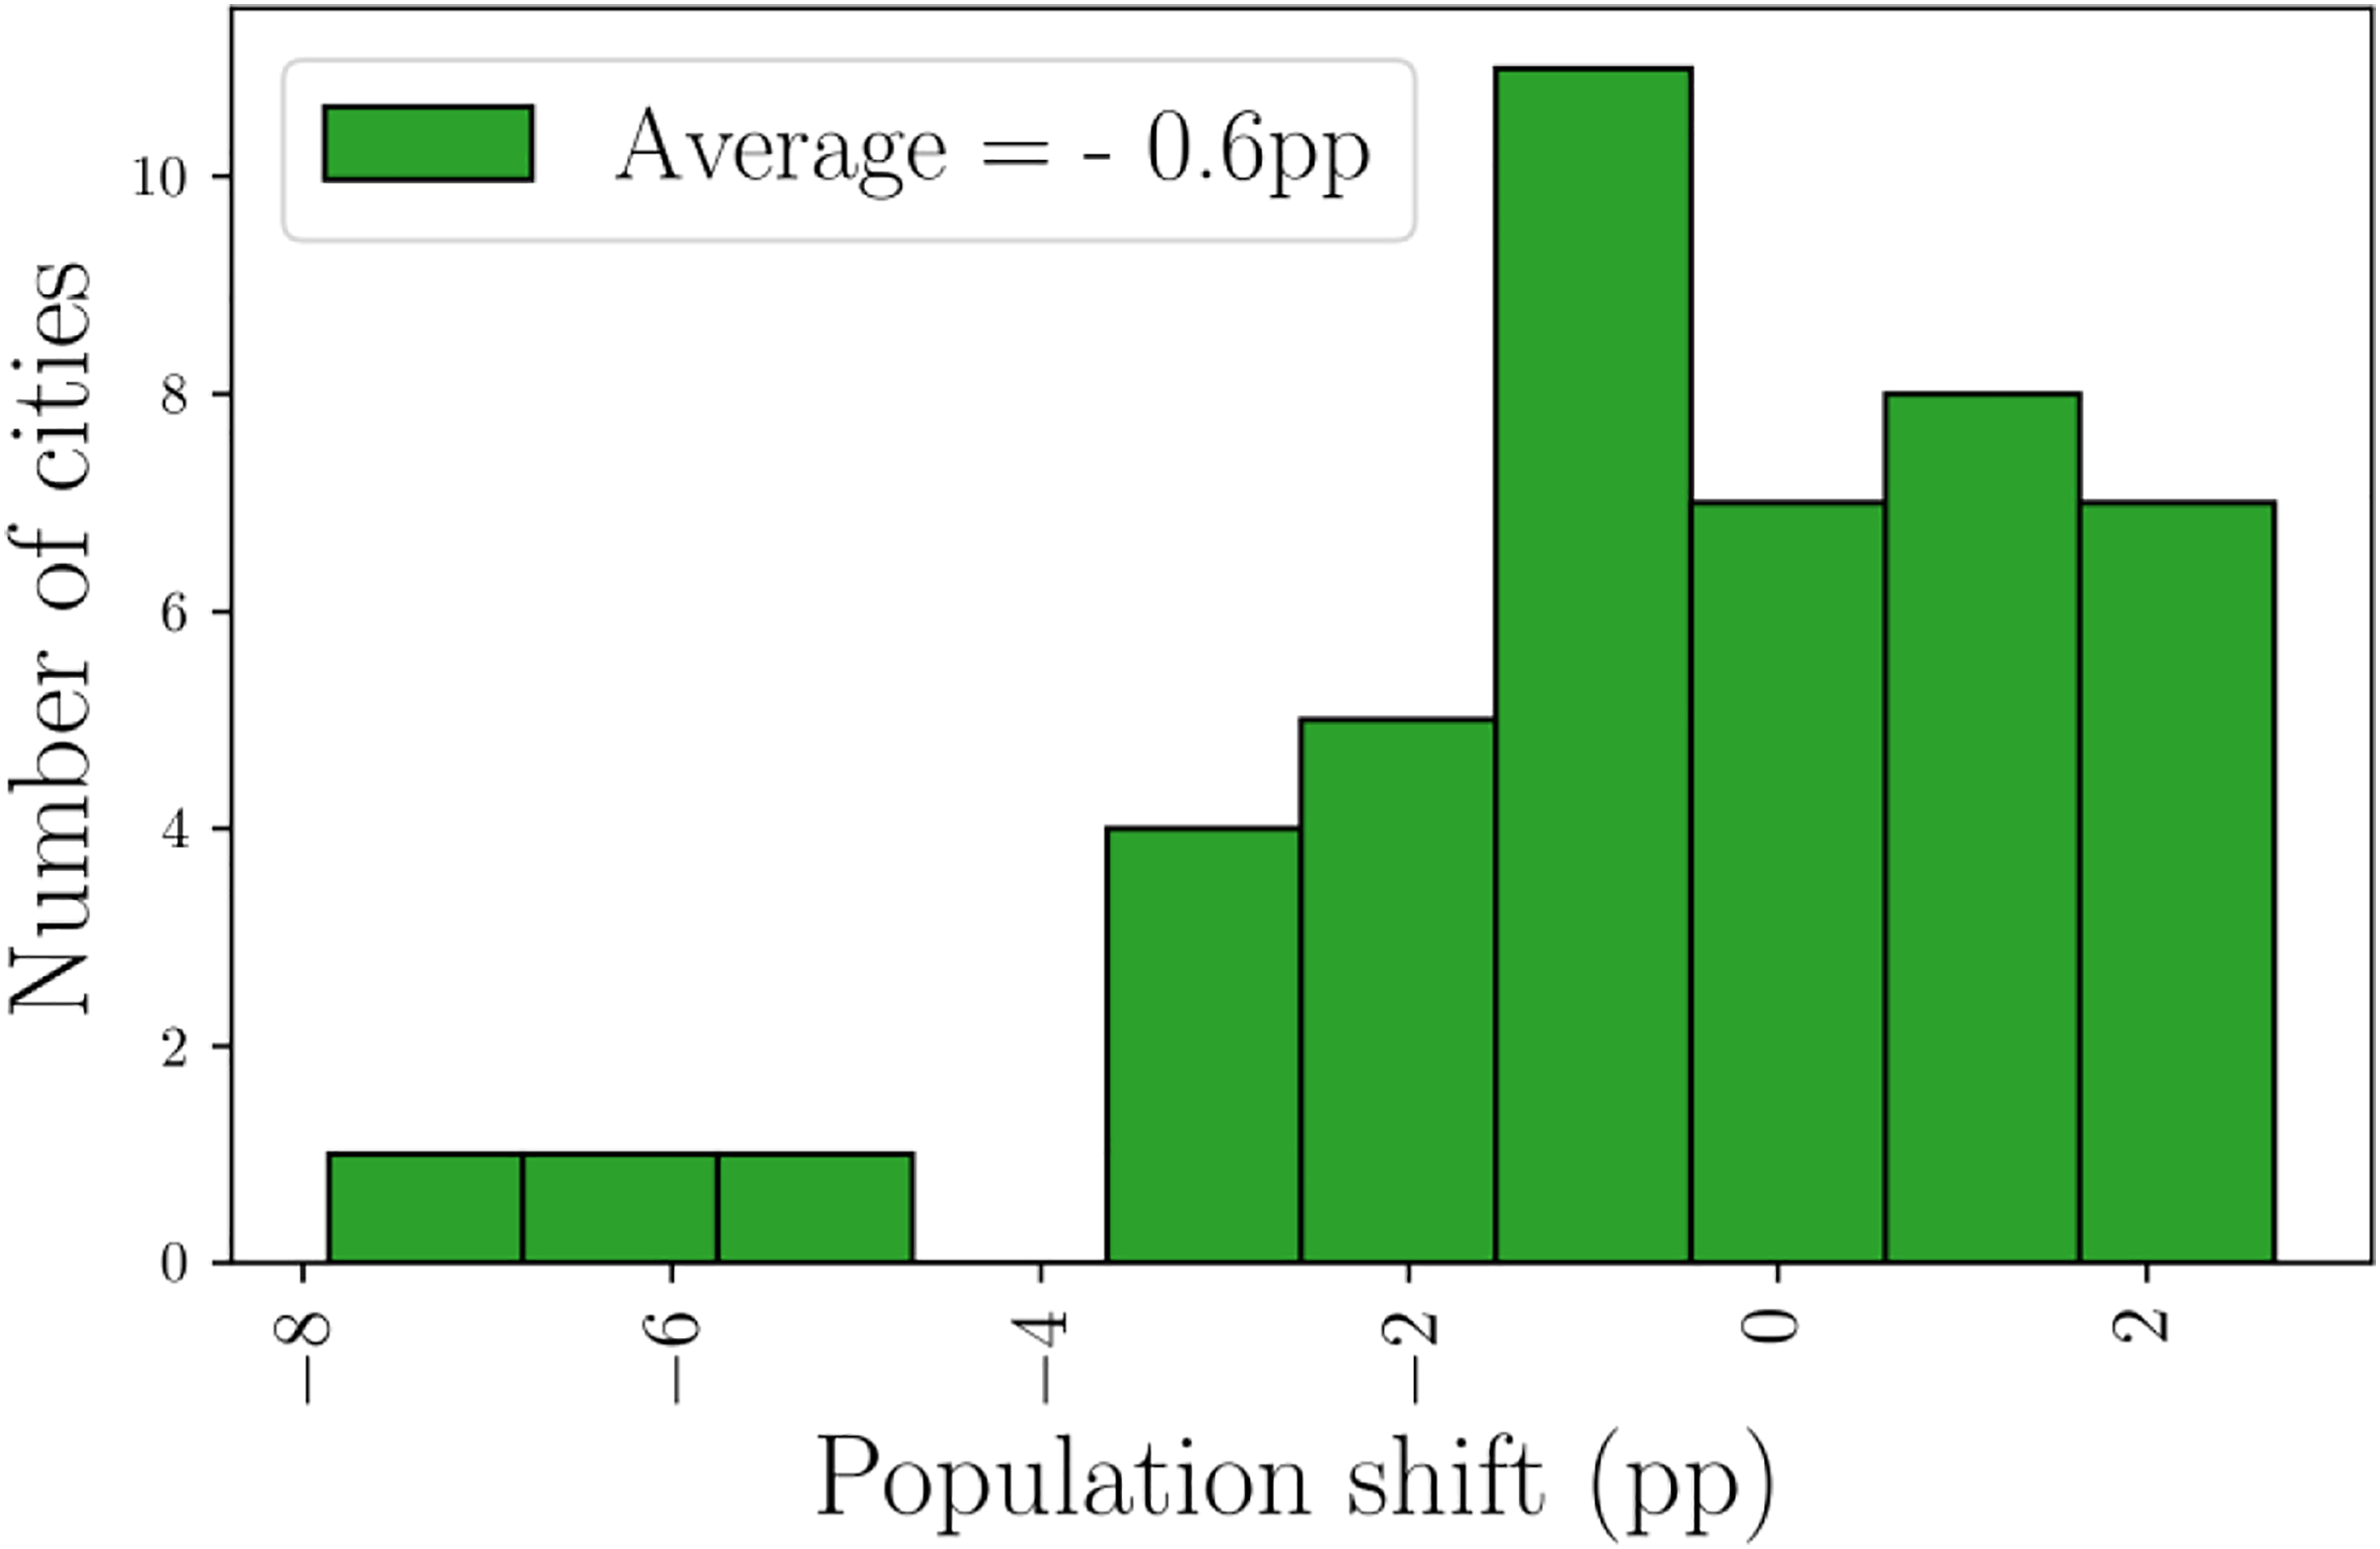
One natural question is then to understand why certain areas can become richer or poorer and not others. Instead of studying a variety of socio-economic features that could account for such changes, we focus on the impact of direct neighbors on the probability for a tract to change its category. The effect of neighbors was already considered in the gentrification context in (Guerrieri et al., 2013). To test the effect of neighbors, we build an unweighted and undirected graph of tracts for each city. In this graph, tracts are neighbors if and only if they share a geographical border. At each timestep (we tested different timesteps, see Methods), we compare


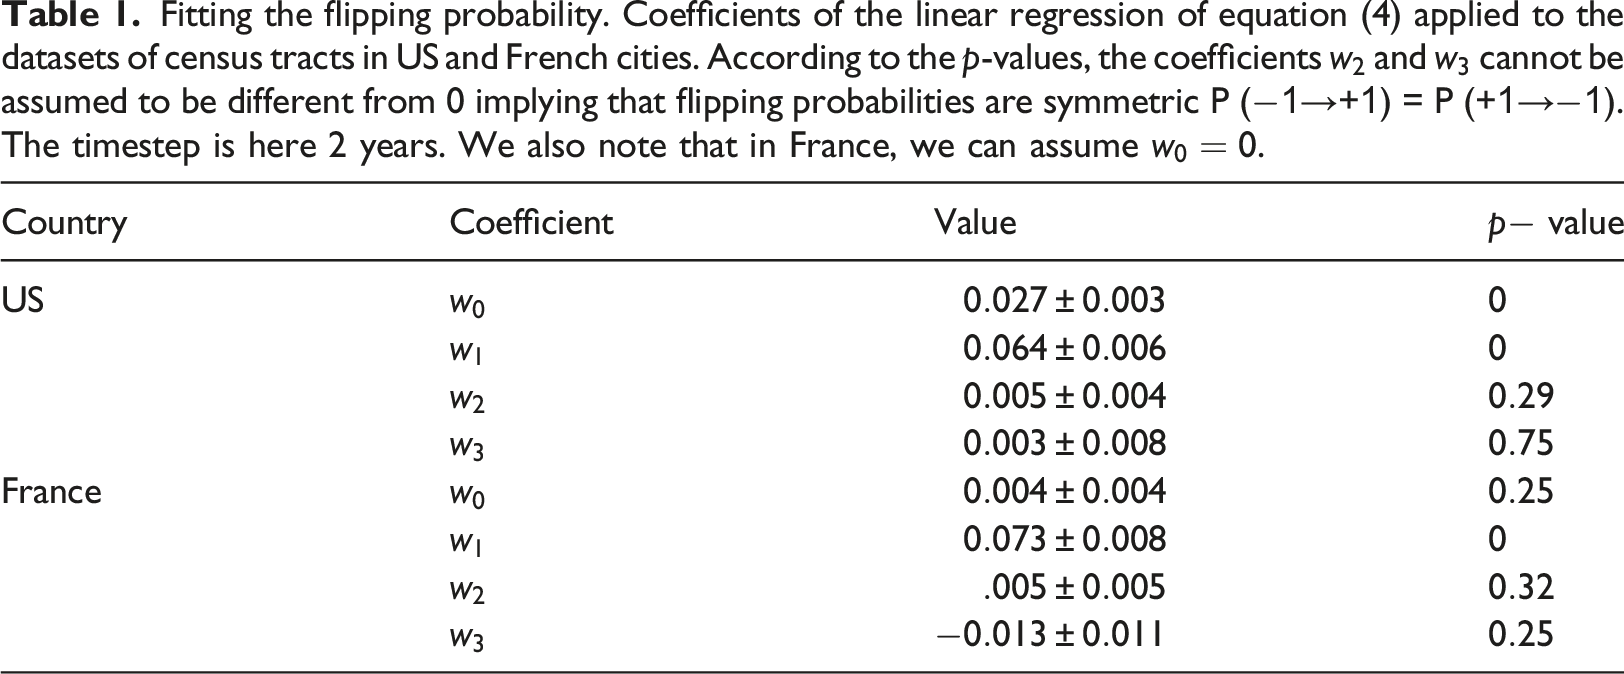
Fitting the flipping probability. Coefficients of the linear regression of equation (4) applied to the datasets of census tracts in US and French cities. According to the
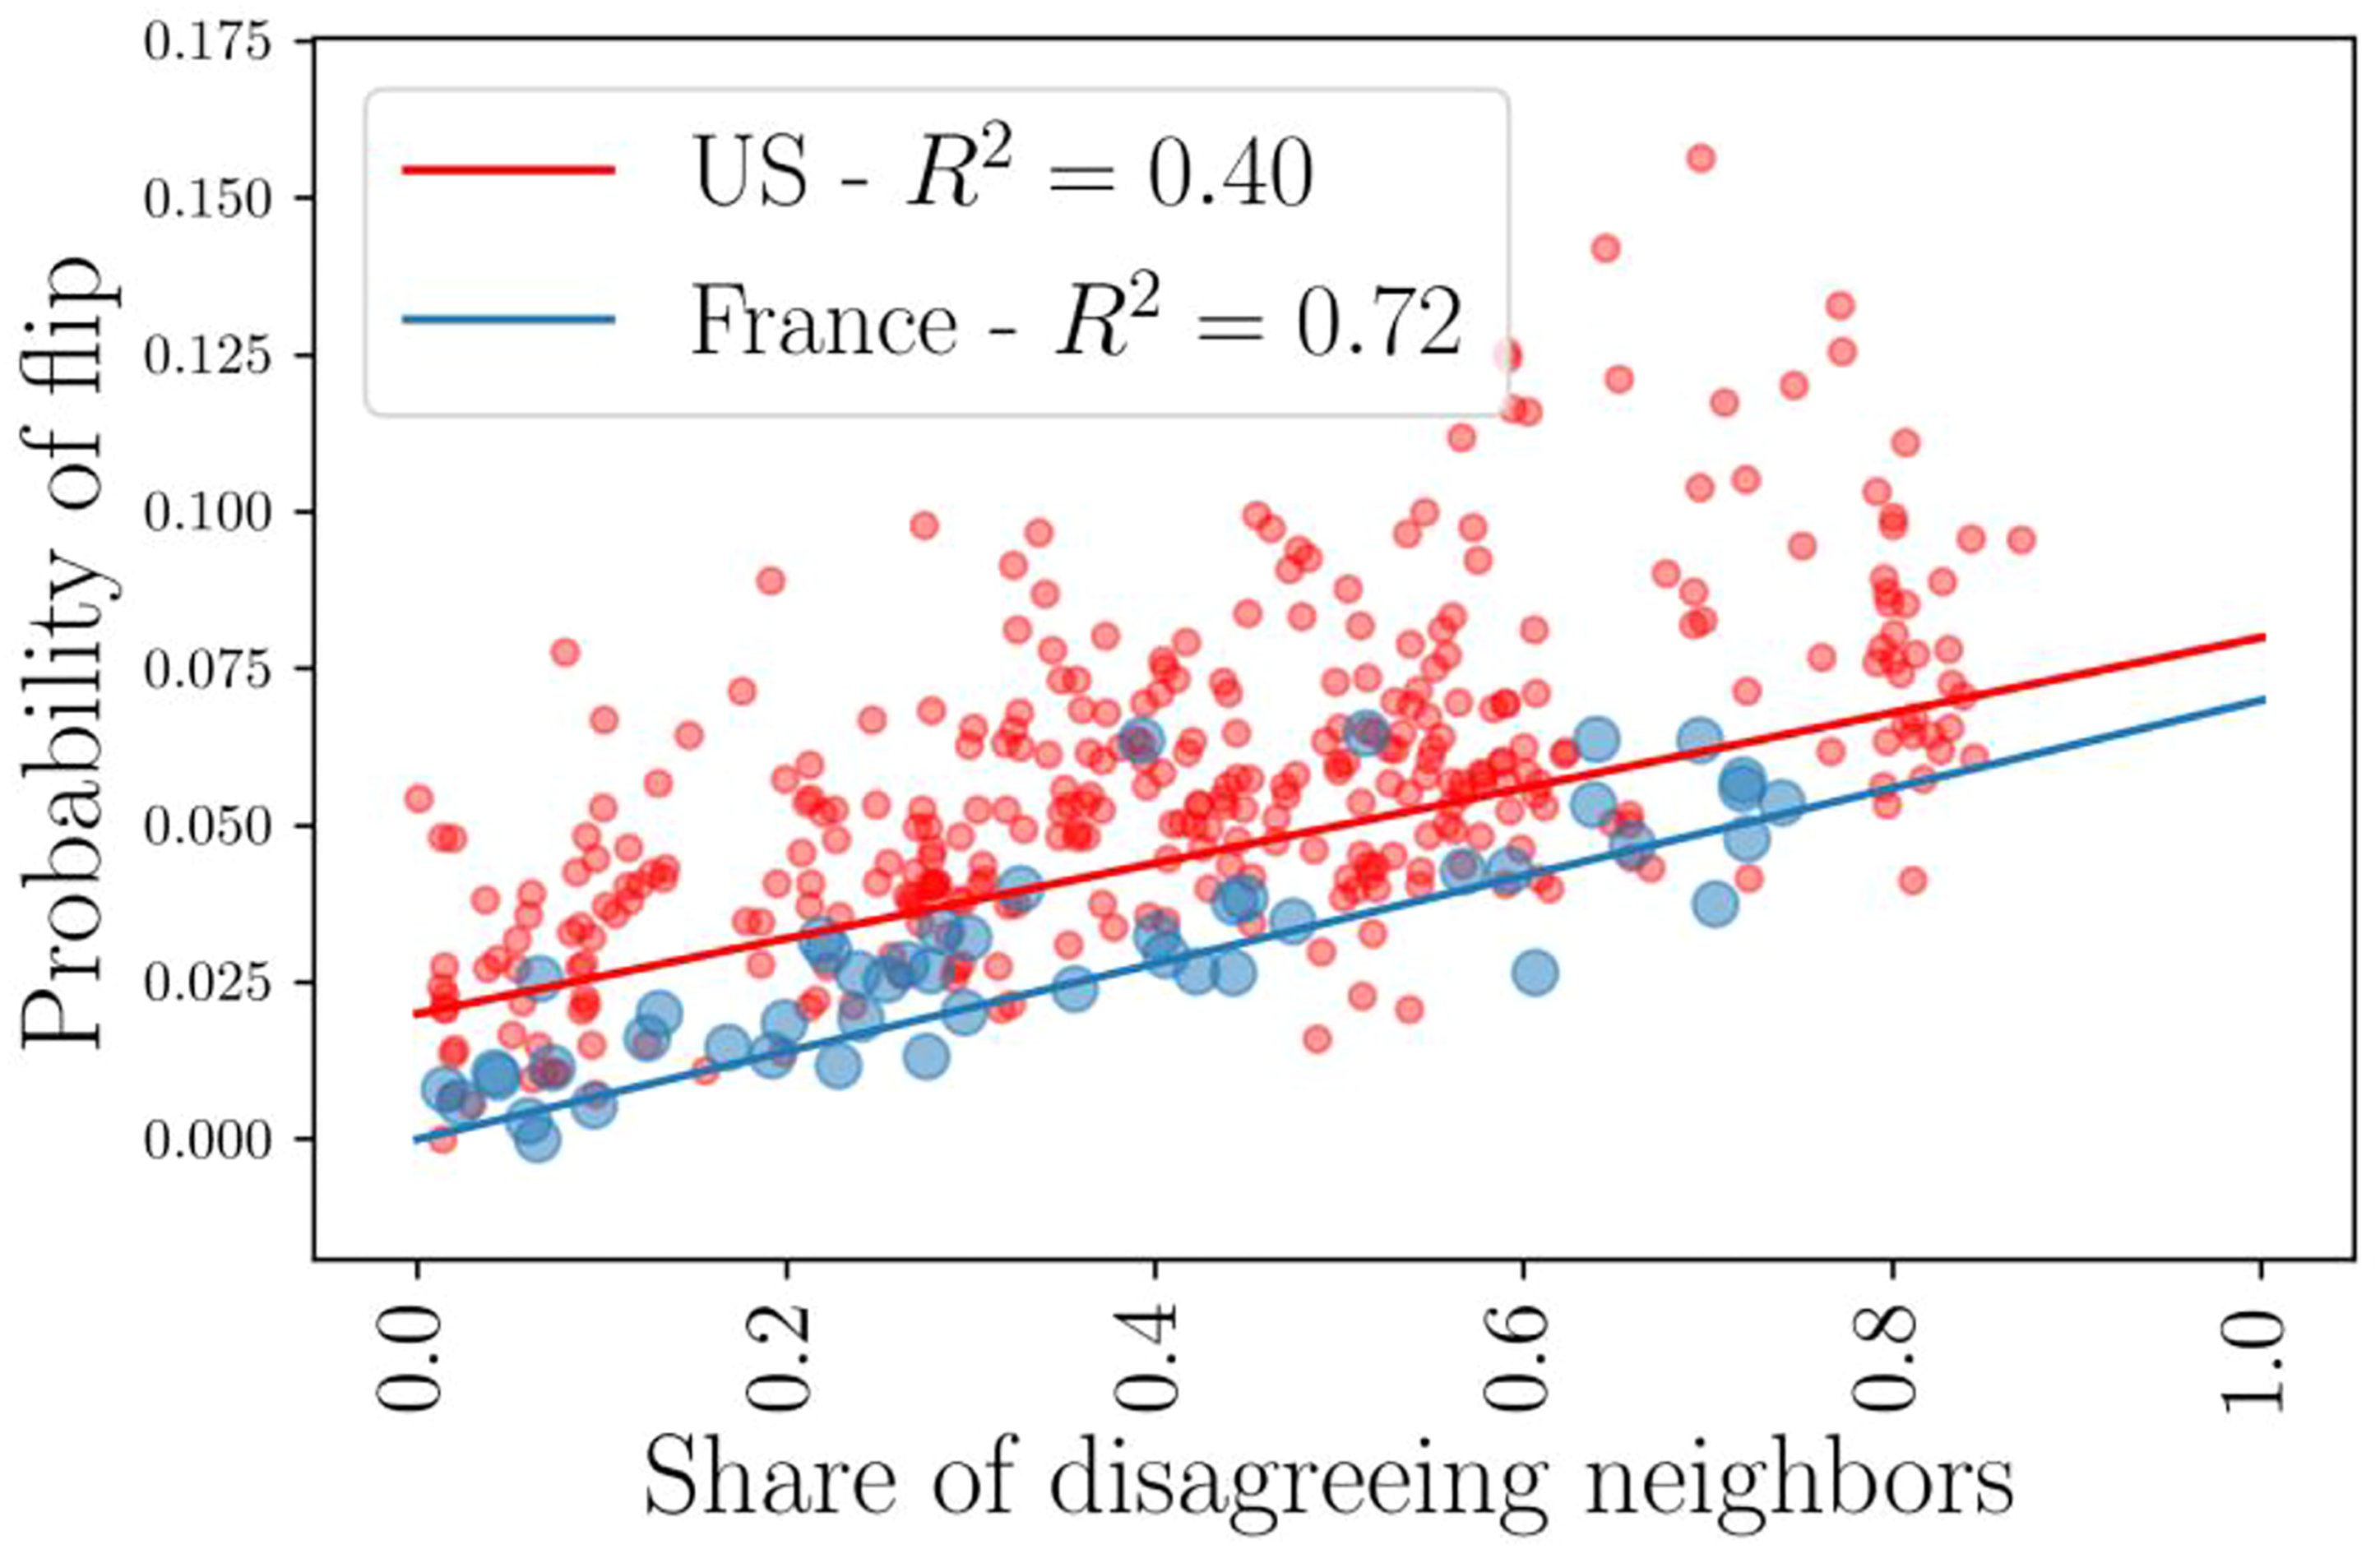
Flipping probability versus the fraction of different neighbors. Probability for a tract to flip to another income category between years
The voter model
A flipping probability that follows equation (5) constitutes the basis of the well-known “voter model” in statistical physics (Krapivsky et al., 2010; Liggett 1997; Dornic et al., 2001; Krapivsky, 1992; Frachebourg and Krapivsky, 1996) which describes consensus formation in a population of agents characterized by a set of integer (in the usual case, the state of each agent is described by a binary variable 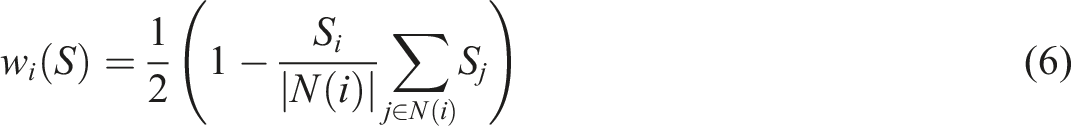
Dynamics of household income
In the following, we want to understand whether a voter model can account for the dynamics of household income in cities. In order to get some intuition about the structure of tracts in France and in the United States, we measure their degree distribution (see Figure 3). We observe that they are not far from a regular lattice of degree 6 in the US case and 5 for French cities (here, a regular lattice means that all the tracts have the same number of neighbors). In our simulations, we use the real structure of tracts and thus include possible effects due to the small degree fluctuations. Distribution of the degree of tracts in American and French FUAs. The average degree is 6.1 with a standard deviation of 2.0. One can assume that the network of tracts in American cities is a regular lattice of degree 6 (and 5 for French cities).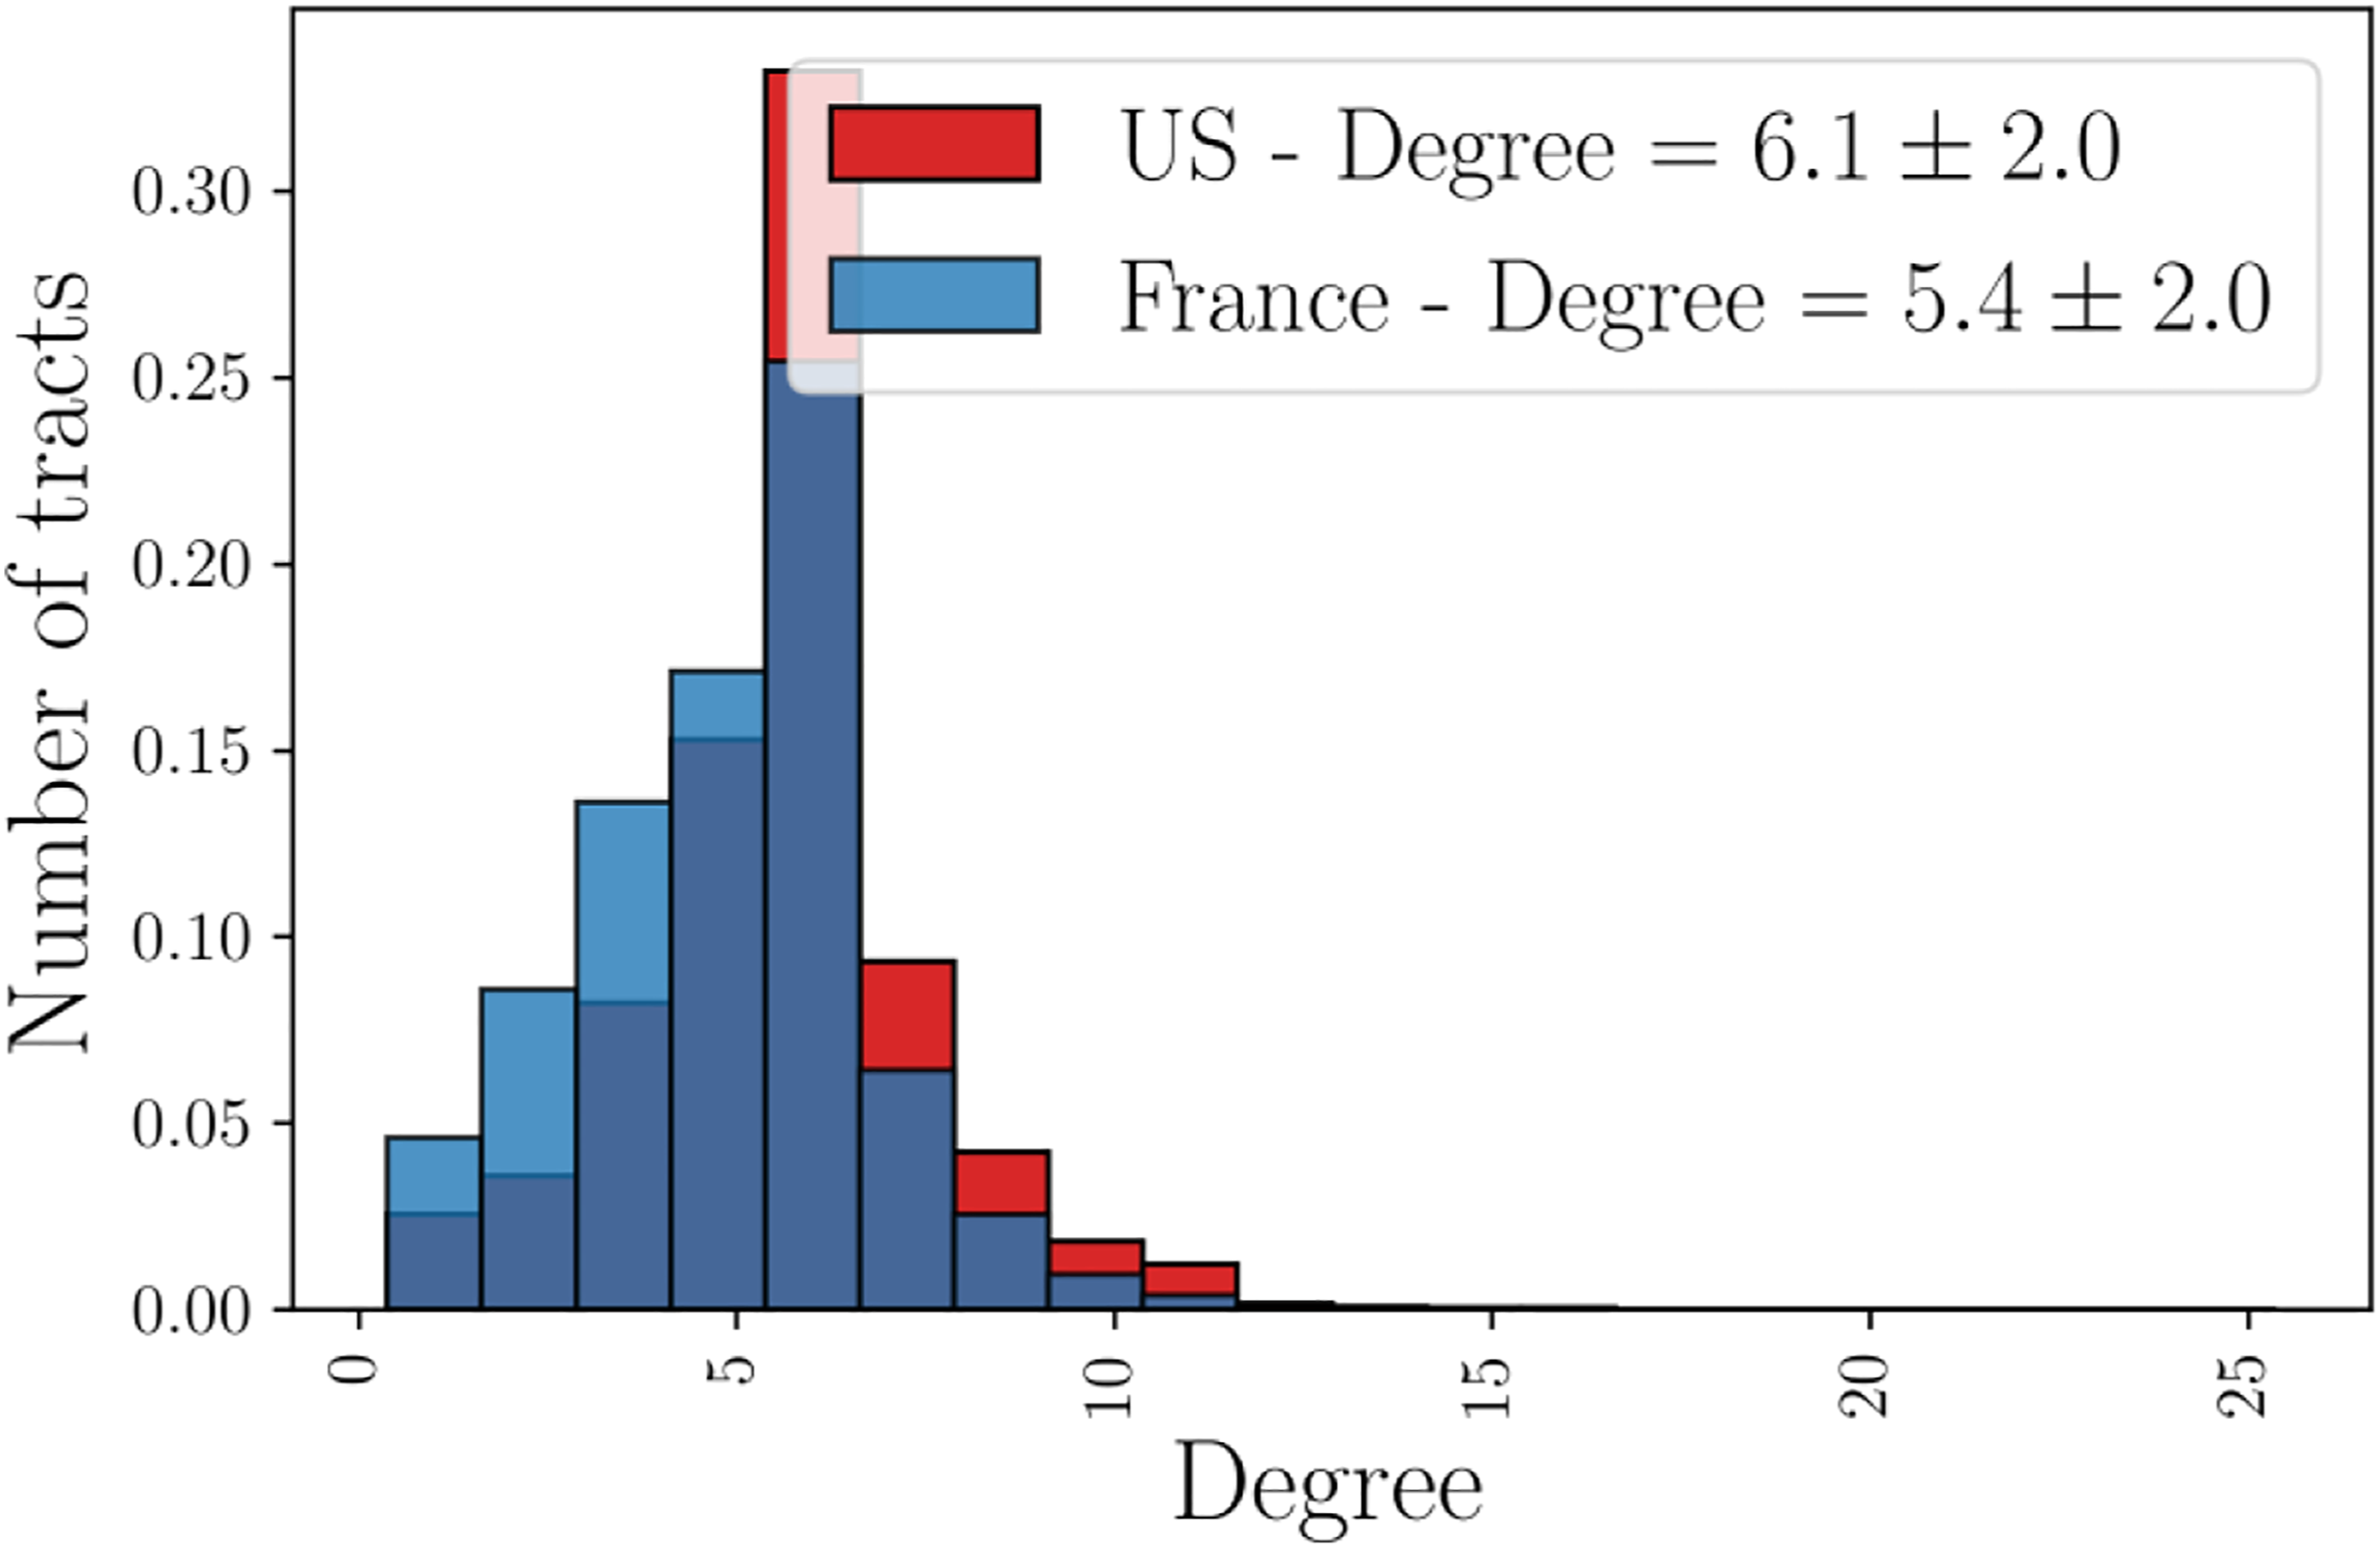
At an aggregate level (for all cities and all years of the country), we have shown that the flipping probability can be described by a simple linear function of the fraction of neighbors in the opposite income level (equation (5)). One can also fit such a relation at the city level, thus giving different
So far, we have shown that there is a prior relation between the probability of flipping and the share of neighbors in opposite status that is akin to the evolution equation of a noisy voter model. We have however to test whether such a model is a posteriori able to reproduce long-term tendencies of household income in cities. We thus build a counterfactual noisy voter model with the same values for all American cities parameters Observed versus simulated flipping probabilities. A perfect prediction corresponds to the line 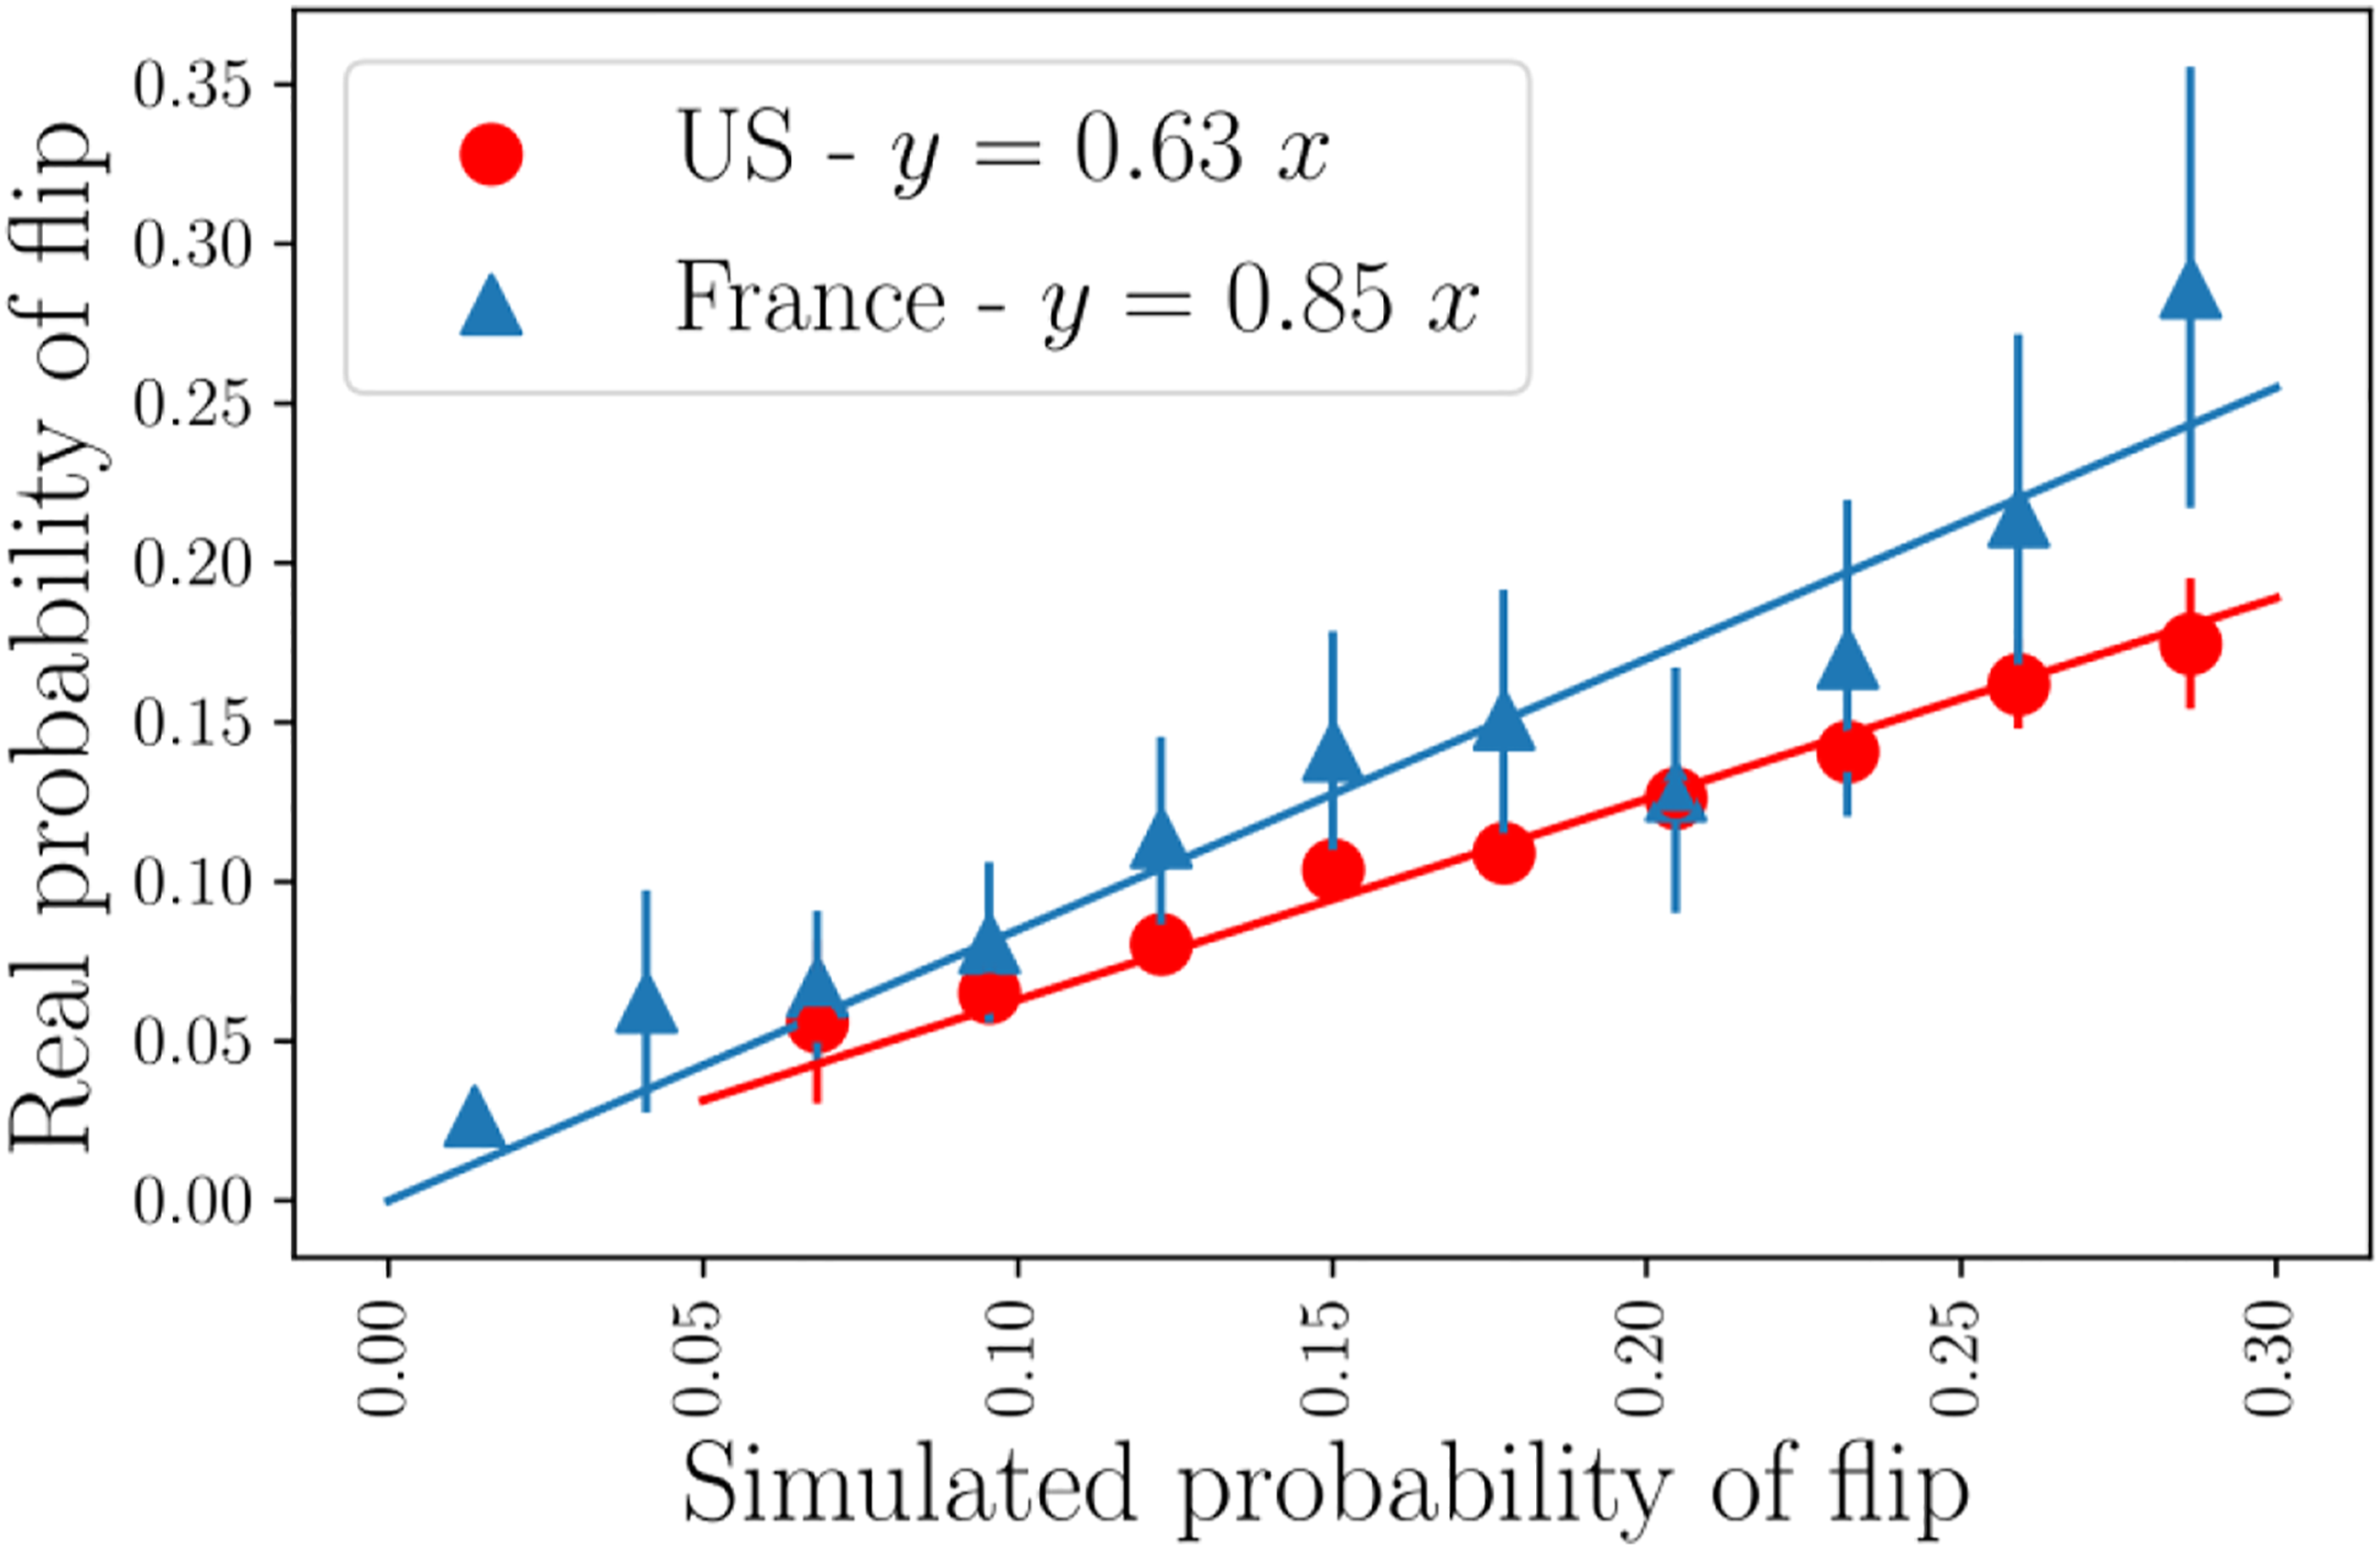
Discussion and conclusion
So far, we have seen that in American and French major cities, the probability for a tract to change income category strongly depends on the levels of its immediate neighbors in a voter model like relation of the form
Although this model is not perfect it could serve a starting point for more refined analysis and provides a very simple tool for exploring various evolution scenarios for urban areas in the future. In order to illustrate this point, we show in Figure 5 a prediction of the income evolution of Boston tracts and Paris IRIS up to 2030. Starting in 2019, we simulate 1000 evolutions of Boston and Paris tract levels with the voter model previously described. For each tract, we compute the probability to flip between 2019 and 2030. The darker zones correspond to higher probabilities of flipping. Blue zones are below-average income areas for which we compute the probability to get above average. Red areas are above-average income areas for which we compute the probability to drop below average. The most interesting tracts are the dark ones, either blue or red, in the sense that there is a large probability to see them flipping in the next decade. This predictive result shows that a voter model applied to income dynamics is not only descriptive but can capture more fundamental elements of city dynamics. Predicted probability of changing income category for Paris and Boston. We simulate 1000 evolutions of Boston and Paris tracts with the voter model described in the text. For each tract, we compute a probability to flip between 2019 and 2030 for Paris (left) and Boston (Right). Darker tracts are the tracts with highest probabilities of flipping. Red areas are above-average income areas for which we compute the probability to drop below average. Most interesting tracts are the dark ones, either blue or red, that have a large probability to flip in the next decade.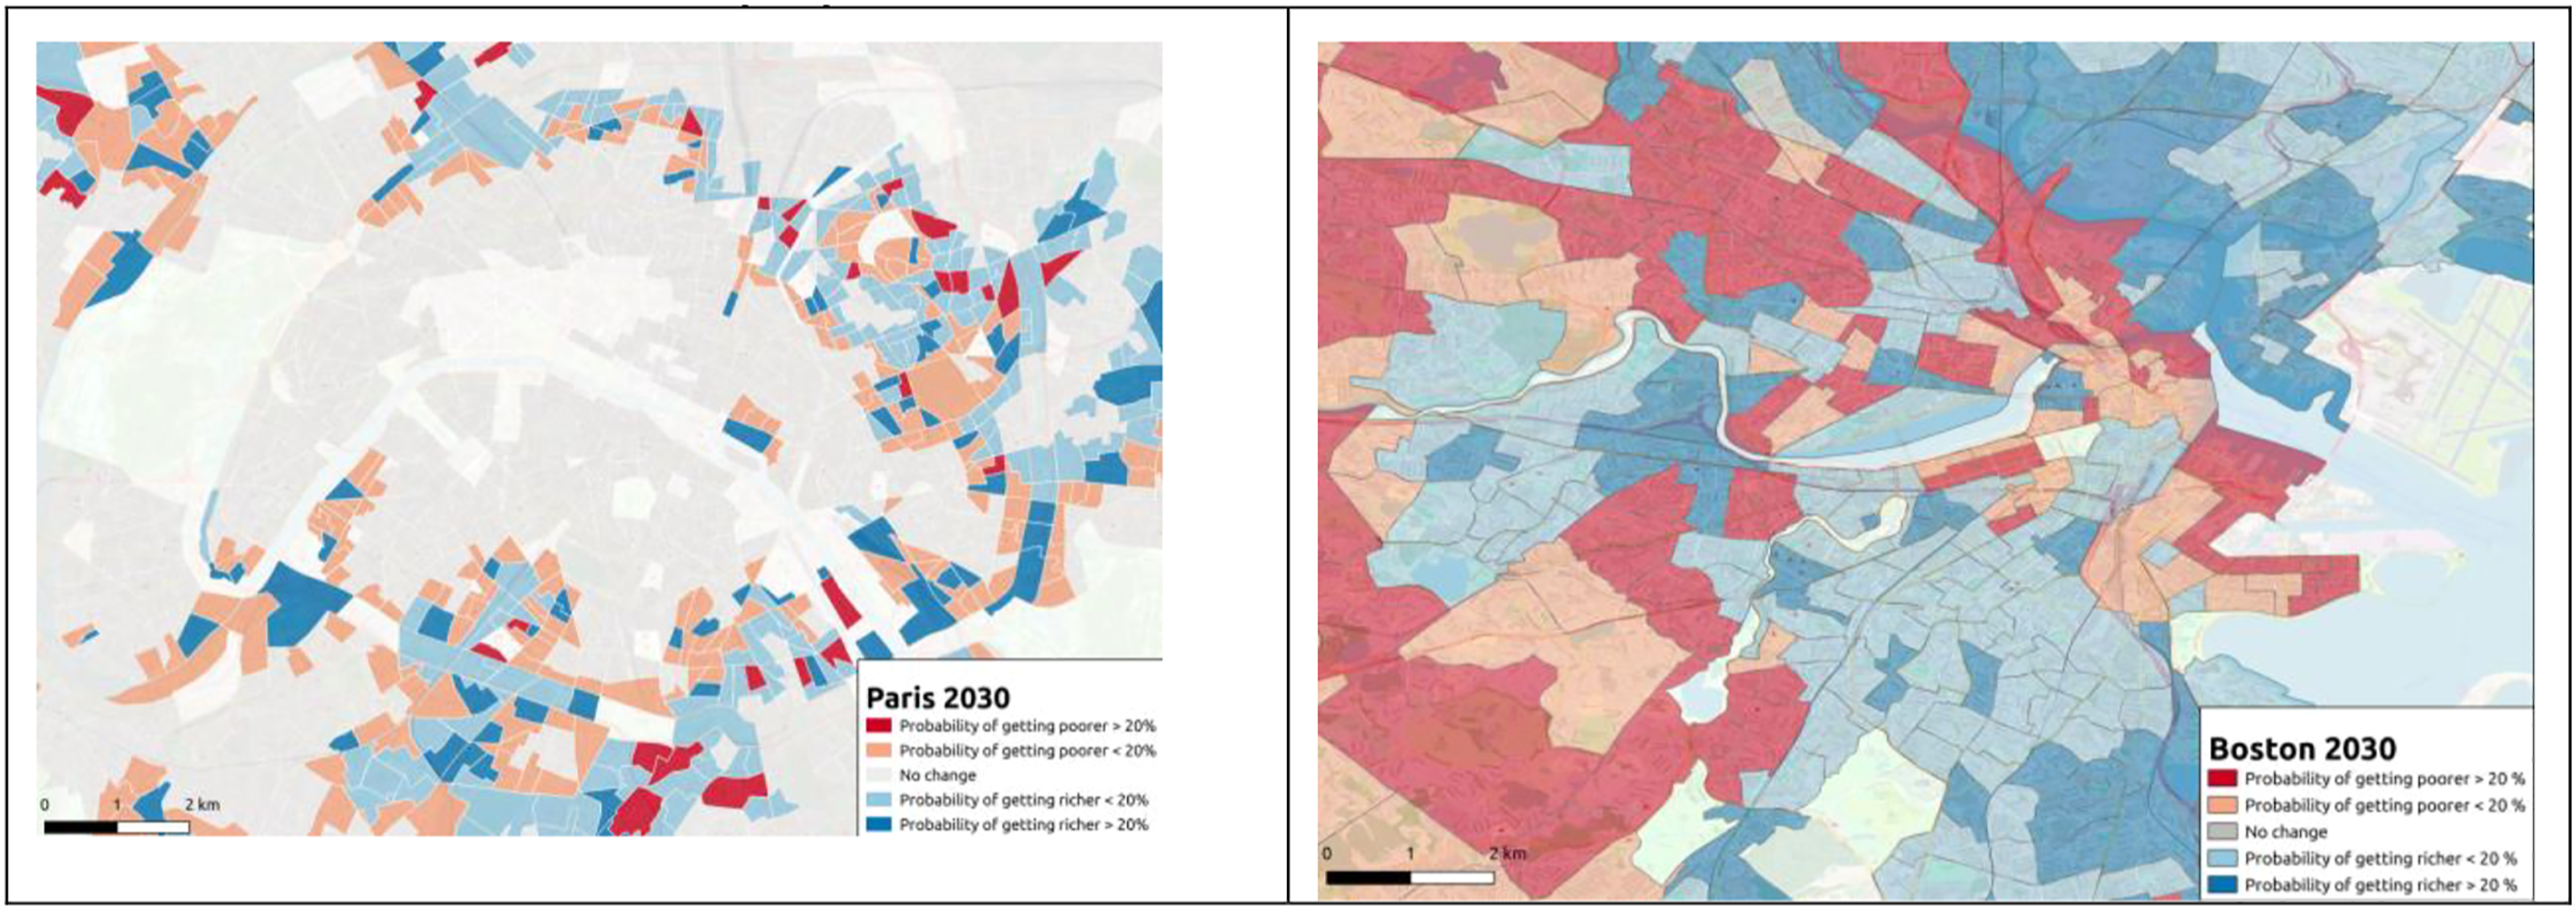
In this paper, we investigated the change of income status of a specific urban area. We showed that the change of the income status of a specific neighborhood can be described by a parsimonious model that gives both descriptive and predictive insights for urban analysis. In a broad sense, the process of getting gentrified or impoverished proxied here by a probability to switch from one income status to another is well approximated by a voter model, meaning in particular that the effects of immediate neighbors are essential in the socio-economic dynamics of a district. We used here a binary representation of income levels in the city and a continuous income approach could lead to a more refined description of these processes. This would require to write a spatiotemporal differential equation for the income state and efforts in this direction constitute an interesting topic for future research.
Footnotes
Acknowledgements
VV thanks the ISC Paris for their daily support and the Ecole de Ponts for financial support.
Author contributions
V.V. and M.B. designed the study, V.V. acquired the data, and V.V. and M.B. analyzed and interpreted the data and wrote the manuscript.
Declaration of conflicting interests
The author(s) declared no potential conflicts of interest with respect to the research, authorship, and/or publication of this article.
Funding
The author(s) received no financial support for the research, authorship, and/or publication of this article.
Data availability
Data and materials availability: All the data used in this paper is freely available for download at the URL given in references (Manson et al., 2021) and (Dataset Insee, 2022). The code written in Python is available upon request.