
Abstract
Kevin Lynch’s concept of imageability describes how effectively an environment evokes a mental image in an observer’s mind, which consists of three components—“identity, structure, and meaning”—with the first two being the main components to build Lynch’s cognitive map. Although imageability has significantly influenced urban design and planning, and inspired numerous subsequent research, the “meaning” component has not been clearly studied. The rise of new urban data, particularly the booming availability of reviews of urban spaces on platforms such as TripAdvisor and Google, offers a valuable opportunity to incorporate the meaning into the imageability study. By adapting several open-source algorithms, this research efficiently extracts both objective (e.g. location, number of reviews) and subjective (e.g. ratings, review text) information from the online platform, proposing a novel approach to studying the meaning component through a fine-tuned BERT model. These data and methods enable this research to capture and categorize the meaning component for describing the image of the city, using Singapore as a case study. The results show that: (1) Lynch’s cognitive mapping approach could potentially be enhanced by incorporating the meaning into the study of imageability, it could amplify the existing nodes or landmarks, and create new “nodes”. (2) The proposed “meaning patch” could add new layers to structure of the city image by representing the shared meanings of multiple places, suggesting the potential to be studied as the sixth element to extend the existing imageability framework, and open new agenda for the future studies.
Introduction
Imageability is an essential concept in the field of urban design and planning (Lynch, 1960). For a long time, imageability has been one of the most critical qualities of urban spaces. By creating distinctive and memorable urban elements, designers can make a place more attractive and inviting, encourage social interaction, and enhance the livability of an area (Ewing and Clemente, 2013; Filomena et al., 2019; Huang et al., 2021). In his renowned book The Image of the City, Lynch (1960) identified the five elements of imageability: nodes, paths, edges, districts, and landmarks. These five elements provide a robust framework for understanding how people visually and spatially perceive cities. They have become a cornerstone of cognitive mapping, inspiring a wide range of subsequent studies (Filomena et al., 2019; Huang et al., 2021; Nasar, 1990).
However, prior to identifying the five elements, Lynch firstly introduced three components of the environmental image: identity, structure, and meaning (Figure S1 in Supplemental Document). The identity of a place refers to its distinctive qualities of physical setting, which allow it to be easily recognized and identified by observers. It represents the unique character that separates a place as a distinct entity (Ewing and Clemente, 2013; Lynch, 1960, 1984). Structure, on the other hand, refers to spatial relationships or patterns among various places. It encompasses how different elements are organized in relation to one another and to the observer, creating a coherent framework that allows individuals to navigate and understand the urban environment (Ewing and Clemente, 2013; Lynch, 1960, 1984). For meaning, Lynch (1960) argued “the object must have some meaning for the observer, whether practical or emotional. Meaning is also a relation, but quite a different one from spatial or pattern relation.” For instance, meaning could be “recognition of a ‘door’ as a hole for getting out of” (Carmona, 2021). The meaning component, such as local traditions (Carmona, 2019), community familiarity (McCunn and Gifford, 2021), and emotional connections to specific places (Relph, 1976), also forms a critical part of how cities are experienced and their images are created.
The cognitive map with the five elements in Lynch’s imageability framework focused primarily on physical and spatial characteristics, and captured the identity and structure of places. Most of the recent research has also focused predominantly on identity and structure aspects despite the foundational importance of meaning. For example, Ewing and Clemente (2013) gave a detailed definition of the identity of imageability, and many subsequent studies has followed their method, incorporating more advanced techniques and more diverse data source, such as using computer vision method to analyze the street view imagery for the physical settings of urban environment (Ito et al., 2024; Liu et al., 2016). In contrast, meaning in imageability remains less explored due to its abstract and multifaceted nature, making it difficult to capture and analyze (Barros et al., 2022).
Importance of “meaning” to imageability
The definition of “meaning” is more abstract than identity or structure. Building upon Lynch’s initial description above, it has been discussed as the public’s social and cultural understanding of the environment or the “common themes” of a place (Bhattacharya et al., 2020; Carmona, 2021). These themes may include the historical significance of a place (Nasar, 1990), the architecture significance of buildings in a city (Appleyard, 1980), and the public memories or events in a place (Carmona, 2021; Song et al., 2021). What these discussions have in common is an emphasis that all of these themes can be visualized or have a physical embodiment. Therefore, meaning in imageability is the significance or understanding that the public attributes to places, which can also create a strong image in their mind (Carmona, 2021; Lynch, 1960).
Several scholars have underscored the importance of meaning to imageability. For instance, Nasar (1990) demonstrated that the evaluative image of the city is not merely a product of physical attributes but also of emotional and social responses that shape public perceptions. Rapoport (1977) further emphasized that human interactions with urban form are influenced by cultural and symbolic dimensions, and Appleyard (1980) also argued that places with historical meanings and livability contribute significantly to positive mental images. Kaplan and Kaplan (1982) showed that effective cognitive functioning in urban settings depends on the interplay between tangible features and intangible qualities. These studies proved that integrating meaning into imageability analysis enriches our understanding of cognitive maps and urban perception by capturing the social and cultural narratives.
Therefore, a complete cognitive map should encompass all three components—identity, structure, and meaning—as they constantly interact and shape one another. The image of a city is not solely determined by its physical layout, but also by the emotional connections that residents form with their environment (Nasar, 1990; Rapoport, 1977). Moreover, the identity of individual places shapes, and is shaped by, the broader spatial structure, which in turn generates new meanings and influences local identities, for example, Appleyard (1980) argued that well-designed neighborhoods not only reflect but also reinforce the unique character of places, thereby continuously shaping and reshaping their identity within the urban fabric. Thus, identity, structure, and meaning are dynamic and interrelated, continually redefining how places are perceived and experienced. First, meaning adds an additional layer to the identity of a specific place. A place’s distinctiveness is shaped not only by its physical form and visual characteristics but also by the collective social and cultural understanding attached to it (Bhattacharya et al., 2020; Brand, 1995; Carmona, 2021; Nasar, 1990). Neglecting meaning of imageability risks overlooking the full spectrum of what makes a place distinctive. Second, meaning enriches the overall structure of city by adding significance, making it more tangible and multifaceted.
Potential of the online text dataset and LLMs
Recent studies have advanced Lynch’s cognitive map approach by integrating GIS-based analyses and machine learning techniques. For instance, researchers have employed high-resolution spatial data and computational methods to generate detailed maps of urban imageability, quantifying the physical aspects of cities (Filomena et al., 2019; Jang and Kim, 2019; Jiao et al., 2018; Liu et al., 2016; Morello and Ratti, 2009). Other work has leveraged Natural Language Processing (NLP) and computer vision to extract urban features from social media and street view imagery (Huang et al., 2021; Pistola et al., 2022). These approaches have significantly enhanced our understanding of urban structure and identity. However, despite these advances, the “meaning” component—capturing social and cultural dimensions—remains underexplored due to its intangible nature. Although studies such as Jang et al. (2024) hint at integrating advance semantic analyses into place identity study, they also acknowledged that comprehensive frameworks that fully incorporate meaning of places are still facing challenges.
Moreover, in the increasingly complex urban context, the way people perceive the city has fundamentally changed, especially with the wide usage of digital devices and the vast amount of online information (Batty, 2023). Understanding imageability requires addressing not only physical elements but also intangible aspects such as the meaning people attribute to spaces. This ambiguity and changing context need a broader and systematic approach to studying how cities are perceived, one that incorporates both tangible and intangible factors.
Encouragingly, the rise of online platforms and user-generated content has paved new way for examining urban environment (Fu et al., 2024; Liang et al., 2024; Yang and Zhang, 2024). Online reviews, such as those on Google Maps or TripAdvisor, offer detailed insights into how people perceive places (Mathayomchan and Taecharungroj, 2020; Song et al., 2021). Compared to the visual data, such as street view imagery (Pistola et al., 2022) and social media photos (Huang et al., 2021), online reviews offer rich qualitative data that reveal how individuals consciously articulate their experiences, perceptions, and emotional connections to places. These narratives provide access to aspects of meaning that are not always visually observable—such as historical significance, social atmosphere, or personal nostalgia—which play a crucial role in shaping imageability (Lynch, 1960; Nasar, 1990). Therefore, online reviews represent a rich and largely untapped resource for studying the meaning of places (Jang and Kim, 2019; Jiao et al., 2018).
Simultaneously, advances in NLP technologies, particularly Large Language Models (LLMs), enable the analysis of vast amounts of text data in a more structured way (Fu, 2024; Jang et al., 2024; Zhang et al., 2022). By employing LLMs, researchers can efficiently extract relevant themes and sentiments from online reviews, allowing for a deeper exploration of the abstract and experiential dimensions of urban spaces such as their meanings (Jang et al., 2024). For instance, Blečić et al. (2024) adds linguistic qualitative insights extracted by LLMs to the walkability scores by consider the broader urban context. Mathayomchan and Taecharungroj (2020) explains the reason for the popularity of some restaurants by analyzing their reviews using LLM. Moreover, fine-tuning LLMs has also been highlighted as a crucial step for specific research purposes like extracting the meaning in imageability, to improve accuracy and reduce computational cost (Zhang et al., 2022).
Research question
Building on the existing literature, a research gap remains in fully understanding the role of meaning in imageability, particularly in capturing the intangible aspects of meaning, such as cultural narratives, collective memory, and emotional resonance, in the context of the widespread use of online information. To address this gap, this study poses the following research question: What are the different dimensions of meaning in imageability in the digital era, and how does the meaning of places influence the imageability of the urban environment?
By revisiting Lynch’s tri-components model and incorporating recent advancements in textual data collection and analysis, this research aims to answer the research question and provide a more comprehensive understanding of imageability and contribute to a more nuanced cognitive mapping of the city. While cognitive maps reside within individuals’ minds, they are informed by collective evaluations and shared perceptions of urban spaces. This study does not directly observe internal cognitive maps, but instead captures their manifestations in user-generated reviews.
Methods
The case study and data sources
This research uses Singapore as a case study (Figure S2 in Supplemental Document) and Google Maps Review (GMR) dataset as the main data source to analyze the meaning of all the places (a place refers to a point data on Google Maps) for four key reasons: (1) It has plenty of diverse and lively public spaces, which allows the possibility to acquire rich and distinctive meanings. (2) It is a densely populated, modern city with widespread information technology usage that is suitable for research using online platform data. (3) Google Maps is widely utilized in the Singapore (Statistics, 2022), generating a large volume of reviews. It stands out as a widely used platform that contains detailed information of urban places (Yang and Liu, 2022; Yang and Zhang, 2024). The reviews available on Google Maps offer valuable insights into public perceptions and opinions about places (Mathayomchan and Taecharungroj, 2020; Yang and Zhang, 2024). (4) The high literacy rate makes it efficient for the analysis and interpretation of raw data (Richards and Tunçer, 2018), especially for the complexity in the study of meaning.
Research design
Figure 1 illustrates the workflow of this research involving four steps: (1) Data collection. (2) Identification of imageability meaning categories (IMCs). (3) Fine-tuning model for IMCs scoring. (4) Calculation and visualization. Detailed illustration of methods could be found in Detailed Steps of Research Design Section in Supplemental Document. Workflow of this research involving four steps.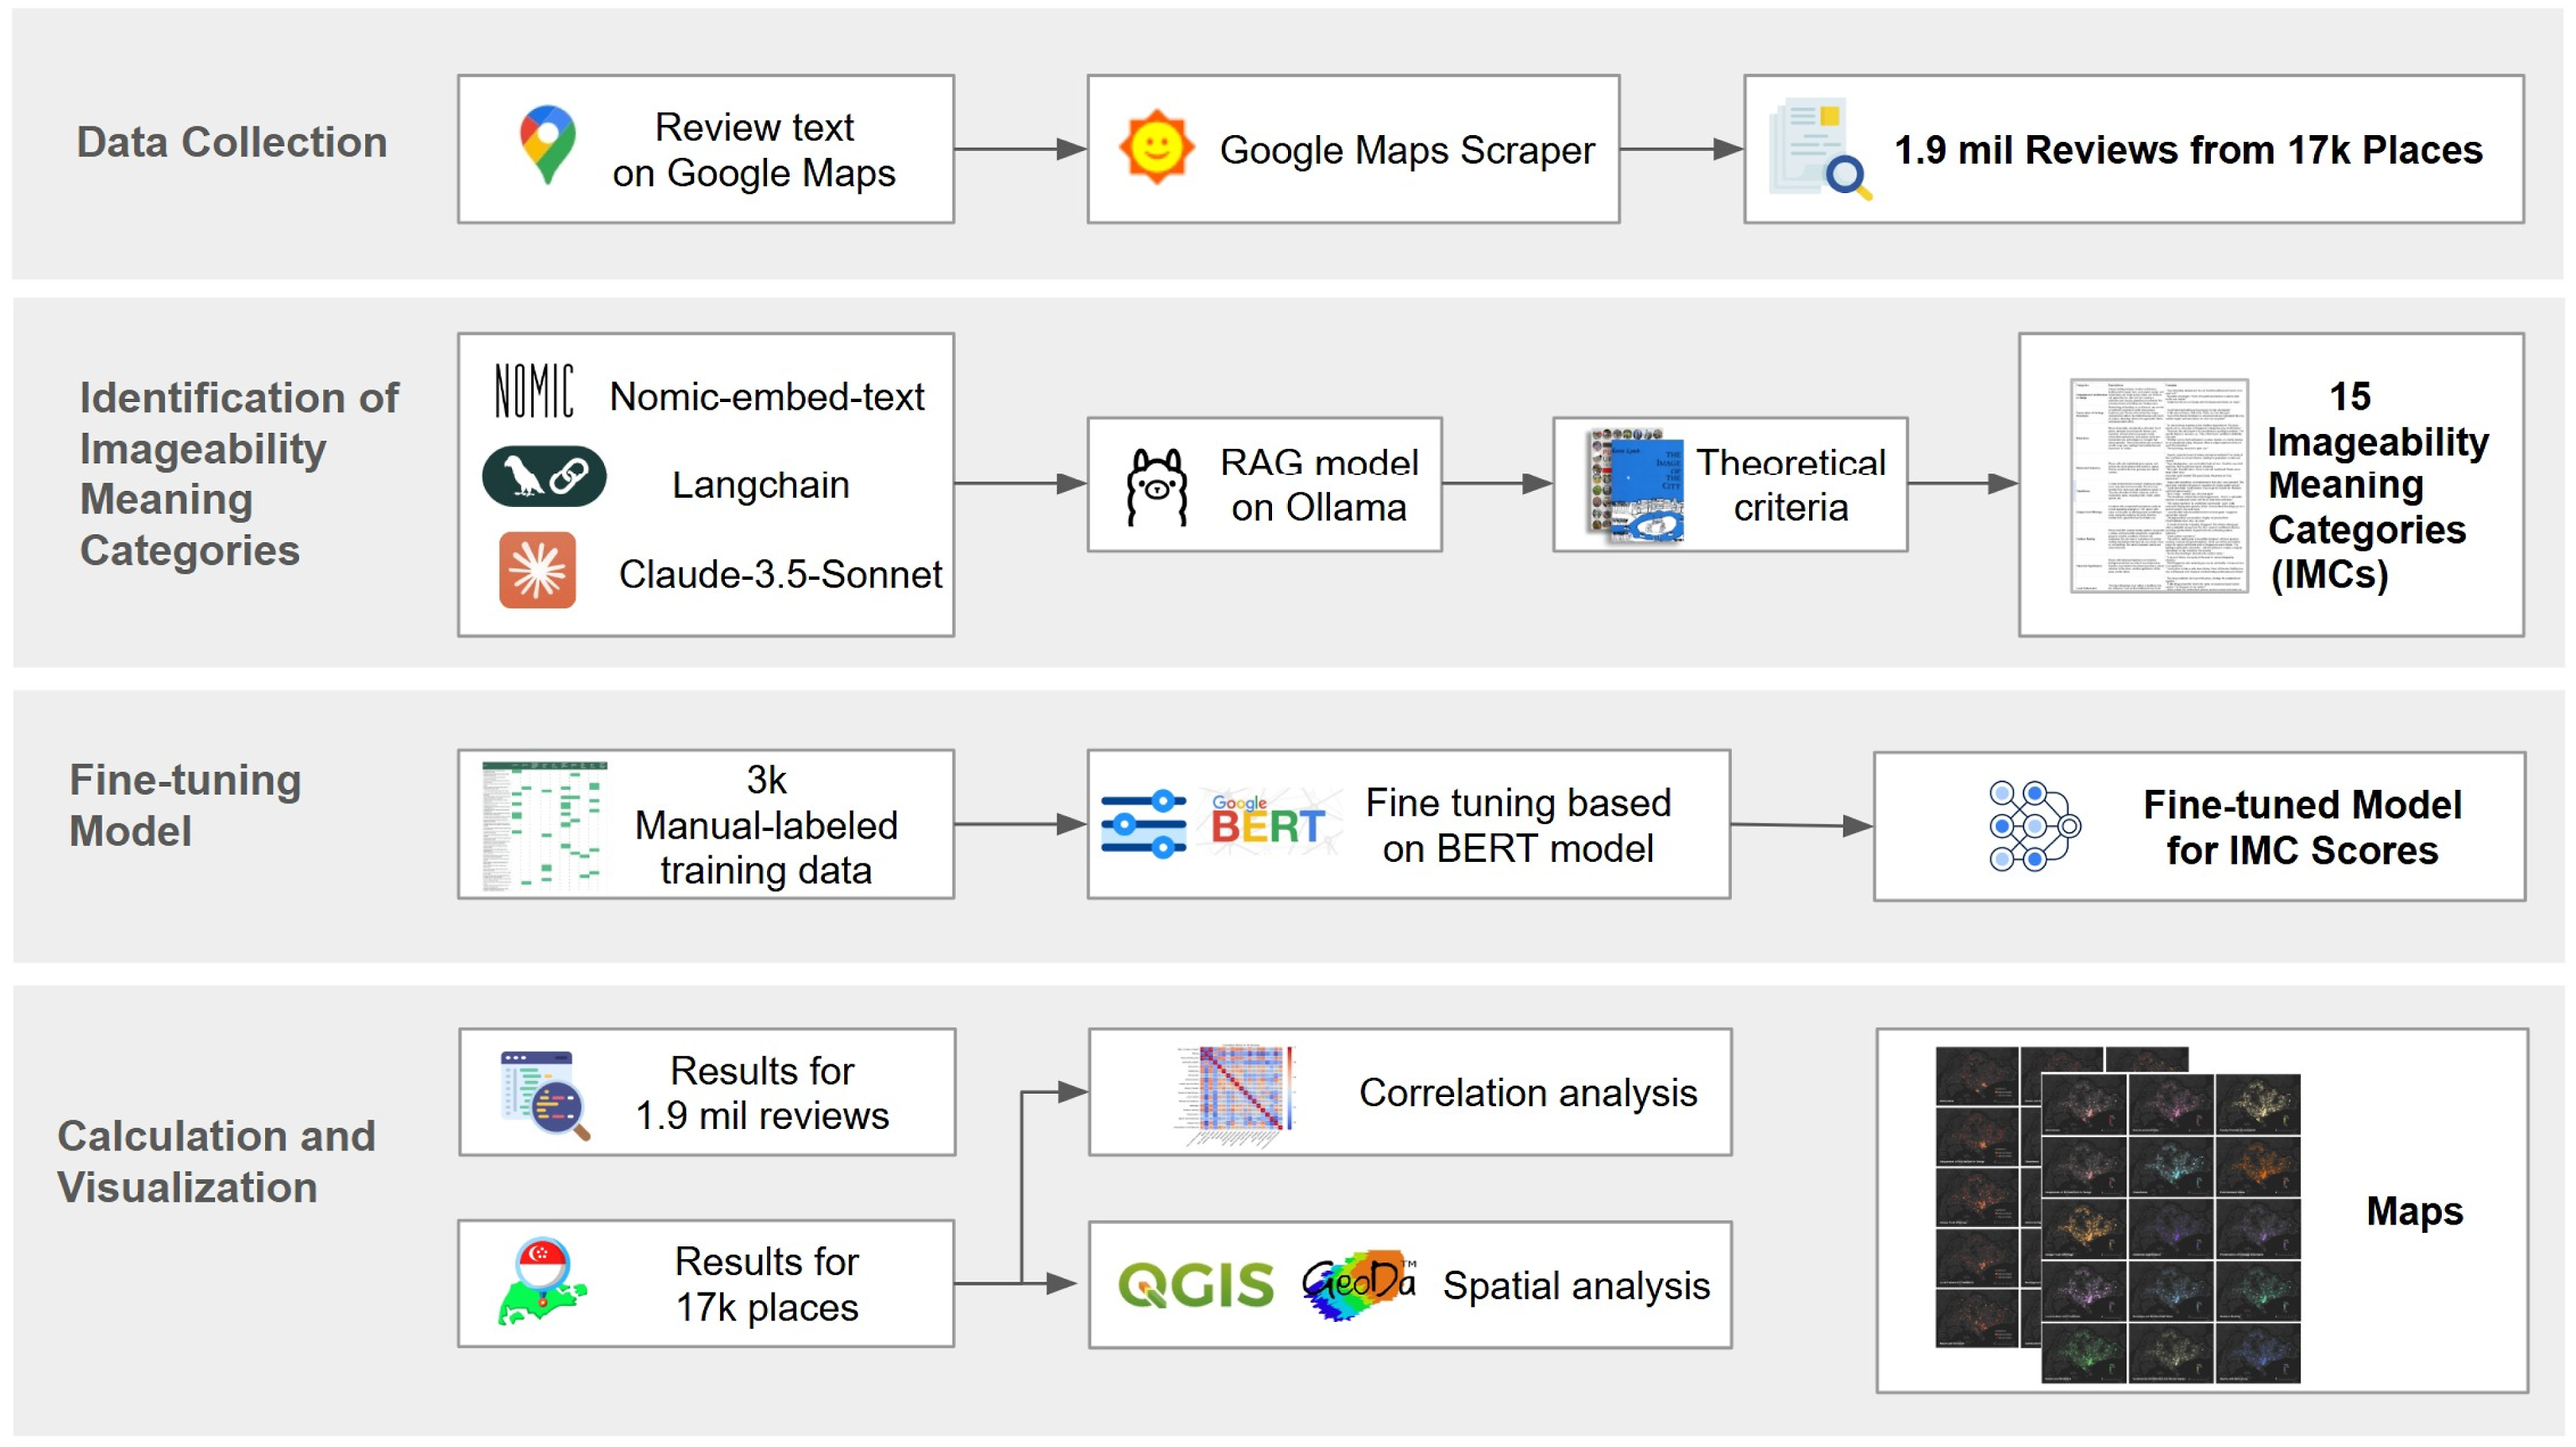
Data collection
GMR data within the boundary of Singapore was collected. An open-source script (omkarcloud, 2024) was modified to facilitate this data collection process. After consolidating, the GMR dataset was prepared, comprising approximately 1.879 million reviews across 17,201 places.
Identification of IMCs
In the second step, the meanings associated with places were identified and extracted from the collected dataset using a Retrieval-Augmented Generation (RAG) model (Lewis et al., 2020; Salemi and Zamani, 2024; Wang et al., 2024). Instead of topic modeling, this study selected RAG as it can retrieve particular information from the collected GMR dataset to ensure the factual, contextually relevant response. Therefore, it significantly reduces the risk of fabricated information, namely, the issue of “hallucination” (Bang et al., 2023; Liang et al., 2024), that could distort the meanings of places in Singapore. This process yielded approximately 35 themes from all places in the collected dataset (Table S2 in Supplemental Document).
However, not all 35 themes were eligible as “meaning” attached to places. According to the definition in Introduction section, a meaning must influence a place while simultaneously creating a vivid mental image in the observer’s mind. This image is not an abstract diagram but rather a clear representation of the place’s identity and character (Lynch, 1960). For instance, the presence of physical elements such as facilities in a playground can evoke specific mental images related to activity and vitality like kids-playing or family-gathering. On the contrary, factors such as “value for money,” “speed of service,” and “consistency and reliability” are not considered contributors to imageability. Although they may affect the popularity and functionality of a place, they remain abstract concepts and lack the capacity to create a distinctive and memorable mental image.
Therefore, a theoretical criteria for meanings in imageability was that it must be place-based (Oteros-Rozas et al., 2015), and for the themes that are satisfied with this criteria, this research named them as the imageability meaning categories (hereafter referred to as IMCs). After filtering, there were 15 IMCs identified from the GMR dataset (Figure 2). Definitions of 15 IMCs. Abbreviations for each term are in brackets and will be used later in the text.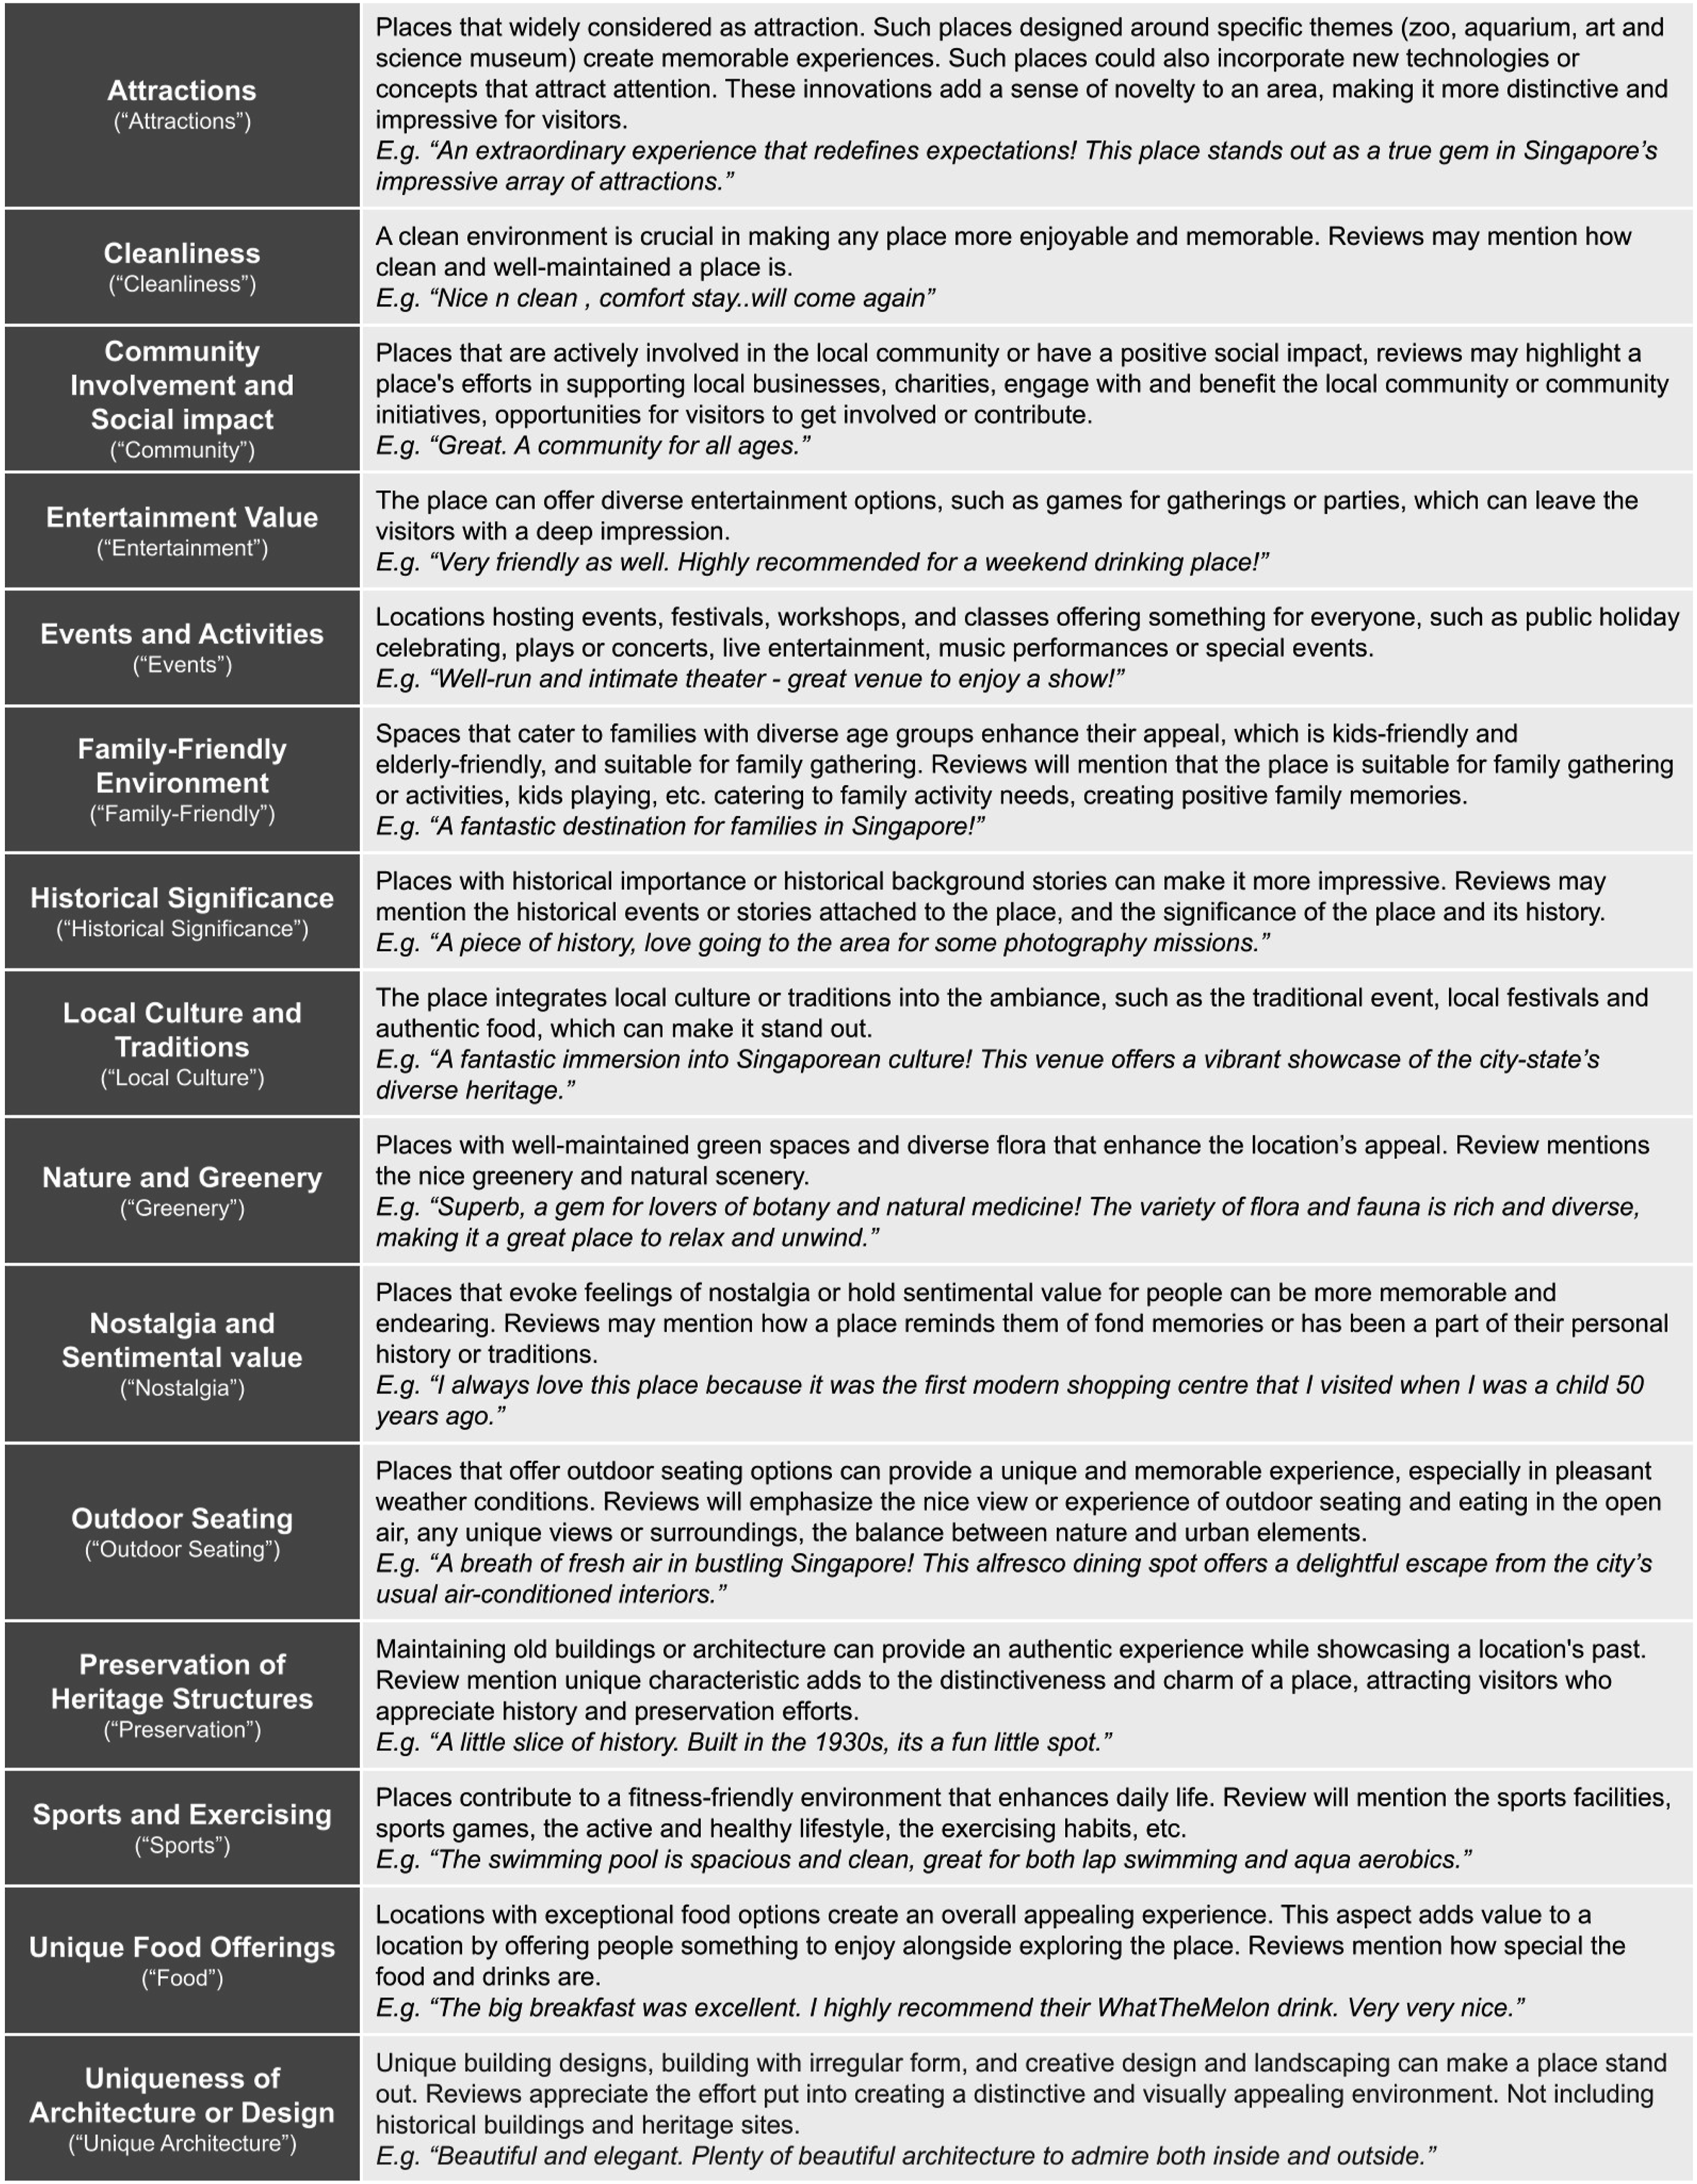
Fine-tuning model for IMC scoring
To score the likelihood of a review belonged to one or more of the 15 IMCs, a specialized text classification model was fine-tuned. First, a training dataset was created by querying 3,000 review texts from the GMR dataset using the RAG model. Two researchers of this research manually labeled these reviews according to the 15 IMCs (Figure S4 in Supplemental Document). A sample size of 3,000 training data can capture sufficient variation across the 15 IMCs while maintaining the feasibility of manual labeling and model training (Edwards and Camacho-Collados, 2024). Second, the “bert-base-uncased” model was selected for fine-tuning due to BERT’s strong performance in text semantic classification tasks. As a result, a specialized model was trained to predict the likelihood of each review falling into one or more of the 15 IMCs.
IMC scores calculation and visualization
The 1.879 million review texts were then analyzed by the fine-tuned model. The model scored each review according to their relevance to the 15 IMCs, ranging from 0.0 to 1.0. The 15 IMC scores for each place were then aggregated by summing the scores of all reviews associated with the place. This aggregation took into account the number of reviews per place, as the popularity of a location is a key indicator of its imageability (Ewing and Clemente, 2013; Huang et al., 2021). In addition, the sentiment of each review was analyzed using the open-source sentiment analysis model VADER (Hutto and Gilbert, 2014). For each place, the overall VADER sentiment score was calculated as the mean of all review sentiments for that location. As a result, both the IMC scores and sentiment scores were calculated for all 17,201 places.
Subsequently, it was crucial to examine the relationship between IMC scores, sentiment, number of reviews, and ratings for capturing how different IMCs are interconnected, and how they influence place’s popularity and sentiment. Therefore, Spearman correlation was used to assess the relationships.
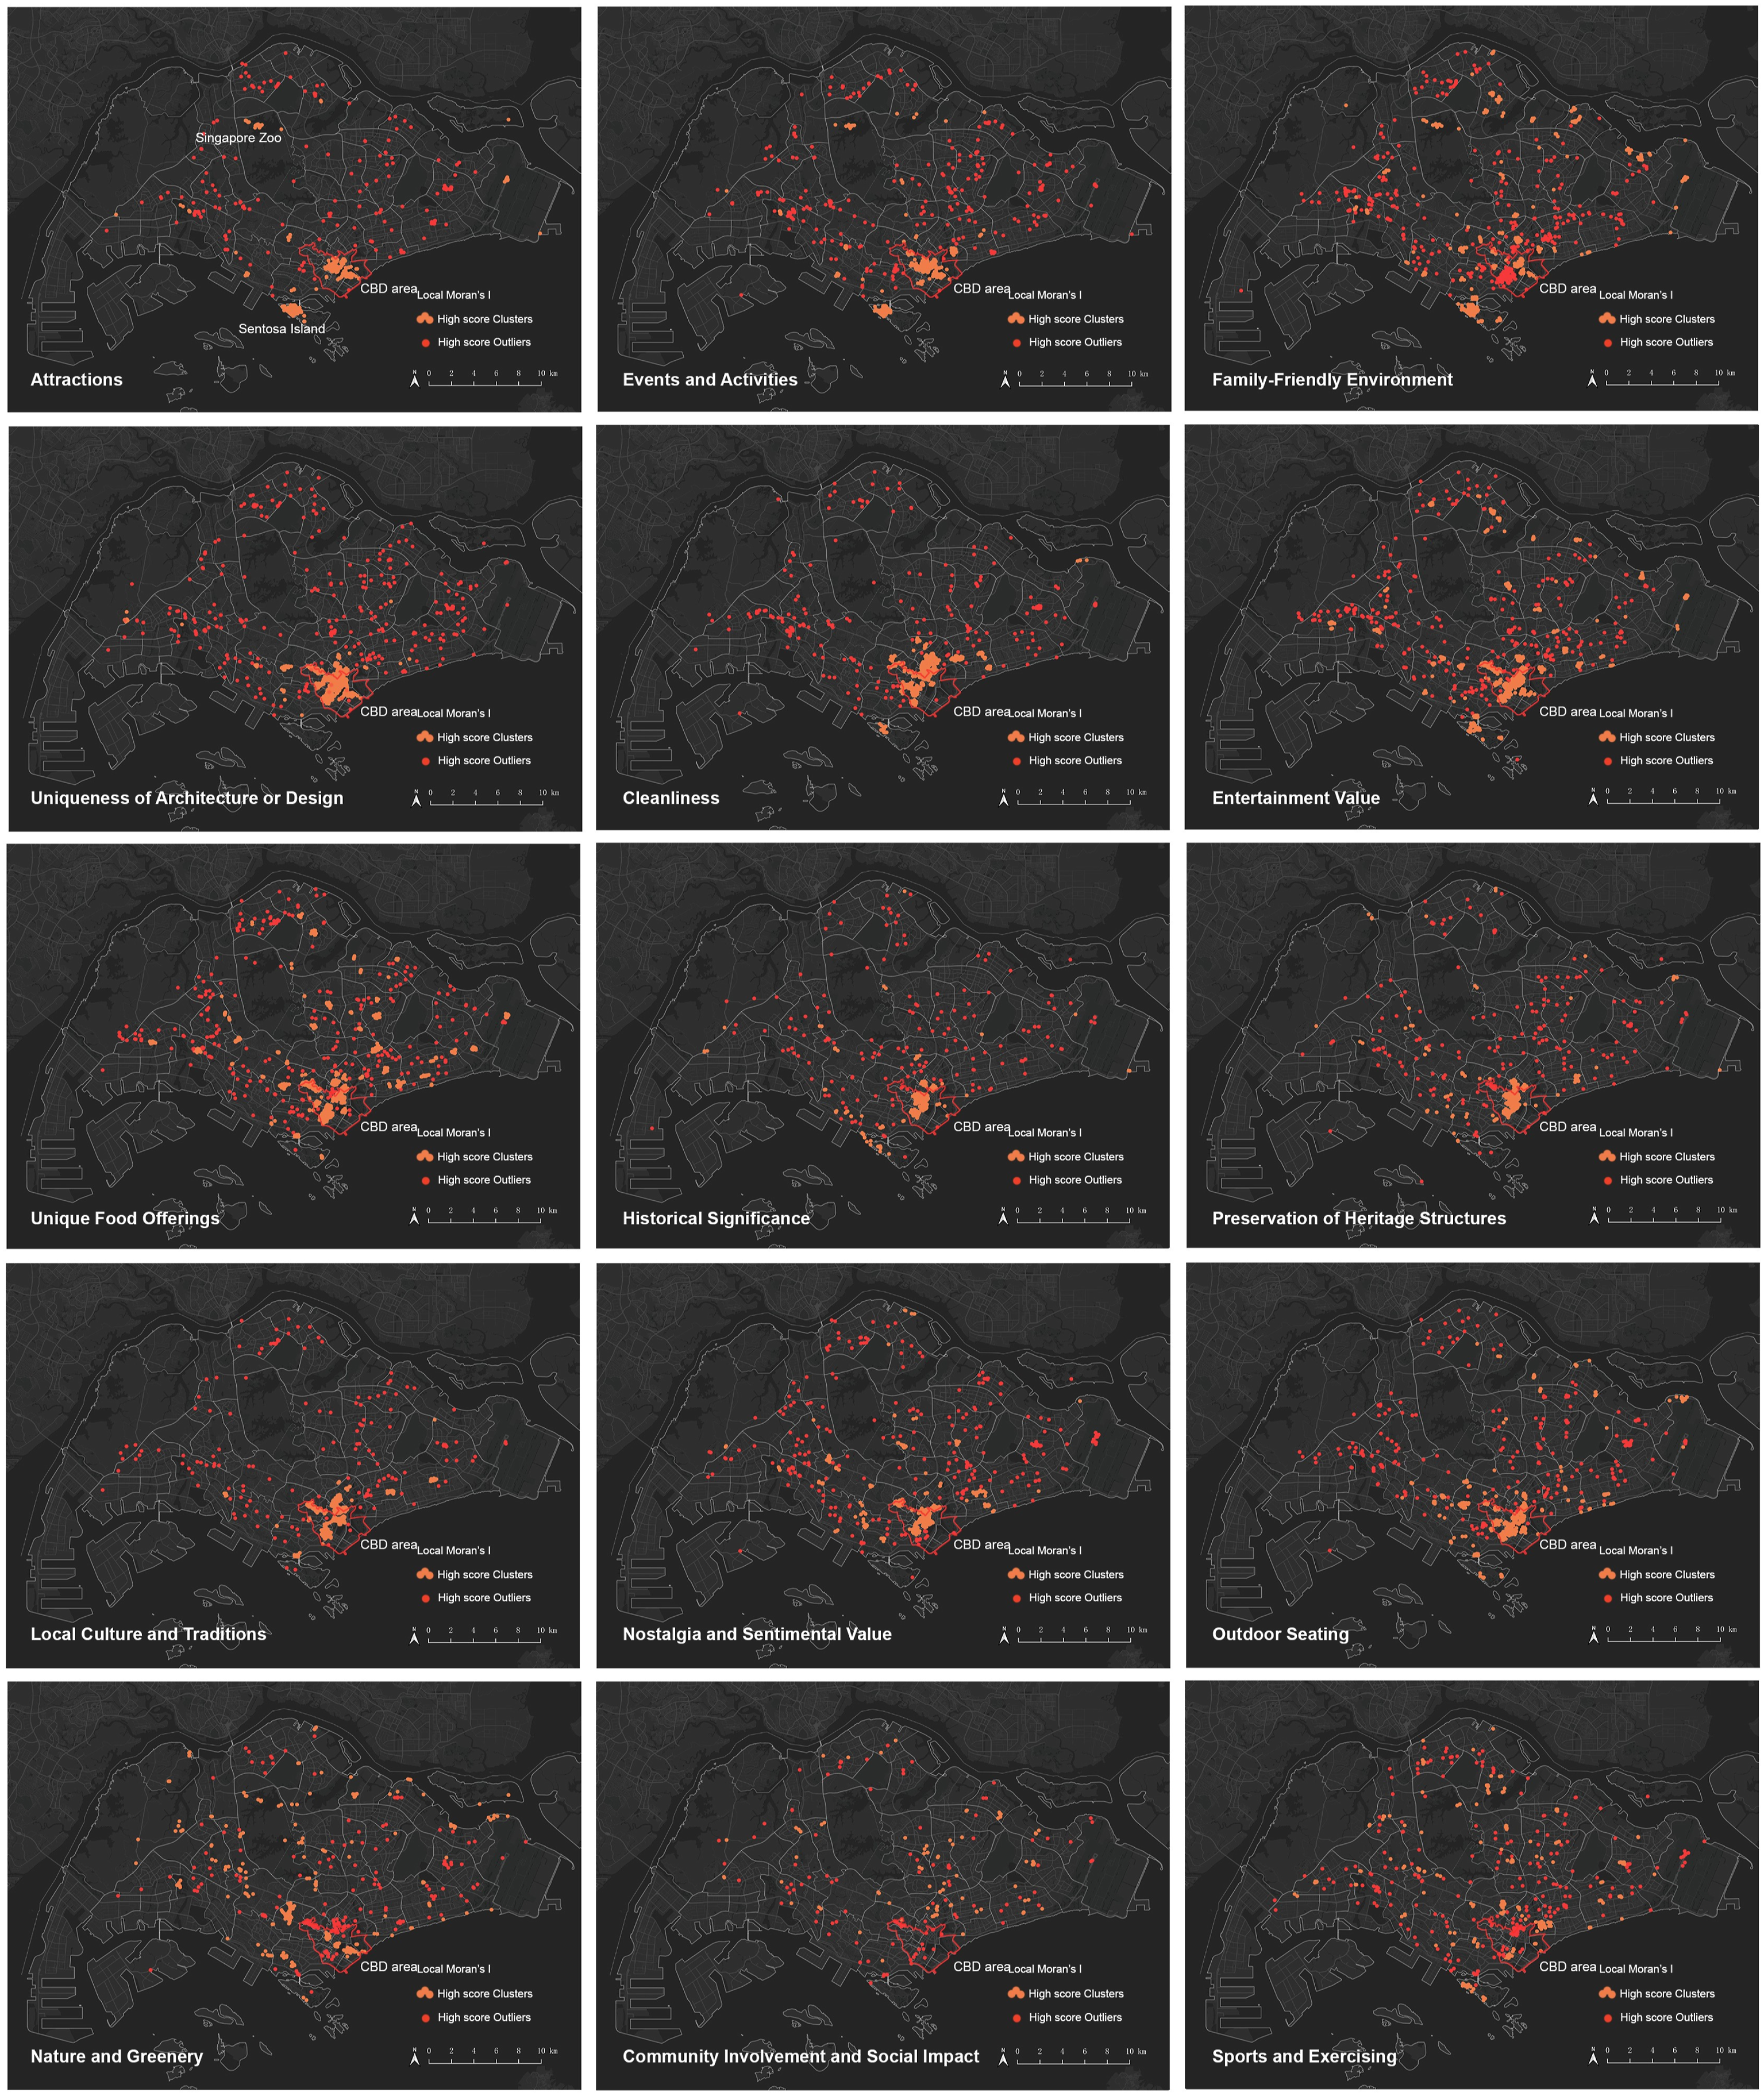
As the meaning is related to not only individual place but also the structure of image of the city (as discussed in Introduction section), it is significant to analyze the spatial distribution of IMCs. Therefore, the distribution of the 15 IMCs were mapped using QGIS (qgis, 2024). Additionally, spatial clustering are widely used in cognitive map studies to explore spatial patterns (Huang et al., 2021; Liu et al., 2016). Therefore, Local Moran’s I was calculated for each IMC using GeoDa (GeoDa, 2024), enabling the identification of spatial clusters and outliers.
Results
Definitions and descriptive statistics of 15 IMCs
Figure 2 presents the 15 IMCs along with their descriptions and abbreviations, more detailed examples are provided in Table S1 in Supplemental Document.
These IMCs provide valuable insights into why the public perceives certain places in Singapore as imageable, as they align with established theories regarding imageability. For instance, “Uniqueness Architecture”, “Preservation”, and “Greenery” highlight the role of distinctive physical features in shaping urban perception, which has been extensively discussed in studies (Ewing and Clemente, 2013; Huang et al., 2021; Nasar, 1990). Particularly, Nasar (1990) mentioned that these elements could enhance “visual complexity” and “coherence”, which contribute to an area’s memorability and appeal.
Beyond physical attributes, categories such as “Historical Significance”, “Events”, and “Community” underscore the experiential and socio-cultural factors that shape public perception of urban spaces. These align with Relph (1976)’s notion of place identity, which extends beyond visual recognition to include cultural and emotional associations. Additionally, categories such as “Cleanliness”, “Food”, “Entertainment”, and “Nostalgia” represent dimensions of imageability that are less commonly captured in visual analyses but play a crucial role in shaping urban experience. Cleanliness, for example, has been linked to perceptions of legibility (Lynch, 1960) and coherence (Nasar, 1990) as a key role in well-maintained urban settings, while nostalgia and sentimental value align with the growing body of research on emotional place attachment (Scannell and Gifford, 2010). The unique food in a place could be regarded as a symbol of local culture that affect the public understanding and experience of a place (Zhang et al., 2020).
Descriptive statistics of calculation results of all places.
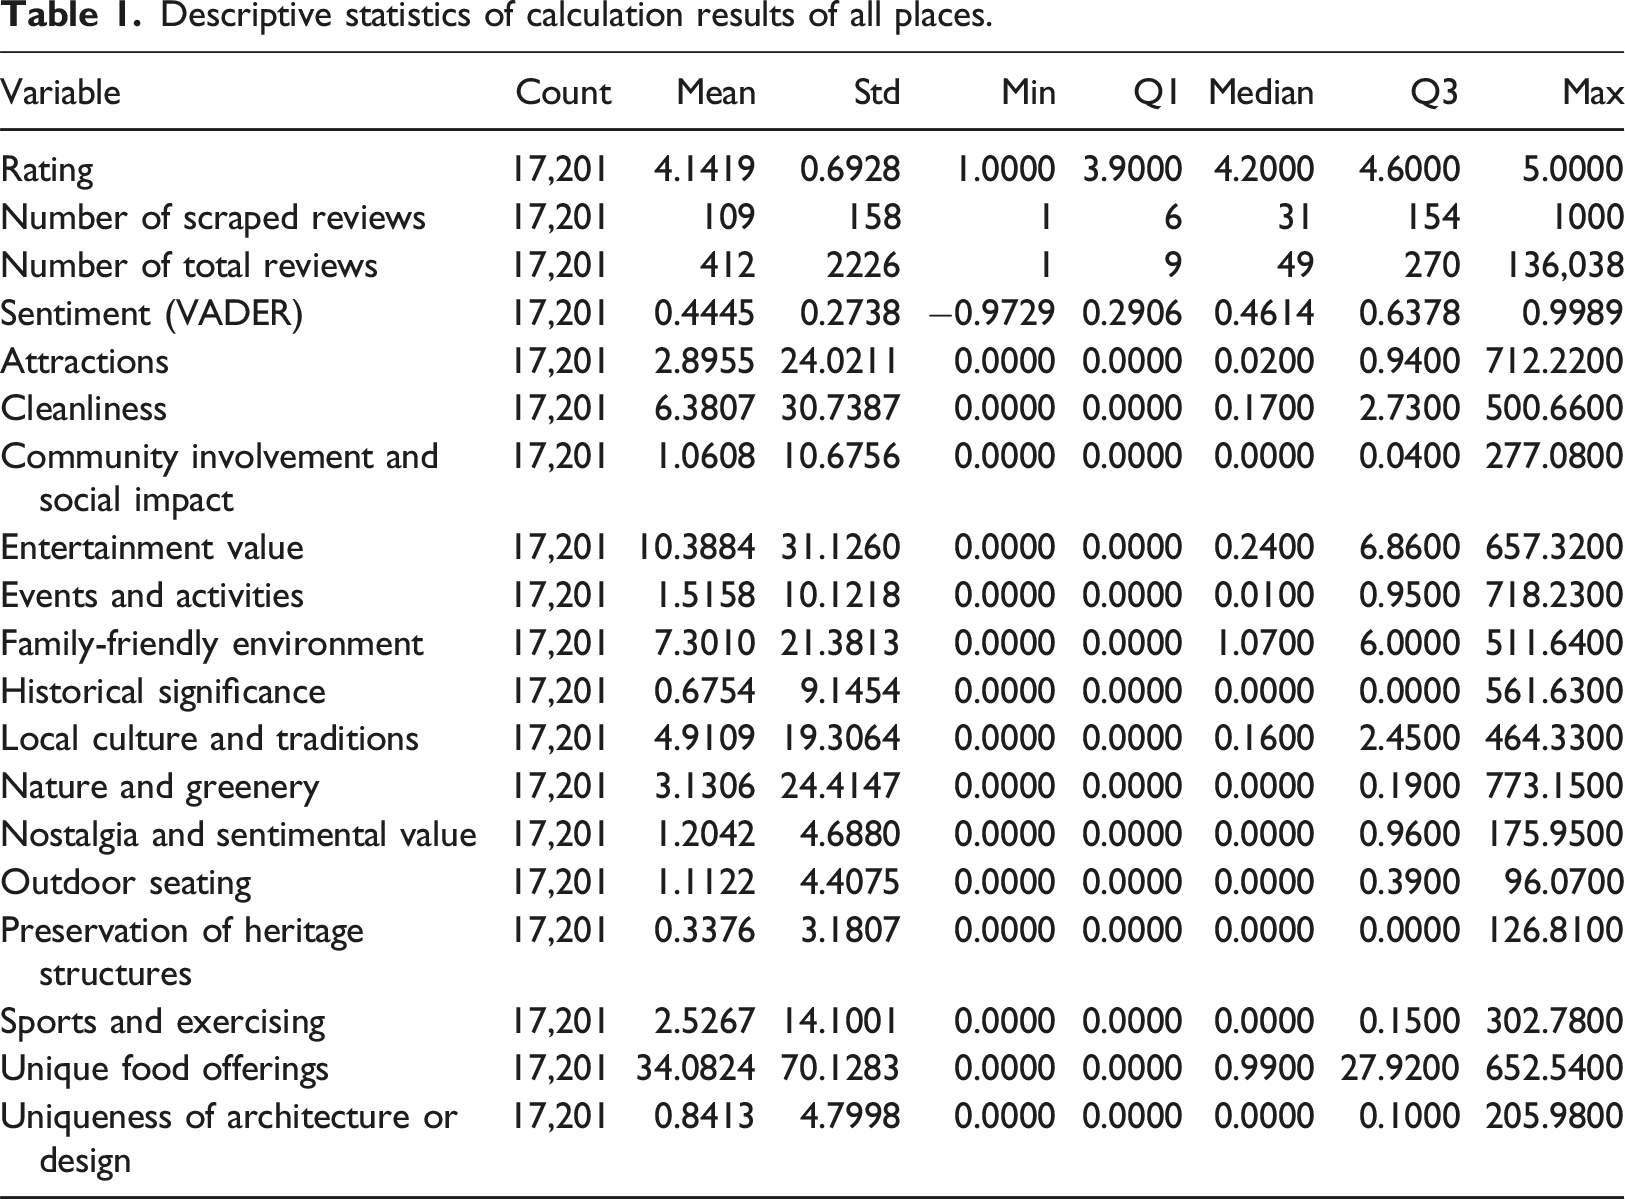
The 15 IMC scores exhibit significant statistical variation. “Food” has the highest mean score (34.08), exhibiting its significance in Singapore’s context and aligning with the dataset’s composition, where restaurants account for 27.5%, dominating in various place types. Its map shows the widest high-score distribution among the 15 maps (Figure 4). “Cleanliness” and “Entertainment” also stand out, with mean scores of 6.38 and 10.38, respectively, underscoring their importance in Singapore’s urban image. However, their high standard deviations (30.73 and 31.13) indicate considerable score variability. In contrast, “Historical Significance” and “Preservation” have much lower mean scores (0.68 and 0.34), with most places scoring 0, illustrating the concentration of these IMCs in a small number of places, which could also be seen in their distribution maps.
Correlation of the 15 IMCs between popularity, ratings, and sentiment
The Spearman correlation analysis reveals important insights into the relationships of the 15 IMCs across all the 17,201 places with their number of reviews, sentiment, and ratings (Figure 3). Correlation Matrix of the 15 IMCs, popularity, ratings, and sentiment.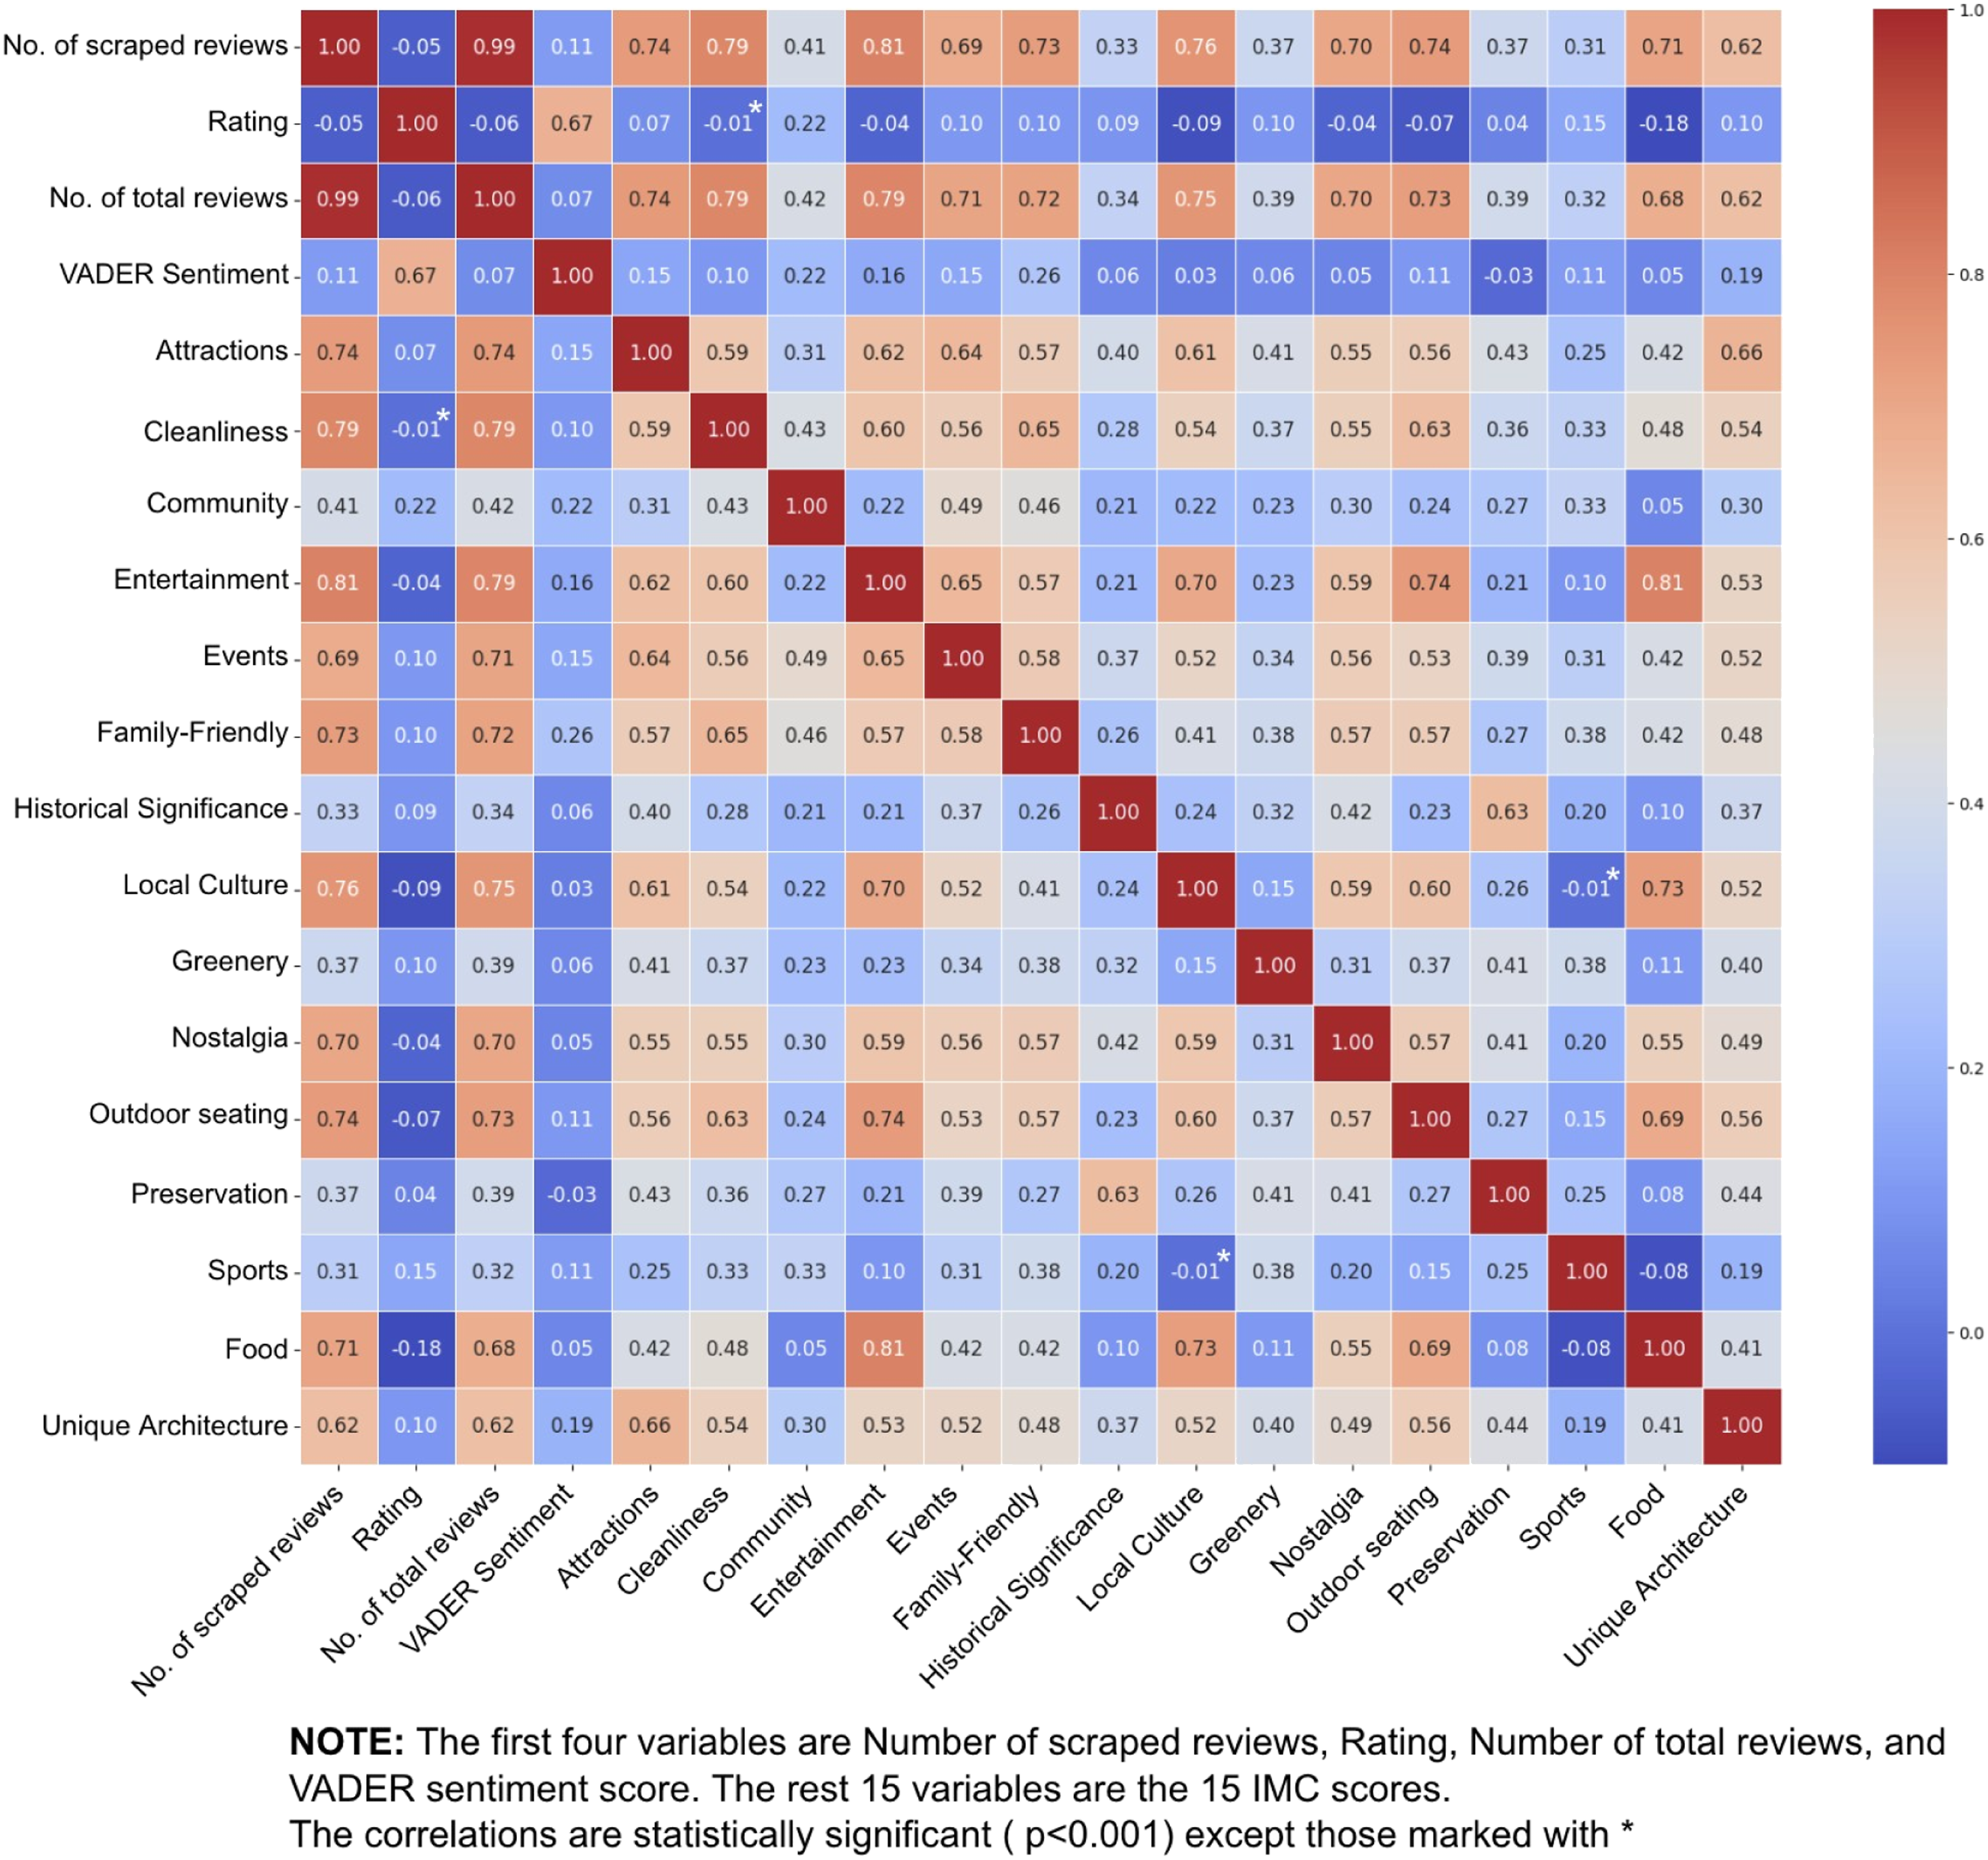
Popularity and IMCs
Since IMC score of one place inherently accounts for the number of its reviews in their calculation, the positive correlations between number of reviews and IMCs are expected. IMCs like “Attractions” (0.74), “Cleanliness” (0.79), and “Entertainment” (0.81) exhibit particularly high correlations with the number of reviews, indicating that places ranked highly in these IMCs tend to attract a larger volume of public feedback. However, “Community” (0.41) and “Historical Significance” (0.33) have notably weaker correlations with number of reviews, suggesting that while these aspects are important for the overall imageability of a place, they do not generate as much public feedback.
Sentiment and IMCs
“Family-Friendly” (0.26), “Entertainment” (0.16), “Attractions” (0.15) and “Events” (0.15) show moderate correlations with VADER sentiment, indicating that places offering these attributes tend to evoke more positive emotional responses from the public. This pattern suggests that IMCs tied to recreational and social experiences play a significant role in shaping positive public sentiment. In contrast, IMCs like “Cleanliness” (0.10) and “Greenery” (0.06) show weaker correlations with sentiment, indicating that while these attributes are appreciated, they do not evoke strong emotional reactions. Moreover, “Historical Significance” (0.06) also exhibits relatively low correlations with sentiment.
Ratings and IMCs
IMCs like “Family-Friendly” (0.10), “Entertainment” (0.10), and “Community” (0.22) show moderate correlations with ratings, suggesting that public ratings are more influenced by experiential and social dimensions of urban spaces. In contrast, “Attractions” (0.07) and “Cleanliness” (−0.01) exhibit very weak correlations with ratings, despite being highly visible and important aspects of a place.
Clustering of IMCs and their spatial patterns
The Spearman correlations among the 15 IMCs reveal three distinct clusters, defined by strong positive correlations (coefficient>0.6) between specific IMCs. The first cluster groups IMCs related to core urban activity and tourism. The second cluster brings together experience-oriented IMCs such as “Food”, “Local Culture”, and “Outdoor Seating”. The third cluster comprises IMCs tied to heritage and functionality. These conceptual groupings are further illustrated by the distribution maps (Figure 4) and cluster maps (Figure 5), which provide details where each cluster is most pronounced across the island. Maps indicating the spatial distribution of 15 IMC scores across all places. Stronger colored places mean higher scores; places with a score of zero are not displayed. The cluster maps of the 15 IMCs. The clusters of high-score places are illustrated in orange, the outliers of the high-score places among the clusters of low-score places are illustrated in red.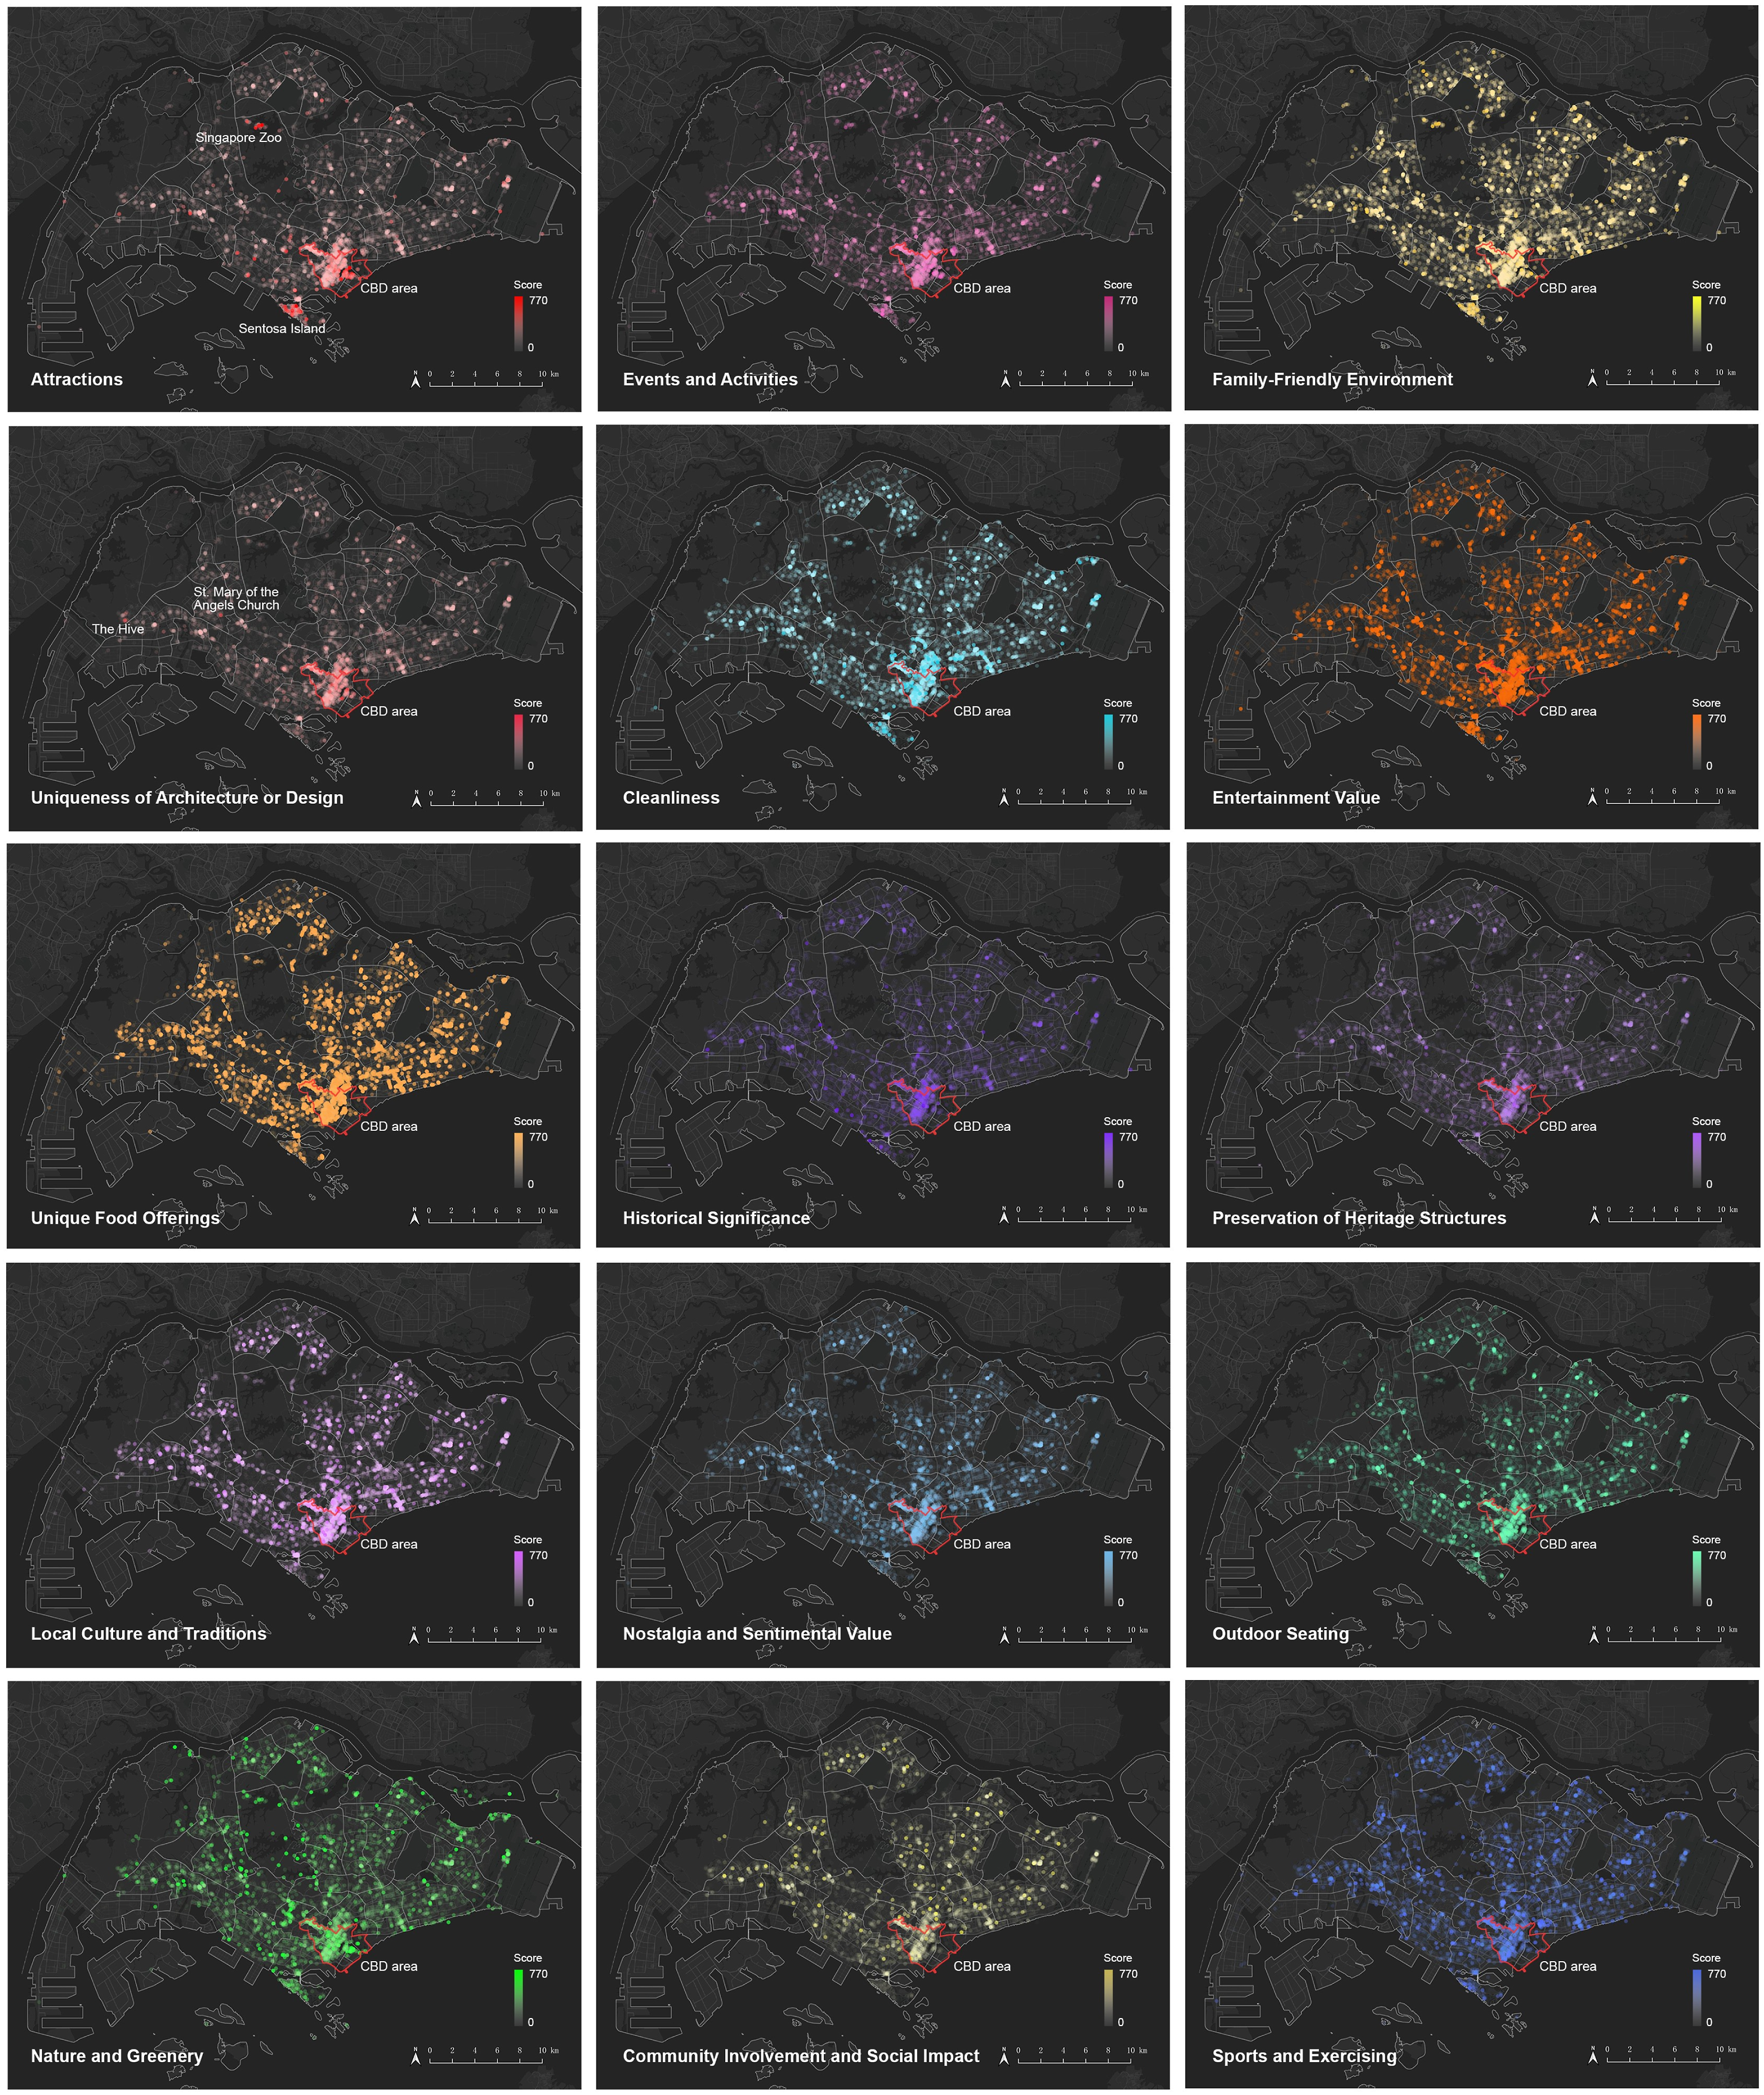
Core urban activity and tourism area
The first cluster includes “Attractions”, “Entertainment”, “Events and Activities” and “Unique Architecture”. Places rich in attractions tend to offer entertainment and events, enhancing their imageability. These IMCs, along with “Family-Friendly”, “Cleanliness” and “Food” share similar spatial patterns, concentrating in Sentosa Island and the CBD but also appearing across the island. However, cluster maps reveal nuances. For example, high-score areas for “Attractions”, “Events”, and “Entertainment” concentrate in hotspots like Downtown, Sentosa, and Singapore Zoo. In contrast, high-scoring “Family-Friendly” places are isolated within low-score clusters in Downtown, suggesting a scattered distribution. The cluster for “Unique Architecture” is centered in the CBD, with a smaller cluster along Dempsey Road, known for its high-end restaurants and design-centric spaces. “Unique Architecture” outliers include iconic buildings like “The Hive” at NTU and lesser-known examples such as “St Mary of the Angels Church” in Bukit Batok (a residential area), recognized for their distinctive designs.
Food and local culture
“Food” correlates with “Entertainment” (0.81), “Local Culture” (0.73), and “Outdoor Seating” (0.69). These IMCs have the broadest spatial clusters, with major clusters in the CBD and smaller ones around food courts in residential neighborhoods. The “Cleanliness” cluster map aligns with the CBD, Sentosa, and Geylang, where hotels and restaurants dominate. However, food courts receive fewer reviews mentioning cleanliness, suggesting that food quality takes priority in these contexts. The distribution of “Outdoor Seating” overlaps with food and entertainment clusters, as it is often mentioned in reviews of restaurants, malls, or playgrounds. Local food also reflects cultural traditions, with the “Local Culture” clusters overlapping with, but fewer than, those of “Food”. This IMC captures collective memories and shared cultural experiences, while “Nostalgia” focuses on personal emotions, forming clusters in residential areas.
Historical and function-specific meanings
“Historical Significance” and “Preservation” are closely aligned (0.63) and concentrated in the CBD, where many historical buildings are located. “Historical Significance” also shows a small cluster in Sentosa, possibly due to attractions like “Images of Singapore LIVE”, which emphasize history without preserved buildings, explaining the absence of a heritage cluster there. Function-specific IMCs such as “Greenery”, “Community” and “Sports” reflect distinct patterns. “Greenery” clusters in Marina Bay and the Botanic Gardens, though fewer than expected given Singapore’s green spaces. This may result from limitations of point-based data for larger parks, as discussed in Limitation section. “Sports” clusters appear around the National Stadium and other planned sports facilities.
Discussion
Can meaning component enhance the cognitive map?
While Lynch’s original framework for cognitive map focused on elements like paths, edges, and landmarks, this research demonstrates how meaning could represent the way people perceive urban environments and enhance the five elements of imageability in two ways:
First, for the landmarks or nodes that defined by their physical characteristics, their meanings amplify their distinctiveness by adding more social and cultural significance. Figure 6 presents an example of Orchard Road area in Singapore, a renowned shopping street full of various shopping malls. Among them, the Tangs Orchard is one of the most iconic shopping malls on the road (Yeung and Savage, 1996). The unique “pagoda-style” building design makes it visually impressive. Meanwhile, IMCs like “Entertainment” and “Food” add further meanings, and it also have nostalgia value to the locals as it was founded in 1930s. These meanings strengthen Tangs Orchard’s imageability beyond its physical characteristics, making it a prominent landmark in the area for decades. Example of meaning patches in Orchard Road.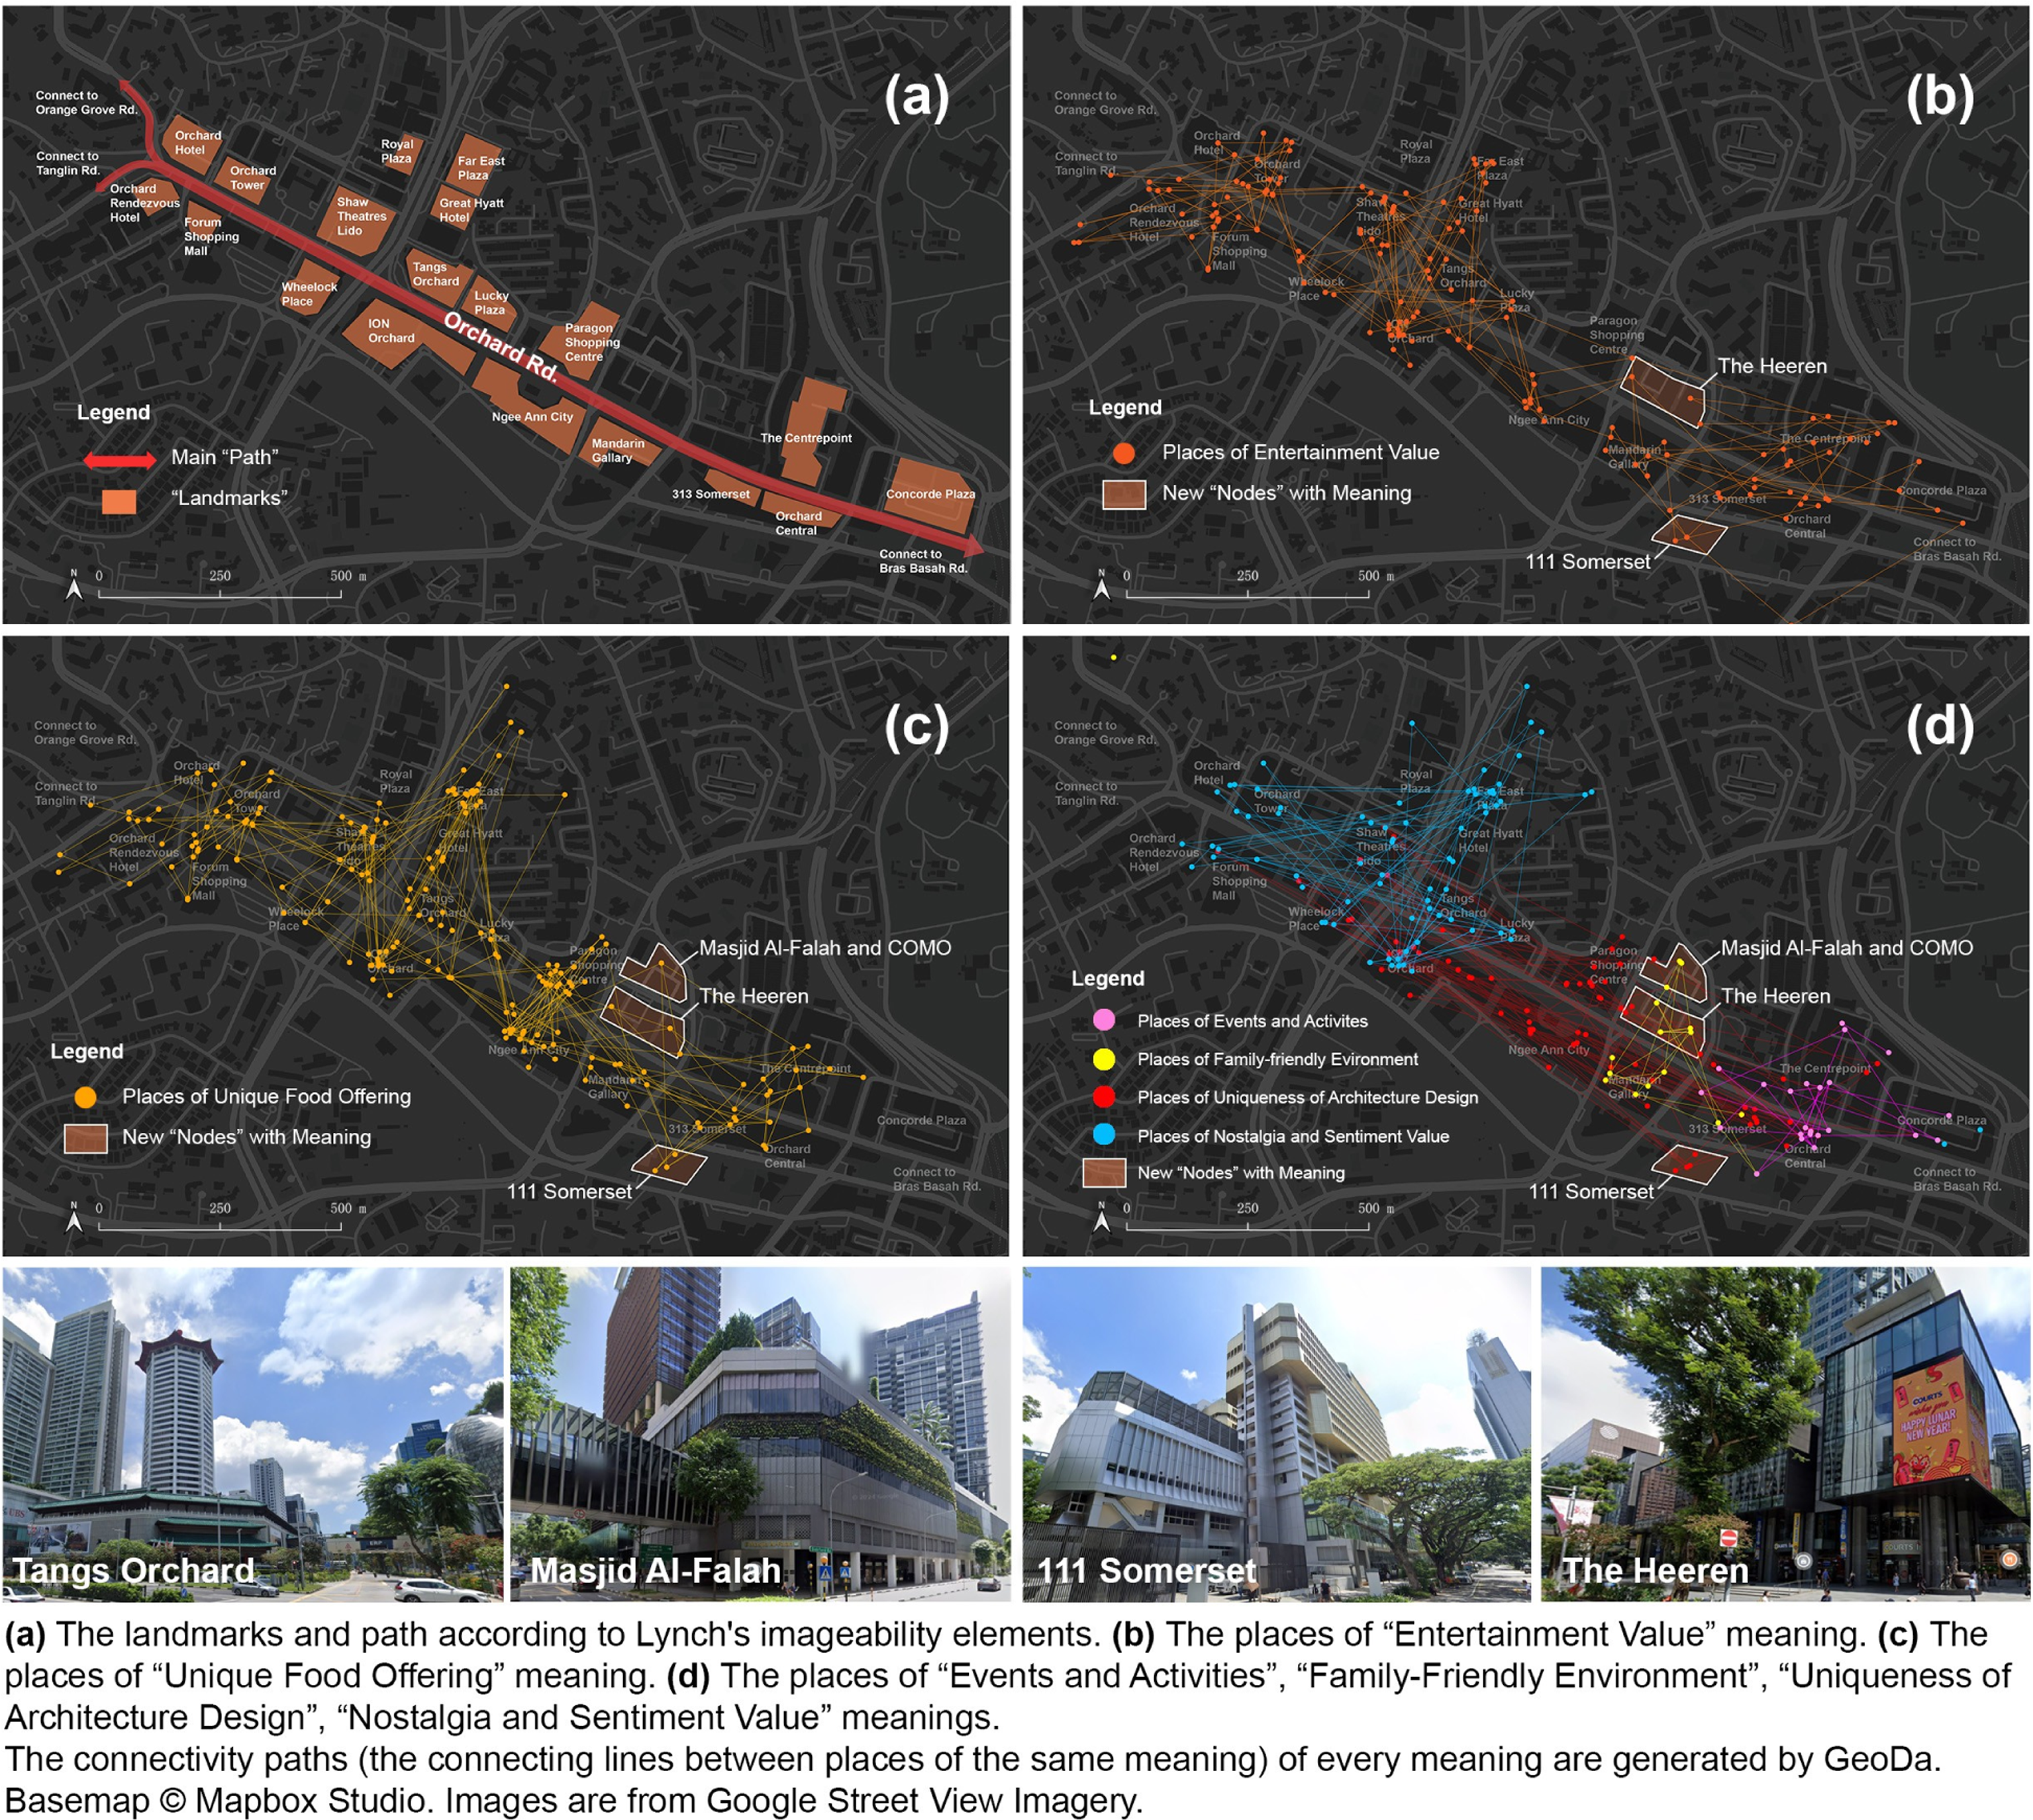
Second, certain IMCs—like “Food”, “Local Culture”, “Nostalgia”, “Family-Friendly”, etc.—could make new imageable “nodes” emerge, the physical setting of these “nodes” may not be impressive, but they have rich meaning. For example, The Heeren and 111 Somerset may not be distinctive among various shopping malls along Orchard Road, while their meaning of “Food” and “Entertainment” strengthened their imageability. These places may not be physical landmarks, but they function as mental “node” because of their cultural and social relevance.
“Meaning patch” as a sixth element of the image of the city?
Spatial clusters of IMCs identified across Singapore reinforce the imageability in certain areas. IMCs like “Attractions”, “Entertainment” and “Events” form concentrated clusters in key areas such as the CBD area and Sentosa Island (Figure 5 and S3 in Supplemental Document), serving as focal points for both locals and tourists, reinforcing their imageability through prominent cultural and recreational activities (Tng, 2021; Yu et al., 2022). Meanwhile, the more dispersed clusters associated with “Nostalgia” and “Local Culture” in residential neighborhoods emphasize the role of personal memories and collective experiences in shaping the urban images (DesignSingapore, 2021; McCunn and Gifford, 2021).
Based on the spatial clusters, this research proposes a new term “Meaning Patch”—the emerged clusters of places sharing the same meaning. These meaning patches function different from the “Path” or “District” in the original cognitive map, which emphasize the physical or visual similarity of an area. The meaning patch underscores the clustering of several places because of their shared meanings instead of their physical or geographical connections. For instance, in neighborhoods where “Nostalgia” or “Local Culture” form strong clusters, these patches represent places of emotional attachment or cultural resonance. An area like Chinatown in Singapore could be recognized as a district on a cognitive map; however, within it, several restaurants might constitute a “Food” meaning patch while certain shops form a “Local Culture” patch (Shircliff, 2020). Similarly, several parks or activity spaces in a residential area can emerge as meaning patches through collective memories linked to local events or personal experiences of the residents (Carmona, 2021; Song et al., 2020).
In Figure 6(a) and (c), “Entertainment” and “Food” form two strong patches across the entire Orchard road, the connections created by these two IMCs can transcend the physical barriers to evoke mental images of food or entertainment beyond their spatial connections. Moreover, in Figure 6(d), “Events”, “Family-Friendly”, “Unique Architecture” and “Nostalgia” diversify the meanings along different sections of the “Path”, enriching imageability of the entire area. While traditional cognitive maps might represent Orchard Road and its surroundings as a single “District”, the presence of six distinct meaning patches within the district illustrates a more nuanced, multi-layered urban image.
The meaning patch could be a critical element to understand how meaning contribute to the original cognitive maps by incorporating the interaction among “identity, structure, and meaning”. Besides the structure layer formed by the identity of several places within an area, the meaning patch adds new layers to urban structure by representing the shared meanings of multiple places. Meaning patches suggest that urban structure is not just defined by spatial connectivity or physical proximity and similarity but also by the cultural and emotional connections people have with certain areas (Ginzarly et al., 2019; Nasar, 1990). For example, areas with meaning patches of “Entertainment” or “Food” could influence the way people move through the city, as these spaces become informal landmarks in their mental maps (Zhang et al., 2020).
Therefore, the image of the city in this new era is not only represented by the cognitive map of the five elements that physically structured, but also possible to be influenced by the meaning patch. Further exploration of the meaning patch could offer valuable insights to expand upon Kevin Lynch’s framework, potentially introducing it as a sixth element in understanding the image of the city.
Strength of research method
By leveraging LLMs’ advanced text processing capabilities (Fu et al., 2024; Wei et al., 2024), this study fills the research gap by investigating the more abstract information like IMCs, partially validating the potential for extracting socially and culturally relevant insights from public reviews (Fu, 2024). This study introduces a novel pipeline includes the following: (1) Deriving the vast amount of review data which includes precise geographical coordinates, they allow for efficient spatial analysis, enabling the identification of spatial clusters that reflect public perceptions with a high degree of accuracy. (2) Building the RAG model maximized the capability of LLM for extracting the abstract aspects of imageability from the text data using a complicated structural prompt. (3) Using of a specifically fine-tuned model tailored to the IMCs enhances the accuracy of score inference. This method provides a solid base for exploring how individuals perceive and interact with various urban spaces, making the research method a powerful and replicable workflow for uncovering the intangible layers of urban perception.
Moreover, the method of this research offers the potential for further expansion. Each of the 15 IMCs can be unpacked in more detail, providing opportunities for more nuanced and refined insights for particular topics. For example, a further step of query what kind of local culture and traditions are focus by the reviews could provide more details answers like the traditional food “Chicken rice”, “Kopi” and the traditional festival “Hari Raya celebrations” (Bhattacharya et al., 2020). This flexibility allows for continuous exploration and deeper understanding of cities, beyond the initial findings in this study.
Limitation
This research has several limitations. First, although GMR is the most suitable data source for the case study, and this research has conducted careful examination to the collected dataset, the data quality on Google Maps can still be inconsistent due to the varying accuracy, depth, and reliability of user-generated content (Crooks and Chen, 2024; Yang and Zhang, 2024). Additionally, practical considerations, such as resource availability and data accessibility, limited this study to a single platform. Future studies could incorporate multi-modal data, including social media or survey data, to provide a more comprehensive and balanced understanding of public perceptions. Second, although the data from online platforms could capture the mainstream of public opinions, it may not fully represent the entire population. As such, traditional survey methods remain irreplaceable for capturing more representative and structured data across diverse user groups (Huang et al., 2021; Meenar et al., 2022), surveys like questionnaire or site observation could be used in subsequent studies. Finally, this research uses only of point data, which has shortfalls in representing large open spaces such as parks and nature reserves, limiting the accuracy and efficiency of capturing the “districts” and related spatial analysis. Clusters can hardly form in areas with extensive greenery, future research can enhance it by combining polygon data.
Conclusion
This research leverages on a massive online review dataset and LLMs to explore imageability of Singapore, analyzing 15 IMCs to uncover its imageability meaning. It makes two key contributions. First, the existing five elements of imageability could be strengthened by incorporating the meaning component. Adding meaning helps to make the current nodes or landmarks more prominent in the image of the city. Additionally, meaning can create new “nodes”—places that may not have been considered imageable before but gain prominence through their meanings. Second, the proposed “meaning patch” could add new layers to the structure of the city image. It represents the clusters of multiple places with shared meanings, forming cultural and emotional connections beyond spatial relations. The meaning patch has the potential to be explored as a sixth element in Lynch’s imageability framework, extending the current framework of imageability. It opens a new agenda for future research to further investigate how these patches reflect and influence the image of the city.
Besides, the research method introduces a new approach for using online text data and LLMs in urban studies, providing a valuable reference for future research, which can be scaled elsewhere due to the wide availability of data. Unlike traditional text-based methods such as topic modeling or word clouds (De Oliveira Capela and Ramirez-Marquez, 2019; Yu et al., 2022), the spatial analysis employed here offers a more comprehensive way to incorporate location-based insights into urban research, overcoming the limitations of purely textual analysis (Wang et al., 2023).
Future research could build on this research by incorporating additional data sources and multiple data types to enhance the depth of analysis. Survey methods could also be adapted to validate the results derived from online datasets. Besides, as the existing imageability research introduced methods to studying the image of the city by imagery data (Ma et al., 2021; Qiu et al., 2022), combining those image-based methods with the IMCs in this study could provide new perspectives. Finally, applying approach in this study to other cities would provide comparative insights in different contexts and broaden the scope of imageability research.
Supplemental Material
Supplemental Material - Unveiling the meaning in the image of the city: A novel approach using place reviews and large language models
Supplemental Material for Unveiling the meaning in the image of the city: A novel approach using place reviews and large language models by Yihan Zhu, Markus Brenken, Filip Biljecki, and Ye Zhang in Environment and Planning B: Urban Analytics and City Science
Footnotes
Funding
The authors disclosed receipt of the following financial support for the research, authorship, and publication of this article: This research is supported by (1) National Natural Science Foundation of China (Grant No. 20241710038); (2) the project Large-scale 3D geospatial data for urban analytics funded by the National University of Singapore; and (3) the RISE Worldwide programme of the German Academic Exchange Service (DAAD).
Declaration of conflicting interests
The authors declared no potential conflicts of interest with respect to the research, authorship, and/or publication of this article.
Data Availability Statement
Data sharing not applicable to this article as the dataset used by this study is not publicly available currently.
Supplemental Material
Supplemental material for this article is available online.
Author biographies
References
Supplementary Material
Please find the following supplemental material available below.
For Open Access articles published under a Creative Commons License, all supplemental material carries the same license as the article it is associated with.
For non-Open Access articles published, all supplemental material carries a non-exclusive license, and permission requests for re-use of supplemental material or any part of supplemental material shall be sent directly to the copyright owner as specified in the copyright notice associated with the article.