
Abstract
Planning for sustainable urban growth is a pressing challenge facing many cities. Investigating proposed changes to the built environment can provide planners and policymakers information to understand future urban development trends and related infrastructure requirements. It is in this context we have developed a novel urban analytics approach that utilises planning applications (PAs) data and Natural Language Processing (NLP) techniques to forecast the housing supply pipeline in Australia. Firstly, we implement a data processing pipeline which collects, geocodes, and filters PA data from local government websites and state planning portals to provide the first nationally available daily dataset of PAs that are currently under consideration. Secondly, we classify the collected PAs into four distinct urban development categories, selected based on the infrastructure planning and provisioning they require. We tested five model architectures and found that the fine-tuned DeBERTA-v3 model achieves the best performance with both accuracy and F1-score of 0.944. This demonstrates the suitability of fine-tuned Pre-trained Language Models (PLMs) in classifying PAs based on text in them. Finally, this model is applied to classify and map urban development trends in Australia’s two largest cities, Sydney and Melbourne across two time periods – between 2021 and 2022, and between 2023 and 2024. This mapping affirms a face-validation test of the classification model and demonstrates the utility of insights the generate for planning use case. Holistically, the paper demonstrates the potential for NLP to enrich urban analytics through the integration of previously inaccessible text data in planning applications into planning analysis and decisions.
Keywords
Introduction
Housing stress is a global problem, predicted by the World Bank to impact 1.6 billion people by 2025 (Caliyurt, 2022). In Australia, as in many other western countries such as the United States and United Kingdom, the financialization of housing, increases in net immigration, and unfavourable macroeconomic conditions have led to housing supply shortages (Phibbs and Gurran, 2021). Moreover, the provision of services and infrastructure to support new housing supply is often insufficient (Kellet and Nunnington, 2019). In recent years, the government has had a diminishing role in financing and building basic residential infrastructure such as roads, schools and hospitals, leaving greater responsibility for developers to design and manage these services in growth areas (Kellet and Nunnington, 2019). Resultingly, social and transport services are consistently undersupplied in new build Australian suburbs compared to established areas, leading to poor resident experiences (Gunn et al., 2020). The cumulative result of these concurrent factors has been inadequate supply of new housing and residential infrastructure in urban growth areas.
It is in this context that understanding the housing supply pipeline can provide valuable insights to planners around where and when new developments are occurring, and the infrastructure requirements for different types of urban developments. In this paper, we propose analysing Planning Applications (PAs) to understand Australia’s housing supply pipeline. PAs are an application process required for landowners to build new developments, subdivide land, or change the land use of a property (Murray, 2023). These applications are publicly available on planning portals and council websites, providing rich and freely accessible information on application dates, development descriptions, and estimated costs of potential developments. Similar application processes exist under different names in other international contexts, such as ‘building permits’ and ‘permitted development rights’ in the United States and United Kingdom, respectively (Fauth and Soibelman, 2022; Ferm et al., 2021). We propose an urban analytics approach to classify PAs into four distinct urban development categories (commercial development, new housing development, subdivision and land development, alterations and modifications) to help planners understand the types and distribution of property developments. These categories were selected from an infrastructure provisioning perspective to understand the planning implications and needs of different urban development types (Uddin et al., 2022).
This paper explores the potential for emerging NLP techniques to process and synthesise PA data. The paper implements a web-scraping tool using Python – orchestrated in Amazon Web Services (AWS), consisting of 22 different individual web scrapers with targeted information extraction structures for different council websites (n = 20) and government planning portals (n = 2), covering 383 of 537 total councils, to harmonise planning text data from across Australia. The remaining councils were not included due to a lack of available data and resource limitations in developing web-scraping tools. The data is geocoded, filtered for ‘high priority’ applications, cleaned, and manually labelled into four different urban development categories to create a training dataset. The approach then assesses five different NLP models to predict the urban development category of a PA based on the description field. NLP models include supervised FastText and TextCNN, fine-tuned BERT, and unsupervised Word2Vec and ZSL models. Finally, the best-performing BERT model is applied to classify current PAs in Australia’s two largest cities, Sydney and Melbourne, to sense check the model classifications and evaluate current spatial trends of urban development in these cities.
The paper makes several key contributions to the field of urban analytics. Firstly, to our understanding, the paper presents the first approach to collect, geocode and analyse Australian PA data. While previous approaches have utilised structured datasets of city- or jurisdiction-wide PA data, our approach directly interacts with council websites and planning portals, enabling near real-time and comprehensive data collection at a national level. Secondly, the paper applies NLP techniques for the first time to develop a classification structure for the unstructured PA text descriptions. This creates a scalable and transferable approach to analyse broad urban development trends across previously restrictive spatial and temporal boundaries. Thirdly, the paper tests a range of supervised, fine-tuned, and unsupervised modelling approaches to provide insights into the suitability of different methods for planning text classification. The superior performance of the fine-tuned BERT models indicates that integrating pre-trained models with a supervised approach may be most accurate for PA classification. Finally, the paper makes empirical contributions by applying the NLP classification model to understand current housing pipeline trends in Sydney and Melbourne. Across both cities, the model reveals commercial development close to city centres, new housing and land developments towards specific spatial clusters in the urban fringes, and disaggregated clusters of alterations and modifications throughout the cities. These insights can help planners understand the responsiveness of the housing market to development-oriented policies and enable targeted timely infrastructure delivery for growing areas.
Holistically, the paper presents a novel and comprehensive approach to collect, process, and classify planning and urban development data to inform planning decisions.
Literature review
Planning applications in urban analytics
Analysing PAs on a metropolitan scale can offer two major insights for policymakers and planners. Firstly, PAs can be used as a measure of new housing supply in a city. For example, Phibbs and Gurran (2021) investigated permitting intensity (measured as the number of new dwellings permitted through PAs compared to existing housing stock) to analyse new housing developments in Sydney over time. This urban analytics approach has also been applied to understand the responsiveness of housing markets to policy incentives and market changes in US cities such as Atlanta and Houston (Glaeser and Gyourko, 2018). Given the lag between planning applications, planning approvals, and construction, PAs offer the potential to forecast housing supply pipelines over the next 1–2 years (Phibbs and Gurran, 2021). This can help governments understand the responsiveness of private investors and commercial developers to housing policy incentives, and to guide decisions about future housing development policy.
Secondly, understanding different PA development types can help guide decisions around infrastructure requirements in growth areas. For example, in areas with increased commercial development applications, planners may consider improving pedestrian traffic flow, promoting retail and hospitality businesses, and maintaining activity during outside-work hours (Wang and Niu, 2019). In areas with dense new dwelling applications, Uddin et al. (2022) stress the importance of providing job opportunities, health services, transport connectivity, and sufficient educational and cultural facilities. Similar considerations apply for areas with land development and subdivision applications, although the greater likelihood of these approvals occurring in lower density urban fringe areas means the range of transport and service provision options considered may vary (Shahzad et al., 2022). Finally, while alterations and modifications may not directly imply an increase or change in the population mix of an area, dense clustering of modifications may imply socioeconomic change and are nonetheless a useful trend to monitor (Thackway et al., 2023a). Hence, analysing PAs can provide both high-level insights on future housing supply and more targeted insights to inform infrastructure planning at a local level.
While there is a growing body of work internationally investigating the impact of PAs on housing supply and housing prices (e.g. Gabriel and Kung, 2024; Van der Kooi, 2024), attempts to aggregate PA data in Australia have been limited to a handful of more recent studies. Zhu et al. (2022) and Murray (2023) analysed structured government PA datasets for Sydney and Queensland, respectively, identifying trends in the supply and timeliness of PAs. Both studies offered insights into the spatial and temporal trends of housing development, demonstrating the potential for PAs to enhance planners’ understanding of the housing pipeline. However, the studies were limited to the date, cost and location fields contained within the structured csv datasets. Resultingly, the studies analysed overall PA trends, however, did not distinguish between different types of urban development. Contrastingly, unstructured text data contained within PA descriptions may capture detailed property attributes needed to categorise urban development types, such as land use, building form, or construction notes. Accessing these unstructured data requires researchers to interact directly with PA data published on local council websites and government portals.
However, direct interaction with unstructured PA data has historically been limited by the difficulty in processing and standardising PA data sources. In Australia, PAs are processed by local councils and regulated by jurisdictional (state and territory) governments. As a result, different jurisdictions have varying definitions and data processes for PAs. For example, the ’Planning Application (PA)’ in Victoria (VIC) (Victorian Building Authority, 2023) is equivalent to the ’Development Application (DA)’ and ’Construction Certificate’ in New South Wales (NSW) (NSW Department of Planning and Environment, 2018). Moreover, the storage of these applications is disaggregated and in varying formats across local council websites and planning portals. Finally, PA descriptions are contained in unstructured written text formats which necessitate a methodology to process and compare this data across different sources.
Historically, these factors have limited the potential for data harmonisation between Australia PA data sources. Data harmonisation refers to the practice of combining different datasets to enhance their comparability or compatibility (Cheng et al., 2024). This may be achieved through a common identification key, shared features or a consistent classification scheme (Cheng et al., 2024). In the case of PAs, aggregating PA data into a single dataset has been limited by the complexity of extracting PA information from heterogeneous jurisdictional and council data sources. Moreover, disaggregated and inconsistent data collection practices across jurisdictions and local councils have made the use of identification keys or shared features untenable. Finally, while technically possible, applying a transferable classification scheme to compare datasets has historically been unfeasible due to the inefficiency and labour intensity of manually processing and analysing unstructured PA data.
Recently however, Natural Language Processing (NLP) models have emerged as a tool to aid urban planners with processing big textual data. These models enable the representation and analysis of human language computationally (Khurana et al., 2022). Advancements over the last decade in transformer-based pre-trained models have made NLP tasks much more powerful and computationally efficient (Khurana et al., 2022). Urban analytics, loosely defined as the ‘core set of tools employed to deal with problems of big data, urban simulation, and geodemographics’ (Batty, 2019), has quickly adopted NLP techniques into common practice. In urban analytics, where planners regularly analyse unstructured text documents, NLP models have achieved significant progress in information and feature extraction, sentiment analysis, and classification tasks (Fu, 2024; Han et al., 2020; Wu et al., 2022).
NLP in urban analytics
Urban planners regularly analyse documents containing large amounts of text data, such as land use plans and applications, reports, and policies (Fu, 2024). The process of digesting and analysing these documents into targetable insights is timely and subjective. Moreover, there is limited ability to compare features of planning policies and documents across time and jurisdictions. NLP has emerged as a tool to aid planners with processing big textual data, significantly improving the efficiency and scalability of this process. While existing research is primarily exploratory, with limited practical applications, there have been several use cases emerge to leverage NLP in urban analytics (Fu, 2024).
Firstly, NLP is used in planning to extract key pieces of information such as dates, addresses, ID numbers, costs and other features from unstructured written text in websites, PDFs or other text documents (Wu et al., 2022). This approach has two advantages: first, it improves the efficiency of feature extraction, unlocking large amounts of previously underutilised data sources. (Tyagi and Bhushan, 2023). Second, it enables retrospective information extraction, overcoming hurdles of incorrect or inconsistent information structures during data collection. This approach has assisted in information querying from planning regulatory documents (Bommarito et al., 2021) and feature extraction from construction safety reports (Tixier et al., 2016).
Sentiment analysis is another prominent NLP application in the urban analytics field, performed primarily on media data (e.g. social media and print media) to evaluate public opinion towards major planning and development features (Fu, 2024). This NLP application has facilitated macro scale analysis of unstructured media sources, enabling a more direct evaluation of public opinion than traditional survey and interview methods. Use cases include assessing the perception of residents towards key neighbourhood characteristics through online reviews (Hu et al., 2019) and assessing public sentiment towards housing prices as evidenced through media articles (Biktimirov et al., 2024).
Finally, classification or semantic analysis is performed to classify unstructured text fields into categories or clusters (Fu, 2024). Classifying text documents has the advantage of enabling trend analysis and comparability of information which may have written formats or content. This capability can assist harmonisation of data sources with different feature definition or data collection structures (Cheng et al., 2024). In interpreting spatial plans, NLP has been applied to perform topic modelling on sustainability plans from the resilient cities network (Fu et al., 2022), and to identify planning topics in Canadian planning documents (Han et al., 2020). These studies implemented both unsupervised and supervised learning techniques to perform topic modelling on documents and analyse trends within the classified topics. These approaches have a high degree of transferability to the semantic analysis of PA urban development classes. One could fairly expect that the reasonably high accuracy and robustness achieved within these studies (e.g. 80% accuracy for Fu et al.’s (2022) topic modelling approach) could be achieved or improved upon within a PA context.
Yet, to our knowledge, there have been no attempts to apply NLP to analyse planning or building application documents. While a handful of studies have analysed structured PA datasets in relation to housing supply and prices (e.g. Gabriel and Kung, 2024; Zhu et al., 2022), research analysing unstructured PA data is limited. While historically, the unstructured nature of PAs has limited detailed analysis, the emergence of NLP techniques for processing and analysing unstructured text data offers the potential for PA analysis to contribute timely and meaningful insights for urban planners and policymakers into the changing nature of our cities.
NLP models for classification tasks
There are a broad range of NLP methods that can be applied to text classification tasks. In the last 10 years, there has been significant acceleration in the development of new and novel NLP methods. These methods may differ based on the vectorisation methods (method to convert raw text data into numerical format that machine learning algorithms can understand) used, degree of supervision, integration of Pre-trained Language Models (PLMs), and other factors. Different models will be suited to different classification tasks, dependent on the data, resources, and technical expertise available. This paper applies five models that span a range of complexity and data availability levels to help inform the optimal practical implementation approach of a PA classification model. We investigated selected NLP models – Word2Vec, TextCNN, FastText, Bidirectional Encoders Representations from Transformers (BERT) and Zero-Shot Learning (ZSL)) for the purpose of classifying the given PA with.
Word2Vec is an unsupervised word embedding model introduced in 2013, which transforms individual words into continuous vector representations (Jatnika et al., 2019). These vectors are typically trained on extensive textual databases, including sources like Wikipedia and Google News (Major et al., 2018). In urban analytics, Word2Vec has been effectively employed for classifying public complaints related to city planning, demonstrating its capability to capture semantic meaning from textual data (Kim et al., 2021). TextCNN, proposed by Kim (2014), is a supervised model that adapts convolutional neural network (CNN) architectures – traditionally used in computer vision – to text classification tasks. By applying a one-dimensional convolutional layer over pre-trained embeddings such as Word2Vec, TextCNN has successfully been applied in urban analytics for categorising urban governance documents into distinct governance categories, highlighting its utility in structured document analysis (Wu et al., 2023). FastText, developed by Bojanowski et al. (2017), extends the Word2Vec architecture by considering additional context and structural information within sentences, producing enriched word embeddings. This supervised learning technique has been applied to urban analytics in various contexts, including the classification of geotagged urban environment labels (Hiippala et al., 2019) and identifying social media review topics relevant to transportation planning (Sarram and Ivey, 2022).
Introduced in 2018, BERT is a transformer-based pre-trained language model (PLM) consisting of 24 transformer layers and 340 million parameters, extensively pre-trained on large-scale datasets such as English Wikipedia (Devlin et al., 2019). For text classification tasks, BERT typically involves freezing its pre-trained parameters and fine-tuning only the final classification layer (Sun et al., 2019). Advanced variants such as DistillBERT and DeBERTA-V3 have further improved performance for specific analytical tasks (He et al., 2021) and in addition there are specific variants which are optimised for classification tasks such as RoBERTa (Liu et al., 2019), ALBERT (Lan et al., 2019) and SBERT (Reimers and Gurevych, 2019) and domain specific models such as FinBERT (Huang et al., 2023) for classifying financial texts, BioBERT (Lee et al., 2020) for use with biomedical notes and CE-BERT (Anggrainingsih et al., 2023) which is optimised for detecting false facts in twitter posts. In urban contexts, BERT has supported sophisticated analytics such as mapping urban green spaces based on textual location descriptions (Cao et al., 2023) and conducting topic analysis of transportation typology documents (Rath and Chow, 2022). Zero-Shot Learning (ZSL), an unsupervised technique introduced in 2019, addresses classification challenges without requiring labelled training data for every class. Instead, ZSL transfers learned knowledge from previously encountered classes to categorise new, unseen data (Yin et al., 2019). ZSL has leveraged transformer-based models like BERT as entailment-based text classifiers, extending its applicability to urban analytics for tasks such as topic analysis on smart city documentation (Lim and Hwang, 2024). Although Topic modelling approaches powerful and promising for long form content present in planning applications, it is quite challenging to collect at a large scale and often comprehensive planning application datasets have only a short summary available on each data point. While techniques such as Biterm Topic Modelling (BTM) could overcome this limitation on short texts (Yan et al., 2013), this paper we are focussing on more transformer-based models.
Methods and data
Data collection
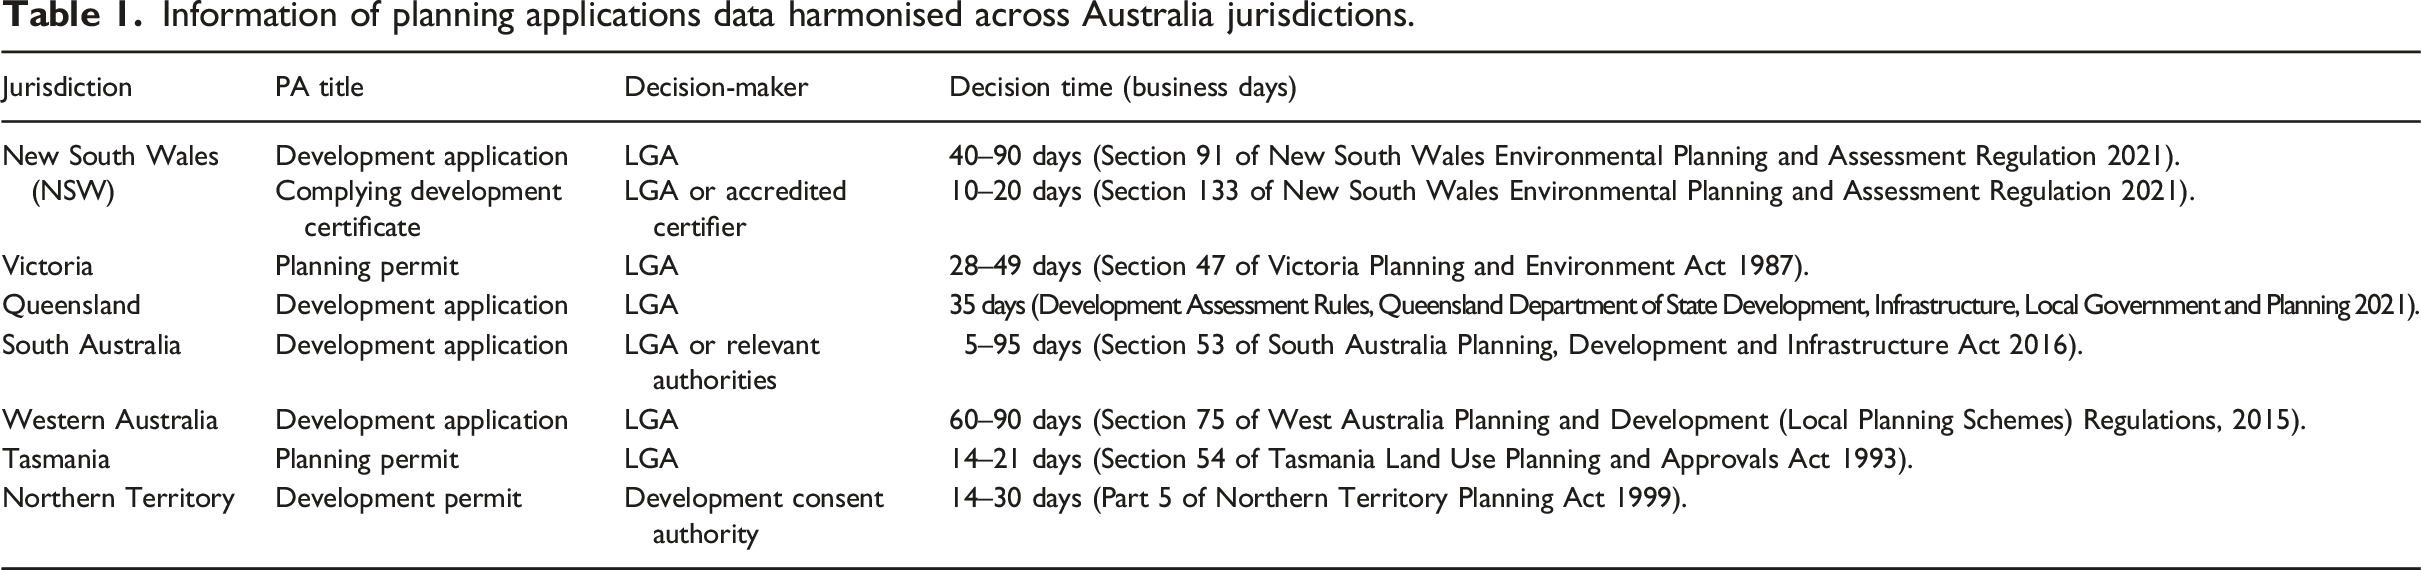
Information of planning applications data harmonised across Australia jurisdictions.
PA data processing
The process to harmonise PA data from different jurisdictions consisted of an automated web-scraping, geocoding and data filtering pipeline. The pipeline was tailored to function on 22 different online data sources (listed in Appendix A), navigating differences in data formats and PA definitions across local council websites and government planning portals. The pipeline consisted of Python code, executed using cloud computing services through AWS, run daily to provide a near real-time dataset of open PAs in Australia.
Firstly, a web scraper tool was developed in Python to scrape PA information stored in schemes such as JSON or table-like formats. The tool scraped information from local council websites, the planning portal PlanningAlert, and the NSW Government website. The scraper was built using the Python packages BeautifulSoup and Selenium to extract key pieces of information such as address, application date, permit type, and application description. The scraper identified these pieces of information by scanning for key headings or labels in the online data sources. Secondly, the data was geocoded by applying an AWS geocoder on the scraped address field where approximately 90% of the records had clean geo-codable addresses. Finally, keywords were identified in the PA description field to classify the observations into ‘low’ and ‘high priority’ applications, based on the impact of each PA on urban activity within the development area. ‘High priority’ keywords included [‘dwelling’, ‘office’, ‘redevelopment’, ‘subdivision’] while low priority keywords included [‘paint’, ‘fence’, ‘door’, ‘repair’]. PAs that consisted of at least one ‘high priority’ keyword and no ‘low priority’ keywords were labelled as ‘high priority’ PAs.
The output of the automated pipeline, executed using AWS, was a daily dataset containing all current, ‘high priority’ PAs scraped from available council and planning online data sources. As of 15 August 2024, this dataset contained 378,278 planning records collected from 383 councils (out of 537 total councils in Australia). The records have a description field which is a short text summarising the planning application which is around 1–2 sentences (8
PA classification
The output PA dataset from the pipeline was then cleaned, labelled, and used to train several NLP classification models. The model was used to classify PAs into four distinct urban development categories based on the PA description field: ‘Commercial development’, ‘New housing development’, ‘Subdivision and land development’, and ‘Alterations and modifications’. The best-performing model was applied to map urban development trends in Sydney and Melbourne.
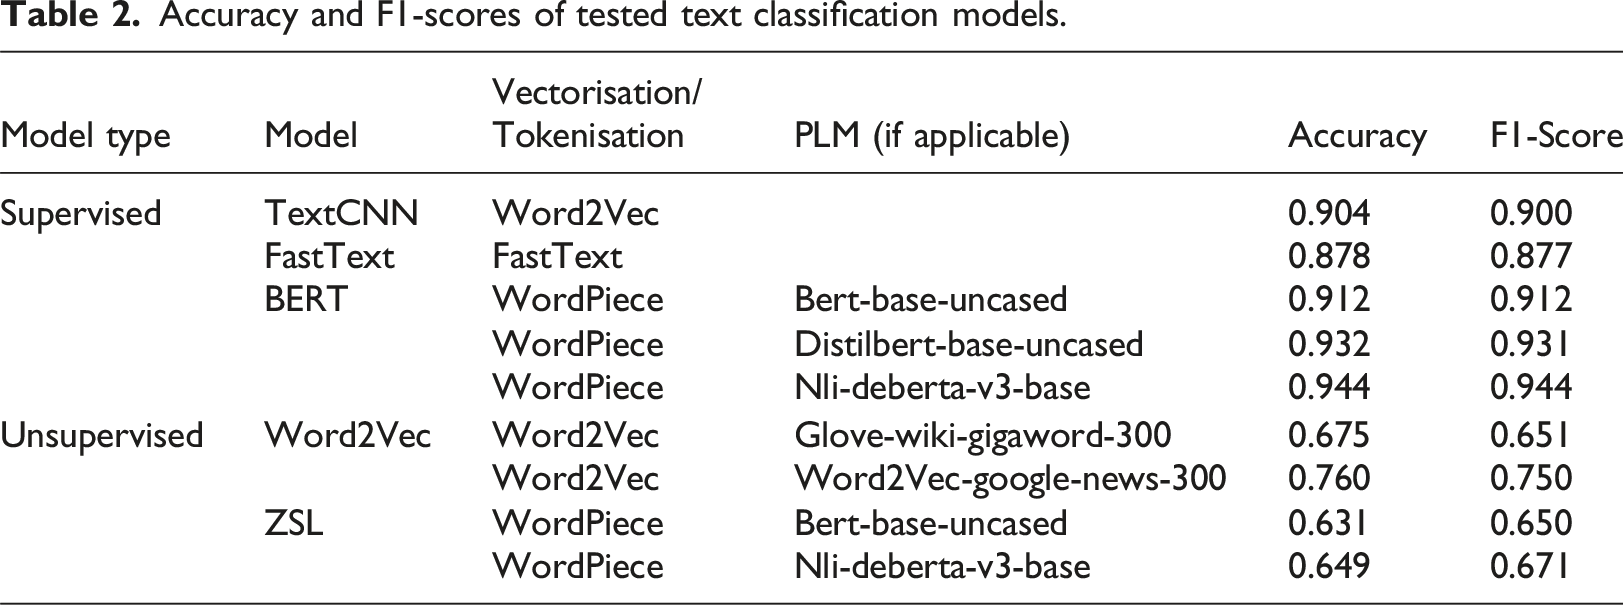
Accuracy and F1-scores of tested text classification models.
The cleaned series of vectorised descriptions comprised the training dataset. Manual labelling was required to generate labels for the supervised learning models. A random sub-sample of 3000 observations from Sydney were manually labelled into the four urban development categories. Sydney was chosen as the training dataset area, given the known diversity and density of current urban development, while testing indicated that 3000 training data points was sufficient to generate robust modelling results. The random sub-sample was chosen to give a representative sample across the classes where 17% were non-residential/commercial developments, 31% were new housing development, 11% were subdivisions and land developments, and 42% minor alterations and modifications”. This labelled dataset was split into a training/test/validation dataset using a 60/20/20 data split. The model was then built using the cleaned and vectorised description fields to predict the urban development category labels. Five different model architectures were tested: Word2Vec, TextCNN, FastText, BERT, and ZSL using a BERT base layer. For models that contained a pre-trained component, several different PLM variants were tested, as reported in Table 2 in Section 4.1.
For all models except for ZSL, a train – test split of 80:20 has been used. For Word2Vec, the text column was pre-processed using a basic tokenizer along with lowercasing and stopword removal. A skip-gram model was then trained using glove-wiki-gigaword-300 and Word2Vec-google-news-300 on the text and labels to learn 300-dimensional embeddings. We then calculate the cosine similarity between the embeddings of the text and labels to determine the label that is most similar to the text. For FastText we employ the supervised version for classification. The text column was pre-processed with built-in tokenizer while preserving the sub-word information, where the model embeds the character-level n-gram features and averages them into the hidden state, and predicted class is generated from the hidden state. For TextCNN, we started with the tokenized text column from the pre-trained word2vec embeddings and keras’ tokenizer. The model was trained with six convolutional filters that captured local features and predicted the label. For BERT-based classification, the text column was tokenized with BertTokenizer (uncased_base_model) and the model was fine-tuned using three PLMs – bert-base-uncased, distilbert-base-uncased, and nli-deberta-v3-base with maximum length of 256 and batch size 16. For ZSL, we used bert-base-uncased and nli-deberta-v3-base models to calculate embeddings for the text column and candidate label names. Cosine similarity was used to determine the closest label for each instance. Since training was not required, inference was performed directly on the samples using zero-shot capability of the sentence embeddings. The accuracy and F1-scores of the above models on the ‘test’ dataset for all the above models are reported in Table 2.
Finally, the best-performing model (DeBERTa-v3) was applied to classify current PAs in Sydney and Melbourne into one of the four urban development categories. The model was applied to PA data from two time periods in both cities to assess changes in the spatial trends of urban development. The data was first scraped for PA’s available as of 1st January 2023, containing open PAs lodged from 2021 to 2022 (2021–2022). The second dataset was scraped as of 20th August 2024 and filtered to contain PAs lodged from 2023 onwards (2023–2024). In NSW, the first and second datasets contained 66,057 and 84,519 observations, respectively, while in Victoria the two datasets contained 16,471 and 26,641 observations, respectively. NSW contains a greater amount of PA data due to the NSW government planning portal centralising PA data sources, whereas Victoria lacks such a portal. The spatial distribution of urban development clusters in both cities was mapped using Kepler.gl, a GPU accelerated front-end tool which provides high performance visual analytics (Soundararaj and Pettit 2024). While the model was not applied to other Australian cities or regional areas, the PA data is downloaded, and future work could run the classification nationally with minimal additional effort.
Results and discussion
Model performance
The experimental results of different methods for planning classification are summarised in Table 2. The accuracy, which measures the proportion of correct predictions, and the F1-score, which measures the balance between precision and recall, are reported. These measures provide an indication of the absolute and relative accuracy of the model across the four classification classes. Because the classification task aims to assess the housing pipeline across all four development categories, with no heightened cost for correctly or incorrectly classifying a particular class, these general performance metrics were deemed sufficient to assess the suitability of competing models.
The first and most notable distinction across the models is the significant difference in performance between supervised and unsupervised models. The best-performing unsupervised model, Word2Vec Google News, significantly underperforms the worst-performing supervised model, FastText, with an accuracy of 0.760 compared to 0.878. Despite considerable testing of variations in class labels and PLM architectures, we were unable to achieve competitive accuracy for the unsupervised learning models. Potential causes for this underperformance may include limited information to form classifications, with many PA descriptions containing less than 10 words, and insufficient semantic variation in the class labels, with frequent misclassifications occurring between ‘new housing construction’ and ‘alterations and modifications’.
Among supervised models, the performance of the fine-tuned BERT models is better than the self-taught FastText and TextCNN models, with accuracies ranging from 0.912 to 0.944 compared to 0.878 and 0.904, respectively. This indicates the effectiveness of leveraging knowledge from other English text datasets for planning text classification. DeBERTA-v3 method is the best-performing BERT model across both metrics, with an accuracy and F1-score of 0.944. This aligns with literature documenting the performance improvements of modified BERT models such DeBERTA-v3 over the base BERT model (He et al., 2021).
Overall, the model performance across a diverse range of NLP models indicates that for a bespoke planning text classification task, with semantically similar classes and potentially limited text data for some observations, fine-tuned models may be best suited to leverage PLM components while considering the specific planning text context.
Urban development clusters
The best-performing DeBERTA-v3 model was applied to map PA classifications over the two time periods (2021–2022, 2023–2024) in Sydney and Melbourne. Understanding spatial and temporal urban development trends can perform a basic sense check of the classification model and provide insights on the housing supply pipeline across both cities. Sydney and Melbourne were chosen over a smaller regional town for two reasons. Firstly, the data has more coverage and is consistent in the state of NSW and Victoria with activity concentrated around the urban centres. Lastly, the categories chosen for classification was designed to answer questions around housing supply which showed clearer patterns in urban areas. For example, finding out how many new dwellings are realistically in pipeline for a given local area.
An analysis first of Sydney’s 2021–2022 map (Figure 1(a)) reveals several spatial clusters of urban development activity which support a high-level face-validation of the classification model. This includes new housing construction to the south-west of the city, in new land release areas towards the Badgerys Creek Airport expansion area (Koziol, 2020). In greenfield sites, there are spatial clusters of new land development subdivisions to the north-west and south-west, while there are several non-residential clusters towards the traditional business districts of the Sydney CBD and Chatswood City. Finally, there are alterations and modifications to the existing urban fabric occurring throughout the city as it experiences urban renewal. PA urban development classifications by NLP model (DeBERTA-v3) in Sydney. (a) 2021–2022, as of January 2023. (b) 2023–2024, as of August 2024.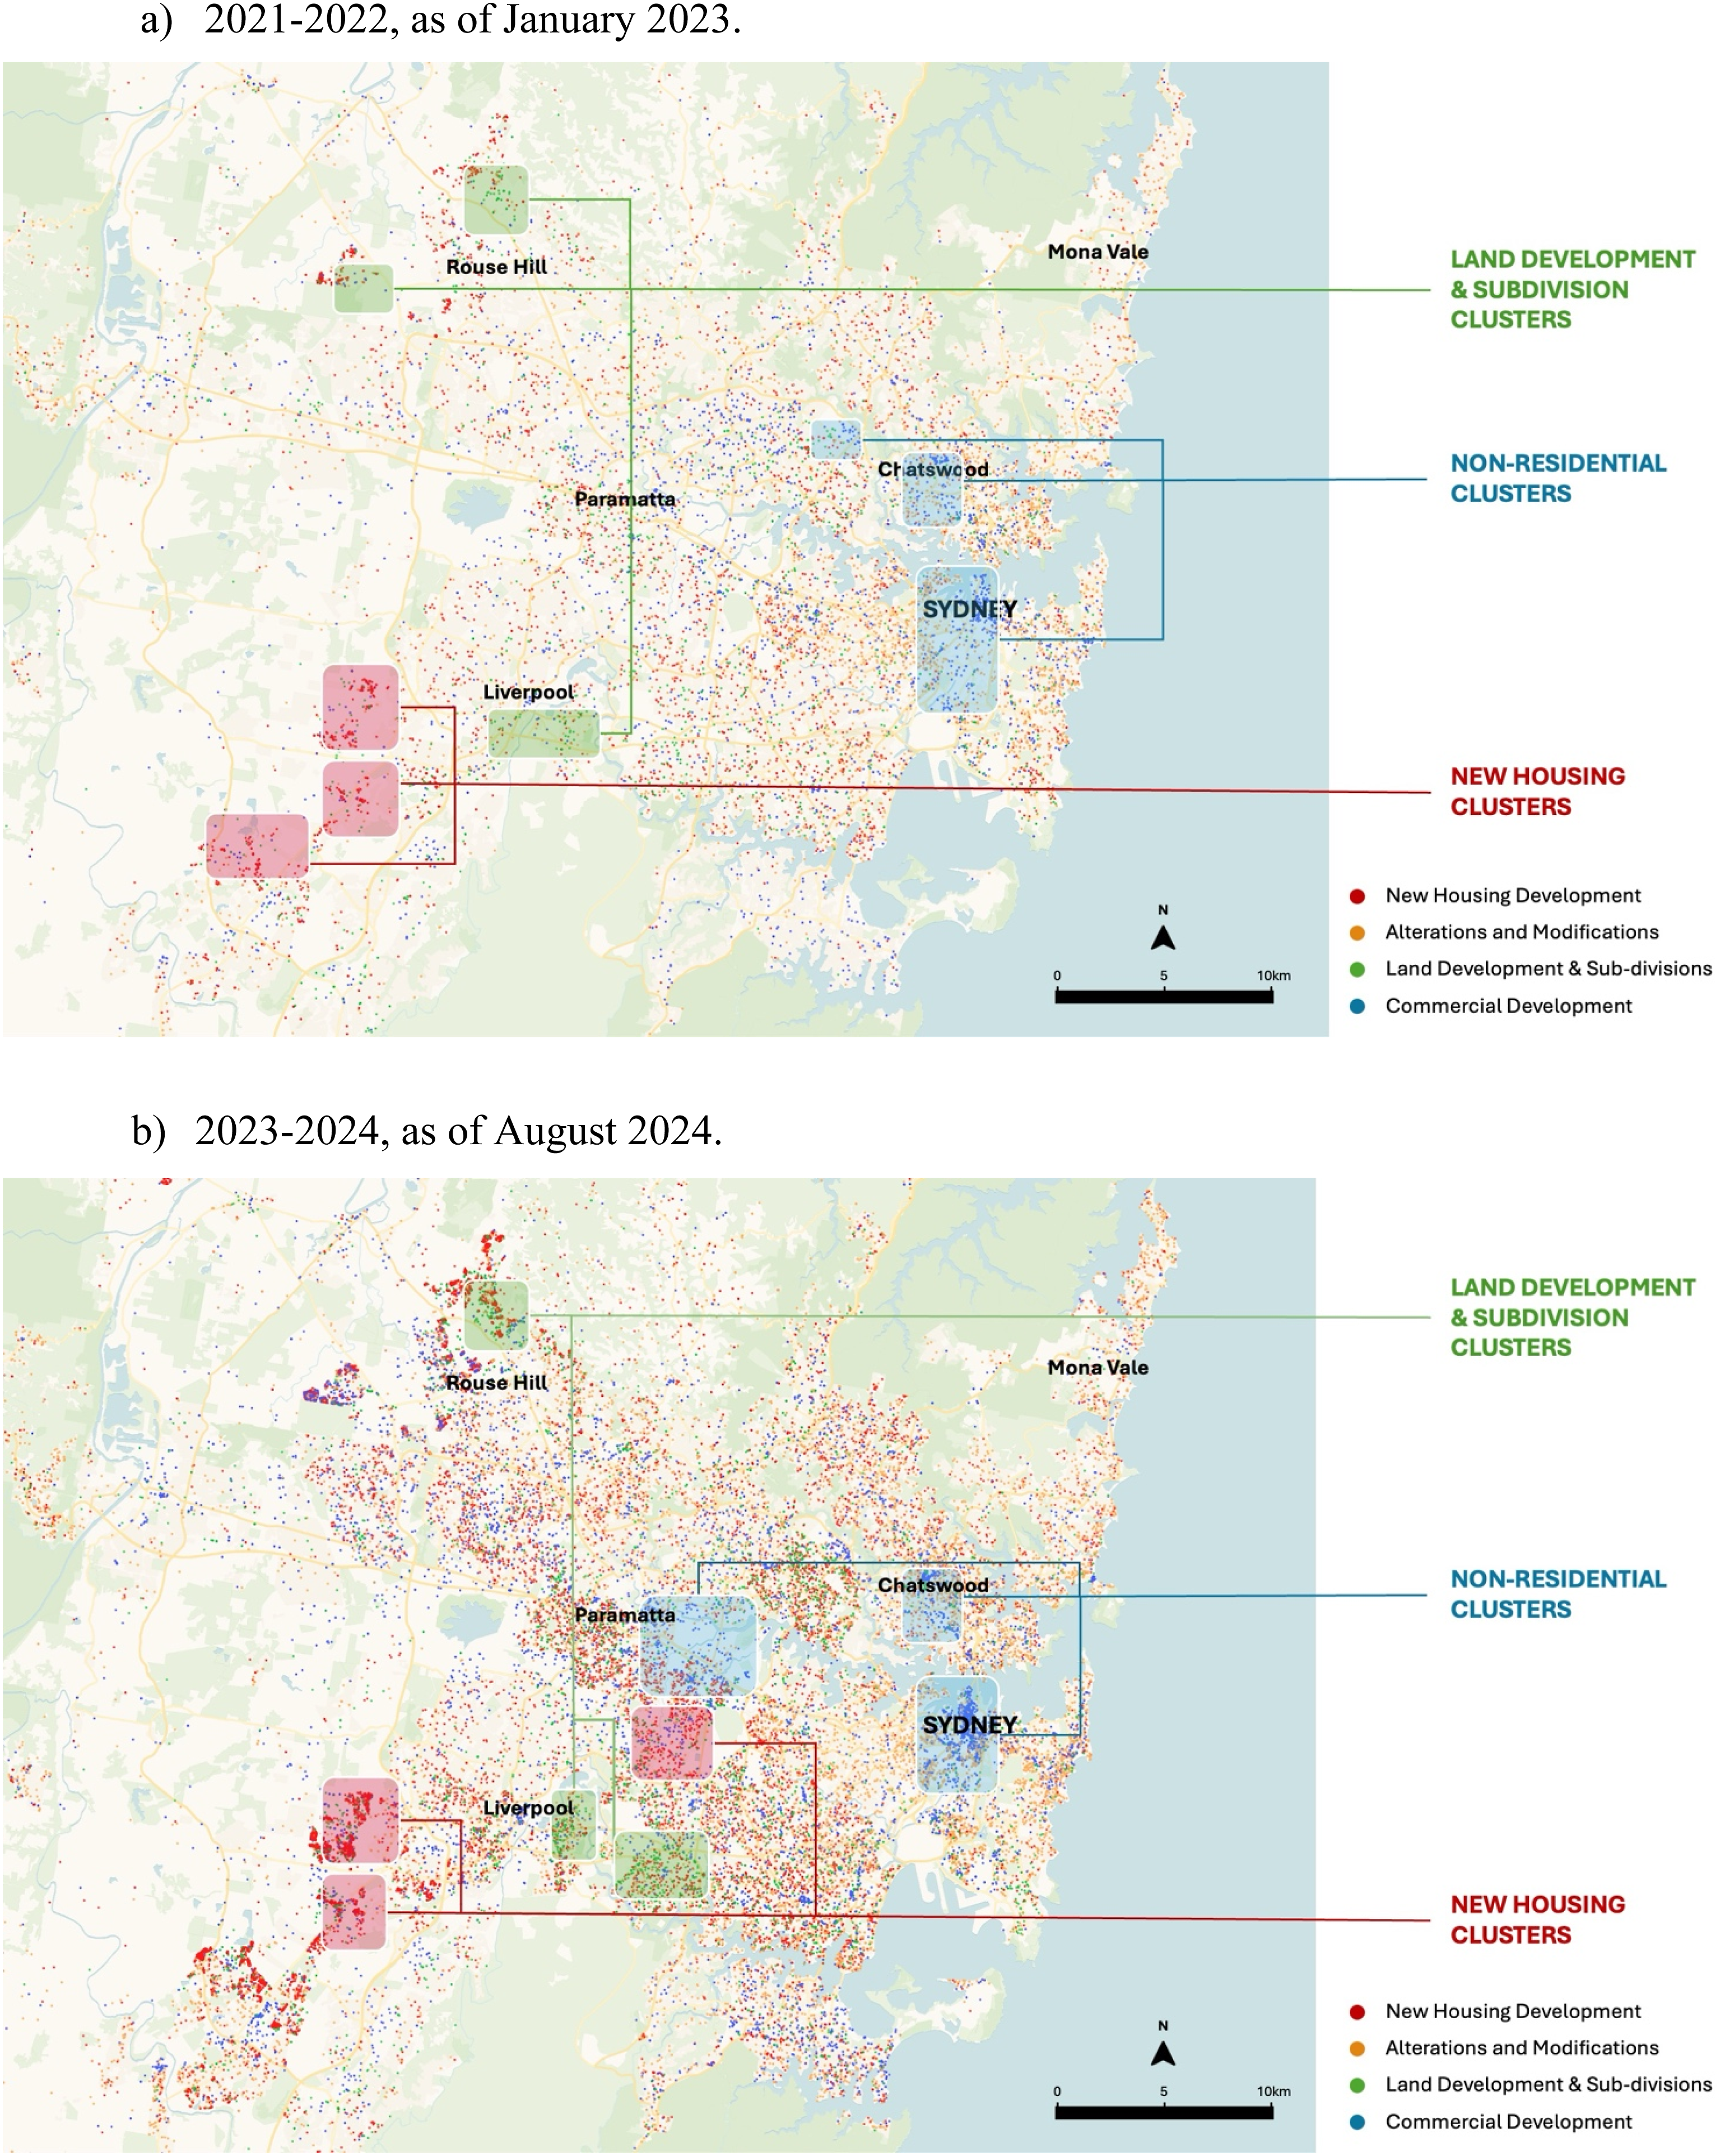
Investigating PAs from 2023 to 2024 reveals several new urban development clusters (Figure 1(b)). Firstly, there is a major commercial development cluster around Parramatta City, reflecting its emergence as Sydney’s ‘second CBD’ (Bolger and Bowring, 2024). South of Parramatta City, new housing construction is clustered around the suburbs of Auburn and Bankstown, indicating property growth and potential gentrification in this area (Thackway et al., 2023b). There is an additional subdivision cluster towards greenfield sites in the south-west, while previous subdivision, new housing, and commercial development clusters remain in the north-west, south-west, and city centre, respectively. Interestingly, the map reveals a drop-off in alterations and modifications throughout the city, particularly in the inner west. This may reflect increases to construction costs due to global supply chain issues, and/or the erosion of households’ borrowing capacity due to high interest rates (Johanson, 2024).
Sydney’s development profile raises several interesting considerations for planners. Firstly, do PAs between the two time periods indicate an uptick in the housing supply pipeline, which could potentially assist in improving housing affordability (NSW Government Planning, 2024)? In NSW, new house construction PAs classified by our model increased between January 2023 (19,012) and August 2024 (25,225); however, this figure is still well below the annual target of 45,200 new homes set by NSW Government Planning (NSW Government Planning, 2024). Tracking new housing PAs in the coming years will be particularly noteworthy to evaluate NSW and Australia’s responsiveness to Australia’s ‘National Housing Accord’ which aims to build 1.2 million new homes by mid-2029 (Australian Government Treasury, 2024). Secondly, are growth areas sufficiently supported by existing or new transport and service infrastructure? In Sydney, the corridors of commercial and land development towards Parramatta, Rouse Hill, and the Badgerys Creek Airport are directly serviced by Sydney’s new Metro train line (Sydney Metro, 2024), indicating alignment between planning and new transformational transport infrastructure, both metro and airplane.
In Melbourne, while there is less PA data, similar trends are evident in the spatial distribution of urban development. Between 2021 and 2022 (Figure 2(a)), new housing construction clusters reflect residential growth in Melbourne’s ‘booming west’ (Development Victoria, 2024). There are several land development clusters in outer East Melbourne where planning regulations are generally more favourable to subdivisions (Robbins, 2022). Finally, there is dense commercial development in Melbourne’s CBD and towards Dandenong, indicating the success of a 2021 Victorian Government initiative to stimulate commercial growth in the Dandenong area by reducing development taxes (Development Victoria, 2021). PA urban development classifications by NLP model (DeBERTA-v3) in Melbourne. (a) 2021–2022, as of January 2023. (b) 2023–2024, as of August 2024.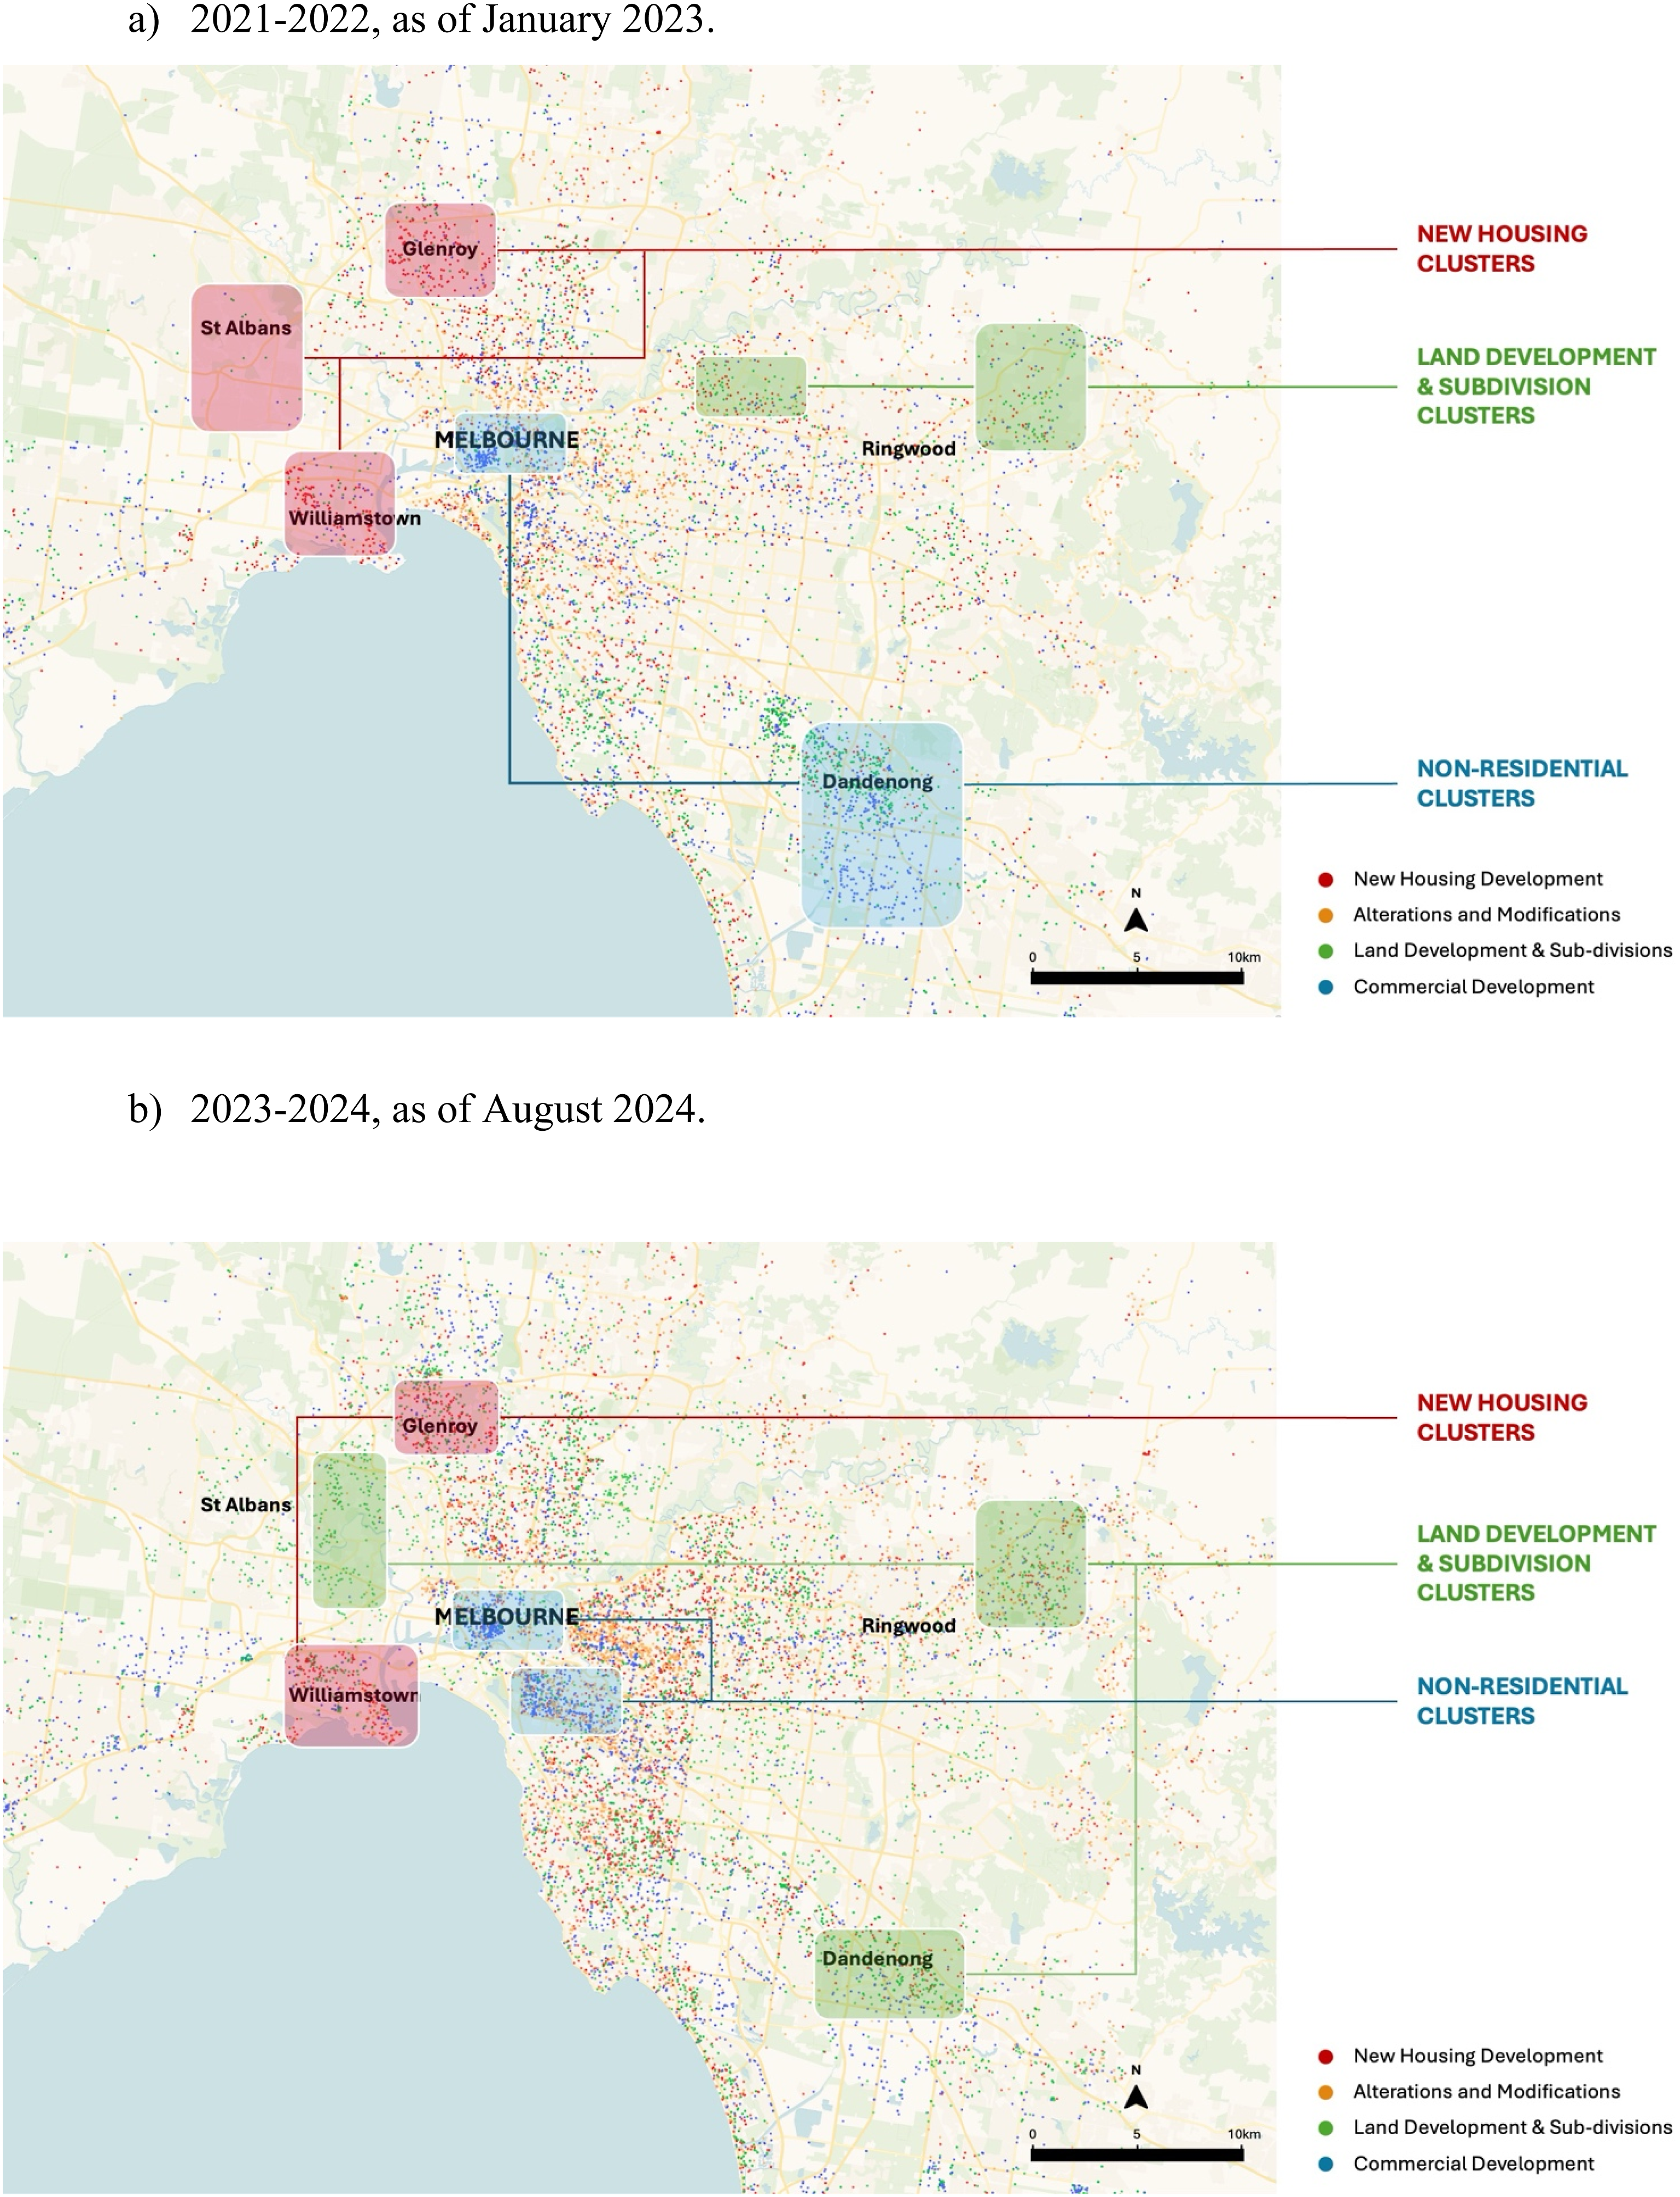
Between 2023 and 24, while the prevailing development patterns remain similar, there are several emerging clusters (Figure 2(b)). The Victorian Government development incentive in Dandenong has stimulated both non-residential and subdivision activity in the area, while there is a new subdivision cluster towards St Albans where development was previously more focused on new housing construction. Additionally, there is significant commercial activity south-east of the Melbourne CBD which likely reflects planning for the ‘South Yarra Square’ commercial precinct project which emerged in late 2022 (Schlesinger, 2022).
In Victoria, as in NSW, new housing construction PAs have gone up slightly (4494 in January 2023, 5564 in August 2024); however, these figures may be less complete given the sparser web scraped data for Victoria. Planners may also be interested in the positive market responses to government initiatives to stimulate commercial and land development in South Yarra and Dandenong, although this growth must be supported by sufficient services and transport infrastructure.\
Across both metropolitan areas, similar spatial trends are evident, with new housing and subdivisions in the outer suburbs, non-residential development towards the city centres, and alteration and modifications distributed throughout. These overall trends provide a face-validation of the NLP model’s classifications. Moreover, investigating PA classifications across time and space illuminates several urban development trends, such as emerging commercial districts and new housing hotspots. Such insights can support planners to better understand the development industry’s responsiveness to policy initiatives and the planning needs for future growth areas.
This analysis could be significantly enhanced by examining the complete project lifecycle, encompassing construction, completion, and occupation phases which are captured by the Development Applications (DA), Complying Developing Certificates (CDC) and Occupation Certificates (OC). However, the heterogeneous nature of available data presents substantial challenges in establishing linkages across these phases. Artificial intelligence technologies offer promising solutions to address these integration complexities and warrant further investigation. The incorporation of PDF planning applications represents a particularly valuable avenue for research, as these documents could enable more sophisticated analytical approaches, including topic modelling methodologies that may streamline the approval process and enhance planning efficiency. Furthermore, recent advances in generative artificial intelligence, particularly large language models, present new opportunities for both classification and predictive modelling applications. The multi-modal capabilities of these systems could substantially accelerate approval processes through automated feature extraction and parameter estimation, thereby supporting more efficient and data-driven planning decision-making.
Conclusions
PAs have recently garnered attention as a rich and publicly available data source to understand the future housing supply pipeline and infrastructure requirements of an area (Murray, 2023; Zhu et al., 2022). PAs under consideration are often required to be listed for public information and consultation and are generally available through council websites and government planning portals. However, previous studies have been unable to directly interact with PAs due to difficulties reconciling differences in jurisdictional PA definitions, online data formats, and an inability to process large amounts of unstructured text data. Our study implements large-scale web-scraping, geocoding, data harmonisation, and emerging NLP capabilities to develop a novel pipeline that processes, classifies and maps PAs to create a robust and scalable method to analyse PAs on a metropolitan scale.
Firstly, our approach implements a customised web-scraping tool, built-in Python and executed daily using AWS, to scrape current PAs from 22 different online data sources. The process applied a geocoder and a ‘priority’ classification using keywords to provide a daily, geocoded dataset of ‘high priority’ PAs under consideration nationally. The PA dataset was labelled and classified into four classes, differentiated by the infrastructure provisioning requirements of each development category. To our knowledge, this is the first approach to collect and harmonise PA into a nationally consistent classification schema.
The classification approach tested five different NLP models that integrated varying degrees of pre-trained models in supervised and unsupervised contexts. While the unsupervised PLMs performed poorly, the best-performing method was the fine-tuned DeBERTA-v3 model, with an accuracy and F1-score of 0.944. This indicates that fine-tuning a supervised PLM can maximise performance for planning text classification tasks. These methodological findings can help inform future NLP modelling approaches within the urban analytics field.
Finally, the fine-tuned DeBERTA-v3 model was applied to classify and map urban development trends in Sydney and Melbourne over two time periods: 2021–2022 and 2023–2024. The mapping exercise revealed broadly consistent development trends across both cities and time periods, providing a face-validation of the classification model. Moreover, the classifications provided insights into the new housing supply pipeline, which displayed a slight increase in both cities, and the different types of urban growth areas. While the appropriateness of infrastructure provisioning in growth areas could be evaluated to some degree through a high-level assessment of new transport connections, further analysis of economic and service provisions in these areas could support a deeper understanding. Nonetheless, the classification model provides a highly accurate and robust method to understand new housing supply and urban growth area typologies.
Future research could look to expand the comprehensiveness of the PA dataset by incorporating additional council websites and aggregated planning datasets into the web-scraping approach. The classification model could also be extended, potentially with additional PA information such as expected cost and council location, to perform predictive modelling such as expected PA outcomes or timelines. Further work could also include assessments of infrastructure delivery in commercial and new build areas to assess the effectiveness of planning in growth areas. Also noting that Planning Applications data are not available consistently across the world, both in terms of coverage and granularity, future research can also investigate complementary multi-modal sources such as gazette notifications, annual reports, etc. and their suitability to generate similar dataset.
Notwithstanding this, the study provides the first approach to harmonise and analyse PA data on a metropolitan scale. This approach utilises data and modelling advancements to aggregate a national PA dataset and deliver a robust urban development classification schema. Ultimately, the study demonstrates the potential for machine learning methods to automate PA analysis and provide urban analytic driven insights that better inform strategic planning and policymaking.
Footnotes
Funding
The author(s) disclosed receipt of the following financial support for the research, authorship, and/or publication of this article: This research was supported by the Australian Housing Data Analytics Platform (AHDAP), a collaborative initiative of the City Futures Research Centre, UNSW Sydney, and the NCRIS-enabled Australian Research Data Commons (ARDC), and by the Housing Analytics Lab (HAL), funded through the NSW Government’s NCRIS Support Program.
Declaration of conflicting interests
The authors declared no potential conflicts of interest with respect to the research, authorship, and/or publication of this article.
Data Availability Statement
The datasets generated and/or analyzed during the current study are available from the corresponding author on reasonable request.
Author biographies
Appendices
List of data sources.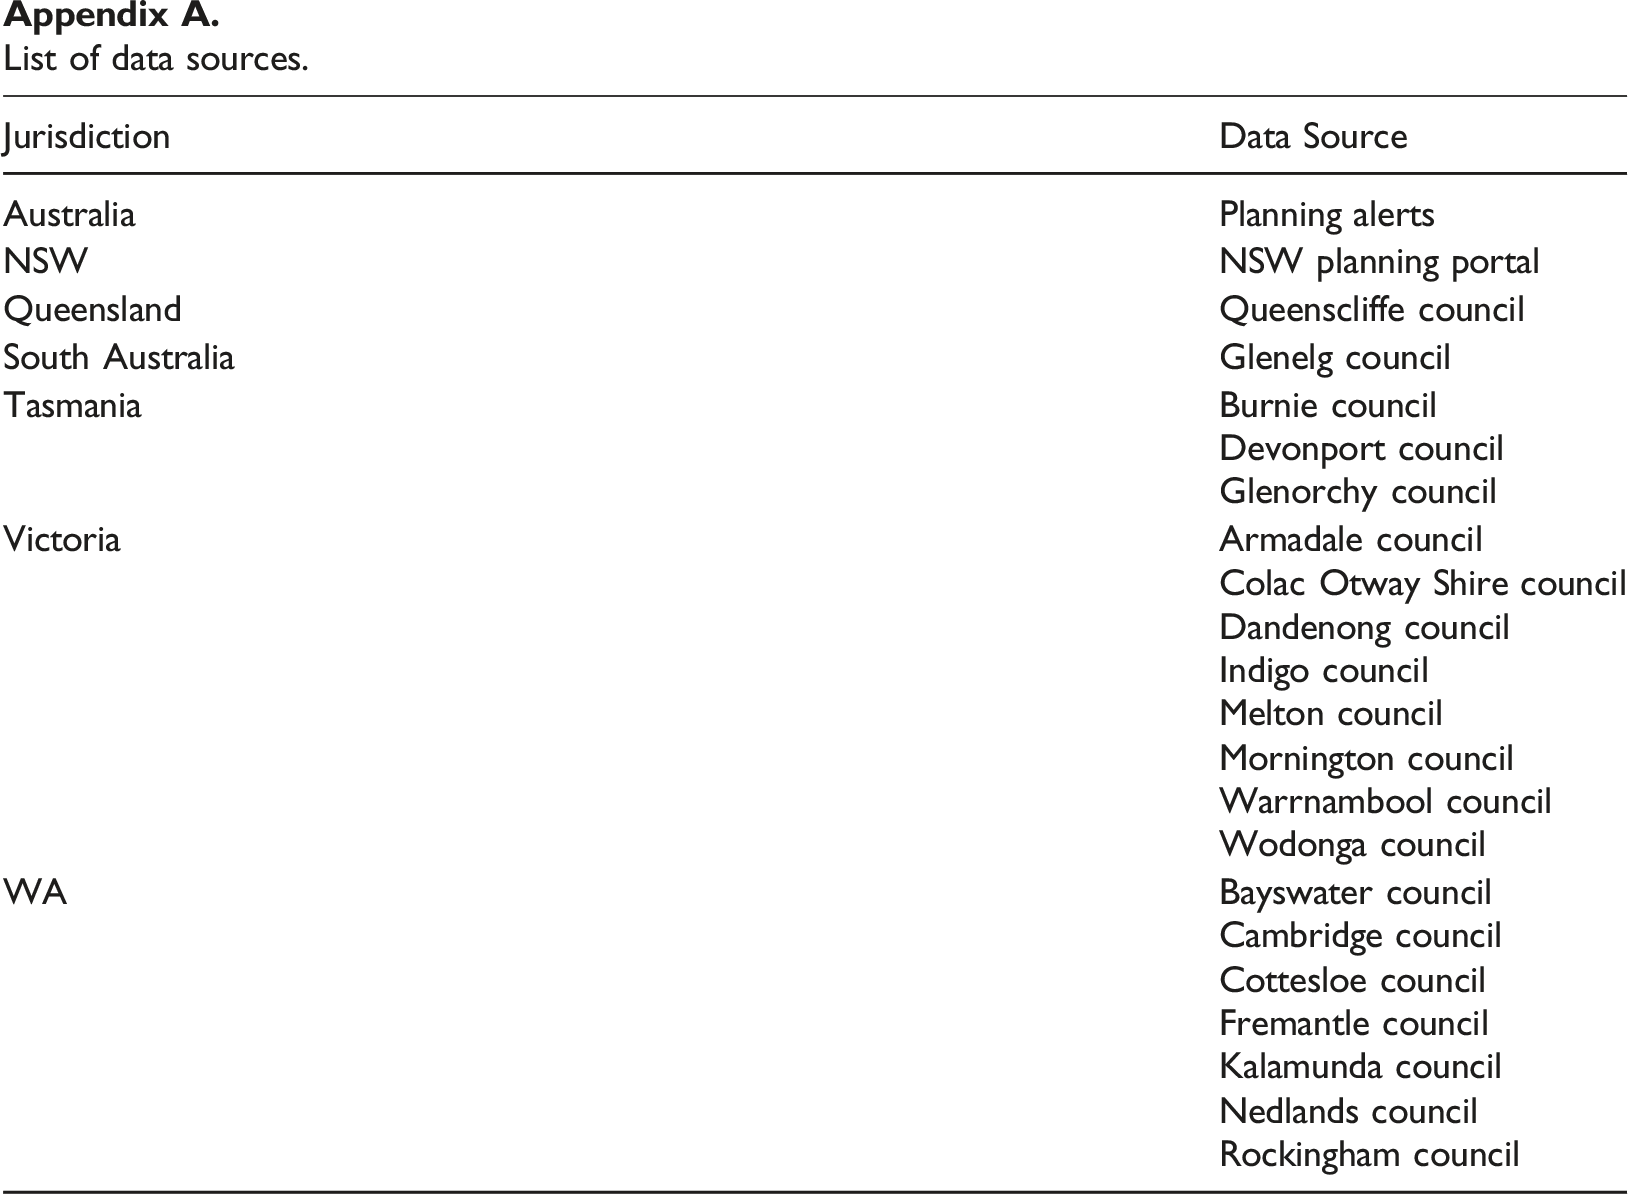
Jurisdiction
Data Source
Australia
Planning alerts
NSW
NSW planning portal
Queensland
Queenscliffe council
South Australia
Glenelg council
Tasmania
Burnie council
Devonport council
Glenorchy council
Victoria
Armadale council
Colac Otway Shire council
Dandenong council
Indigo council
Melton council
Mornington council
Warrnambool council
Wodonga council
WA
Bayswater council
Cambridge council
Cottesloe council
Fremantle council
Kalamunda council
Nedlands council
Rockingham council
data cleaning steps
Note: The primary noise in the description text is noted to be artifacts created in HTML and while parsing HTML such as hyperlinks, citation marks and misaligned tags, etc. With a short Proposal description field (average of 1–2 sentences) to keep things simple, step 4 removes all punctuations in the field. This approach will possibly not scale for longer, more complex text.