
Abstract
This study addresses the challenges of monitoring urban development where sprawl, infill and soft densification are prevalent. To accurately identify the spatial distribution and characteristics of different development types, a multi-modal deep learning model was developed to predict parcel-level development types using very high-resolution land cover maps and tabular data representing parcel attributes of surface cover, built form and dwelling counts. This model was compared to a range of supervised and unsupervised classification models and evaluated in two contexts: (i) within Perth, where training data was abundant, and (ii) when generalising models to other cities across Australia. To undertake this analysis, a ground truth dataset of almost 70,000 labelled parcels were sampled from Perth, Western Australia, with fine-tuning and test datasets produced for other Australian cities (Melbourne, Sydney, Brisbane and Adelaide). The multi-modal deep learning model achieved an overall accuracy of 94% when evaluated in Perth and overall accuracy ranging from 91% to 94% when evaluated in other cities. The model was more accurate in classifying visually distinct development types that are relevant to monitoring infill and densification and performed well in transferring to other cities. These results indicate that deep learning models and transfer learning workflows can be leveraged to develop generalisable urban development type mapping models. This approach opens opportunities for multi-city analyses to further understand the spatial and temporal dynamics of urban growth and densification, and provides data to guide and evaluate the effects of policy that seeks to balance the need for housing our growing populations with maintaining healthy natural environments.
Keywords
Introduction
Development is constantly reshaping cities (Loorbach and Shiroyama, 2016). Much of this occurs at the property parcel-level, for example, single unit lots may be subdivided into multiple residences, or adjacent parcels in inner-city areas may be agglomerated to accommodate higher-density developments such as apartments or townhouses. Here, a parcel is defined as an urban land unit with clearly defined boundaries that typically reflect land ownership. This may range from a single homeowner to a strata-managed property comprising multiple single dwellings or stacked multi-storey apartments, as well as non-residential parcels. At the parcel-level, development impacts built form, intensity and land use altering the function and character of neighbourhoods (Dovey et al., 2017; Huang et al., 2023; Polidoro et al., 2012). Understanding the nature of change at a fine scale, and the cumulative impact these transformations have across the urban landscape, is critical for supporting desired governance outcomes.
To this end, identifying and monitoring different types of development provides the evidence needed to link changes to the built form with impacts on local environments, micro-climates, economic activity and quality of life (Lungman et al., 2024; Stewart and Oke, 2012; Zhang et al., 2023). Such monitoring requires multi-temporal maps of development type at the parcel-level to enable tracking of fine-scale changes over time. Often, studies characterising urban patterns classify spatial units at coarser scales than the property parcel or use information from multiple adjacent parcels (Bobkova et al., 2021; Fleischmann and Arribas-Bel, 2024; Fleischmann et al., 2022; Vanderhaegen and Canters, 2017), However, there is also a need for approaches that classify a parcel’s development type using only information from within the parcel’s boundary. This is necessary to identify fine-scale and localised changes required for monitoring policies that seek to promote increased land utilisation or evaluate infill targets and rezoning initiatives.
Urban classification studies often use metrics describing the composition, shape or configuration of urban elements that are derived from vector-based GIS data (Fleischmann, 2019; Schirmer and Axhausen, 2015). These metrics are subsequently organised in a tabular form and used as predictor variables in classification tasks (Berghauser Pont et al., 2019a; Fleischmann et al., 2022). However, as noted by Chen et al. (2021) within the context of mapping urban vitality, deep learning vision models can extract task-relevant predictive features from geospatial data that align with a human’s visual perception of images. This has relevance to parcel development type classification, as by visually examining schematic plans, or land cover maps, humans can discriminate between development types.
With supervision from human-generated labels, it is plausible that deep learning vision models could learn to discriminate between development types based on perceptual spatial features. Such deep learning-based extraction of visual elements from images could advance or augment urban classification approaches that primarily use vector geometry-derived metrics. This could manifest through the detection of spatial features not captured by a-priori computation of spatial metrics, thus providing more information for classification tasks. Deep learning systems are trained to extract task-relevant salient features which can help address the challenge of identifying spatial metrics best suited for classification. The use of deep learning vision models to extract visual features from geospatial data is achievable using imagery datasets such as those generated from satellite, aerial or street view captures (Chen et al.’s, 2021).
However, existing studies of urban morphometry frequently classify urban form based on vector data reflecting property parcels, building footprints or street networks (Berghauser Pont et al., 2019a, 2019b). This is partly motivated by the paucity of information describing other elements of the built form (Schirmer and Axhausen, 2015). However, over recent years city-scale geospatial data capturing intra-parcel detail for a range of built environment features such as impervious and vegetation covers has become widely available. These extra thematic details have the potential to augment traditional variables used in urban morphology studies and facilitate discrimination between types of parcel development. As these richer urban datasets become available, it’s necessary to consider how they can be incorporated into classification approaches that advance mapping of urban development types.
To date, myriad approaches have been used to classify development across multiple scales, using different urban features and input datasets, for a range of applications and use cases, and using different analytic techniques and class definitions. Often, classification approaches are developed for one or a small number of geographic contexts, with it being unclear how such approaches generalise to new locations. These differences preclude comparison across multiple studies and/or multiple cities, and hamper understanding urban development dynamics (Zhang et al., 2023). Deep learning models have proven amenable to transfer learning workflows where models trained in one (source) domain can be fine-tuned for application in another. In geospatial machine learning, this involves training a model in one location where there is abundant labelled data and fine-tuning for application in a label-scarce environment (Ma et al., 2024). There is a need to assess if deep learning models and transfer learning approaches are suitable for generalisable and scalable urban development mapping approaches.
Building on these research gaps, a deep learning model is presented that can learn from different modalities of parcel-level geospatial data to classify development types and is amenable to transfer learning workflows. These data modalities include (i) spatial features extracted from representations of a parcel’s configuration of built and natural cover and (ii) a suite of tabular metrics representing built form, surface covers and dwelling counts. This multi-modal model was compared to a range of classification approaches including unsupervised classification of plot and building footprint morphometrics unsupervised and supervised classification of parcel surface cover and built form tabular metrics. Given the varied analytic approaches and datasets used to classify urban areas and the different class definitions and typologies used to characterise development (Berghauser Pont et al. 2019a; Bobkova et al., 2021; Fleischmann and Arribas-Bel, 2022, 2024; Hecht et al., 2015; Kim et al., 2024; Vanderhaegen and Canters, 2017; Zhang et al., 2023), a comparative analysis of predictive mapping approaches is warranted to guide urban planning practitioners and future research efforts (Fleischmann et al., 2021; Zhang et al., 2023).
The comparative analysis presented in this paper focuses on (i) the ability of different models to classify a range of development type classes necessary to capture varying profiles and intensities of densification and sprawl and (ii) the ability of models to generalise for multi-city analyses. Each of the classification models considered here was assessed in terms of their performance in classifying a range of parcel-level development type classes relevant to urban planning applications. Using representative city-scale evaluation datasets, analyses were undertaken comparing each model’s capacity to accurately classify parcel-level development types for a focal city where there is abundant training data (Perth, Western Australia) and their ability to generalise to different cities naively and via transfer learning workflows (Melbourne, Sydney, Brisbane and Adelaide). Section A of the Supplemental Material describes the urban development characteristics of Perth and provides the geographic location of all Australian cities included in this study. Finally, city-scale deployments of the multi-modal deep learning model are demonstrated across a range of parcel development type mapping applications.
Datasets
Surface cover and built form data
Spatial metrics used to describe each parcel.
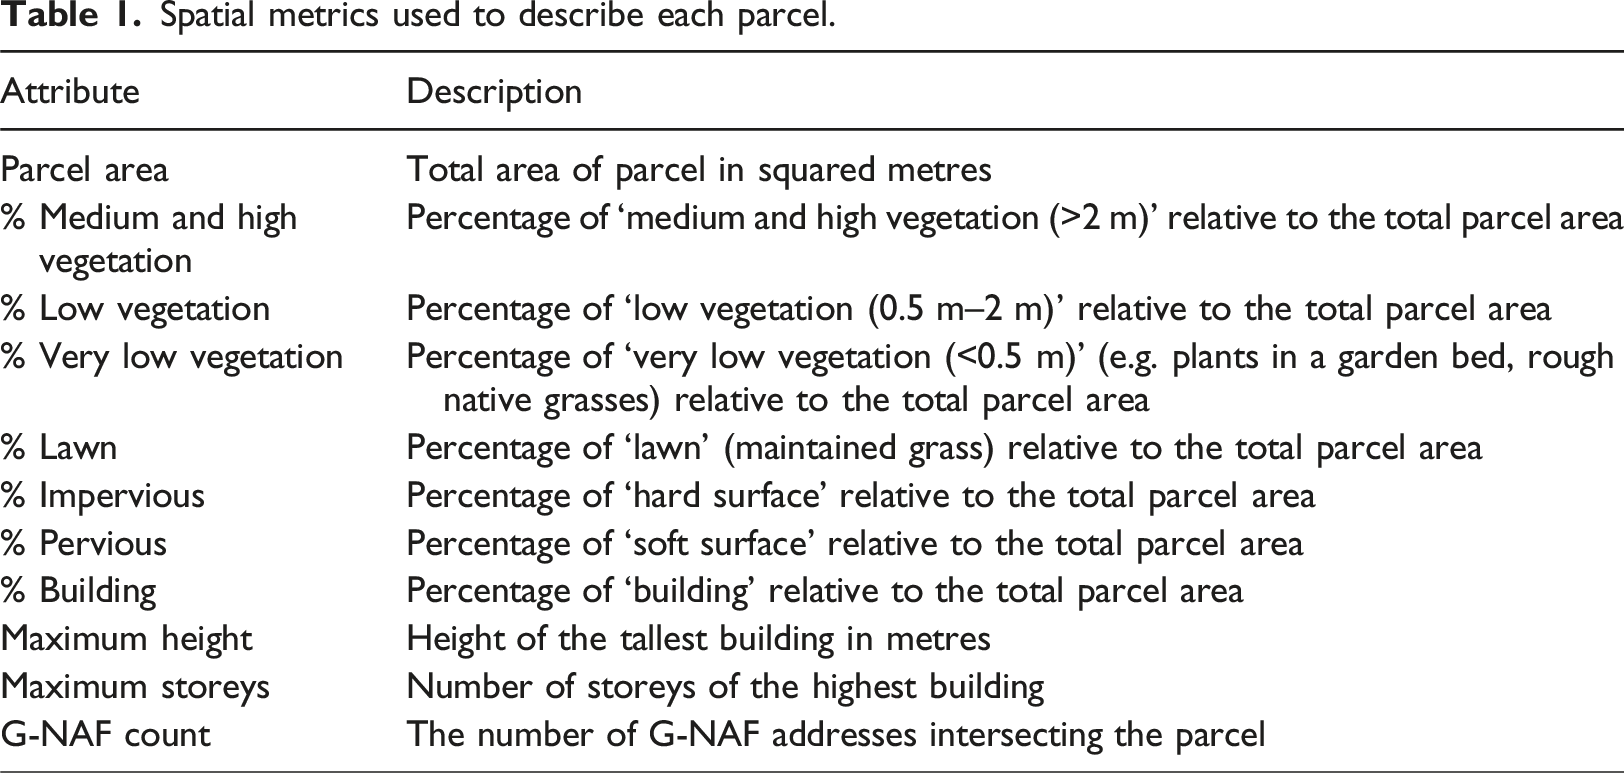
Property parcel layers
For each city, and for time points matching the acquisitions of Nearmap AI data, property parcel data was obtained by processing the relevant state’s cadastral datasets (see Section B of the Supplemental Material for the cadastral databases’ sources) to extract residential properties, vacant lots with development potential or built-up parcels with non-residential uses. Additionally, the number of addresses in each parcel was computed from a temporally matched Geoscape Geocoded National Addresses File (G-NAF) database (Geoscape Australia, 2024) and included in the tabular metrics (Table 1).
Development type classes
Description of each development type class.
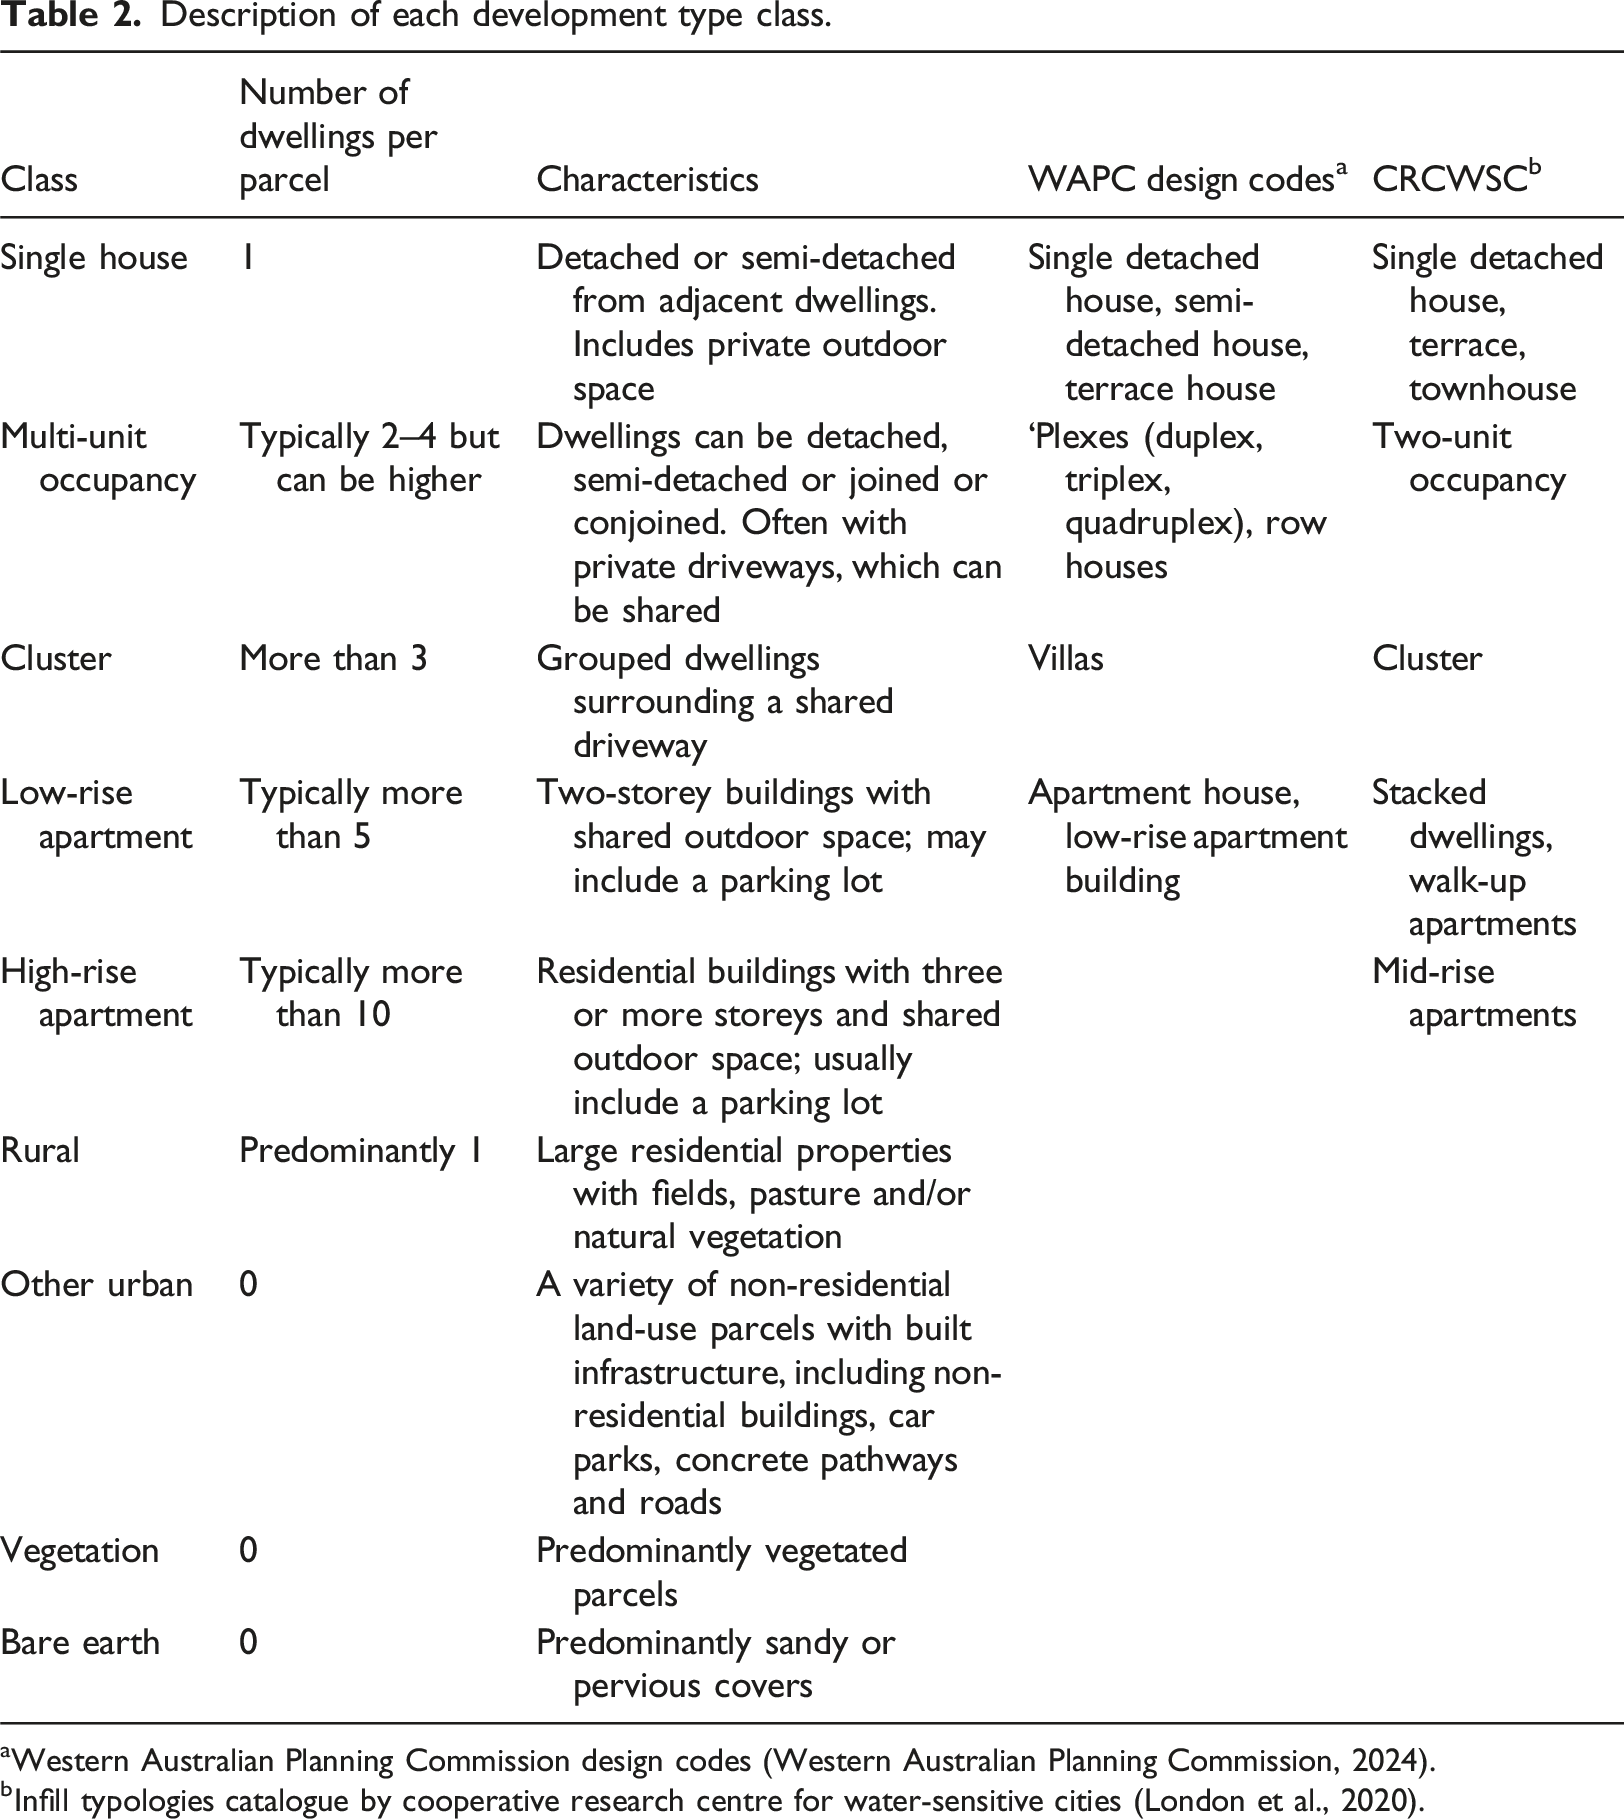
aWestern Australian Planning Commission design codes (Western Australian Planning Commission, 2024).
bInfill typologies catalogue by cooperative research centre for water-sensitive cities (London et al., 2020).
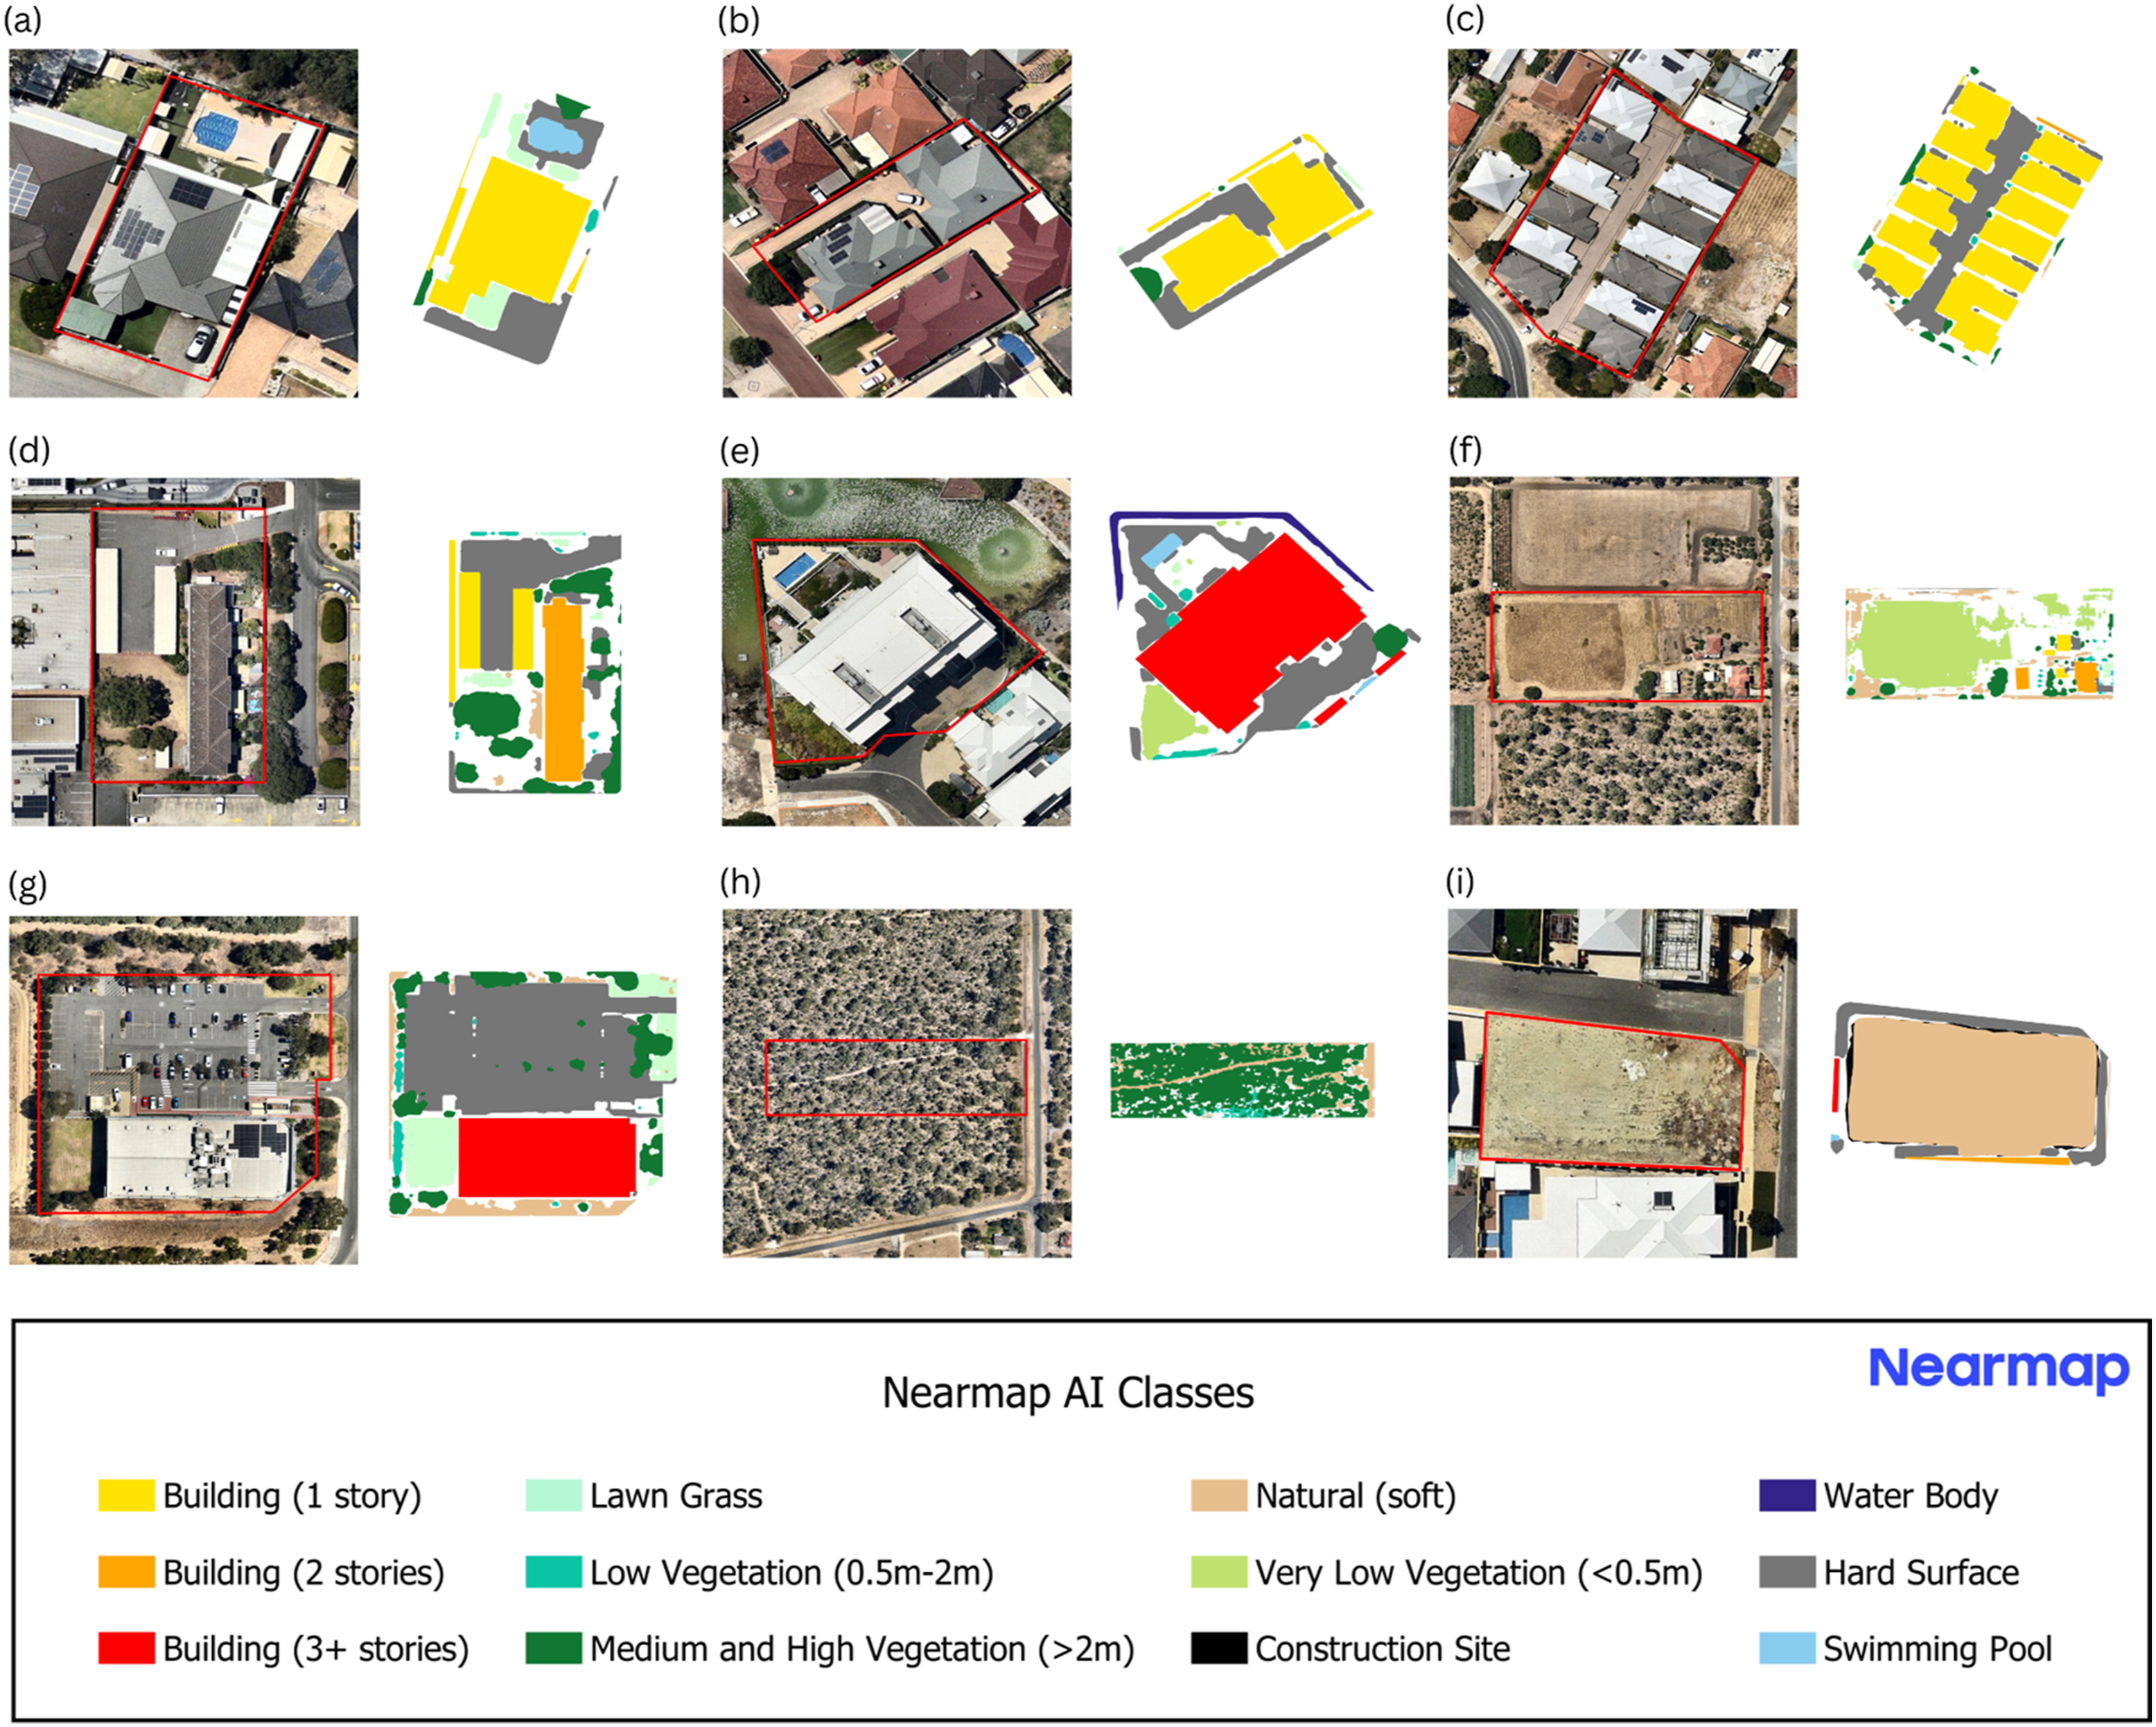
Examples of Nearmap aerial RGB images (left) and Nearmap AI vector surface cover and built form images (right) for each development type: (a) single house; (b) multi-unit occupancy; (c) cluster; (d) low-rise apartment; (e) high-rise apartment; (f) rural; (g) other urban; (h) vegetation and (i) bare earth. Parcel boundaries are indicated by red outlines. Nearmap RGB aerial images and Nearmap AI vector data are date-matched, both from 18th January 2023.
Ground truth datasets
A ground truth dataset of 69,403 parcels sampled from Perth was created and split into training, validation and test datasets, which contained 43,656, 12,256 and 13,491 parcels, respectively, for Perth model training and evaluation. To evaluate the model’s transferability to other localities outside of the training domain, a total of 14,578, 10,135, 12,888 and 15,803 parcels were sampled from Melbourne, Sydney, Brisbane and Adelaide, respectively, to form the transfer cities’ test datasets. Further, a smaller sample of parcels that were out-of-distribution from the Perth training data were selected from each transfer city using the approach following Meyer and Pebesma (2021) to form the fine-tuning dataset, which comprised a sum of 3340 parcels and was used to fine-tune the Perth model. A multi-step sampling approach was developed to ensure parcels across different land-use types and dwelling densities were selected (see Sections B–D in the Supplemental Material for more details on the sampling approach and summary tables for each dataset). All sampled parcels were manually labelled via visual inspection of temporally matched land cover maps (Nearmap AI) and high-resolution aerial images (Nearmap RGB aerial images). If a parcel’s label was ambiguous, its label type was resolved through review by multiple analysts.
Methods
Multi-modal deep learning model
Using the Perth training dataset and the transfer cities fine-tuning dataset, a range of machine learning models were trained to classify a property parcel’s development type. Specifically, each model was trained on the Perth training dataset and then its parcel development type classification performance was evaluated using test datasets for each of the five cities considered here. This allowed for the assessment of how well different models perform in a focal city where training data is abundant (i.e. the Perth example here) and how well models trained in one city generalise to others (i.e. evaluating the Perth model in different Australian cities). Next, each model was re-trained or fine-tuned using a combination of the Perth dataset and the other cities’ fine-tuning dataset. This exercise assessed how well a model generalised to a new city via transfer learning workflows or when a small amount of data from the target city was available to retrain the model.
The main model under consideration here was a custom multi-modal deep learning model that classifies a parcel’s development type by learning to extract (i) visual predictive features from geospatial data representing surface cover and built form elements within a parcel and (ii) tabular predictive features from metrics summarising parcel attributes. This model was benchmarked and compared against a range of other machine learning models that align with approaches presented in the literature for mapping urban development. These other machine learning models include a deep neural network, random forest and unsupervised classifier (k-means) trained using built form and surface cover tabular metrics, and unsupervised classifiers trained using urban morphometry metrics. The implementation details of these models are described in Section E of the Supplemental Material.
A multi-modal deep learning architecture (DL) was developed that combined a Swin vision transformer to learn predictive visual spatial features from colourised representations of built and natural elements within a parcel and a fully connected neural network (FCNN) to learn from tabular inputs of metrics describing parcel surface cover, built form and dwelling attributes. This study used a Swin Transformer V2 architecture for the vision component of the model (Liu et al., 2022). A schematic of the multi-modal model architecture is presented in Figure 2. Multi-modal model architecture combining images and tabular data to output a probability distribution across the development classes.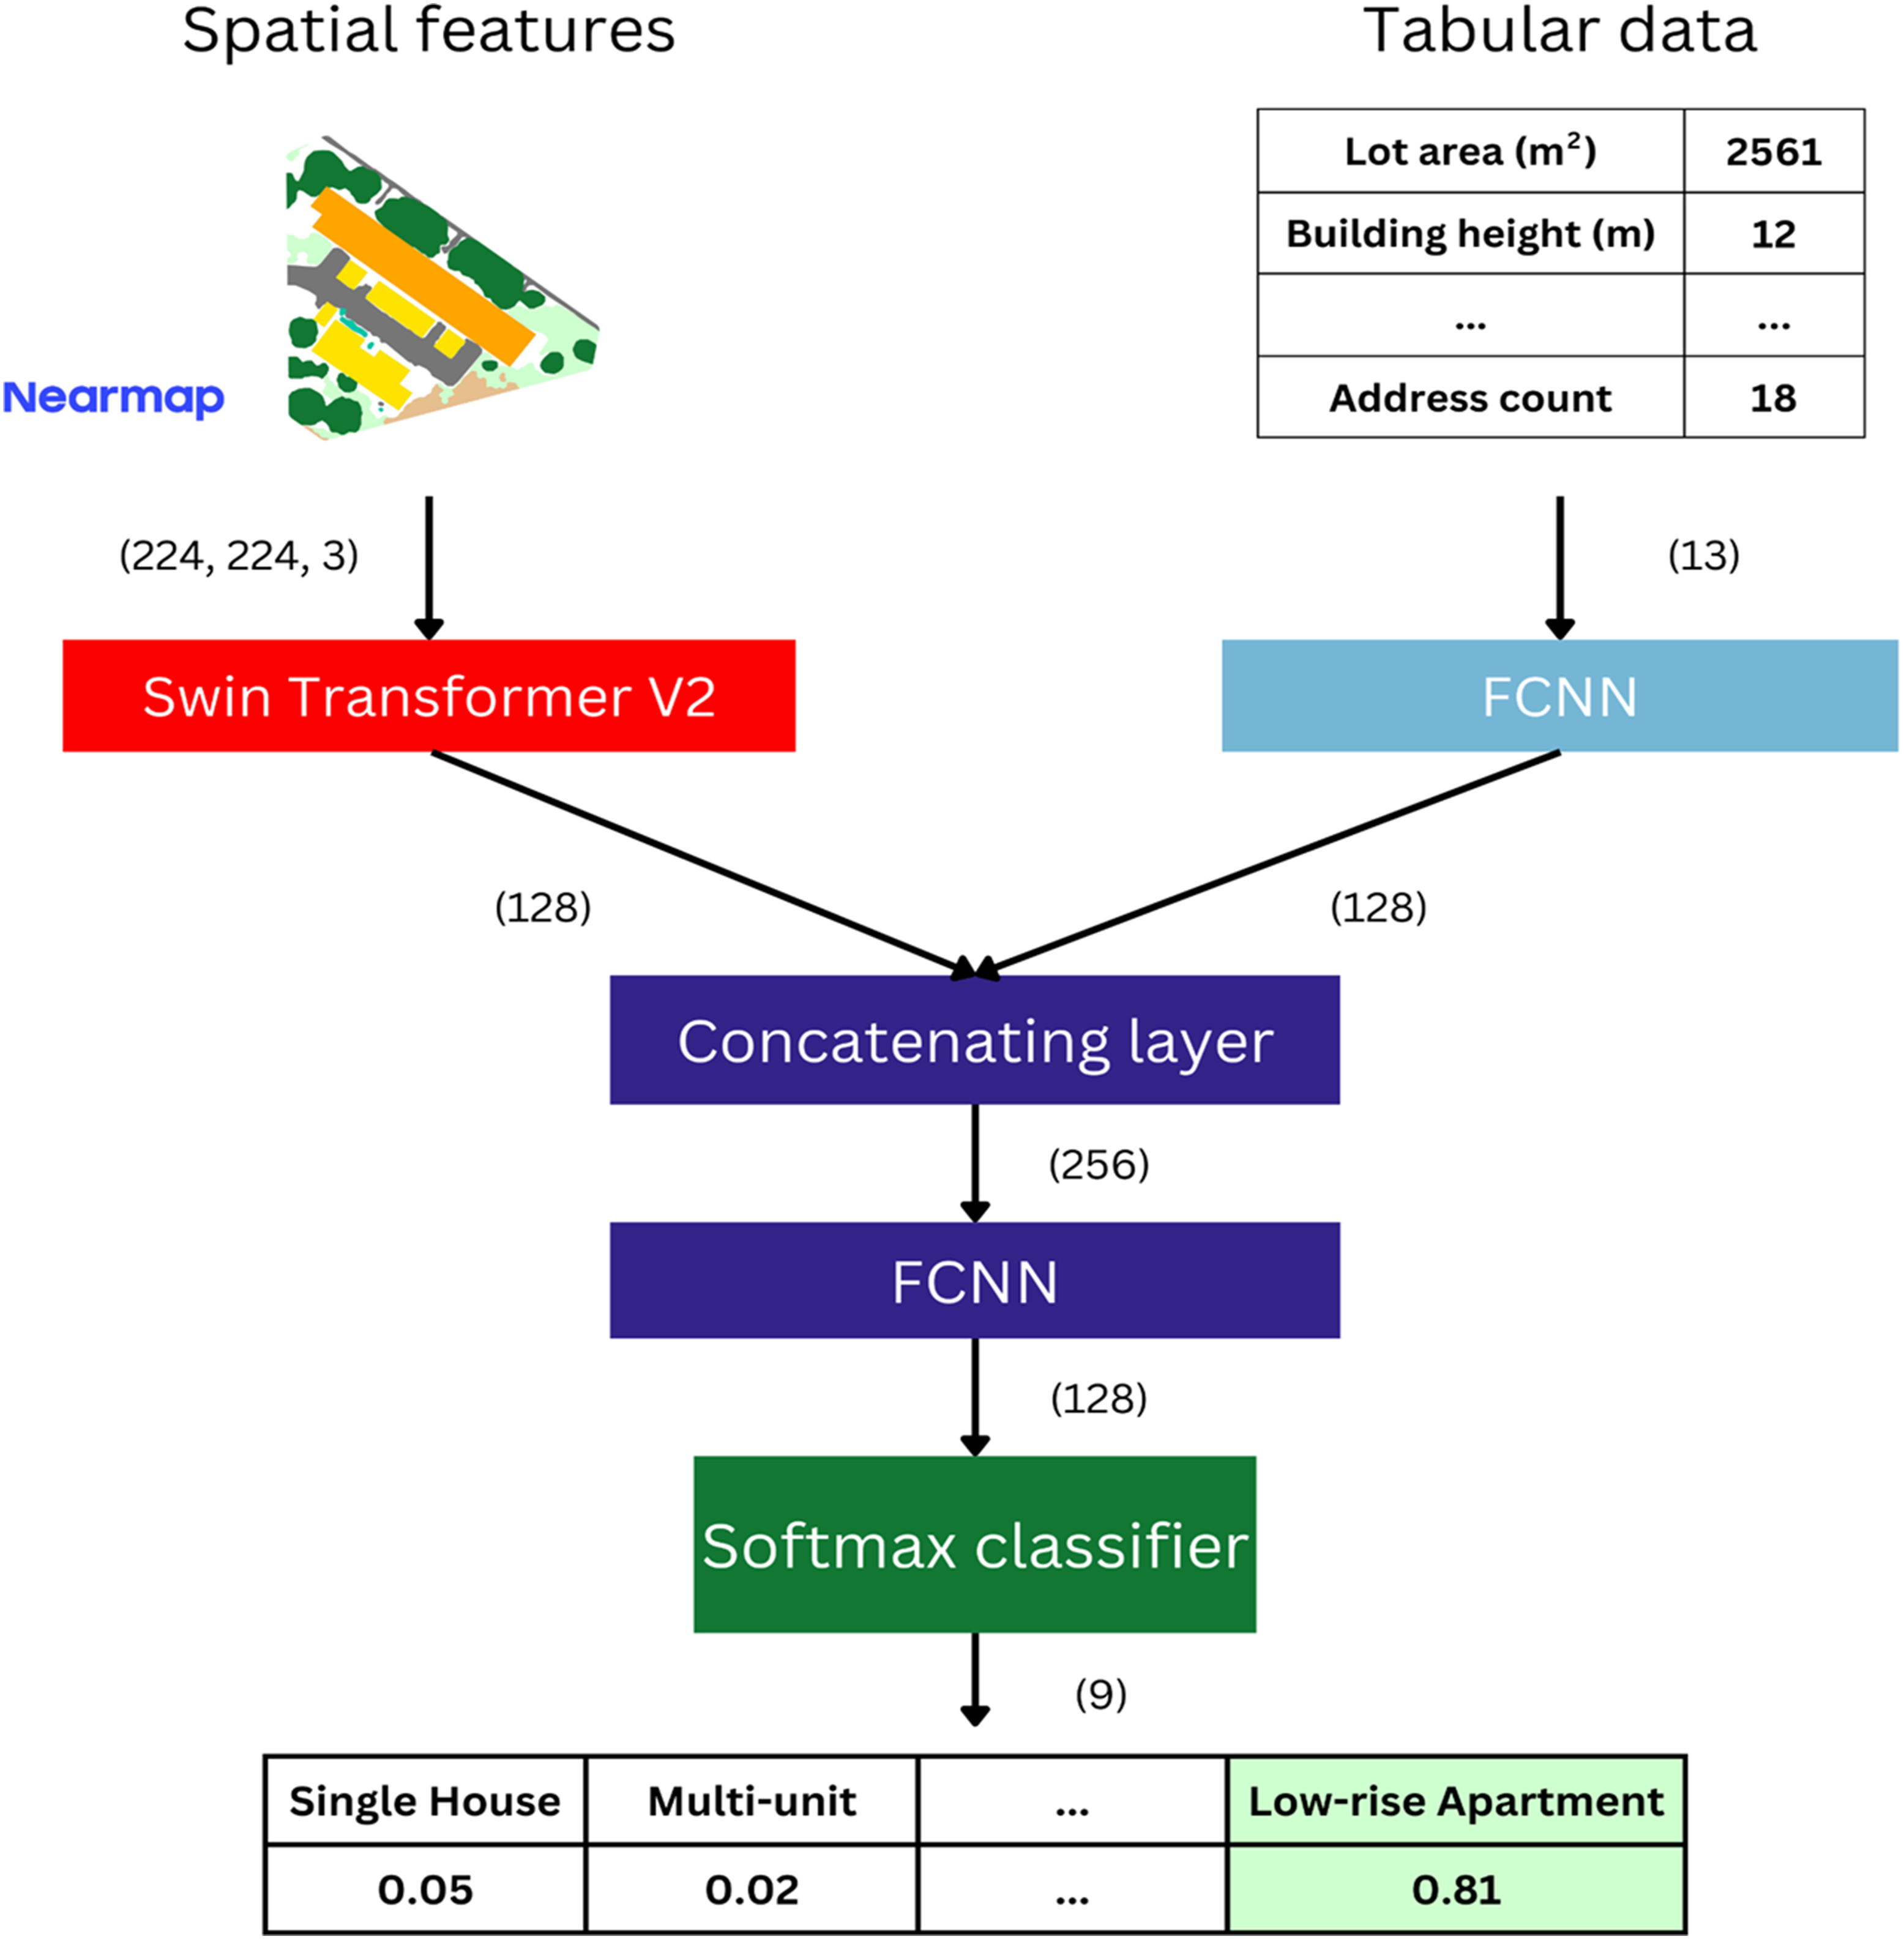
The multi-modal model (Figure 2.) was trained to classify the development type of parcels using the Perth training and validation datasets. The Swin Transformer V2 was initialised with ImageNet weights and fine-tuned using Low-Rank Adaptation (LoRA). All weights in the FCNN layers that process the tabular metric inputs and all weights in the final classification FCNN layers were randomly initialised and learnt from scratch during model training. The ADAM optimiser was used with an initial learning rate of 0.001, followed by a gradual decay scheduled by cosine annealing (Kingma and Ba, 2017). A weighted cross-entropy loss function was used with losses weighted by the inverse of the class sample frequency relative to the total number of samples, due to the imbalance between classes in the training dataset. The model was trained for 20 epochs with a batch size of 32. During training, random horizontal and vertical flips were applied to images to enhance the model’s robustness to images with different orientations. The model weights from the epoch with the lowest validation loss were saved and used for evaluation. The Perth model was adapted for use in other cities via transfer learning by updating its weights via LoRA using the other cities’ fine-tuning dataset and training for 5 epochs with an initial learning rate of 0.001 and a cosine annealing scheduler.
Model evaluation
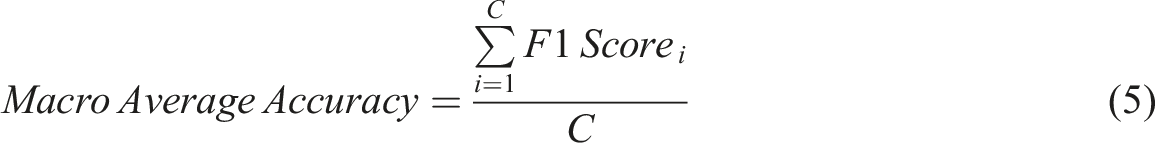
The performance of the models was assessed using a range of metrics. The Perth test dataset was used to evaluate models trained with Perth training data. The other cities' test datasets were used to evaluate both the original models and the fine-tuned/re-trained models to assess how well the models transfer to locations outside the training data. For each class, the recall, precision and F1-score were calculated using equations (1)–(3), respectively. These provided an indication of the model’s performance for individual development type classes. To summarise the model’s overall performance, the accuracy and macro average F1-score were computed using equations (4) and (5), respectively. Additionally, overall and per-class top-2 accuracy were computed to assess if the correct development type label was in the model’s top two class probability scores.


Results
Evaluation results – focus city: Perth
Evaluation of models on Perth test dataset using F1-scores and accuracy metrics (overall, macro-average accuracy and top-2 accuracy), with the number of samples per class shown in parentheses.
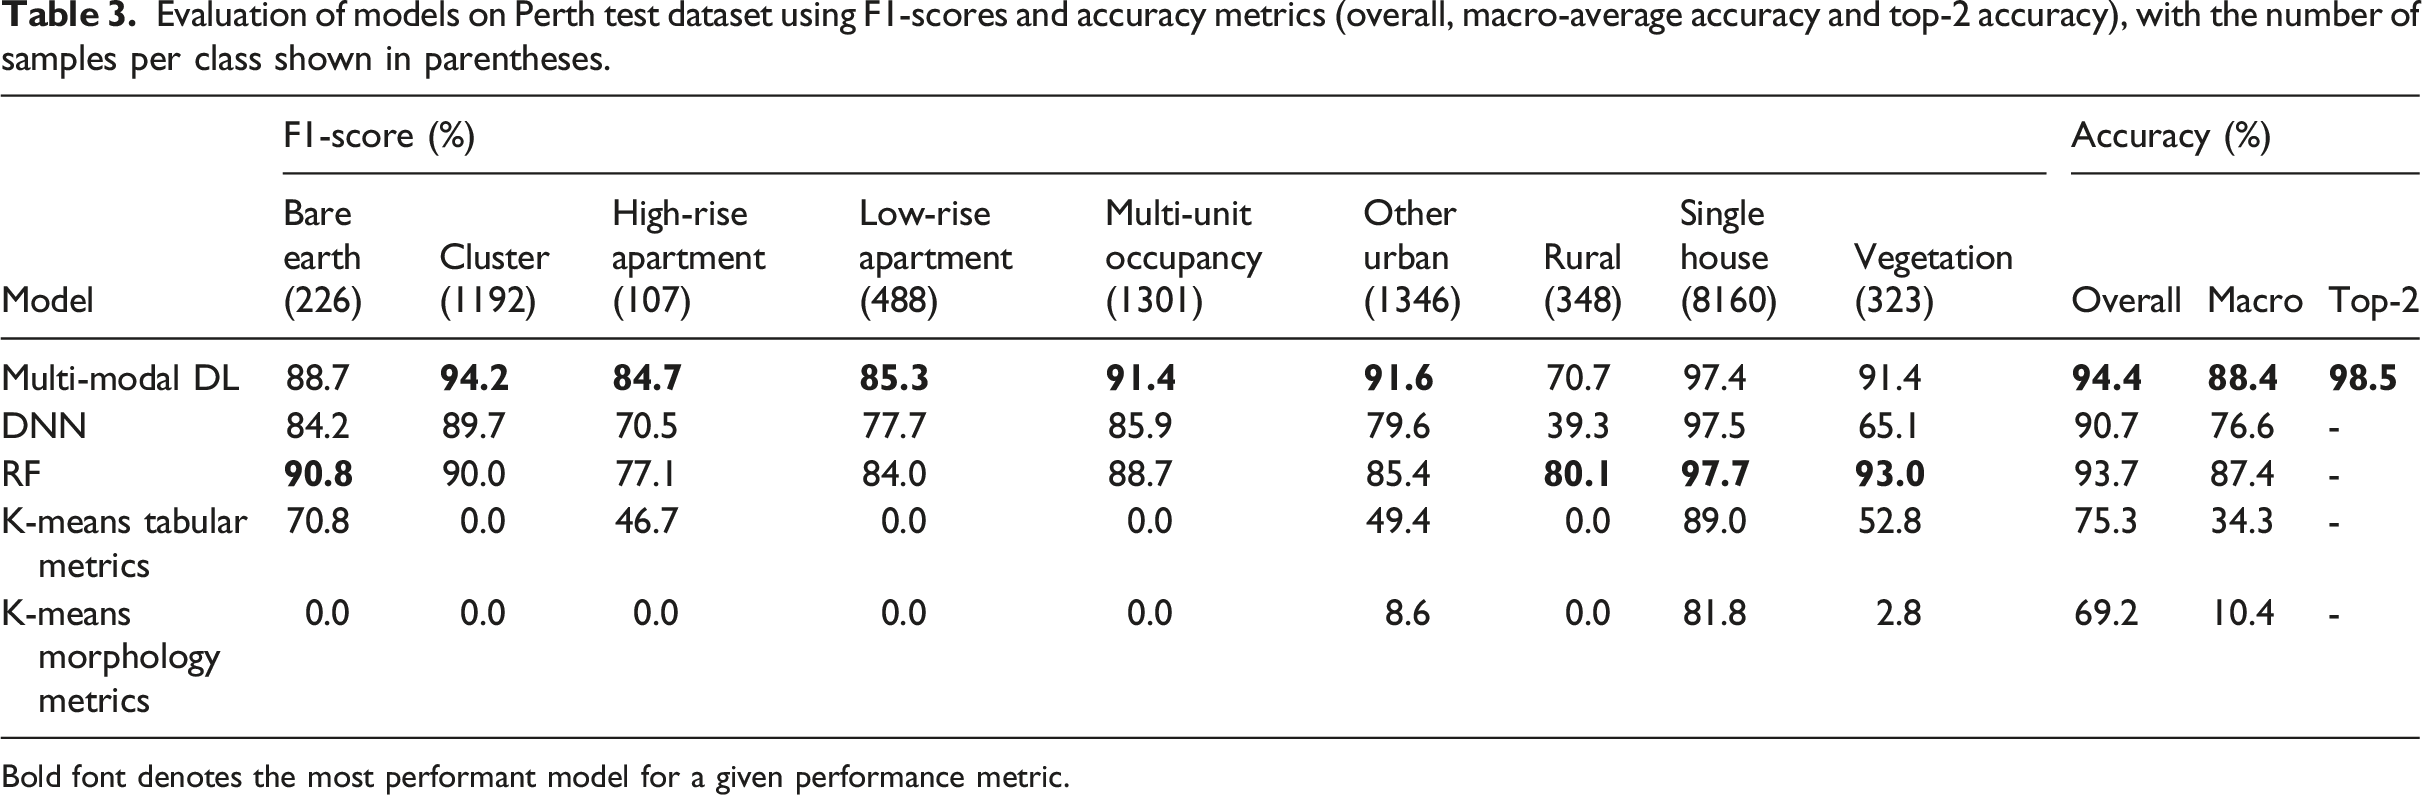
Bold font denotes the most performant model for a given performance metric.
The multi-modal deep learning model was more accurate in classifying development types with distinct visual characteristics, such as clusters of dwellings, multi-units, low-rise and high-rise apartments, compared to the random forest and tabular deep neural network model (Table 3). This indicates that the vision component of the multi-modal model, which can extract visual spatial features for prediction, aids in the classification of certain development types.
The groupings generated by the k-means algorithms did not align well with the development type classes (Table 3). These performance metrics are not reflecting the k-means algorithm’s ability to cluster the dataset into groups, just that the cluster groups do not align well with pre-determined development type classes. This drop in classification performance, relative to the supervised models, is to be expected as the supervised models have been trained to directly classify the development type classes in the test set.
Evaluation results – transfer to other cities
Evaluation of models on Melbourne, Sydney, Brisbane and Adelaide test datasets using overall accuracy, macro average accuracy and top-2 accuracy.
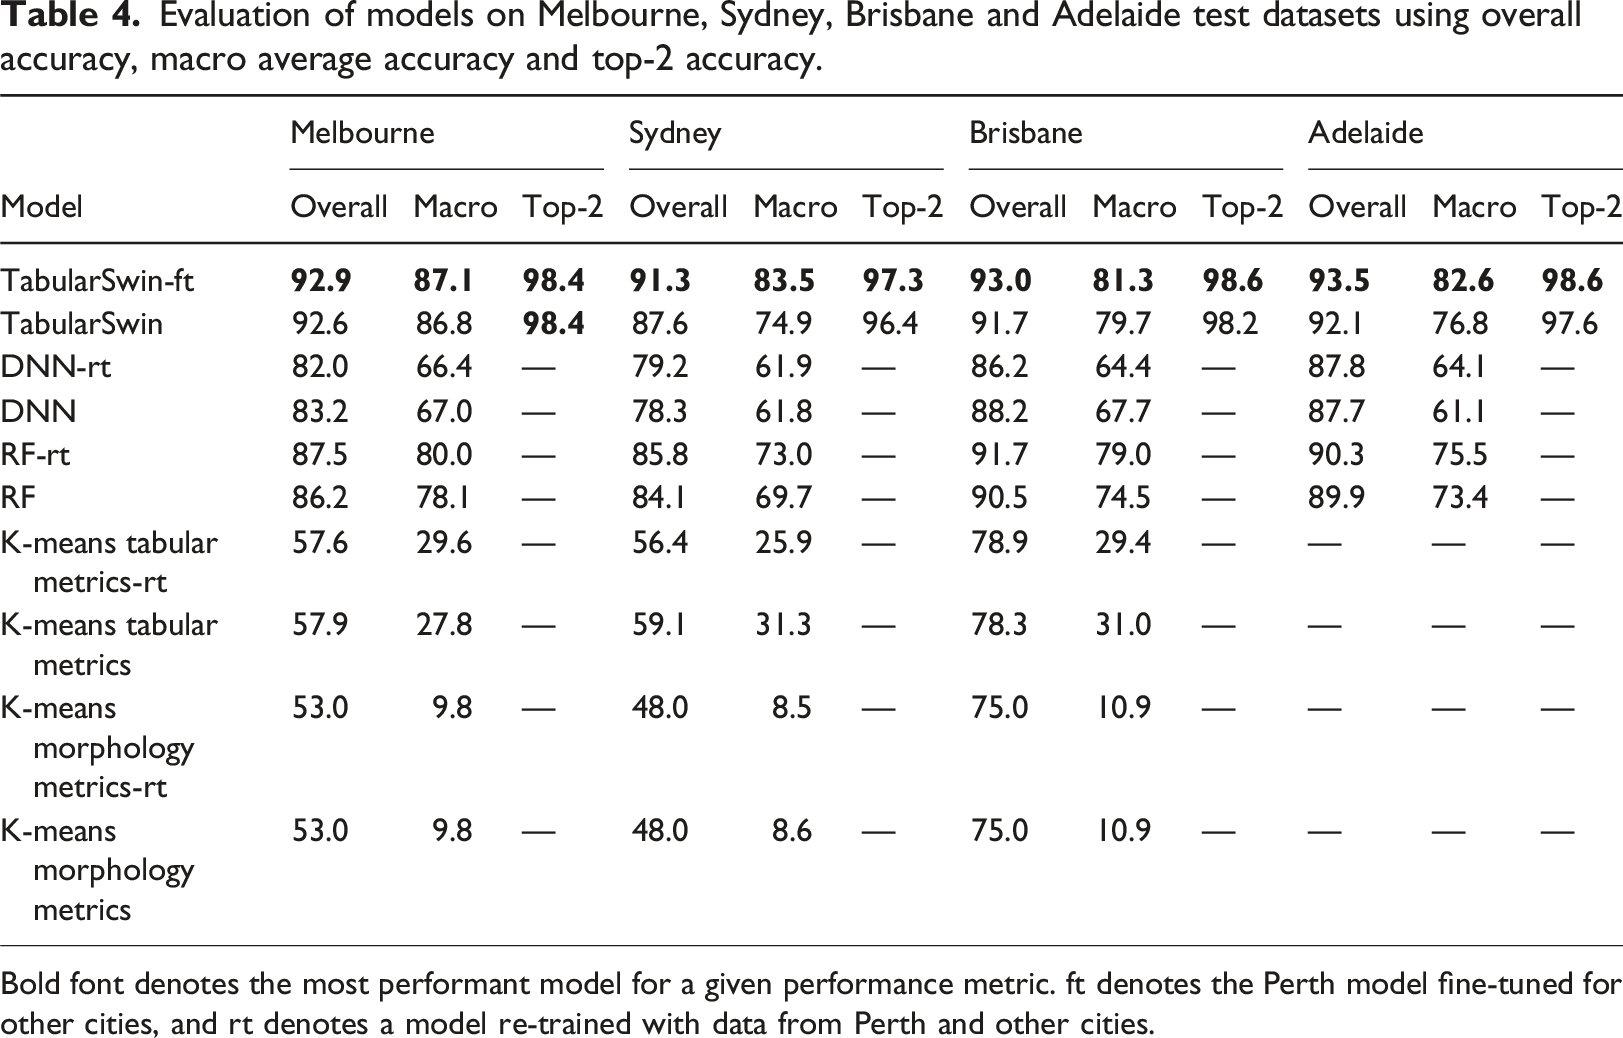
Bold font denotes the most performant model for a given performance metric. ft denotes the Perth model fine-tuned for other cities, and rt denotes a model re-trained with data from Perth and other cities.
Fine-tuning with out-of-distribution parcels sampled from the other cities improved the predictive performance of the multi-modal deep learning model relative to the Perth model (Table 4). This improvement through fine-tuning was observed for the overall accuracy, macro average accuracy and in the precision, recall and F1-scores for most development type classes (Table 4 and Section F of the Supplemental Material).
Development type mapping applications
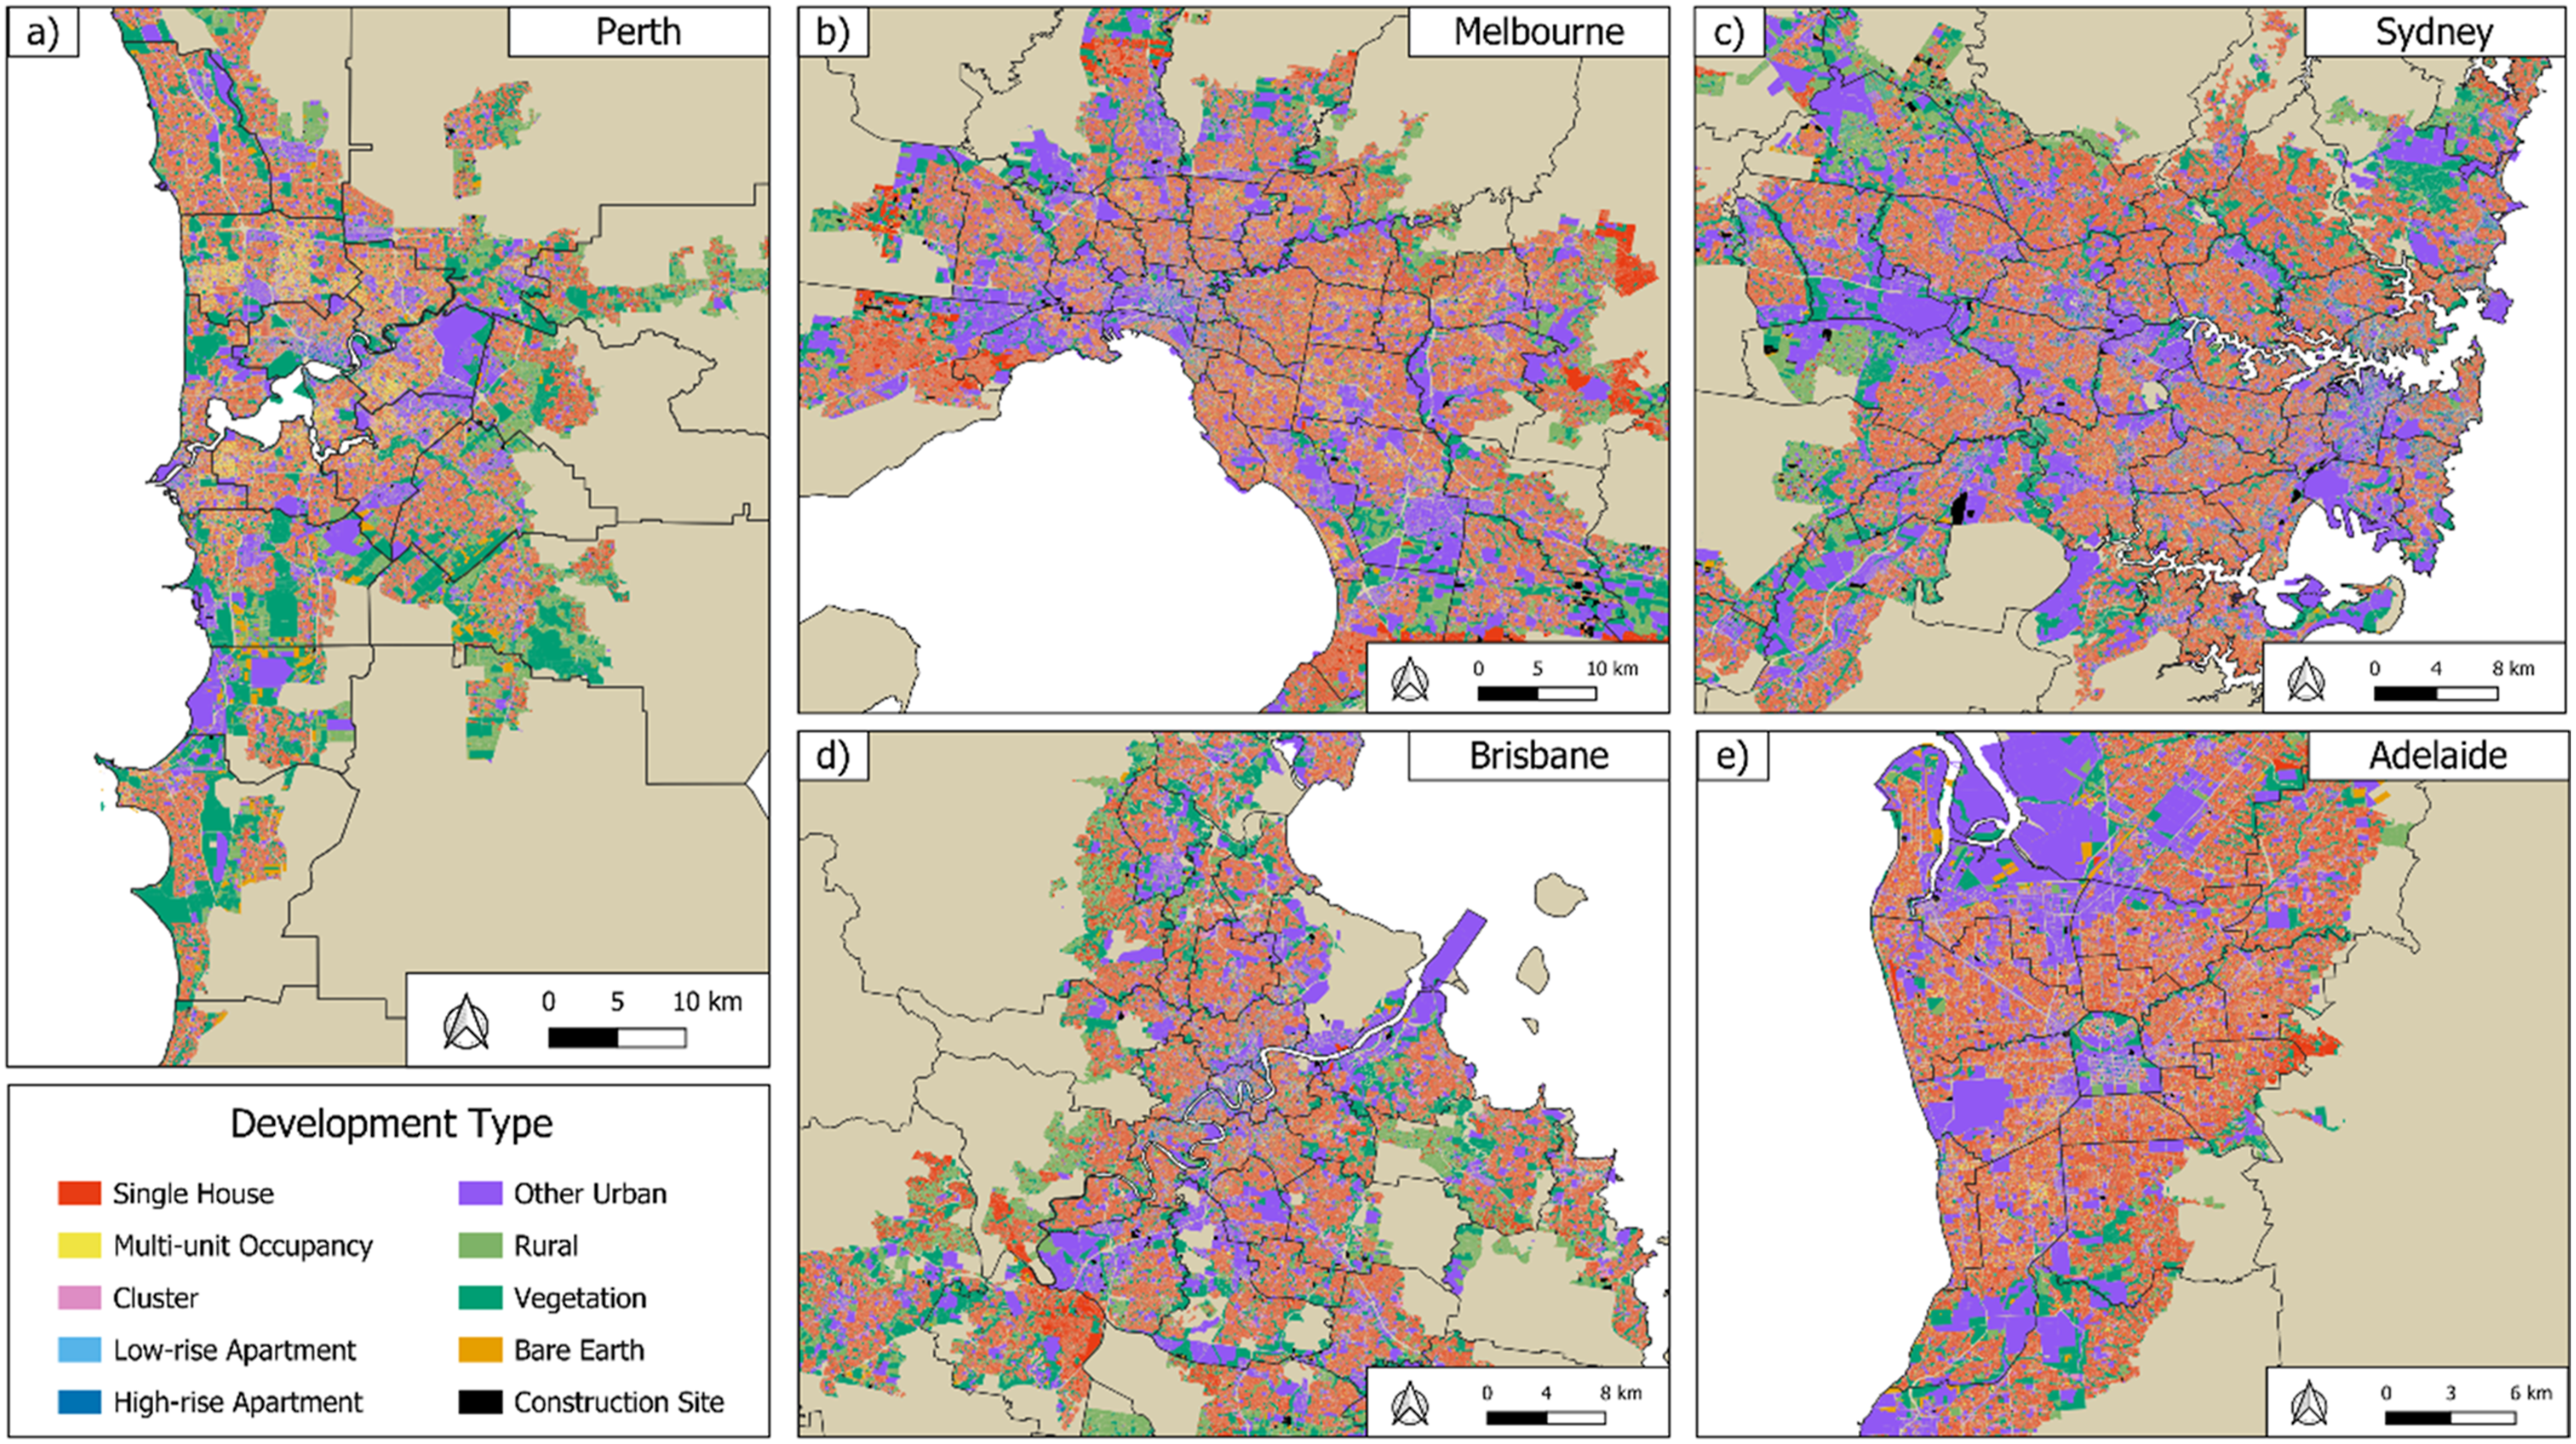
The multi-modal deep learning model achieved the highest overall accuracy for Perth and the fine-tuned multi-modal deep learning model had the highest accuracy for other cities (Tables 3 and 4). These models were used to classify every property parcel across each city to evaluate their performance in applied mapping settings. Figure 3 demonstrates the Perth model’s capacity to capture fine-scale variability in development types in Perth (Figure 3(a)). The fine-tuned model’s ability to transfer to other Australian cities is also showcased with case studies from the transfer cities: mixed-density developments in Melbourne (Figure 3(b)), a large-scale high-rise apartment complex in Sydney (Figure 3(c)), rows of low- and high-rise apartment buildings in Brisbane (Figure 3(d)) and blocks of large-scale clusters interspersed with non-residential parcels in Adelaide (Figure 3(e)). The multi-modal deep learning model can be deployed for entire cities to create wall-to-wall maps with parcel-level detail that captures broader-scale patterns of development (Figure 4). Examples of development type classification by the Perth model in (a) Balcatta, Perth, and fine-tuned model in (b) Carnegie, Melbourne; (c) Forest Lodge, Sydney; (d) St. Lucia, Brisbane; (e) and Unley-Parkside, Adelaide, using input data from February 2023. The basemap images are Nearmap RGB aerial images date-matched to the Nearmap AI vector data used to classify the parcel’s development type. Model deployment for (a) Perth; (b) Melbourne; (c) Sydney; (d) Brisbane; and (e) Adelaide using input data from February 2023. Black line shows the SA3 boundary.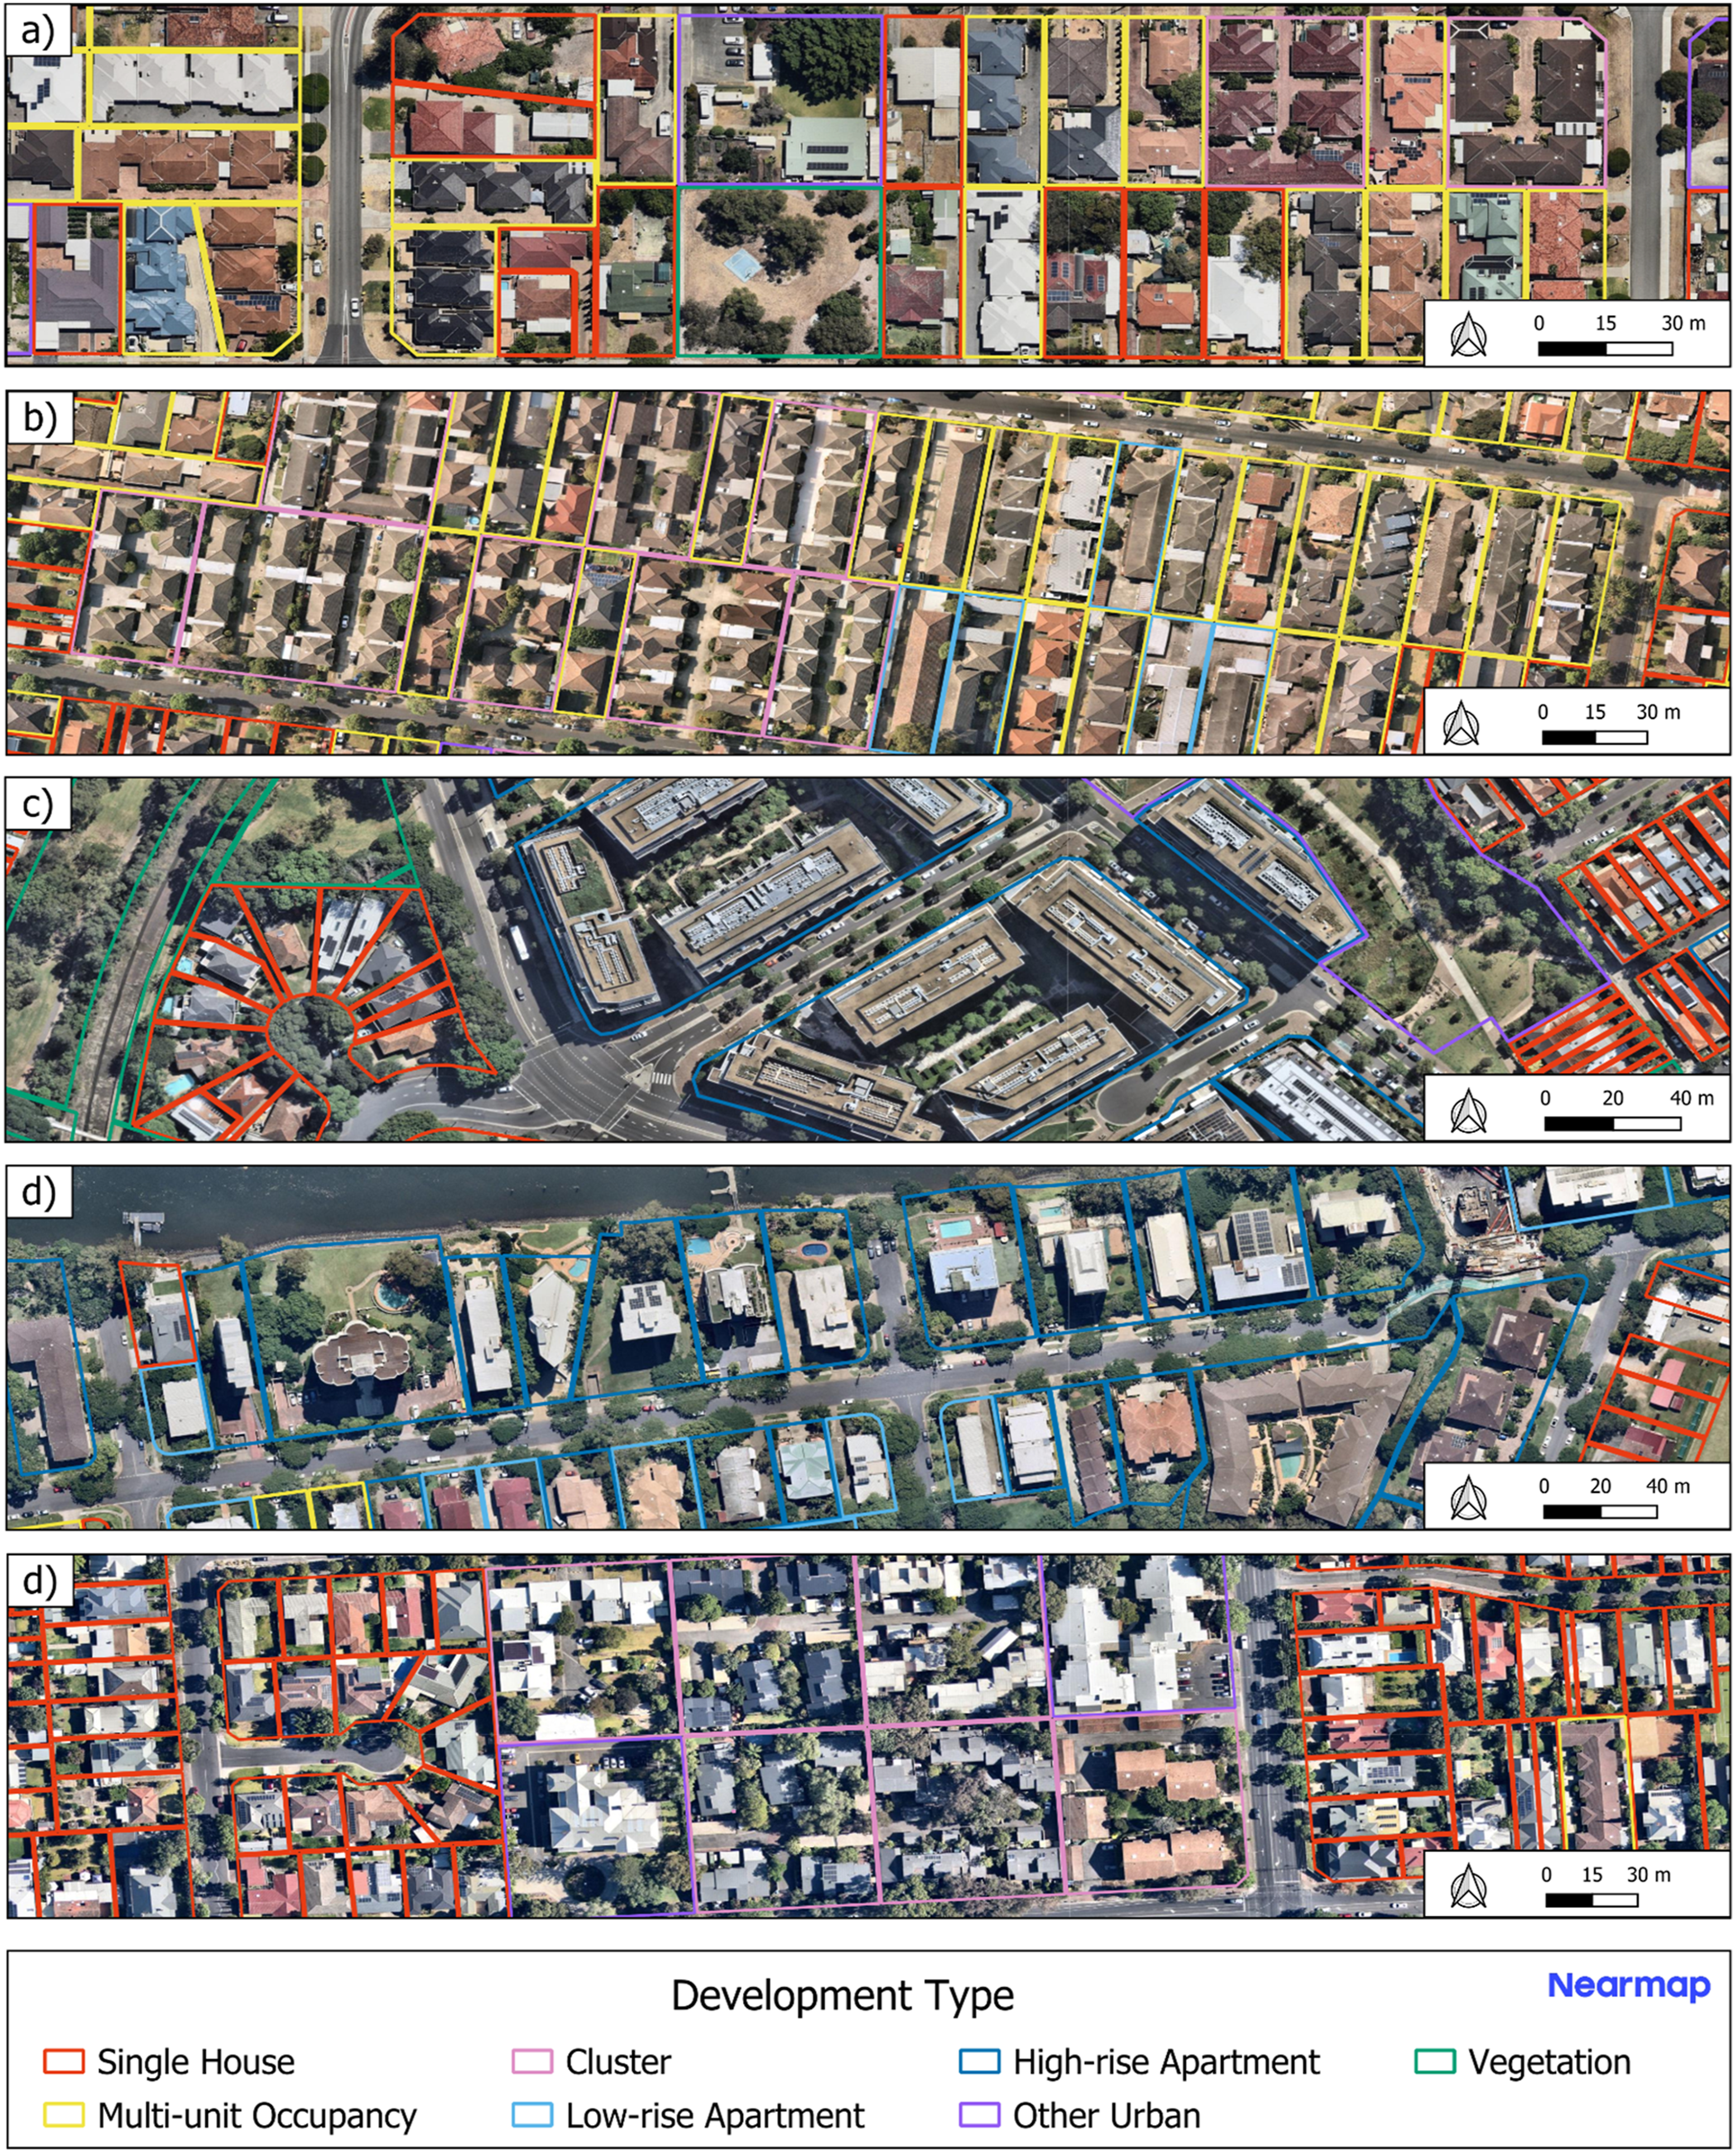
With input data spanning two time points, the multi-modal model effectively detects changes in development type over time. Figure 5 presents an example of a city-level change analysis illustrating how development in the form of multi-unit occupancy has progressed throughout the city between 2019 and 2023. The model’s raw outputs provide a queryable database of development type parcel points (Figure 5(a) and (c)), which can be aggregated by Statistical Area 1 (SA1) to produce heat maps (Figure 5(b) and (d)). This enables a detailed investigation into the spatial pattern of a specific development type over time (Figure 5(e)). Maps of Perth suburbs in 2019 and 2023 showing different types of development: (a) high-rise apartment and (b) low-rise apartment at the parcel level; (c) multi-unit occupancy and (d) single house at the SA1 level with heat maps showing counts and difference between the 2 years. The basemap images are Nearmap RGB aerial images date-matched to the Nearmap AI vector data used to classify the parcel’s development type. Black solid line indicates the SA3 boundary.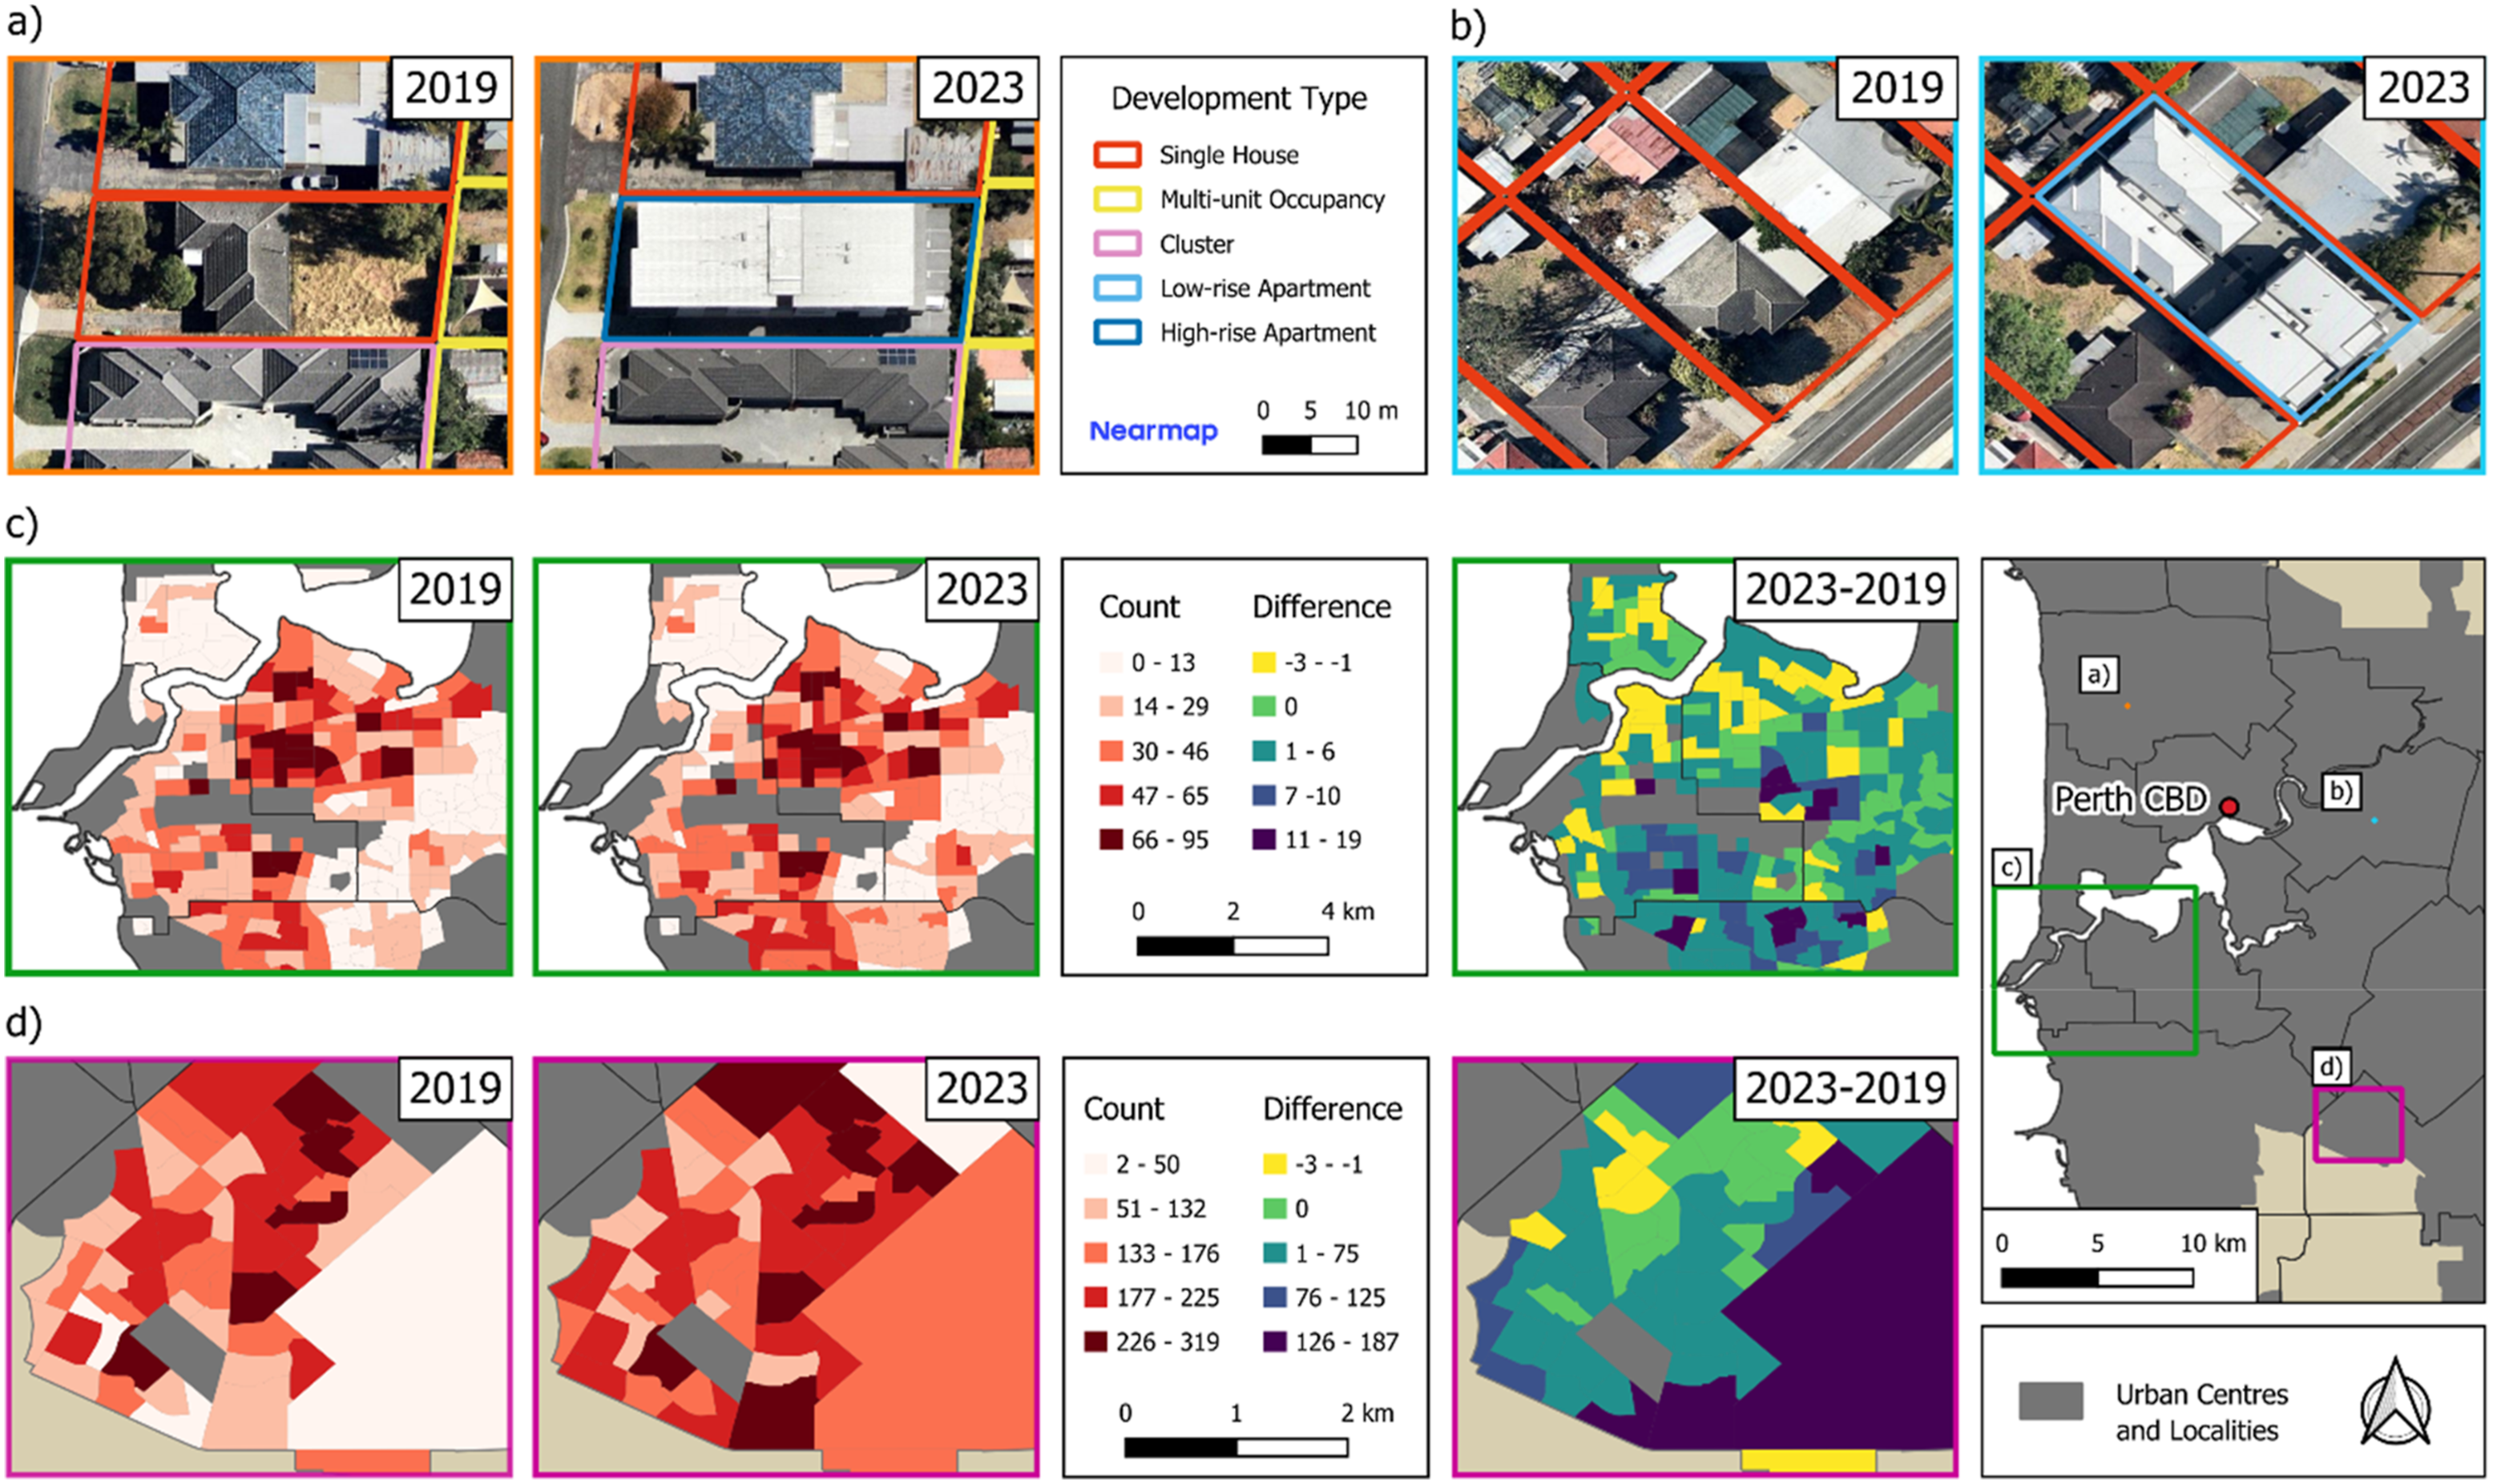
Discussion
The results presented here demonstrate that multi-modal deep learning models, primarily trained in one location with abundant training data, can generalise to other cities to map parcel-level development types (Table 4 and Figure 4). These maps can characterise fine-scale variability in development types between parcels (Figure 3) and capture urban patterns at the city-level (Figure 4). Figure 5 demonstrates how static development type classes can translate into dynamic urban processes, including high-density infill through apartments (Figure 5(a) and (b)), low-density infill through multi-unit developments (Figure 5(c)), and greenfield expansion through new single houses (Figure 5(d)). This highlights the model’s ability to monitor various forms of urban development over time. This data is relevant to a range of urban applications such as evaluating the effect of planning and policy on on-the-ground development, monitoring city expansion and infill targets, providing input layers to urban growth forecasting, and attributing changes in surface cover and built form to different development types. As cities increasingly contend with challenges of growing populations and meeting subsequent housing demand while being cognizant of environmental and sustainability goals, these maps contribute rich data to guide the navigation of these trade-offs (Ehrhardt et al., 2023, 2025; Wellmann et al., 2020; Zhang et al., 2023).
The multi-modal deep learning model only trained on data from Perth had high accuracies when evaluated in other cities and was more accurate than tabular-only random forest and deep neural network models that were developed with training data from other cities (Table 4). This implies that the multi-modal deep learning model, with its capacity to extract visual spatial features and leverage multiple sources of data, learnt predictive features that generalise across geographic contexts. Potential explanations for this are (i) the nature of supervised training teaching the model to learn salient task-relevant spatial features for prediction and (ii) the relationship between visual features and development types generalises better than learnt rules mapping a tabular metric value to a class label.
Fine-tuning the Perth multi-modal deep learning model with a smaller sample of data points from other cities further improved the model’s performance and capacity to generalise to new locations (Table 4). This indicates that algorithms developed for predictive urban mapping in locations with abundant training data can be applied to other locations via transfer learning. For example, if a model is trained for a specific project but opportunities to use the model in different locations arise where resources for model development are lacking. This use of transfer learning with deep learning models can help address noted challenges regarding generalisability of models that map urban form from one location to another.
Across most development type classes and different cities, the multi-modal deep learning model tended to be the most accurate as indicated by the F1-scores, precision, and recall metrics (Table 3 and Section F of the Supplemental Material). Of note, is the higher accuracy of the multi-modal deep learning model for classes that have visually distinct characteristics such as clusters, where multiple dwellings are arranged around a shared driveway, and low-rise apartments, which often consist of a two-storey elongated building and an adjacent car park. This indicates that the multi-modal deep learning model, which learns predictive visual spatial features, is suited to discriminating between these development types. In Perth, where the multi-modal deep learning model and the random forest model had similar overall accuracies (Table 3), the multi-modal deep learning model was more accurate in classifying high-rise apartments, low-rise apartments, clusters and multi-units, which all represent multiple dwellings on a parcel via different building configurations. Discriminating between these classes is important for many urban applications, such as characterising patterns of infill and densification, which highlights the suitability of multi-modal deep learning models for predictive mapping of parcel development types.
The poor correspondence between groupings in the data generated via the k-means algorithm and development type classes illustrates a well-known challenge with using unsupervised algorithms to generate specific classes for an application (Tables 3 and 4). This highlights the importance of labelled training data to develop application-relevant predictive mapping algorithms and the benefits of transfer learning approaches, such as the example presented here (Tables 3 and 4). However, recent advances in large deep neural network image-to-text models and geospatial foundation models suggest possibilities for leveraging remotely sensed and geospatial data for urban mapping applications when training data is scarce. Such models are trained without task-specific labels but can synthesise geospatial data into useful variables for downstream analysis tasks. For example, image-to-text models can be provided with a remote sensing image and a text prompt to perform a range of analysis tasks including counting or segmenting urban features or describing a scene (Yao et al., 2025; Yuan et al., 2025). Geospatial foundation models, such as AnySat, are trained in a self-supervised manner to convert multiple modalities of geospatial data into numerical summaries of a location that can be used as predictor variables for a range of analysis tasks (Astruc et al., 2025). Such models have relevance in cases where large volumes of geospatial data are available but where insufficient labelled data to train task-specific deep learning models exists. With advances in large deep learning models and growing availability of city-scale geospatial databases, further research is warranted to understand how such models can be used for predictive urban mapping in label-scarce settings.
This detailed evaluation and model comparison signals opportunities for further developing multi-modal models for development type mapping. The Perth multi-modal deep learning model’s classification performance was noticeably lower for the rural class (F1-score of 70.7; Table 3). The random forest model, which did not use visual features, had higher accuracies for the rural class over Perth (Table 3). This could be because the random forest model primarily discriminates rural parcels based on parcel area, whereas the multi-modal deep learning model extracts spatial features to make predictions which could be confused with similar vegetative features apparent in urban vegetation parcels or on larger single-unit lots. The vision component of the multi-modal deep learning model might not be able to differentiate these features across classes. Also, with the multi-modal deep learning model there were instances of confusion between single-unit or construction parcels classified as other-urban. These cases typically occurred when the majority of the parcel was covered with built features, which appear as a homogeneous surface cover using Nearmap AI vector data meaning it is not possible to discern differences in the built and human-made features of dense single-unit housing, non-residential uses and construction material.
In these instances of confusion, incorporating high-resolution RGB imagery (e.g. orthophotos or similar) or including information from neighbouring parcels could aid discrimination (e.g. as in the contextual metrics of Fleischmann et al., 2022). For example, high-resolution RGB imagery could provide more detail on the nature of vegetation or built materials within a parcel that could reveal differences between rural vegetation and urban vegetation or differences between built features on non-residential and residential parcels, respectively. Such within surface cover detail is masked using geometry-based features. Similarly, including contextual information from a parcel’s neighbourhood might catch cases where an other-urban parcel among a dense grouping of single-units is unlikely to occur. With multi-modal models, it is possible to include RGB imagery or contextual predictor variables. However, incorporating RGB imagery alongside vector representations of surface cover would substantially increase the computational load, especially when training and deploying models for multi-city applications. There are also risks to including a parcel’s contextual information as predictors as fine-scale change and variability in parcel development types could be ‘smoothed’ out. For many urban mapping applications, such as monitoring infill and densification, sensitivity to fine-scale variation is important.
Conclusion
This paper presents a multi-modal deep learning model that classifies a property parcel’s development type. This model learnt to extract spatial features from colourised representations of a parcel’s built and natural features and tabular data representing a parcel’s surface cover, built form and dwelling count attributes. The multi-modal deep learning model’s predictive performance was compared to a range of commonly used supervised and unsupervised models. These comparative analyses were undertaken for Perth, a case where there is abundant training data, and in cases where models were generalised to other cities across Australia. To undertake this analysis, a ground truth dataset comprising over 50,000 labelled property parcels from Perth was created for training and validation, alongside geographically distinct test sets of over 10,000 parcels per-city for model evaluation. The ground truth datasets were derived from a geospatial database of Nearmap AI and address point data representing Perth, Melbourne, Sydney, Brisbane and Adelaide, covering the years 2019 and 2023.
The multi-modal deep learning model broadly displayed higher F1, precision, and recall scores for the different development types. Of note, the multi-modal deep learning model performed better in classifying classes that are visually distinctive and characterised by the arrangement of built features, such as cluster dwellings or apartments. These classes are often most relevant for mapping and monitoring different types of infill and densification. This highlights the benefit of using multi-modal models, which can integrate a range of data sources such as predictive features extracted from visually represented geospatial data and tabular data, to discriminate between parcel-level development types. The utility of the multi-modal deep learning model for generating predictive maps to monitor different types and patterns of infill and sprawl is demonstrated with examples that capture fine-scale parcel-to-parcel variability in development types to city-scale change analyses.
The multi-modal deep learning model outperformed other models when tested with the Perth dataset, achieving an overall accuracy of 94% and a top-2 accuracy of 99%. The multi-modal deep learning model was also more accurate when generalising to other Australian cities, either naively applying the Perth model to another city or via transfer learning with a small fine-tuning dataset. The fine-tuned multi-modal deep learning model had overall accuracies between 91% and 94% when evaluated on test sets from Melbourne, Sydney, Adelaide and Brisbane. These results indicate that deep learning models and transfer learning workflows can be leveraged to develop generalisable urban development type mapping models. This opens opportunities for multi-city applications and comparative studies that further understanding of the spatial and temporal dynamics of urban growth, undertake analysis to better understand links between urban development and sustainability and liveability outcomes, and evaluate the effects of policy that seeks to balance the need for housing our growing populations with maintaining healthy natural environments.
Supplemental Material
Supplemental Material - Automated property parcel classification using very high-resolution land cover imagery and multi-modal deep learning: Effective city-scale monitoring for urban expansion outcome modelling
Supplemental Material for Automated property parcel classification using very high-resolution land cover imagery and multi-modal deep learning: Effective city-scale monitoring for urban expansion outcome modelling by Warin Chotirosniramit, John M. A. Duncan, Joe Hurley, Sally Thompson, Marco Amati, Qian Sun and Bryan Boruff in Journal of Environment and Planning B: Urban Analytics and City Science.
Footnotes
Acknowledgements
The authors would like to formally acknowledge Nearmap for preparing data and providing technical and best practices support under a Research License for Nearmap AI data. Finally, we acknowledge the use of location information data licensed from Western Australian Land Information Authority (WALIA) trading as Landgate, © 2023 Western Australian Land Information Authority.
Author contributions
Funding
The authors disclosed receipt of the following financial support for the research, authorship, and/or publication of this article: This research was supported in full by the Australian Government through the Australian Research Council’s Discovery Projects funding scheme (project DP230103095).
Declaration of conflicting interests
The authors declared no potential conflicts of interest with respect to the research, authorship, and/or publication of this article.
Data Availability Statement
The data that support the findings of this study are available from © Nearmap. Restrictions apply to the availability of these data, which were used under license for this study.
Supplemental Material
Supplemental material for this article is available online.
Author biographies
References
Supplementary Material
Please find the following supplemental material available below.
For Open Access articles published under a Creative Commons License, all supplemental material carries the same license as the article it is associated with.
For non-Open Access articles published, all supplemental material carries a non-exclusive license, and permission requests for re-use of supplemental material or any part of supplemental material shall be sent directly to the copyright owner as specified in the copyright notice associated with the article.