
Abstract
The spatio-temporal variation of housing prices is central to unveiling the distribution of housing wealth (HW) across social groups. This paper presents a price decomposition framework to analyze the social differentiation of HW in terms of housing characteristics, location, and transaction date across labor-based occupational categories (OCs) of homeowners. Beyond variegated housing prices and capital gains, we highlight the importance of the concept of Price Gap Index (PGI)—the difference between average buyer and seller prices for each OC—to capture the redistribution of HW induced by housing transactions. Using data over two decades (1998–2017) for the French region Bourgogne-Franche-Comté, we find that static HW differences reflect the usual social hierarchy of the labor market. However, the PGI from a dynamic decomposition shows more regressive results of HW accumulation across OCs than the capital gains computed from the usual housing price index over time. These results confirm that spatial dynamics in the housing markets are an important generator of inequality, acting through the redistribution of HW during housing transactions.
Introduction
Owing to a twofold movement of financialization and rentierization, housing prices have increased dramatically in most OECD countries over the last three decades (Fernandez and Aalbers, 2017; Renaud and Kim, 2008). Fueled by this inflation, capital returns from homeownership increased sharply, reinforcing housing as a major asset for households (Schwartz and Seabrooke, 2008). In this context, HW becomes a central feature of inequalities (Adkins et al., 2019).
Homeownership has been widely debated in social science studies, especially by scholars seeking to identify housing-related social stratification systems (Badcock, 1989; Saunders, 1984). These works are of particular significance today, as the returns from housing capital grew faster than labor incomes (Piketty and Zucman, 2014; Ryan-Collins and Murray, 2021). Taking seriously the assumption of a housing asset-based stratification (Adkins et al., 2019), social inequalities stemming from housing markets must be accurately evaluated and compared with more extensively studied inequalities from labor markets.
Surprisingly, evidence and methodological frameworks to better grasp inequalities in HW remain scarce (Arundel and Lennartz, 2020; Wind and Hedman, 2018). Typical concerns regarding HW are mainly focused on spatio-temporal variations of prices for an existing housing stock (e.g., Garbinti et al., 2021). This approach on capital gains, as price differences over time, informs potential financial yields for homeowners. However, it does not pay much attention to the impact of current socio-spatial dynamics on housing markets as a source of uneven HW accumulation. Indeed, transactions in housing markets induce switches of both people and capital across space, thereby engaging a redistribution of wealth among different groups of homeowners (Hamnett, 2005). Considering that, we elaborate a Price Gap Index (PGI) as the housing price difference between purchased and sold properties for each social group of homeowners. The PGI has the advantage of providing a measure of the redistribution of HW from the housing market.
Our paper brings methodological perspectives in designing a synthetic quantitative framework to describe social stratification in housing markets and allows for the analysis of the impacts of socio-spatial dynamics on the accumulation of HW. This framework allows for the decomposition of HW determinants (on housing characteristics, location, and transaction timing) and balances the effect of redistribution (PGI) with more usual definitions of HW accumulation (i.e., capital gains). The framework is applied to an original dataset of transactions for principal residences, including information on occupational categories (OC) of buyers and sellers. The data set covers the French region Bourgogne-Franche-Comté from 1998 to 2017. This period is relevant to document the contrast in the accumulation of HW between social groups of homeowners. The first decade 1998–2007 is characterized by a substantial increase in the regional housing price index (+130%), while the second decade 2008–2017 witnessed a slight decrease of this index (−3.6%). However, the quantitative framework is general and could also be applied in other regions or time periods.
Starting with a static average price decomposition across OCs, we describe an uneven pattern on the housing market explaining the social hierarchy of housing prices to understand overall HW inequalities (i). We then test the hypothesis of growing inequalities considering capital gains as a usual suspect of a latent HW accumulation for homeowners benefiting from local housing market dynamics (ii). By introducing the PGI, we compute the differences in price decomposition between buyers and sellers among OCs (iii). Our results finally demonstrate the importance of socio-spatial upward or downward dynamics in explaining the growing HW inequalities between social groups (iv).
Related literature
We first review the existing literature that uses occupational categories (OCs) as proxies to study social stratification. We then describe how HW accumulation is typically characterized and outline the main HW patterns between social groups. Finally, we propose the PGI as a new dynamic approach to measure HW accumulation.
Using occupations categories (OCs) for social stratification
Labor-based classifications have a rich historical background in socio-spatial stratification studies. OCs are a simplified proxy of educational attainment, family background, and labor market dynamics, all of which play a role in shaping individual’s income (Wright, 2000) and contributing to various social and cultural group differences (Boterman et al., 2021).
OCs classification have proven to be more relevant for addressing social stratification than indicators based on activity sectors or income groups (Bourdieu, 2005). The stability and versatility of the classification of OCs make it particularly useful to describe the impact of economic geographies on labor populations in numerous Western countries (Williams, 2017). They have been particularly used to capture the transformations of productive systems and the resurgence of polarized labor structures within post-Fordist economies in various case studies such as the United States (Author, 2019), the EU, and notably France (Vera-Toscano et al., 2022).
OCs help to describe the patterns of social inequalities arising from the labor market, and also have a long-standing tradition of documenting the growth of the middle class and the social upgrading processes in global cities (Hamnett, 2021; Van Ham et al., 2020). OCs have also been crossed with various spatial delineations in the examination of urban segregation dynamics for various cities and more precisely in the French context (Clerval, 2022).
Recent literature has highlighted the relevance of linking labor positions with housing market outcomes to understand how the latter contribute to overall inequalities. For instance, authors have questioned whether the housing market creates an independent form of stratification or merely reproduces existing labor market patterns. This was done through national scale analysis (Arundel and Doling, 2017; Smith et al., 2022; Wind et al., 2017), or through a local fine-grained analysis of the housing markets (Le Goix et al., 2019). As Arundel and Lennartz (2020) suggest, most studies conclude that HW accumulation follow occupational stratification. Despite these studies, there is still a lack of research that intersects the distribution of HW from the housing market with labor stratification. Our paper aims to contribute in this field by providing empirical evidence and a methodological framework to assess HW accumulation across OCs using housing transaction data.
Capital gains from homeownership
Although price differences reveal disparities in HW, its accumulation is usually characterized as capital gains or losses across social groups (Bach et al., 2020). Since it hinges on the appreciation of existing housing stock, it is inherently linked with variations in spatial and temporal conditions within the housing market (Hochstenbach and Arundel, 2020).
Variations in housing prices over time have led to unequal returns on housing investments across generations (Arundel, 2017). On a macro-scale, the dynamics of rising prices over three decades have predominantly favored older homeowners. The baby boomer generation, born between 1950 and 1970, has particularly benefited from low purchase prices, favorable housing taxation, and accommodating monetary policies (Forrest and Hirayama, 2015; Monnet and Wolf, 2017). In contrast, younger generations face with high prices and a lack of housing affordability, resulting in decreasing returns on their investments (Wind et al., 2017).
Inflation has also been uneven in space. The literature has highlighted the acceleration of metropolization and financialization processes, which contributes to higher spatial price disparities. The growing polarization of housing markets, accentuated after the 2008 Global Financial Crisis (GFC), has amplified a long-term concentration of housing wealth in metropolitan areas, benefiting existing homeowners (Gyourko et al., 2013). But few studies have delved into fine-scale phenomenon, integrating periurban and rural spaces, and being able to capture significant local market effects. Some exceptions have shown that local divergent housing prices occur through greater social (e.g., Wind and Hedman, 2018 for Sweden, Le Goix et al., 2020 for France, and Arundel and Hochstenbach, 2020 for the Netherlands), or racial segregation (Fesselmeyer et al., 2013).
Since housing is a fixed asset, capital gains are influenced by shift in neighborhood conditions or surrounding housing transactions, prompting households to implement investment strategies accordingly. According to Arundel and Hochstenbach (2020) or Wind and Hedman (2018), upper social groups pursue housing pathways strategies to capitalize on local accumulation differentials.
In contrast, Hochstenbach and Musterd (2018) highlight the limited accumulation opportunities for low-income groups who are confronted with suburbanization in homeownership. Such observations are drawn by Le Goix et al. (2019), who examine the dynamics of local price and purchasing behaviors of social groups in the Paris region. In another study, Arundel and Hochstenbach (2020) argue that access to homeownership in the most favorable locations for capital gains primarily benefits wealthy households who rely on their parental wealth transfers. Indeed, inheritance and “Bank of Mum and Dad” phenomenon redistribute HW between generations, perpetuating inequalities (Christophers, 2019; Forrest and Hirayama, 2015).
Inflation mechanically exacerbates HW disparities between social groups in nominal terms (Burbidge, 2000). However, translating local prices dynamics into capital gains across social groups is not always straightforward. For instance, specific socio-spatial processes, such as gentrification, possibly amplify capital gain opportunities in some places. More broadly, long-term inflation could contribute to some extent to spatial homogenization of housing prices. Consequently, the appreciation rate of housing prices could be more noticeable in low-priced housing neighborhoods (Hamnett, 2009) and may indicate a higher ratio of capital gains for homeowners of low socioeconomic status in specific context. For example, an econometric study on ethnic groups by Kahn (2024) shows that Black buyers in the US experience lower returns on investment compared to other ethnic groups, but see similar returns in Los Angeles.
The effect of transactions on the redistribution of housing wealth
In economic terms, some authors argue that rising prices are roughly neutral in terms of wealth (Bonnet et al., 2015; Buiter, 2010), whereas others contend that latent capital gains increase inequalities between homeowners and renters in terms of both incomes and consumption (Allègre and Timbeau, 2015). In spatial studies, academic literature highlights an increasing spatial divide and polarization of price and capital gains, generally leading to the conclusion that higher socioeconomic status tends to accumulate more HW than other groups. Beyond these debates, most analytical framework tackling the issues of latent capital gains, but they overlook the redistribution of HW in housing markets, that is an aggregate transfer of capital between buyers and sellers during transactions.
From an accounting perspective, we assume that redistribution of HW is barely zero-sum across different groups of homeowners because of an existing price gap between buyers and sellers. There is established literature in urban economics that examines the role of buyer or seller characteristics in determining housing prices. Recent studies have demonstrated that housing prices vary systematically according to family situation (Fagereng et al., 2022), gender (Waitkus and Minkus, 2021), housing intermediary (Besbris and Korver-Glenn, 2022), parental support (Arundel and Hochstenbach, 2020), race (Bayer et al., 2017), and social group (Cohen Raviv and Lewin-Epstein, 2021). This photography of HW stratification through housing prices is, however, a static approach. We do a step aside by suggesting a dynamic approach that accounts for investment flows by examining the differences across social groups in the existing gap between the average prices of buyers and sellers within each social group.
On the one hand, if purchasers, on average, buy a more expensive housing stock compared to their seller counterparts from the same OC, it leads to a positive price gap, translated by an overall accumulation in the HW of the group. On the other hand, if households belonging to the same OC purchase cheaper housing stock than it sells, this contributes to a negative price gap as an overall disaccumulation in the OC’s HW. Based on this, we consider that differences in the average housing price gap between buyers and sellers could be significant to reflect social divide patterns in HW accumulation, which are underestimated by focusing solely on latent capital gains (H1). We also assume that these differences can be partly explained by describing social variations within the spatial hierarchy of housing markets (H2). The Price Gap Index (PGI) has been conceived to address these assumptions with an original decomposition framework adapted from Gelbach (2016).
Methodological framework
This section outlines our general approach to analyze HW across social groups. Building on a classical hedonic model, we present the general principle of Gelbach (2016)’s decomposition, followed by a static decomposition and a dynamic decomposition of HW. The static decomposition describes the positions of homeowners in the housing market for each social groups by examining three main components of prices (What, Where, When, respectively, based on housing characteristics, location, and transaction date). The dynamic decomposition is applied separately for buyers and sellers within each OCs. The differences between these two last parts give the PGI. It enables us to describe the impact of redistribution for each OC. Decomposition of PGI offers insight into the spatial upward or downward switch of each OCs in the housing markets explaining differential accumulation of HW. We finally present our approach to compare PGI to more usual capital gains.
Overall, the framework has the advantage of being mathematically formalized and fully replicable in any territorial context and dataset on housing transactions that contain information on both sellers and buyers characteristics.
Hedonic models of housing price
For a given housing transaction i of a given period, we note

In order to account for housing characteristics, housing locations, and transaction dates, we estimate a more extensive linear model with three additional sets of variables. We note

Gelbach’s decomposition of housing prices
From the terminology of Gelbach (2016), the equation (1) is the base model and equation (2) is the full model.
OLS give for each transaction i three partial price predictions depending, respectively, on housing characteristics
Gelbach (2016, p.522) formally establishes4 that these six terms are equals to the differences between coefficients from Equation (1) and Equation (2), namely


Static approach: Average price decomposition
A direct application of Gelbach’s decomposition provides a picture of the determinants of social differences of HW. The average housing price for buyers and sellers of a given OC k, noted

Dynamic approach: Price gap decomposition
To account for the HW accumulation patterns from housing transactions, we define the Price Gap Index (PGI) that focuses on average price differences between buyers and sellers for each OC (instead of average prices across OCs as before). For a given OC, this amount implies to consider that observing a higher price for buyers than for sellers (i.e., a positive PGI) lead to HW accumulation and vice versa. From the simple hedonic regression (1), the PGI can be expressed as
By subtracting (instead of averaging as in the static approach) equations (3) and (4) of Gelbach’s decomposition, we obtain

Comparison with usual capital gains
Our definition of the PGI complements the more traditional approach to capital gains in HW accumulation. Instead of resulting from the interaction between buyers and sellers of different social groups during transactions, capital gains results from price variations between two transactions for a same social group. The main determinant of capital gains is housing price variations between the purchase and the sale of a house, which can easily integrated in our framework to comparison with PGI. We propose to estimate an auxiliary hedonic model on the same data

Context and data
This section presents the regional context for the application of our static and dynamic decomposition frameworks, and the notarial data about housing transaction we use.
The French region of Bourgogne-Franche-Comté (BFC)
Our application draws on one of the 13 regions of France, covering eight départements (Figure S1). BFC is an intermediate-sized region and exhibits housing price dynamics quite similar to the French average when excluding Paris. The region is characterized by a polycentric network structure of medium and small sized cities, with peri-urban and inland rural areas in between. Suburban areas around major cities such Dijon, Besançon, Belfort, and Montbéliard, or close to the Switzerland border, have experienced population growth over the last two decades, as well as job creations in thriving economic sectors (INSEE, 2018). In contrast, small towns and rural areas have seen job losses and population decline, in conjunction with an aging population. About half of urban areas of the region, especially in the west side, have undergone a shrinking process in recent decades, such that demographic and economic distributions tend to become more polarized.
Compared with other contexts in western Europe, France has a high ownership rate and the BFC region presents an even higher rate (63.2% instead of 57.1% nationally). This correlates with an old housing stock, a high rate of detached houses (compared to apartments), a high average living surface, and a low average housing price. Nevertheless, the dynamics of homeownership are close to the national ones. Whereas most spatially explicit works on housing markets have focused on attractive metropolitan areas, more common and less attractive places, encompassing urban, peri-urban, and rural settings, are understudied. Finally, the two decades under study (1998–2007 and 2008–2017) allow us to investigate the differentiated patterns of HW distribution implied by the price trend break (increasing and then slightly decreasing) of the 2008 financial crisis.
Notarial data about housing transactions
In France, notaries are responsible for registering property rights, and our analysis relies on their records of housing transactions for the period 1998–2017. These data distinguish main residences, and the OC of the homeowner according to the half century-old classification of groupes socio-économiques (Desrosières and Thévenot, 1988). These OCs come from the French official classification of jobs, grouped in six aggregated items, plus two items (Inactive and Retired). This information is processed by notaries from an open question about the main job in the sale deeds. We have eight items: Farmer, Independent, Senior Staff, Intermediate, Clerk, Blue Collar, Inactive, and Retired. The categories of Farmer, Clerk, and Blue Collar are well known in the literature. Independent includes business owners in addition to the more usual craftsmen and merchants, Senior Staff includes executives, managers, and other intellectual professions, and Intermediate is more defined by elimination from other OCs and may contain diverse back-office jobs, foremen, freelance nurses, self-employed sports instructors, or technicians.
After data cleaning and selection, 1 we obtain a final sample of 295,199 housing transactions. The bottom panel of Tables S1 and S2 displays descriptive statistics on average housing price differences and the shares of each OC across buyers and sellers. Except for Retired with twice as many sellers, all other OCs have a greater rate of buyers. These transaction data provide complete information on the characteristics, time and location of the housing, which are used as covariates to control for housing prices in order to describe the three dimensions of housings (the What, When, and Where components of the decomposition).
Results
In this section, the social hierarchy of HW according to the static decomposition of housing prices is first described. Next, we report capital gains estimated from auxiliary housing price regressions (Equation (7)) and compare them with the dynamic decomposition. Finally, we discuss the socio-spatial patterns of HW accumulation from the PGI.
Social hierarchy of housing wealth
From a static perspective, we examine the social hierarchy of HW through the average housing price differences observed among social groups. Figure 1 shows in filled dots the average housing price Average housing prices and housing price gaps between OCs. Notes: This figure displays the average housing prices 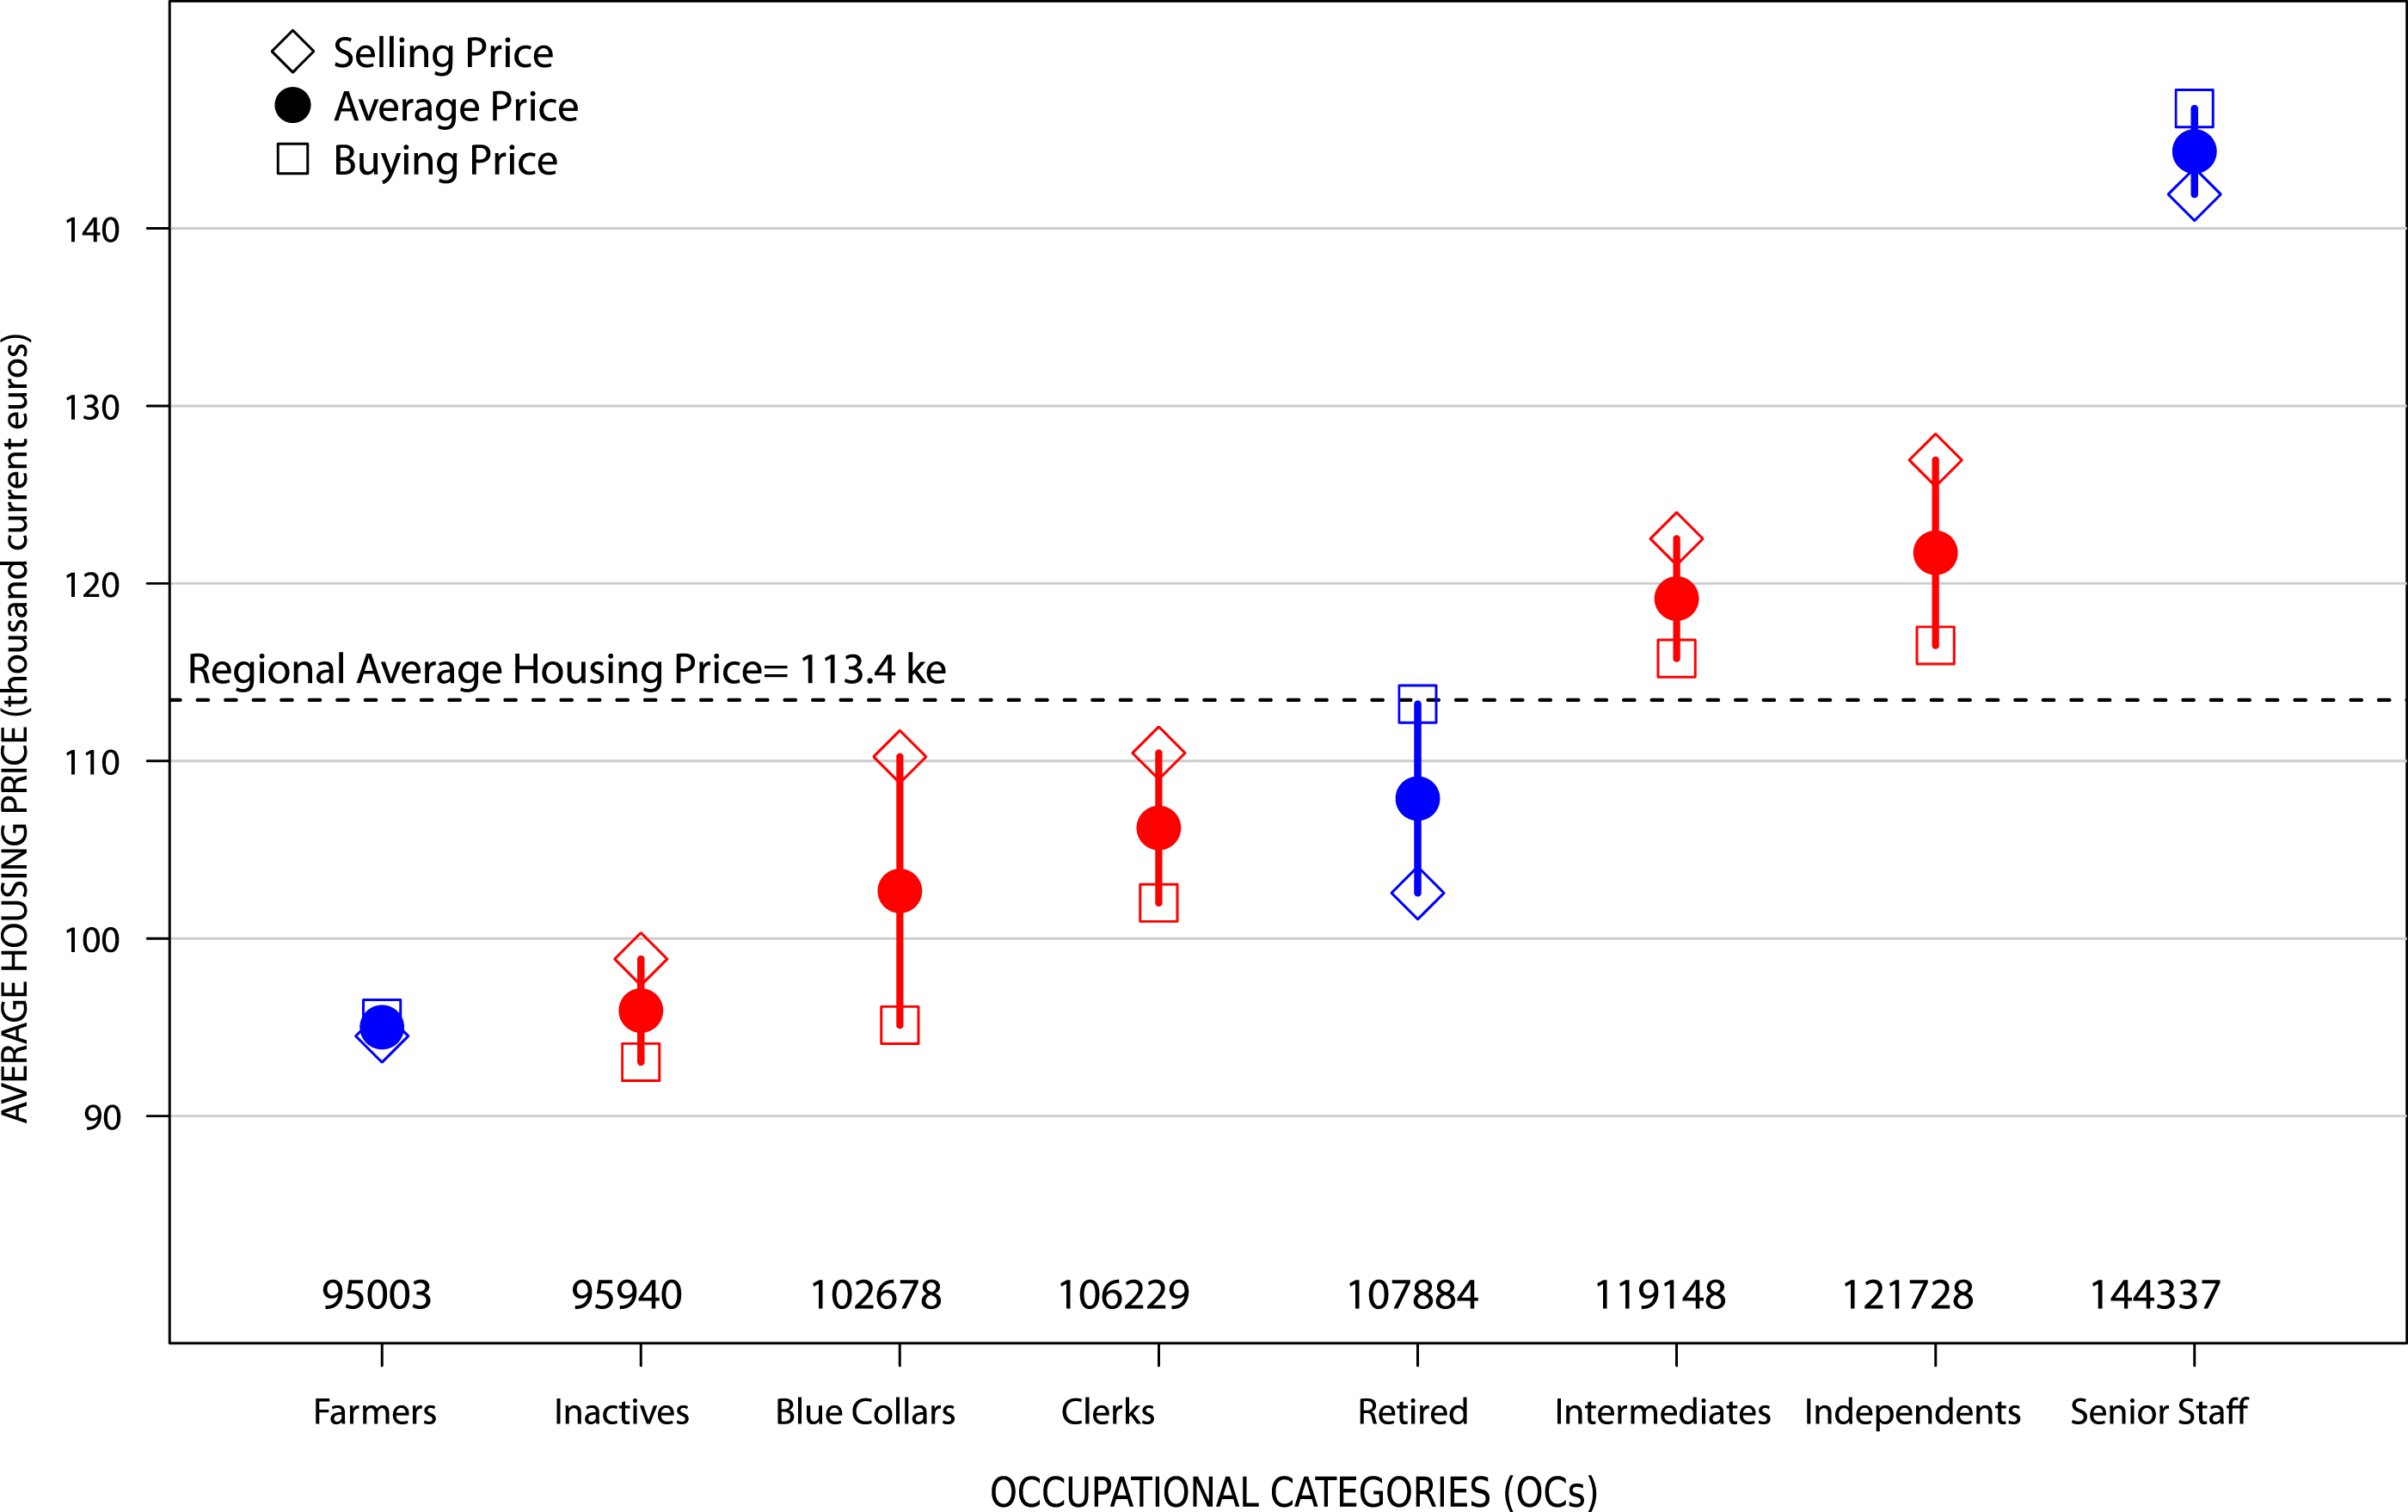
Decomposition of average housing prices across OCs.
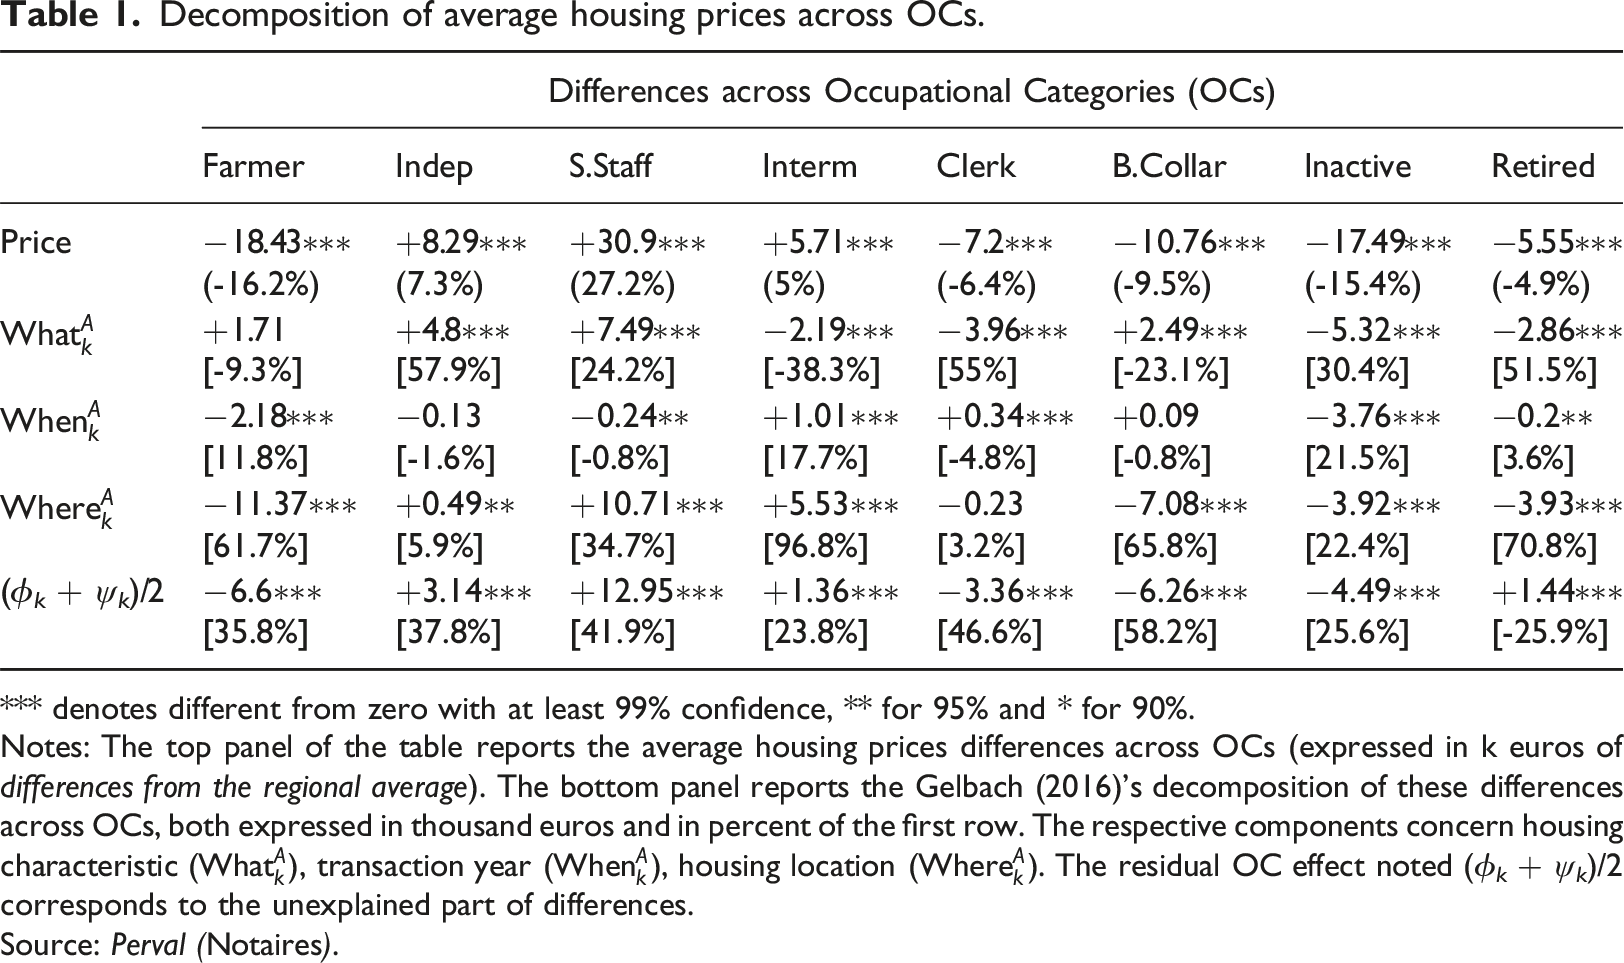
*** denotes different from zero with at least 99% confidence, ** for 95% and * for 90%.
Notes: The top panel of the table reports the average housing prices differences across OCs (expressed in k euros of differences from the regional average). The bottom panel reports the Gelbach (2016)’s decomposition of these differences across OCs, both expressed in thousand euros and in percent of the first row. The respective components concern housing characteristic (
Source: Perval (Notaires).
Table 1 also shows that the hierarchy of the different components varies across OCs. Static HW of S. Staff is higher than other OCs, mostly because of better location (35%) and better housing characteristics (25%). In contrast, the location part is lower than the average for Farmer, B. Collars, Inactive, and Retired, suggesting that these OCs tend to be involved (both at buyers and sellers) in transactions away from best-price locations. Because Retired contains a mix of other OCs when people were employed, it is not surprising that this group falls around the middle for each row of Table 1. Clerk does not have a significant Where component, which indicates that they are better located than the other low-status OCs. However, jointly with Retired, Inactive, and Intermediates, their intrinsic housing characteristics are of lower quality than the regional average (whereas Farmer and B. Collar are shown to have better housing attributes).
Lastly, despite the inclusion of many explanatory variables about housing quality, time, and space fixed effects, the OCs dummies still have a strong statistical significance in the extensive hedonic model (equation (4)) with high unexplained components (in absolute values) for each OC. They reach, respectively, +13k euros (41.9% of average price) for S. Staff and −6.25k euros (58.2%) for B. Collar. This indicates ceteris paribus that housing markets are socially segmented according to the OCs of homeowners.
Capital gains: an insufficient measure to capture inequalities
According to the scientific literature, the main driver of HW accumulation inequalities is attributed to latent capital gains realized by homeowners when housing prices fluctuate. In these frameworks, capital gains represent a snapshot of prices, year after year, of an existing housing stock.
To compare our PGI approach in the next section with usual capital gains, we estimate initial housing prices and their average variations over time for each OC and each decade (Equation (7)). Regressing housing prices on OC dummy variables and their interaction with time trends provides the piecewise linear trends reported in Figure S5. These trends reveal the housing price break following the 2008 Global Financial Crisis (GFC), with variations allowed between OCs. Table S3 reports the raw coefficients from each auxiliary regression, with R2 values ranging from 0.23 for the first decade to 0.09 for the second. It appears that the piecewise linear time trends exhibit a striking symmetry across OCs. 3 These results are robust to alternative specifications, and including postal code fixed effects does not change the general trends.
Table S4 displays average housing prices, annual nominal gains and annual growth rates for each OC and each decade. Average housing prices follow the socioeconomic hierarchy, ranging from 54.53k euros for B. Collar to 104k euros for S. Staff in 1998. The housing price boom of the first decade has enlarged the distribution of average housing prices, as evidenced by differences in average nominal gains. These gains are significantly higher than the regional average for Independent and S. Staff (of respectively +920 and +540 euros by year), and lower for other OCs (only Farmer and Inactive do not have significant differences with the regional average). In contrast, when capital gains are expressed as growth rates (% of initial housing prices), the hierarchy among social groups’ shifts: Senior Staff earns 10.42% each year whereas Blue Collar earns 17.13%. In other words, HW accumulation across OCs is regressive in nominal terms but progressive in relative terms, although the latter is less statistically significant.
The second row panel of Table S4 shows that housing price differences across OCs are somewhat more marked during the second decade. The differences with the regional average range from −31.37k euros for B. Collar to +34.68k euros for S. Staff, covering more than one-third of the average initial price. While the average nominal gains and growth rates are slightly negative at the regional scale (albeit not significant), three OCs—Farmer, Independent, and B. Collar—show significantly different nominal gains. Independents also exhibit a significantly higher growth rate, at 1.29% per year. Surprisingly, nominal gains and growth rates become more homogeneous across OCs after 2008. In short, price booms increase the dispersion in nominal terms, while the stagnation post-2008 has modestly reduced it. Finally, HW accumulation captured from capital gains leads to a significant stability of social stratification as gains are proportional to investment amounts.
Price gap index: a dynamic approach of housing wealth accumulation
While some literature highlights worsening inequalities in HW due to housing price variations, our measure of capital gains does not fully support this conclusion. We found that disparities in capital gains between social groups were less regressive than those observed in static HW stratification approaches. Unexpectedly, there was a catching-up effect in ratios and no significant reinforcement of capital gains inequalities following the 2008 GFC. To accurately capture the growing disparities in HW between social groups, it is essential to consider not only the appreciation of the housing stock but also the redistribution of HW that occurs during transactions. This redistribution is notably influenced by varying social housing pathways. Our dynamic approach, through the Price Gap Index (PGI), captures this redistribution.
Decomposition of average housing price dynamics across OCs.
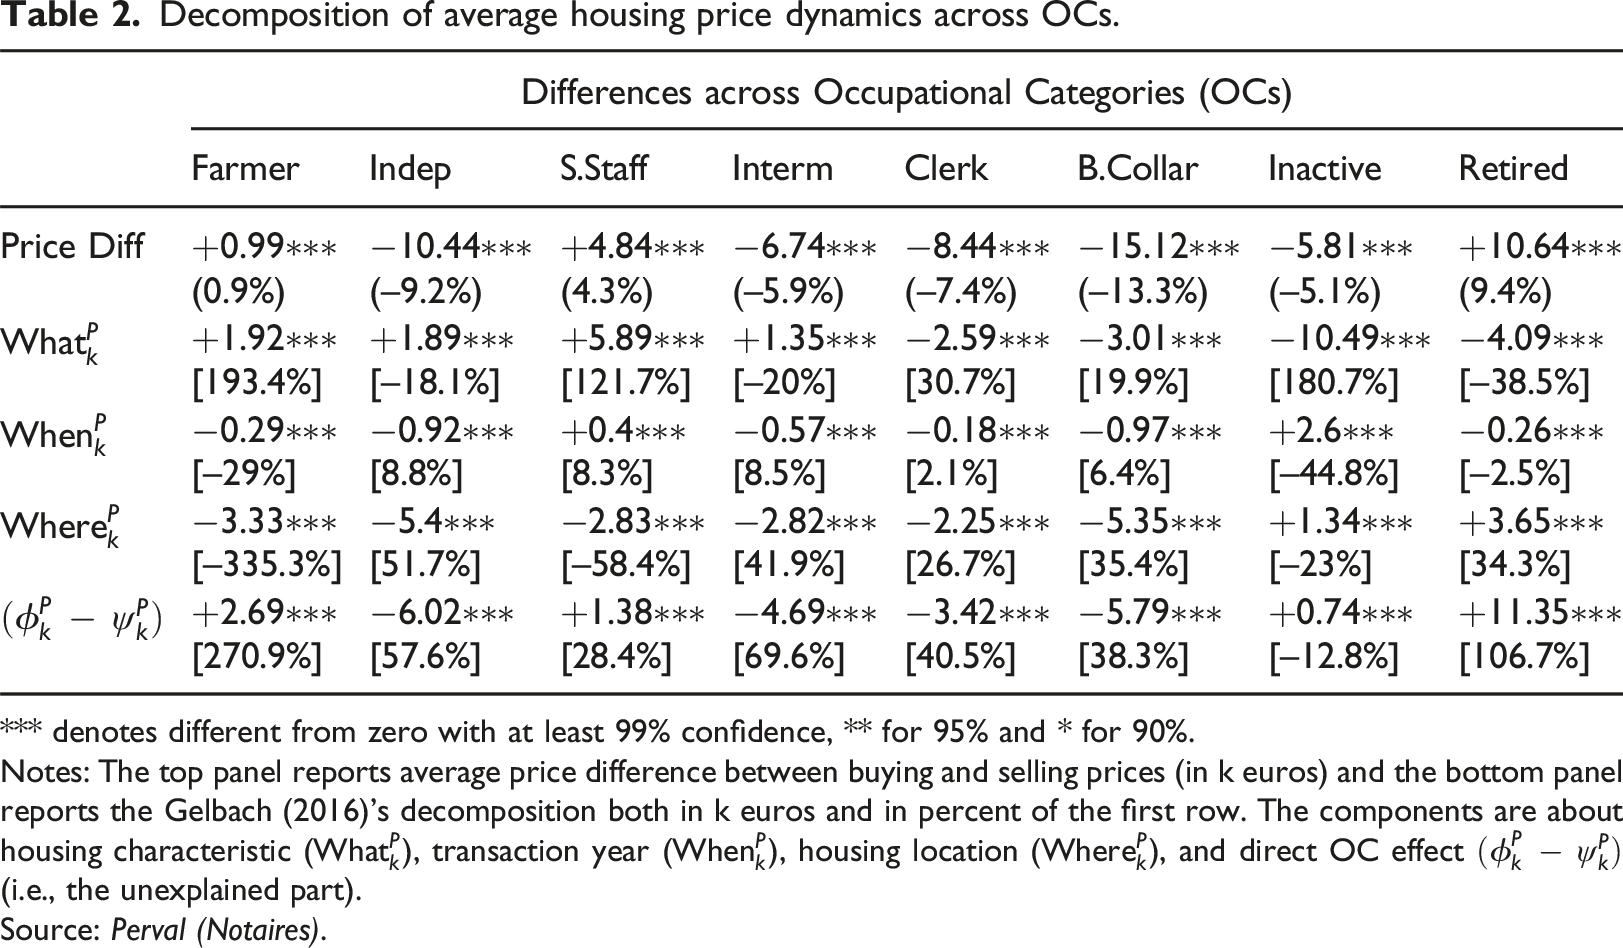
*** denotes different from zero with at least 99% confidence, ** for 95% and * for 90%.
Notes: The top panel reports average price difference between buying and selling prices (in k euros) and the bottom panel reports the Gelbach (2016)’s decomposition both in k euros and in percent of the first row. The components are about housing characteristic (
Source: Perval (Notaires).
PGIs not simply follow the socially uniform trends of capital gains, but reveal a more regressive pattern between OCs. Our quantitative framework enables the decomposition of these PGIs and elucidates differentiated social trends in the accumulation of HW. The What component of housing price differences within OCs reflects changes in intrinsic housing quality. It is positive for buyers who improve the quality of their homes compared to sellers (e.g., Farmer, Independent, Senior Staff, and Intermediate) and negative for others (see Table 2). The Where component captures the effect of location: a positive value indicates an upward shift in location quality, while a negative value signifies a decline. This upward gap in the social hierarchy of HW is only observed for Retired, altering their position in comparison with static social hierarchy of HW, whereas all other OCs experience a downward shift in location, especially higher in absolute values for low economic status. The When component gives the effect of transaction timing (differences between years of purchase and sale) and is generally less influential than the other two components.
Socio-spatial patterns of housing wealth accumulation
Correlations between the spatial distribution of housing prices and the location of housing transactions.
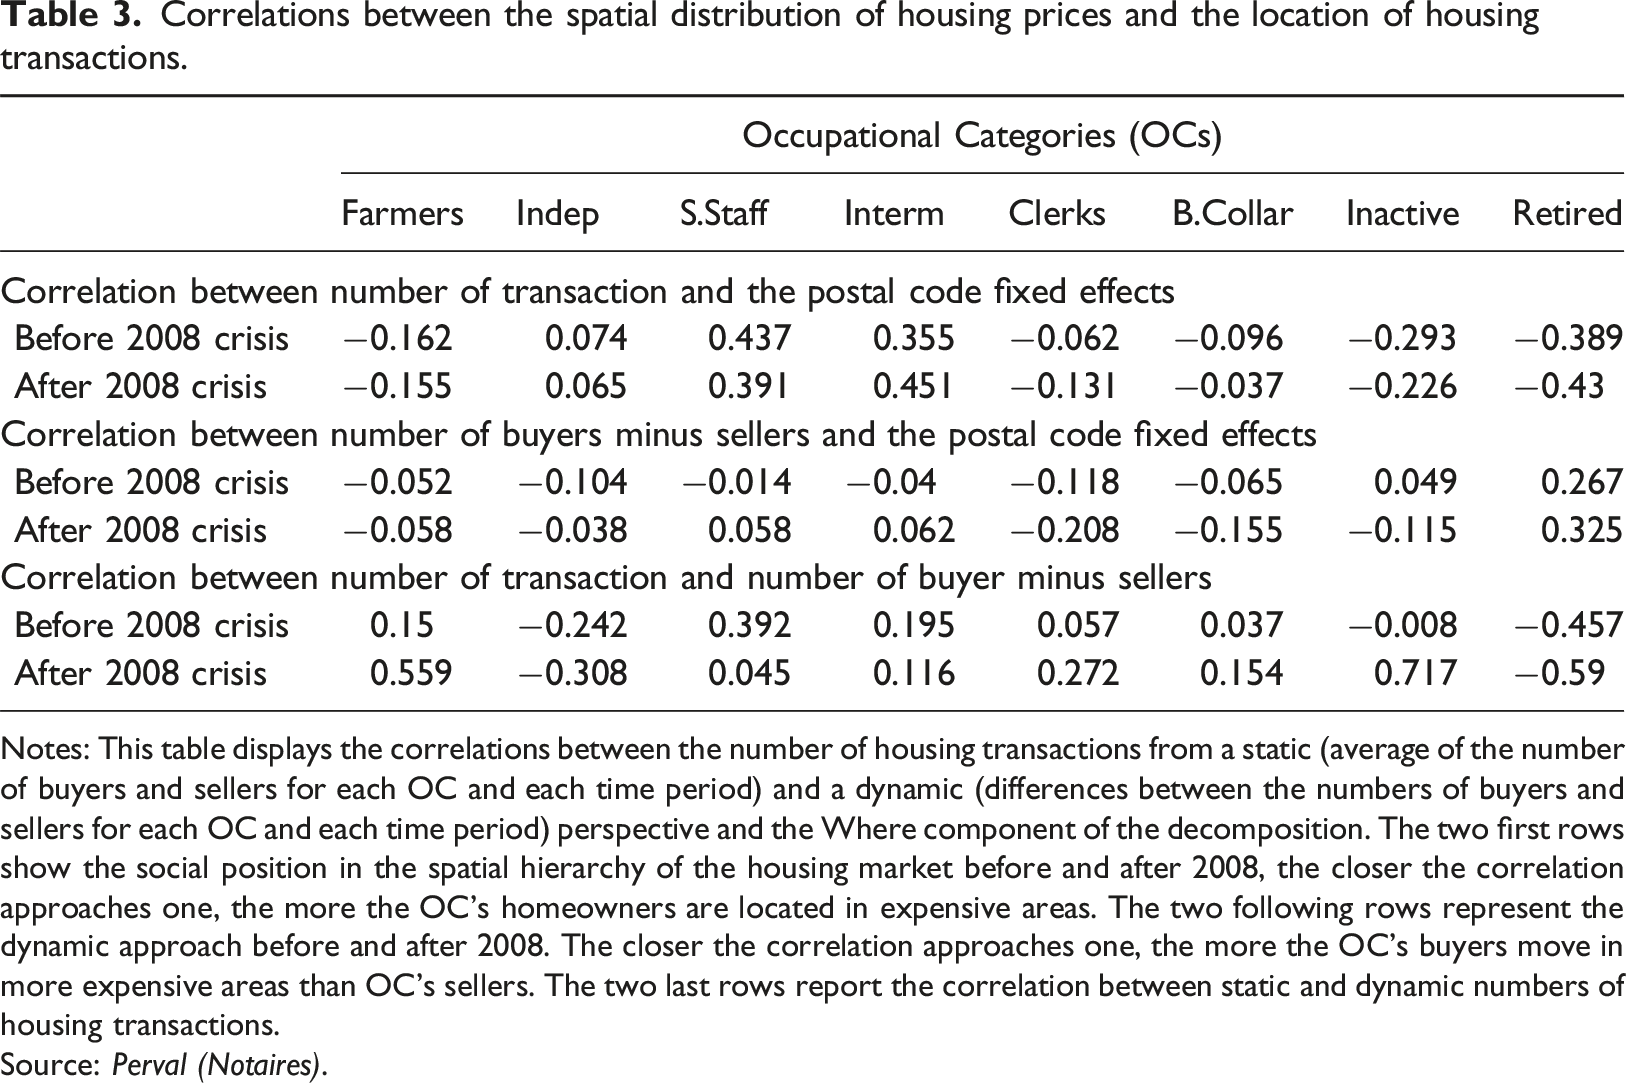
Notes: This table displays the correlations between the number of housing transactions from a static (average of the number of buyers and sellers for each OC and each time period) and a dynamic (differences between the numbers of buyers and sellers for each OC and each time period) perspective and the Where component of the decomposition. The two first rows show the social position in the spatial hierarchy of the housing market before and after 2008, the closer the correlation approaches one, the more the OC’s homeowners are located in expensive areas. The two following rows represent the dynamic approach before and after 2008. The closer the correlation approaches one, the more the OC’s buyers move in more expensive areas than OC’s sellers. The two last rows report the correlation between static and dynamic numbers of housing transactions.
Source: Perval (Notaires).
For Retired, on average transactions, for both buyers or sellers, tend to be relatively higher in inexpensive spatial units Table 3. But a distinction between buyers and sellers grasp the internal heterogeneity of the group. Retired as buyers are half as numerous as their seller counterparts. However, the number of Retired buyers exceeds the number of Retired sellers in expensive spatial units and price heterogeneity is more significant for sellers than for buyers (Table S1 and S2). What is observed as a spatial switch in the HW of this group towards more central urban areas, in turn, questions their housing pathway related with mechanisms of generational transmission (see discussion section).
B. Collars, Clerks, and Farmers are located and tend to move in less expensive spatial units with an average disaccumulation of, respectively, −15.12k, −7.2k, and −18.43k euros relative to the regional average (Table 2). The dynamic approach reveals a more pronounced negative correlation for B. Collar and Clerks compared to the static approach (whereas the reverse is true for Farmers). This underscores the complementary nature of both approaches, and illustrates the trends of displacement towards more distant areas, in line with other findings in metropolitan contexts (Hochstenbach and Musterd, 2018).
S. Staff, on the other hand, are over-represented in more expensive areas, both in static and dynamic approaches, while the correlations are stronger in the former approach. This spatial diversification can be interpreted in two ways. First, it may reflect current gentrification in urban areas where social competition with wealthier retired households drives them to more affordable and socially mixed neighborhoods. Second, particularly for new entrants to the housing market, as other active OCs, there is also a notable trend of peripheralization for this high socioeconomic status.
The GFC of 2008 does not alter the signs of the correlation coefficients of the static approach, but it does shift the sign from negative to positive in the dynamic approach for high OCs (Interm. and S. Staff) which were impacted by the crisis in terms of location. The bottom panel of Table 3 reveals that GFC intensified the correlation between the static and dynamic location patterns of HW, where OCs can be divided into two main categories: those who move to spatial units where they are less numerous—Retired and Independents—and all other OCs, who tend to either remain in or move to areas that reflect their established presence. For the latter, it is logically very strong for farmers, but we also observe a trend towards spatial homogenization for Clerks, Inactive, and B. Collars, while Intermediates and S. Staff have a spatial footprint that is diversifying.
Discussion and conclusion
A major contribution of this paper is the development of a quantitative approach to catch the effects of HW redistribution on social inequalities. Furthermore, our decomposition framework enables an understanding of the influence of socio-spatial changes in the worsening of HW inequalities. To achieve this, we have based our analysis on long-standing social groups stratified in the labor market. While OCs are merely control variables in most studies on HW inequalities, our conceptual framework puts them at the forefront of the analysis and provides a complementary picture of HW redistribution operated by the housing markets. Instead of looking for a market price of a given housing, our focus shifts towards understanding price-induced inequalities. This approach could benefit from being replicated for other regions, social classifications, or time periods.
Our analysis on capital gains reached the conclusion of Burbidge (2000) in his study on the Sydney metro area: prolonged trends of price inflation mechanically increase HW inequalities across OCs in nominal terms. However, as observed by Le Goix et al. (2019), inflation is proportionally more intense in the lower-priced segments of the market, fostering a relative homogenization of capital gains rates over recent decades between OCs.
This paper introduces a price gap index (PGI) that provides new insights to study HW accumulation from housing transactions. For a given social group, a positive PGI indicates an increase in their HW, whereas a negative PGI indicates a decrease. The impact of PGI on both social and generational inequalities in HW is significant and aligns with findings in the literature. Statistical results confirm the importance of taking into account this price difference in order to better measure the effects of market dynamics on HW. Ultimately, the social structure of labor and the housing market generally exhibits a comparable hierarchy, with regressive redistribution.
Our study is mostly descriptive and does not attempt to disentangle the causes of PGI differentiation. We only refer to the influence of the socioeconomic status of buyers and sellers on the housing market. With our framework, we showed that PGI is significantly explained through the variations between buyers and sellers in location within the spatial hierarchy of housing markets. Nevertheless, considering social groups gives insight, it does not necessarily lead to a clear interpretation of the mechanism. Our results should be used alongside other more qualitative studies to uncover heuristic phenomena. PGI would definitely have several meanings not only in terms of capital circulation, investment strategies, and consumption across social groups but also in terms of housing market segmentation. This opens several hypotheses, including capital switching between building environments and other circuits of investment and consumption, as well as between places regarding the residential pathways of social groups. In sum, this paved the way for future research that seeks a better understanding of the inequalities captured by PGI.
In this explanatory attempt of the PGI, the results for the group of Retired is interesting. Received wisdom suggests that retirees sell and repurchase at a lower price to free up equity, redistributed as parental support or flowing in the consumption circuit, resulting in a negative PGI. However, as a recent paper on the French case claims, retiree homeowners with low socioeconomic status rarely sell their primary residences before their death. When they do sell, it is to pay for the nursing home but they seldom repurchase (Benites-Gambirazio and Bonneval, 2022). Thus, Bank of Mum and Dad phenomenon should not be broadly extended in the entire scope of society as it concerns a privileged part of retirees in terms of income and assets (Forrest and Hirayama, 2015) who develop an ”intergenerational investment strategy” (Hochstenbach, 2018). This rarely happens through the purchase of a cheap primary residence, as housing location and conditions are inherent to the spatial strategies and social distinction of privileged groups. Therefore, the observation in the last section suggests that Retired buyers are more likely to have a higher social status than sellers, encompassing individuals from all social strata. This contributes to explaining why the Retired group has a strong positive PGI and buys in more expensive areas than they sell. Further research specifically on that group should be undertaken to confirm these assumptions.
Other limitations include the focus on this specific French region and data constraints. That raises the usual concern regarding the ability to generalize the findings to broader observations on inequalities. The choice of BFC enables us to characterize “ordinary inequalities” in a polycentric spatial context of small- and medium-sized urban networks. This case study enriches the existing body of literature that predominantly concentrates on metropolitan regions of Western countries. However, it would also be worthwhile to extend the analysis by including more up-to-date data on larger perimeters, such as national ones. An investigation would determine whether the patterns of inequality between OCs persist regardless of urban hierarchy and territorial context. Furthermore, French OCs classification we use is easily harmonized with the International Standard Classification of Occupations (ISCO-08), paving the way for reproducing our approach for international comparisons.
Inequalities in HW for owner-occupiers are only part of the overall social stratification induced by the housing market. A more complete picture would introduce the absence of housing wealth for non-homeowners (renters and social housing) and include the higher HW of multiple homeowners. Taking these additional dimensions into account would likely strengthen our findings. Indeed, as homeownership and multiple homeownership rates are higher for higher socio-economic statuses (Garbinti et al., 2016; Lei et al., 2024), it suggests adding more regressive sources of HW distribution to be added to the PGI. Another limitation to overcome would be to include the effects of local variations in the homeowners’ population. For instance, capital gains will be extrapolated to a population that remains in the same location and PGI will be related to broader residential mobilities, allowing us to extrapolate our results to the stock of local newcomers (buyer prices) and outgoing homeowners (sellers’ prices). Future research will build on PGI methodology to include these additional components in the assessment of social stratification operated through HW.
Supplemental Material
Supplemental Material - The social stratification of homeowners’ housing wealth: Bringing a dynamic approach through the price gap index
Supplemental Material for The social stratification of homeowners’ housing wealth: Bringing a dynamic approach through the price gap index by Jean-Sauveur Ay and Thibault Le Corre in Environment and Planning B: Urban Analytics and City Science
Footnotes
Declaration of conflicting interests
The author(s) declared no potential conflicts of interest with respect to the research, authorship, and/or publication of this article.
Funding
The author(s) disclosed receipt of the following financial support for the research, authorship, and/or publication of this article: Région Bourgogne-Franche-Comté, project ISITE PubPrivLands.
Data Availability Statement
The data used in this study are proprietary and cannot be shared due to confidentiality agreements. Detailed descriptions of the data and methodologies are provided within the article or its supplementary materials. The code used for the analysis is available at https://github.com/jsay/PriceGapIndex. Please contact the data provider Perval to request access to the raw data at https://www.perval.fr/. (Jean-Sauveur and Thibault, 2025).
Supplemental Material
Supplemental material for this article is available online.
Notes
References
Supplementary Material
Please find the following supplemental material available below.
For Open Access articles published under a Creative Commons License, all supplemental material carries the same license as the article it is associated with.
For non-Open Access articles published, all supplemental material carries a non-exclusive license, and permission requests for re-use of supplemental material or any part of supplemental material shall be sent directly to the copyright owner as specified in the copyright notice associated with the article.