
Abstract
Housing wealth is central to structuring inequalities across societies. Processes of financialization have intensified the speculative nature of housing, while labour and welfare restructuring increase the importance of property wealth towards economic security. Housing, however, represents an exceptional asset given its inherently spatial nature and buy-in barriers. This implies that not only access to homeownership but where households enter the housing market is central to wealth trajectories. Spatial inequality in housing trends thus fundamentally structures wealth dynamics. While some scholarship has posited increasing housing market spatial polarization, there remains a lack of empirical evidence. This research turns to the context of Spain, to directly assess spatial polarization in housing value accumulation. Employing an innovative dataset at a detailed geographic scale, the analyses reveal strong increases in polarization across the national territory over the past decade. Strikingly, these dynamics appear resistant to major upheavals, including the post-GFC crash and Covid-19 impacts, and are robust across scales. The analyses reveal that more expensive areas saw greater absolute gains and higher rates of appreciation. The findings expose a structural intensification of spatial polarization and provide crucial empirical evidence of how the housing market acts in amplifying inequality through the spatial sorting of wealth accumulation.
Introduction
Much public and scholarly attention has emphasized rising inequality as one of the most pressing issues of our era. While income inequality has often remained at the forefront, growing concern has turned to the importance of understanding wealth in stratifying societies (Piketty, 2014; Stiglitz, 2012). Piketty’s (2014) central thesis on the imbalance in the returns on capital versus economic growth shone a light not only on growing inequalities in remuneration but also the central importance of wealth as undergirding economic and class divisions. However, attention on wealth divides has often failed to explicitly call out – Piketty included (see Allegré and Timbeau, 2015; Arundel, 2017; Rognlie, 2016) – the constitutive fabric of most household wealth: housing. Across advanced economies, housing comprises the largest financial asset for most (Causa et al., 2019; OECD, 2023c; Rowlingson and McKay, 2012) with social class increasingly structured around assets and their appreciation, often above and beyond other socio-economic determinants (Adkins et al., 2020; Ryan-Collins and Murray, 2023). With majority homeownership the norm across many countries, 1 most households are engaged in accumulating housing wealth and participating in the housing market (OECD, 2023b). High homeownership, however, masks the extent that property equity is unevenly distributed, not only in access but also among those on the housing market (Arundel, 2017; Boertien and López-Gay, 2023; Kaas et al., 2019; Pfeffer and Waitkus, 2021).
At the same time, broader processes of financialization and commodification have only intensified the speculative function of housing, increased the flows of capital into real estate, and entrenched housing’s significance towards wealth prospects (Aalbers, 2008, 2016; Aalbers and Christophers, 2014; Fernandez and Aalbers, 2016). At the household-level, the importance of housing assets towards socio-economic security has grown in the face of decades of welfare retrenchment across most advanced economies (Brenner et al., 2010; Doling and Ronald, 2010), alongside rising labour market inequality and precarity (OECD, 2019; Solt, 2020). Such trends are mutually constitutive with inequalities in socio-economic position reinforced – and, as we would contend, amplified – through divergences on the housing market.
While the growing importance of housing wealth is widely recognized, a central dimension that has often been underestimated, are the full implications of the uniquely spatial nature of housing that sets it apart from many other assets. Housing wealth is particularly contingent on geographically-situated market trends, with where households enter homeownership thus strongly structuring subsequent wealth trajectories. While a variety of geographic scholarship – across core fields such as uneven development, gentrification, segregation and housing financialization (e.g. Aalbers, 2016, 2017; Brenner et al., 2010; Harvey, 1989, 2002; Smith, 2010) – has highlighted spatial divides in the housing market, evidence on how space actively structures housing wealth distribution at the macro-level is lacking. Crucially, there is reason to believe that spatial inequalities in property wealth accumulation are increasing. Beyond some relevant recent scholarship (Arundel and Hochstenbach, 2020; Hochstenbach and Arundel, 2020), there remains limited empirical research into changing spatial dynamics of housing markets and their implications on driving housing wealth inequality across societies.
This research contributes to the limited empirical scholarship, turning to the case of Spain, to directly assess dynamics of spatial polarization 2 in housing wealth accumulation across the national territory. The focus is in analysing spatial inequality of housing market gains over time. While explaining causal drivers is beyond the intended scope of the research, we outline in the theoretical discussions below key processes that may drive such polarization. Making use of an innovative and detailed geographic dataset over the past decade, we expose significant trends in growing spatial divides in housing values. Dynamics of increasing spatial inequality appeared largely resistant to the major crises of the Global Financial Crisis (GFC) and Covid-19 pandemic. Our results further reveal that more expensive housing market localities saw disproportionate total gains and, importantly, higher rates of appreciation in housing values. Taken together, our analyses uncover how the spatial sorting of housing market gains can act as a mechanism to amplify wealth divides with fundamental significance towards societal inequality.
Literature
The centrality of housing in wealth and inequality
Put simply, housing is central to structuring socio-economic divides in society. At its core, access to adequate housing is essential in providing shelter and the attainment of key life-trajectories, including independence or family formation (Mulder and Billari, 2010; Vignoli et al., 2013). Distinctions in housing access, stability and quality have been associated with a range of differentiated outcomes, including in transitions to adulthood (Arundel and Ronald, 2016; Forrest and Yip, 2012), fertility (Mulder and Billari, 2010), wellbeing (Rolfe et al., 2020; WHO, 2018), physical and mental health (Arundel et al., 2022; Singh et al., 2019), social status (Foley, 1980) and access to better employment, education or other locational opportunities (Acolin and Wachter, 2017; Dorling, 2014; Israel and Frenkel, 2020).
However, within the marketized system of homeownership dominant across most advanced economies, housing not only represents material shelter but fulfils an investment function that can be just as important, or even more so. Property is crucially both a store of wealth and often a means towards speculative asset accumulation (Forrest, 2021; Saunders, 1990). Residential real estate constitutes, by far, the largest store of wealth globally (Savills, 2021) and has become the main financial asset for most households (Causa et al., 2019; OECD, 2023c; Rowlingson and McKay, 2012), central to families’ economic security and wealth accumulation (Ronald and Arundel, 2022). At a macro-level, dynamics of housing wealth distribution are fundamental to structuring inequalities. While a majority of households are financially engaged with the housing market, housing conditions and outcomes in property wealth accumulation vary drastically.
Housing wealth matters in the present and, even more so, over the longer-term. Although not as ‘liquid’ as other financial assets or savings, even before full capitalization through its sale, it can be leveraged towards households’ consumption – in housing and beyond – promoting further capital accumulation (Arundel, 2017). Its economic advantages in the shorter-term involve direct financial leveraging such as through equity release and as collateral for further investment (Lowe et al., 2012) as well as indirect factors, such as savings from imputed rent (Richardson and Dolling, 2005; Tunstall et al., 2013) or locational advantages in access to better employment and education opportunities (Acolin and Wachter, 2017; Dorling, 2014). While local housing market growth translates to wealth gains for homeowners, a caveat is that without selling this could translate to higher costs through increased taxation. This varies substantially across contexts, however, with some countries, including Spain, more minimally affected by changes in property taxation. 3
Crucially, beyond the shorter-term, housing assets are even more fundamental to the longer-term structuring of inequalities. Through invivo transfers and especially inheritance (often taxed minimally), housing wealth is central to reproducing stratification across generations (Druta and Ronald, 2017; Galster and Wessel, 2019; Worth, 2021). Homeownership facilitates wealth accumulation over the life-course (Lersch and Dewilde, 2018) which is then commonly transferred to offspring. Given both inequalities in access to the housing market and stark variations in wealth accumulation among homeowners, divides are then reproduced – and potentially intensified – across generations.
Moreover, the importance of property assets for households has only deepened in the face of ongoing retrenchment of state welfare support (Brenner et al., 2010; Doling and Ronald, 2010), labour restructuring towards increased precarity (Bell and Blanchflower, 2011; Stockhammer, 2013) and stagnating wages which have emphasized the dominance of assets over income (Adkins et al., 2020; August et al., 2023). Households not only face greater economic risks but are charged to manage these through individualized strategies. What has been termed a shift from state support to ‘asset-based welfare’ has, in practice, implied ‘housing-asset-based welfare’ (Conley and Gifford, 2006; Doling and Ronald, 2010).
Rising housing wealth inequalities
Historically, many countries saw a boom in homeownership over the second half of the last century. Indeed, while at the end of WWII owner-occupation was a minority in every one of the future EU25 countries, by the turn of the millennium it had become dominant in all but Germany (Atterhog, 2006; Arundel & Doling, 2017). In the Spanish context, homeownership was strongly promoted by the Franco-regime under ideological and economic motives, elaborated below, and ballooned from less than half in the 1950s to over 70% by the 1970s (Candela, 2017). Initial decades of growth in homeownership across many countries were marked by relatively widespread access, greater housing affordability and more stable labour conditions (Conley and Gifford, 2006; Forrest and Hirayama, 2009) and did, in many contexts, involve a greater equalization of wealth (Arundel, 2017; Atkinson, 1983).
While narratives on homeownership as a mechanism towards wealth equalization and economic security have persisted, evidence has pointed to rising inequalities in housing and property wealth (Arundel and Ronald, 2021). Indeed, our current era of ‘late homeownership’ (Forrest and Hirayama, 2018) is marked by stark inequalities in access, precarity in housing conditions, and a growing concentration of housing stock and wealth (August et al., 2023; Boertien and López-Gay, 2023; Lennartz et al., 2016; Ronald and Kadi, 2017). This has gone hand in hand with rising inequalities in wages and employment stability in many contexts (OECD, 2019; Solt, 2020), with a growing reliance on intergenerational support, wherein family background is increasingly determinant of success on the housing market (Galster and Wessel, 2019; Ronald and Arundel, 2022).
Broader transformations in housing markets towards financialization have only increased the speculative investment function of housing and intensified inequalities. While a diverse set of processes, financialization has seen the ongoing commodification of housing, increased flows of investment into property, and expanded mortgage markets (Arundel, 2017; Lennartz et al., 2012; Saunders, 1990). Enabled and encouraged by neoliberal re-regulation, this pushed a leveraging of increasing capital and debt for housing and saw a stronger embedding of real estate into local, global and multi-scalar circuits of capital (Aalbers, 2008; Aalbers and Christophers, 2014; Brill and Özogul, 2021). Expanded credit and increased property investment promoted, over the long-term, a boom in housing prices across most countries (International Monetary Fund, 2023; Whitehead and Williams, 2011), implying accelerated wealth accumulation among ‘market insiders’, while homeownership entry became increasingly out of reach for those without sufficient financial capacity (Allegré and Timbeau, 2015; Arundel, 2017).
The processes described above have seemingly entrenched housing’s importance towards socio-economic position. Housing debates have variously framed housing inequalities through a Marxist or Weberian lens – with the former positing housing outcomes as simply reflecting labour-determined class positions and the latter proposing housing classes themselves as determinative beyond labour (Rex and Moore, 1967; Saunders, 1990). Growing evidence gives credence to a Weberian perspective, revealing housing as important to class divides above and beyond other socio-economic characteristics (Freeman, 2017; Ryan-Collins and Murray, 2023; Saunders, 1990; Wind et al., 2017). In other words, while income and labour position remain important – also in housing market entry – differences in housing positions are increasingly primary and may not align with other class divisions. Moreover, such dynamics are self-reinforcing. As Hochstenbach and Aalbers (2023: 9) assert, ‘housing drives wealth, which, in return, drives housing’. As such, the sorting of populations based on socio-economic status and distribution of housing wealth gains are mutually constitutive. While this implies a complex, bidirectional link between housing and other inequalities, it is precisely this mutually self-reinforcing dynamic that makes housing so impactful in terms of wealth inequality. As we contend below, the uniquely spatial nature of property assets is a crucial factor by which housing acts in reinforcing inequalities.
The spatial nature of housing wealth inequality
While ‘location, location, location’ may be a common real-estate trope, the societal implications of the uniquely spatial dynamics of property wealth are insufficiently understood. Housing is characterized by spatial fixity with values strongly location-contingent. At the same time, access to (location-contingent) property investment is more restricted than other commodities given its mostly indivisible nature, large buy-in threshold and restrictions in financing criteria (van Hoenselaar et al., 2021). Put simply, unlike more liquid investments, such as stock shares, households cannot easily ‘buy into property anywhere’ – even more so when considering its function as shelter. With spatial inequality in the rates of housing asset growth, prospects for wealth accumulation are thus strongly structured by location of housing investment (Arundel and Hochstenbach, 2020). It is not simply a question of access to homeownership but where one enters the housing market which fundamentally affects wealth trajectories.
Understanding the centrality of space in property wealth accumulation builds on an important body of geographical scholarship theorizing the interaction of space and capital across economies. Neil Smith’s work on uneven development, for example, saw spatial inequality in capital investment and disinvestment as inherent towards the capitalist system (Smith, 1982, 2010). Alongside other critical geographic scholars, this represented an important counterpoint to (neo)classical economic theory through positing that spatial inequality in capital accumulation is a permanent feature of the capitalist mode of production and value extraction (Harvey, 2002; Smith, 1982, 2010), and emphasized how contemporary market-oriented/neoliberal restructuring has been inherently uneven, or variegated, across different scales (Brenner et al., 2010; Peck and Theodore, 2007). At a national scale, uneven development has often been reinforced by state policies prioritizing certain localities (Brenner, 2004; Harvey, 1989) – commonly major urban centres – spurred by notions of global competition between city regions (Brenner, 1998; Sassen, 1991). A large volume of related research across geography and urban studies has examined how social and economic inequalities map onto space across different scales; from gentrification and segregation, to city network theory, to multi-scalar processes of financialization and capital flows. Scholarship on the ‘variegated nature of housing financialization’ importantly argued for recognition of the spatial contingency and unevenness of financialized flows of capital into housing markets (Aalbers, 2017; French et al., 2011), however, the concept has most commonly been applied to differences between countries rather than across national territories. Albeit not all explicitly centred on housing, such literatures underscore the extent that dynamics of socio-economic spatial inequality are particularly reflected in the housing market.
Towards a spatial polarization of housing markets?
While housing markets always exhibit spatial variation, rising inequality in the ‘landscape’ of accumulation rates would have significant impacts on wealth divides. Crucially, there is reason to believe that the spatial polarization of housing markets is intensifying, however, there remains a surprising lack of empirical evidence into such dynamics. The broader processes outlined above imply increased investment flows, expanded credit and an embedding of housing into (global) capital circuits (Aalbers, 2008, 2016; Aalbers and Christophers, 2014; Fernandez and Aalbers, 2016). Such capital flows into real estate, however, appear strongly uneven spatially, concentrating in particular ‘prime’ locales for secure investment and returns (August et al., 2023; Fernandez and Aalbers, 2016) – usually within first and second-tier global cities (Fernandez et al., 2016; Sassen, 1991), regional centres or select other submarkets such as desirable resort/leisure or burgeoning student cities (Carlino and Saiz, 2019; Hochstenbach, 2023). Conversely, more peripheral, less desirable localities may be faced with capital retreat, decline and disinvestment (Arundel and Hochstenbach, 2020; Martinez-Fernandez et al., 2012). Given the link between the sorting of socio-economic populations and housing market dynamics, such trends are likely self-reinforcing with concentrated investment flows exacerbating affordability and access for households without sufficient capital while driving asset growth for those able to invest in these prime submarkets (Kemp, 2015). Financialization and the global interlinking of real estate markets has also spurred volatility (Aalbers, 2016). Such volatility in gains and risk are increasingly heterogeneous across subsectors (Larsen and Sommervoll, 2004) and geographic space (Tammaru et al., 2015) with prime submarkets potentially more shielded from (full) downturns.
While the processes above hint at a likely spatial concentration of flows of capital into property markets, existing housing scholarship has faced critiques for remaining theoretically abstract or constrained to specific cases with a lack of empirical evidence on macro-level outcomes (Aalbers, 2016; Christophers, 2015). To date, only a very small number of studies have explicitly tackled macro-level dynamics of housing market spatial polarization.
Several studies have looked at divergence in housing values/prices but only at limited geographical scales. One recent study of China, for example, found high-levels of spatial inequality in house prices and substantial volatility in Gini coefficients of prices over 2010–2019 (Zhao et al., 2021). However, the study looked at provincial averages, masking vast intra-provincial variability and thus missing the level at which values are primarily influenced by location. Research carried out by the OECD provides a comparative assessment across member states of divergence in house prices between their largest city and the national average (OECD, 2023a). The analyses do point to increasing disparities with a growing concentration of housing capital in primary cities. While noteworthy, the limited binary geographic scope and neglect of intra-city differences necessitates more refined analyses to assess such dynamics.
Within the economics literature, a subset of research from the US has pointed to increasing spatial divergences in housing prices. Van Nieuwerburgh and Weill (2010) modelled the distribution of house prices across US metropolitan regions from 1975 to 1994 and show increasing differentiation, with Cun and Pesaran (2018) finding similar increases in price dispersion from 1976 to 2014. Another US study, Gyourko et al. (2013) pointed to growing spatial differences in average house prices over a longer period from 1950 to 2000, particularly driven by select prime localities (what they term ‘superstar’ cities). While such research points to longer-term trends in housing market spatial polarization, a major limitation is that the studies all employ urban or metropolitan area averages thereby missing crucial smaller-scale dynamics that largely structure housing market trends.
An exception that stands out as particularly relevant has been recent research undertaken in the Netherlands (Arundel and Hochstenbach, 2020; Hochstenbach and Arundel, 2020). The research explicitly assessed changing trends in spatial inequality at the scale of neighbourhood units across the entire country using full dwelling and population register datasets. The results pointed to a clear trend of increasing spatial divergence in the rates of house value appreciation over 2006–2018. Crucially, spatial polarization also appeared resistant to the post-GFC housing market crash (Arundel and Hochstenbach, 2020; Hochstenbach and Arundel, 2020). Linking population data, the research further revealed that households with more privileged socio-economic status and wealthier parents were more likely to enter submarkets with higher returns, providing mechanistic evidence of how divides across space combine with differentiated access as a driver for amplifying inequalities (Arundel and Hochstenbach, 2020). Relatedly, a study across major Swedish cities also found associations between higher socio-economic status and higher returns on housing assets based on population sorting across space (Wind and Hedman, 2018), however, the authors didn’t directly assess spatial polarization or capture dynamics beyond major cities. These studies, and particularly the Dutch research, provide a clear motivation for further assessing spatial dynamics in housing wealth accumulation. Our analysis of the expansive and diverse context of Spain offers a valuable contribution to this nascent field, potential confirmation of trends beyond the singular comprehensive Dutch case, and more recent data including an examination of trends over the Covid-19 crisis period.
The Spanish context
Spain represents a salient case for examining housing wealth dynamics for several reasons. First, the extent of homeownership: although seeing slight declines in recent years, Spain is well above the EU and OECD average with levels of over 75% in 2020 (OECD, 2023b). Secondly, the spread of homeownership has entrenched the home as the primary component of household wealth in Spain – more than 80% for the lower 25th percentile – with one of the highest wealth-to-income ratios, at almost seven times in 2020 (Bank of Spain, 2023). Third, housing has been for decades an important financial and investment asset for households (Torrado et al., 2020). For this reason, Spain has the highest proportion of vacant and secondary homes in the EU25, at close to 30% of the stock according to latest available data (Instituto Nacional de Estadistica [INE], 2011). Finally, it is worth highlighting the virulence with which the real estate bubble of the late 1990s/early 2000s was manifested and its subsequent burst post-2008, with macroeconomic and social consequences not seen in other European countries (Kohl, 2021; Muñoz and Cueto, 2017; Pareja-Eastaway and Sánchez-Martínez, 2017).
The characteristics that make Spain a singular case are not new, but a consequence of the housing system promoted since the end of the civil war. Under the fascist Franco-regime from 1939 to 1976, homeownership was heavily promoted, motivated by ideological-political aims of social control, as the basis of the Spanish welfare state, and economic goals with housing construction a key driver of growth (Candela, 2017; Fernández Carbajal, 2003). This resulted in a stark rise in homeownership, a decrease of a formerly important rental sector (Pareja-Eastaway and Sánchez-Martínez, 2011), the virtual non-existence of social housing (Leal and Martínez, 2016), deregulation and the primacy of market development, and an upward trend in sales prices (Fernández Carbajal, 2003). These processes had two basic consequences for housing wealth inequality. First, housing divisions were manifested primarily within homeownership; with the lower classes concentrated in low-quality housing in areas with minimal urban infrastructure and the middle classes accessing higher-quality submarkets with stronger prospects of rising values (Duque and Susino, 2016). Second, while most were homeowners, there was a differentiation in the spread of multiple property ownership among the middle classes (August et al., 2023). These trends only intensified following the arrival of democracy in the late 1970s. The persistence of pro-homeownership policies, favourable tax deductions, the liberalization of the housing and banking sectors and new funding related to EU integration (Pareja-Eastaway and Sánchez-Martínez, 2015; Rodríguez, 2010) accelerated processes of financialization. The absence of alternative tenures, the importance of property assets towards welfare strategies, and the lack of regulation drove sunstantial real estate bubbles (Martínez-Toledano, 2017).
Although in boom periods price increases were widespread, these also exhibited a clear spatial differentiation. Across Spain, investment first and foremost concentrated within and near areas of high social prestige (Leal and Domínguez-Pérez, 2008). Beyond major cities, investment particularly flowed to coastal touristic areas (Módenes Cabrerizo and López Colás, 2007; Serrano Martínez, 2003). The most extreme manifestation of this process began in the late 1990s and lasted until the GFC with a major boom in residential land development (Leal and Martínez, 2016) and a strongly financialized debt-based growth model (Kohl, 2021) leading to the largest recorded increase in house values (Rodríguez and López, 2011). Following the GFC, the sharp downturn was taken as an opportunity for wealthier households to acquire (additional) homes more cheaply, alongside international funds purchasing substantial portfolios, particularly in large cities (Janoschka et al., 2020). These flows of investments resulted in a return to rising values over the last decade (Gabor and Kohl, 2022; Gil García and Martínez López, 2021) focused on markets with beneficial rental returns (Pareja-Eastaway and Sánchez-Martínez, 2017) and ‘touristification’ growth areas (Yrigoy, 2019). The Covid-19 period saw these trends largely continuing, if not accelerated (Gabor and Kohl, 2022).
Although Spain has historically had relatively lower levels of wealth inequality compared to other OECD countries, the years since the GFC have witnessed considerable increases. Aggregate data shows the net wealth held by the top 10% increasing from 41% in 2005 to 54% in 2020 (Bank of Spain, 2023). One important dynamic has been an increasing concentration of the housing stock among a select group able to invest in multiple properties (Boertien and López-Gay, 2023) often rented to a rising share in the private rental sector (Byrne, 2019). Housing clearly plays a central role in growing wealth inequalities in Spain, widening divides between owners and non-owners as well as within the homeowning majority, the latter being the particular focus of this research. While there is evidence of aggregate trends, how these divergences in property assets play out across space and the active role of spatial inequality in driving differentiated wealth accumulation remains poorly understood.
Data and methods
This research directly confronts the spatial dynamics of housing market inequality in the Spanish case through a detailed geographical analysis of housing wealth accumulation and an assessment of changing spatial inequality in rates of house value increases over time.
Data
The data was acquired from Idealista, Spain’s largest real estate listing company capturing a vast majority of properties sold in Spain. The dataset provides average housing values per square metre at the level of census tracts (secciones censales) over the period 2012–2022, based on all listed properties within each tract. There are a couple of caveats that must be noted in relation to the data. Firstly, the dataset relies on listed values, as actual transfer prices are not available. Using listing prices as a proxy is a common strategy in countries where there are no official records of selling prices, such as in Italy (Curto et al., 2015) or Spain (Marmolejo-Duarte, 2017). On average, listing prices in Spain tend to be higher than final selling prices. For a comparable national assessment in Germany where data is available, Dinkel (2011) estimated selling prices were 15.2% lower than the listing prices. Looking at official ‘appraisal sale prices’ 4 – closer to transfer values and available at the provincial level (Ministry of Transport, Mobility and Urban Agenda [MITMA], 2023a) – we found both very high correlation overall and, in terms of geographic variation, relatively less overshot of listing values in higher compared to lower value areas. This points to our analysis likely representing a more conservative estimate of spatial inequality, attesting to the robustness of assessed spatial polarization.
Secondly, while housing values per square metre control for variations and changes in the size of properties, we are not directly able to consider other qualitative changes such as through renovations, nor is it possible to isolate new builds. This can represent a limitation where increases in values are caused by renovation improvements or potential differences in quality associated with new construction. While recognizing some limitations, given that we examine averages based on larger samples across geographic units, these effects would be minimal 5 and measured changes would largely capture market trends beyond included cases of quality improvements. Furthermore, the scale of focus in capturing the aggregated national level dynamics of inequality limits the bias involved.
While provided at quarterly intervals, data was aggregated to annual averages to improve sample coverage. All values were also adjusted for inflation (set to 2021 euros) using the Consumer Price Index (INE, 2023). Census tracts provide a valuable geographic scale for examining housing market developments as they represent relatively small, coherent areas – exhibiting a mean of about 1300 inhabitants and standard deviation of 730. Within built-up areas, they consist of small neighbourhood units likely to function as cohesive local housing submarkets. They thus provide a fine enough scale to capture important intra-city or intra-region dynamics of divergence in the housing market. While we primarily focus on census tracts, the data was additionally aggregated to municipalities (municipios) to examine higher-scale inequality dynamics between cities as well as assess multi-scalar robustness.
There remained a small share of census tracts that were missing due to insufficient listings. This ranged between 3.5% and 6.4% of census tracts dependent on the year. Missing values were tracts of low population/market turnover and distributed across the territory, mostly in rural areas. In order to correct these small gaps in data, we applied spatial interpolation using GIS. Empirical Bayesian Krigging (EBK) was used to create an estimation surface. Modelling specifications included a variable search radius with a sampling of 10–15 neighbouring units, a K-Bessel transformation to improve prediction accuracy, and subset size and simulations set to 100 with an overlap factor of one. Post-estimation validation demonstrated high model fit. This interpolation was then repeated for each data year to estimate all missing tracts. Given the low missing shares and spatially-correlated nature of housing markets, this gives us a best-possible complete territorial dataset. Interpolating missing values is preferred over running spatial inequality analyses while retaining ‘gaps’ since these discontinuities can skew some results, nonetheless, we also ran analyses without EBK interpolation as robustness checks.
GIS mapping
Using our complete territorial dataset, rates of change in housing values per square metre were mapped in GIS. With strong variations in population and geographic size across tracts, a direct mapping of values provides a misleading picture, as sparsely populated (rural) units appear most prominent. Conversely, highly-populated urban tracts are very small and therefore become obscured. To correct for this, a ‘cartogram’ was generated which adjusts unit sizes based on population – being highly correlated with the number of dwellings and our best proxy for the relative importance of the housing market. We use the 2011 population, roughly at the start of the study period – also used in weighting inequality measures, as elaborated below. This correction follows closely the approach in the related Dutch studies (Arundel and Hochstenbach, 2020; Hochstenbach and Arundel, 2020). Cartograms were generated by applying the Gastner-Newman diffusion algorithm (Gastner and Newman, 2004).
Spatial inequality analyses
Beyond mapping trends, we then applied a set of holistic inequality measures to directly assess spatial inequality of house values across census tracts (as well as repeated for municipalities). We employ boundary divisions from 2011 to maintain consistency over our dataset period. In measuring spatial inequality, our primary assessment is a Gini coefficient, a standard measure of inequality – providing a value ranging from 0 to 100, where 0 indicates perfect equality and 100 represents absolute inequality. In other words, a hypothetical zero would imply all areas have the same house values whereas 100 would mean only one area had value and all other areas would be ‘valueless’. Of course, these extremes are never expected, but through examining relative change, we can assess meaningful changes in spatial inequality. Additional intuitive measures of inequality ratios are included. A 90:10 as well as a 95:5 ratio is assessed, reporting on how many times higher housing values are at the 90th percentile versus 10th percentile and 95th versus 5th percentile, respectively.
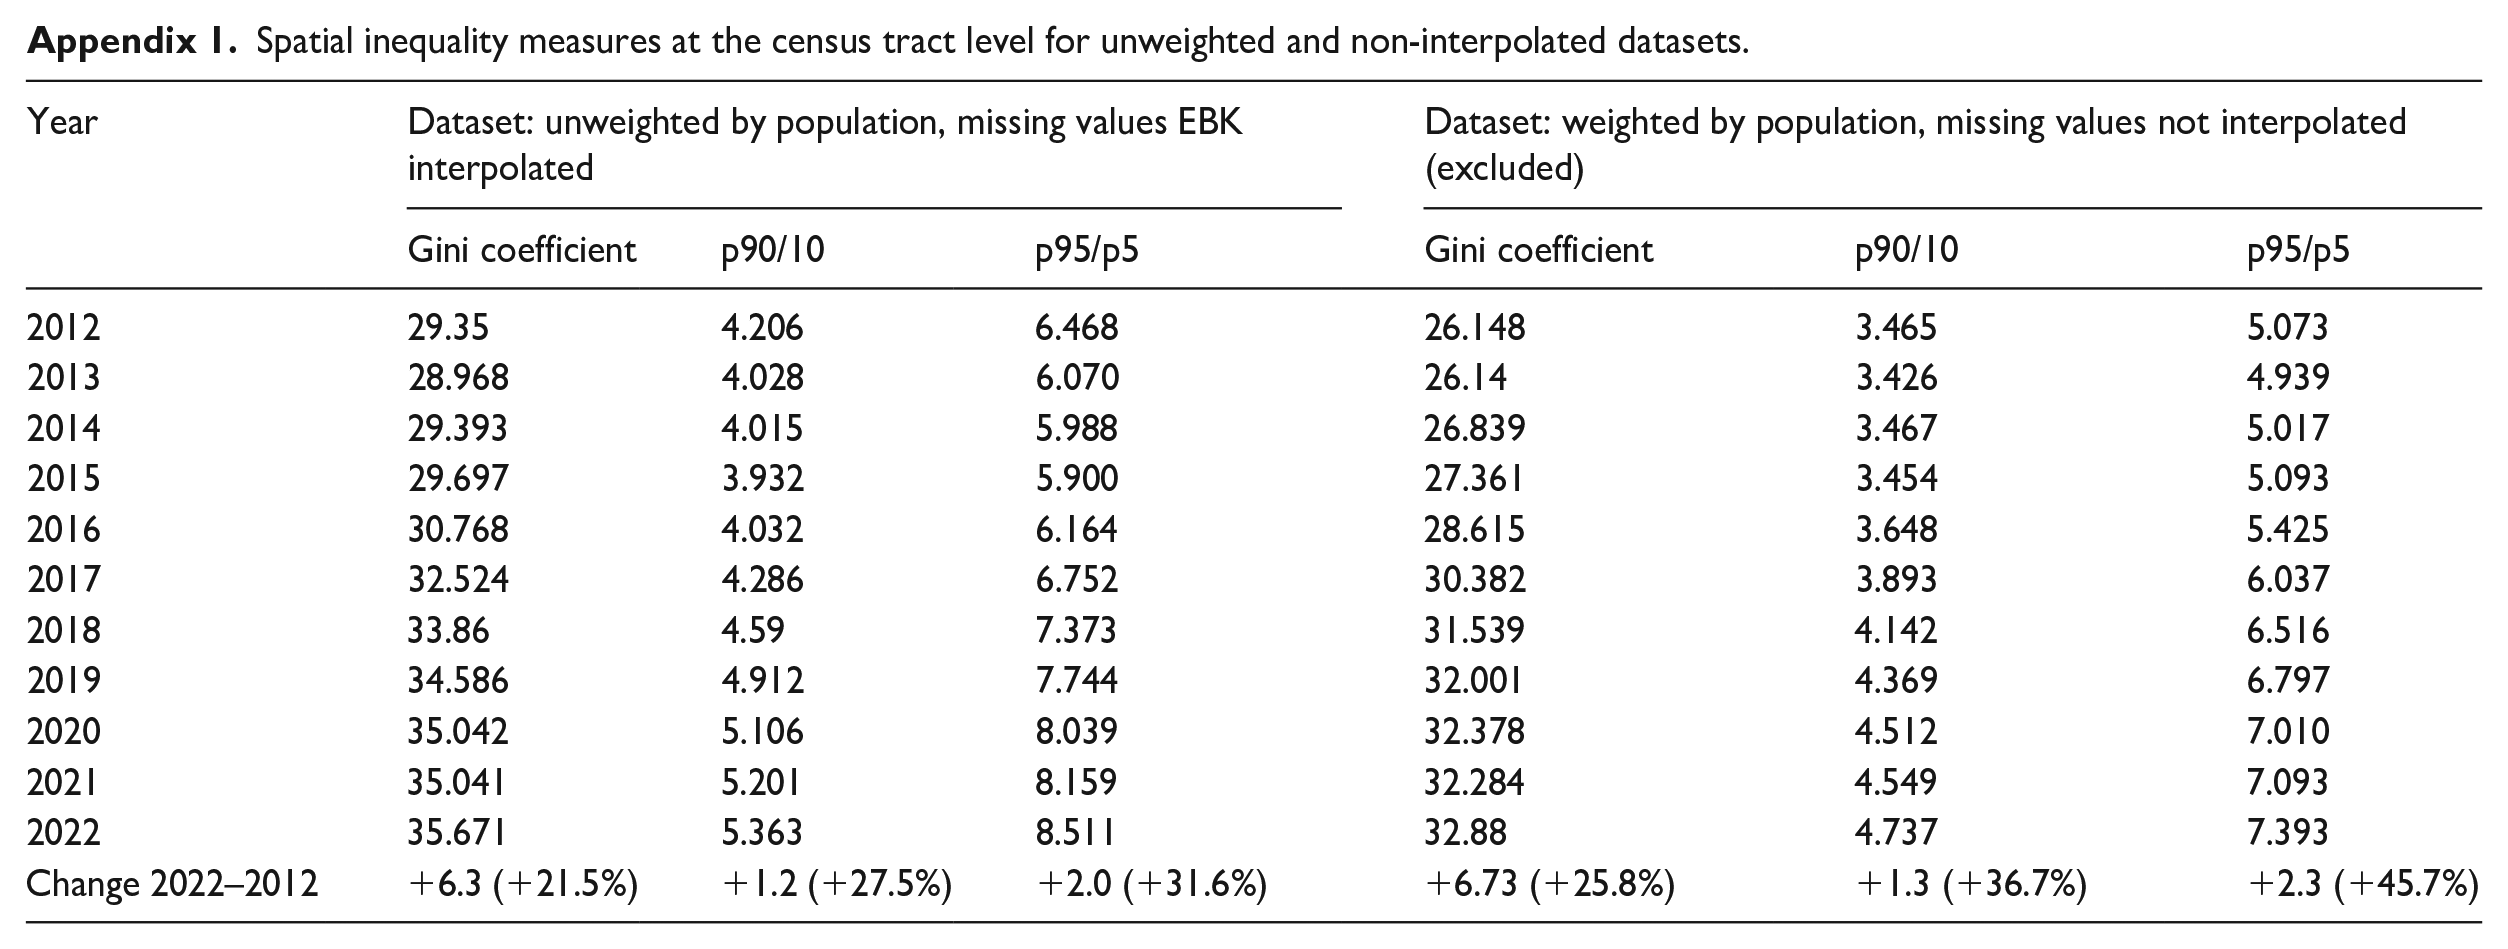
Crucially, we weight our geographic areas by population for both Gini and ratios to correct for strong variation across our units. In essence, this adjusts the importance of each unit in the analysis relative to the number of inhabitants (highly correlated with dwellings). As with the cartogram, we use 2011 population data to correctly match the geographic boundaries of our dataset. This thus represents the situation at the start of our analysis period. While we recognize population developments occurred over the period, differences would have only minor impact on the relative position of census tracts/municipalities overall and imply negligible effects on global measures across the territory. We additionally provide results for the unweighted Gini coefficients and ratios for comparison, alongside analyses run for the original dataset pre-interpolation (see Appendix). As noted in results, the highly comparable outcomes support the robustness of our findings.
Results
Housing value trends across Spain
We first examine the overall developments in housing values over the study period, based on our Idealista price dataset from 2012 to 2022. As noted above, our dataset covers the bottom of the post-GFC decline (the nadir occurring around 2016 in our dataset), followed by a subsequent period of relatively rapid housing value increases (see Gabor and Kohl, 2022; Gil García and Martínez López, 2021). Our dataset further captures the major development of the Covid-19 pandemic with 2020 considered the peak year and 2021–2022 representing a tentative late/post-Covid recovery.
Figure 1 first presents housing market developments in terms of average inflation-adjusted house values for all of Spain, as well as within the five largest municipalities. Total price developments in Spain confirm a decline until about 2016/2017, followed by a more rapid increase since. Nationally, price increases are only temporarily interrupted by a dip in 2020, the peak year of the pandemic, before returning to rapid increases in the final 2 years. These changes are also clear when visualizing relative price developments (shown subsequently in Figure 3). Looking at trends across the top five cities, we find some, namely Sevilla and Zaragoza, mostly mirroring the national trend. Valencia is similar although with a slightly more rapid increase post-2016. However, the two largest cities clearly stand apart with not only much higher values in absolute terms, but higher rates of increase, particularly for Madrid in the most recent years. While they also display more volatility and pronounced Covid-19 impacts, the overall pattern is a divergence between the two largest cities and the national average, implying dynamics of spatial polarization at the municipal level. This echoes results from many other OECD countries with growing differentiation in values between national averages and largest cities (OECD, 2023a). Taken together, our initial descriptive analyses, at minimum, hint at rising geographic divergence motivating further untangling of spatial inequality dynamics.
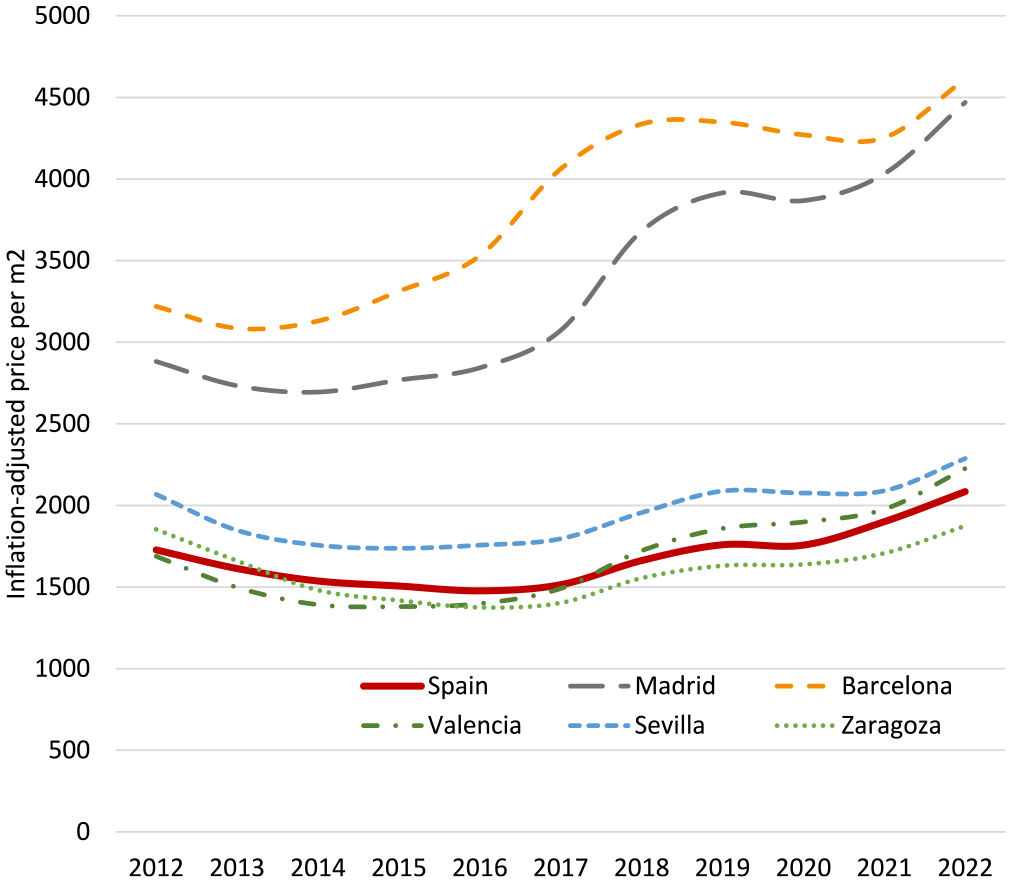
Average inflation-adjusted house value development in Spain and five largest municipalities 2012–2022.
We subsequently visualize spatial house value trends across the Spanish territory. As we outline in our methods, we map these developments through a cartogram approach that spatially adjusts census tracts relative to population (see Figure 2). While ‘geographically-distorted’, the cartogram provides a much more accurate representation when the size of the housing market is of importance, as in our case. The map also includes the borders of the top 10 municipalities and a non-distorted inset to facilitate interpretation. The resulting cartogram reveals a stark picture of the spatially uneven nature of housing market development. While large areas of the country saw real house values stagnating or even declining, we see select areas of concentrated housing wealth accumulation. In the case of Spain, the three largest cities of Madrid, Barcelona, Valencia exhibit a clear pattern of significantly higher gains over the period. We find similar developments in parts of Sevilla, Malaga, and particularly across many popular, touristic coastal regions along the Mediterranean and across the islands. Taken together, the story is one of a stark concentration of housing value growth in specific ‘prime’ markets – with select areas seeing doubling or even quadrupling of values over the decade, whereas vast expanses of the territory experienced limited growth or measurable declines. Beyond a visualization of spatial patterns, our GIS mapping uncovers strong geographic variability in potential gains on the housing market and underscores the importance of a spatial perspective when understanding dynamics of housing wealth accumulation.
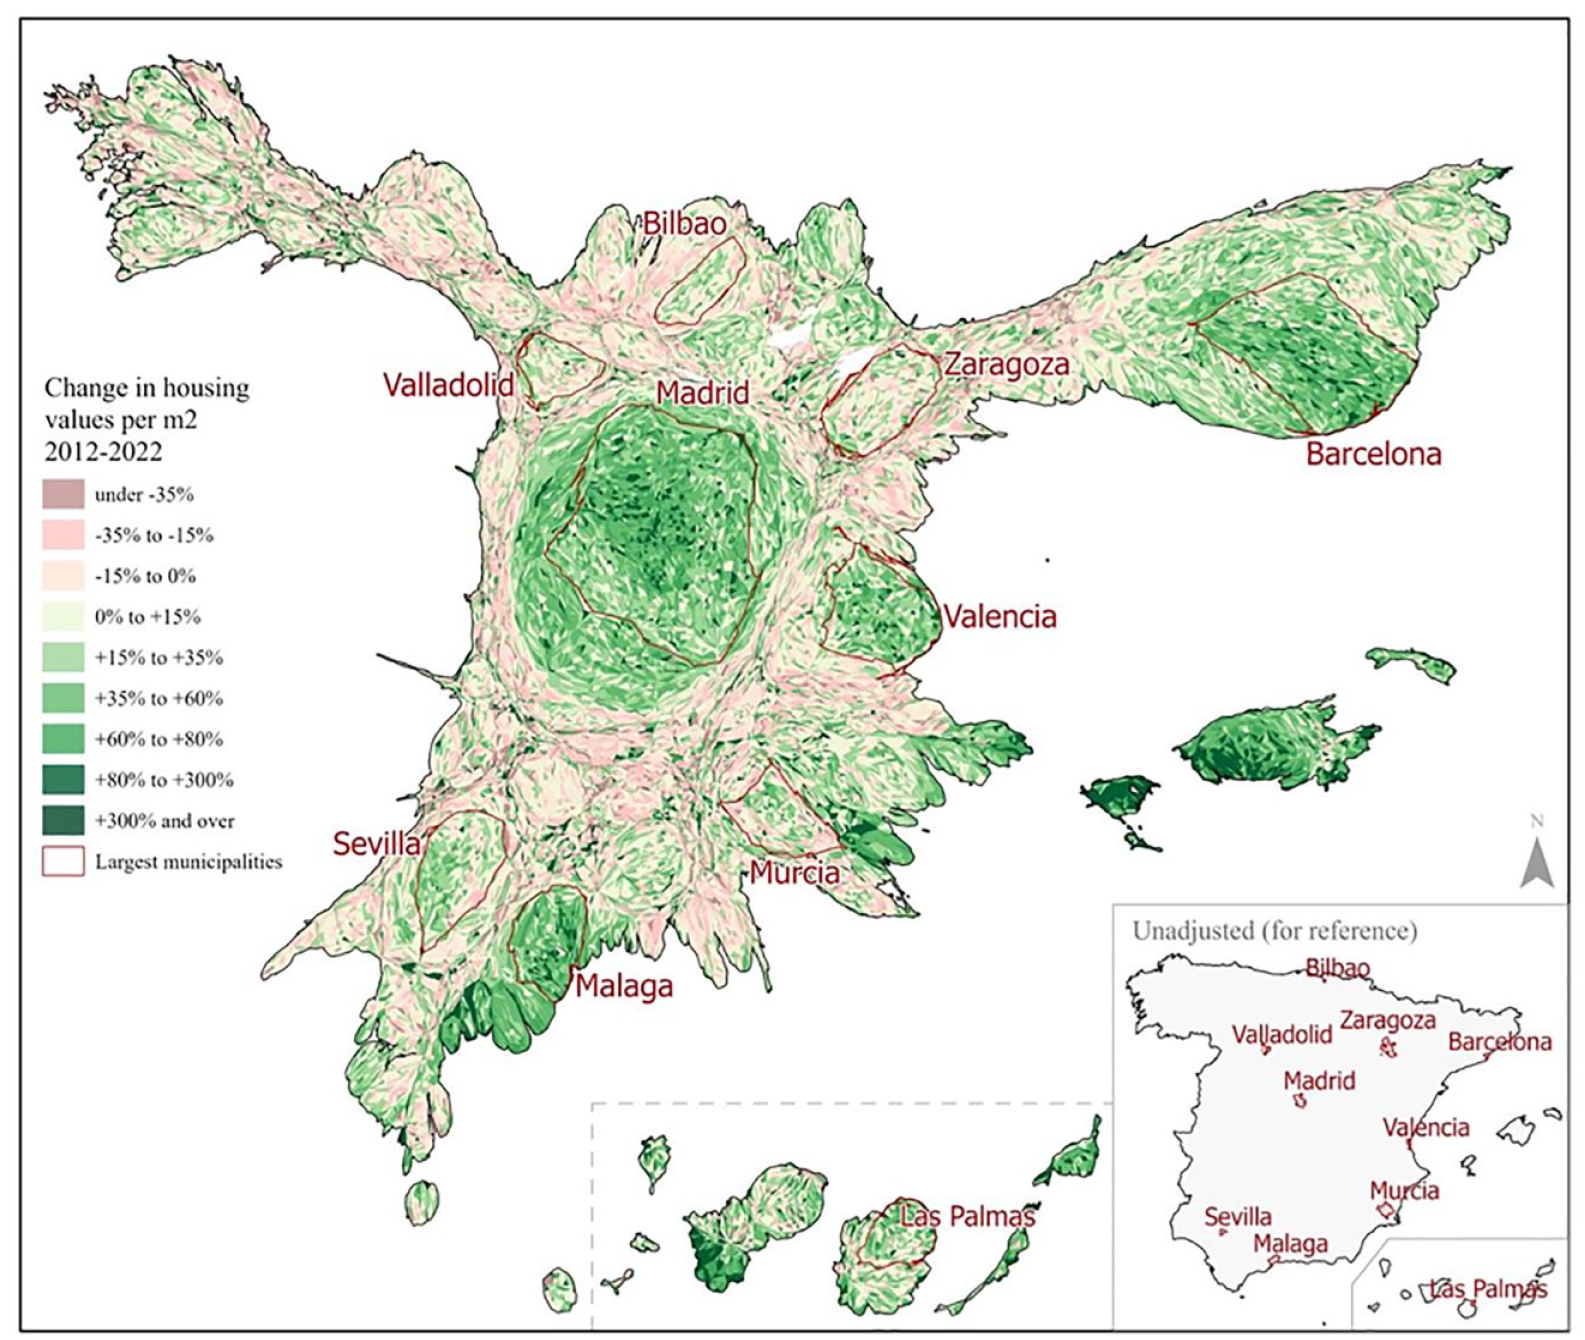
Cartogram mapping of inflation-adjusted rates of change in house values across Spain at the census tract level, 2012–2022. Cartogram adjusted by population.
Measuring spatial polarization
We next turn to our direct measures of spatial inequality in housing values across the Spanish territory. As noted in the data description, census tracts present the most useful level of analysis for examining location-contingent submarket variation. Nonetheless, we subsequently also look at municipality-level divergence to assess trends between cities and in considering scale-sensitivity of inequality dynamics (Wong, 2019).
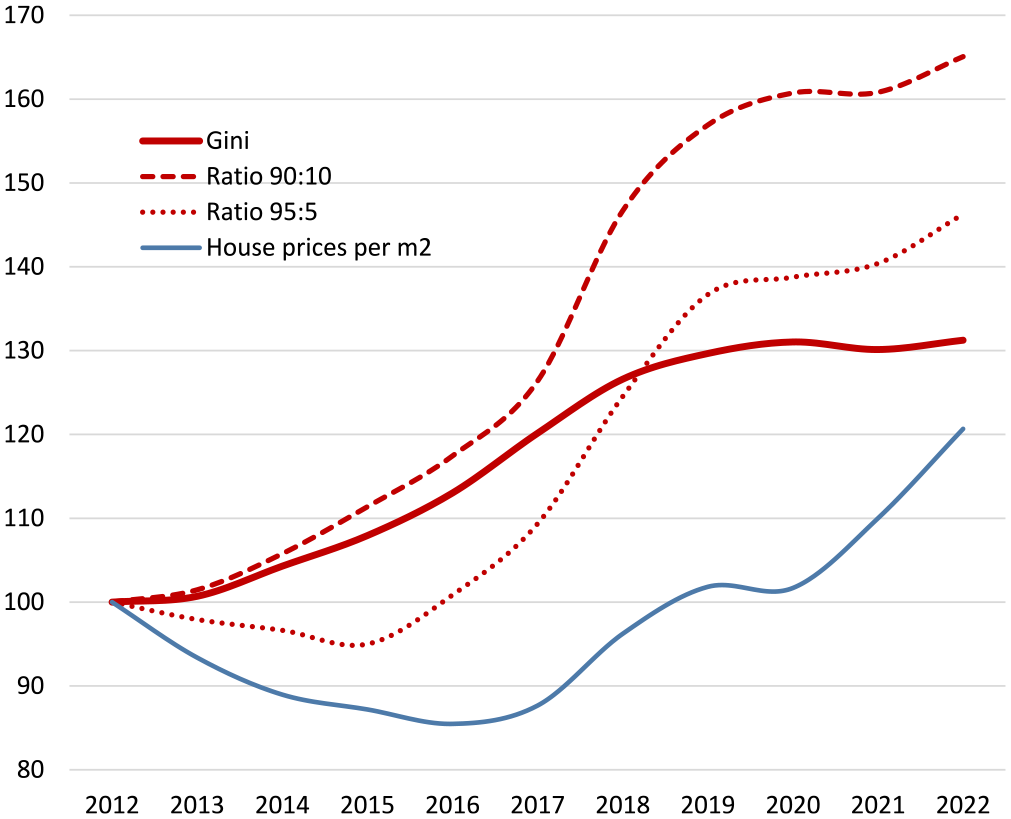
Figure 3 reveals developments in spatial inequality for average house values at the census tract level across Spain. We present the relative change (where 2012 = 100) in population-weighted Gini coefficients and percentile ratios, alongside the national trend in house prices for reference. Absolute Gini and ratios are additionally provided in Table 1. The findings reveal a dramatic result in terms of rising spatial inequality of housing values across Spain. Looking first at Gini developments (Figure 3) as the most holistic assessment of inequality across census tracts, we find a stark pattern of increasing spatial divergence. Given the nature of Gini values where relatively small changes can represent significant shifts in inequality, we find substantial and clear patterns of increasing spatial polarization in the housing market with a rise of about 25% in the Gini value over the decade (26.4–33.0). Growing spatial inequality is also apparent across our other measures. The 90:10 percentile ratio increased by over 35%, with values in the 90th percentile of tracts being 3.5 times higher than the 10th percentile in 2012 and rising to about five times greater in 2022. The 95:5 ratio is, as expected, higher at 5.1 in 2012, however, it has additionally risen more sharply, by roughly 45%, to 7.4 times in 2022.
Spatial inequality measures at the census tract level, nationally and within five largest municipalities.
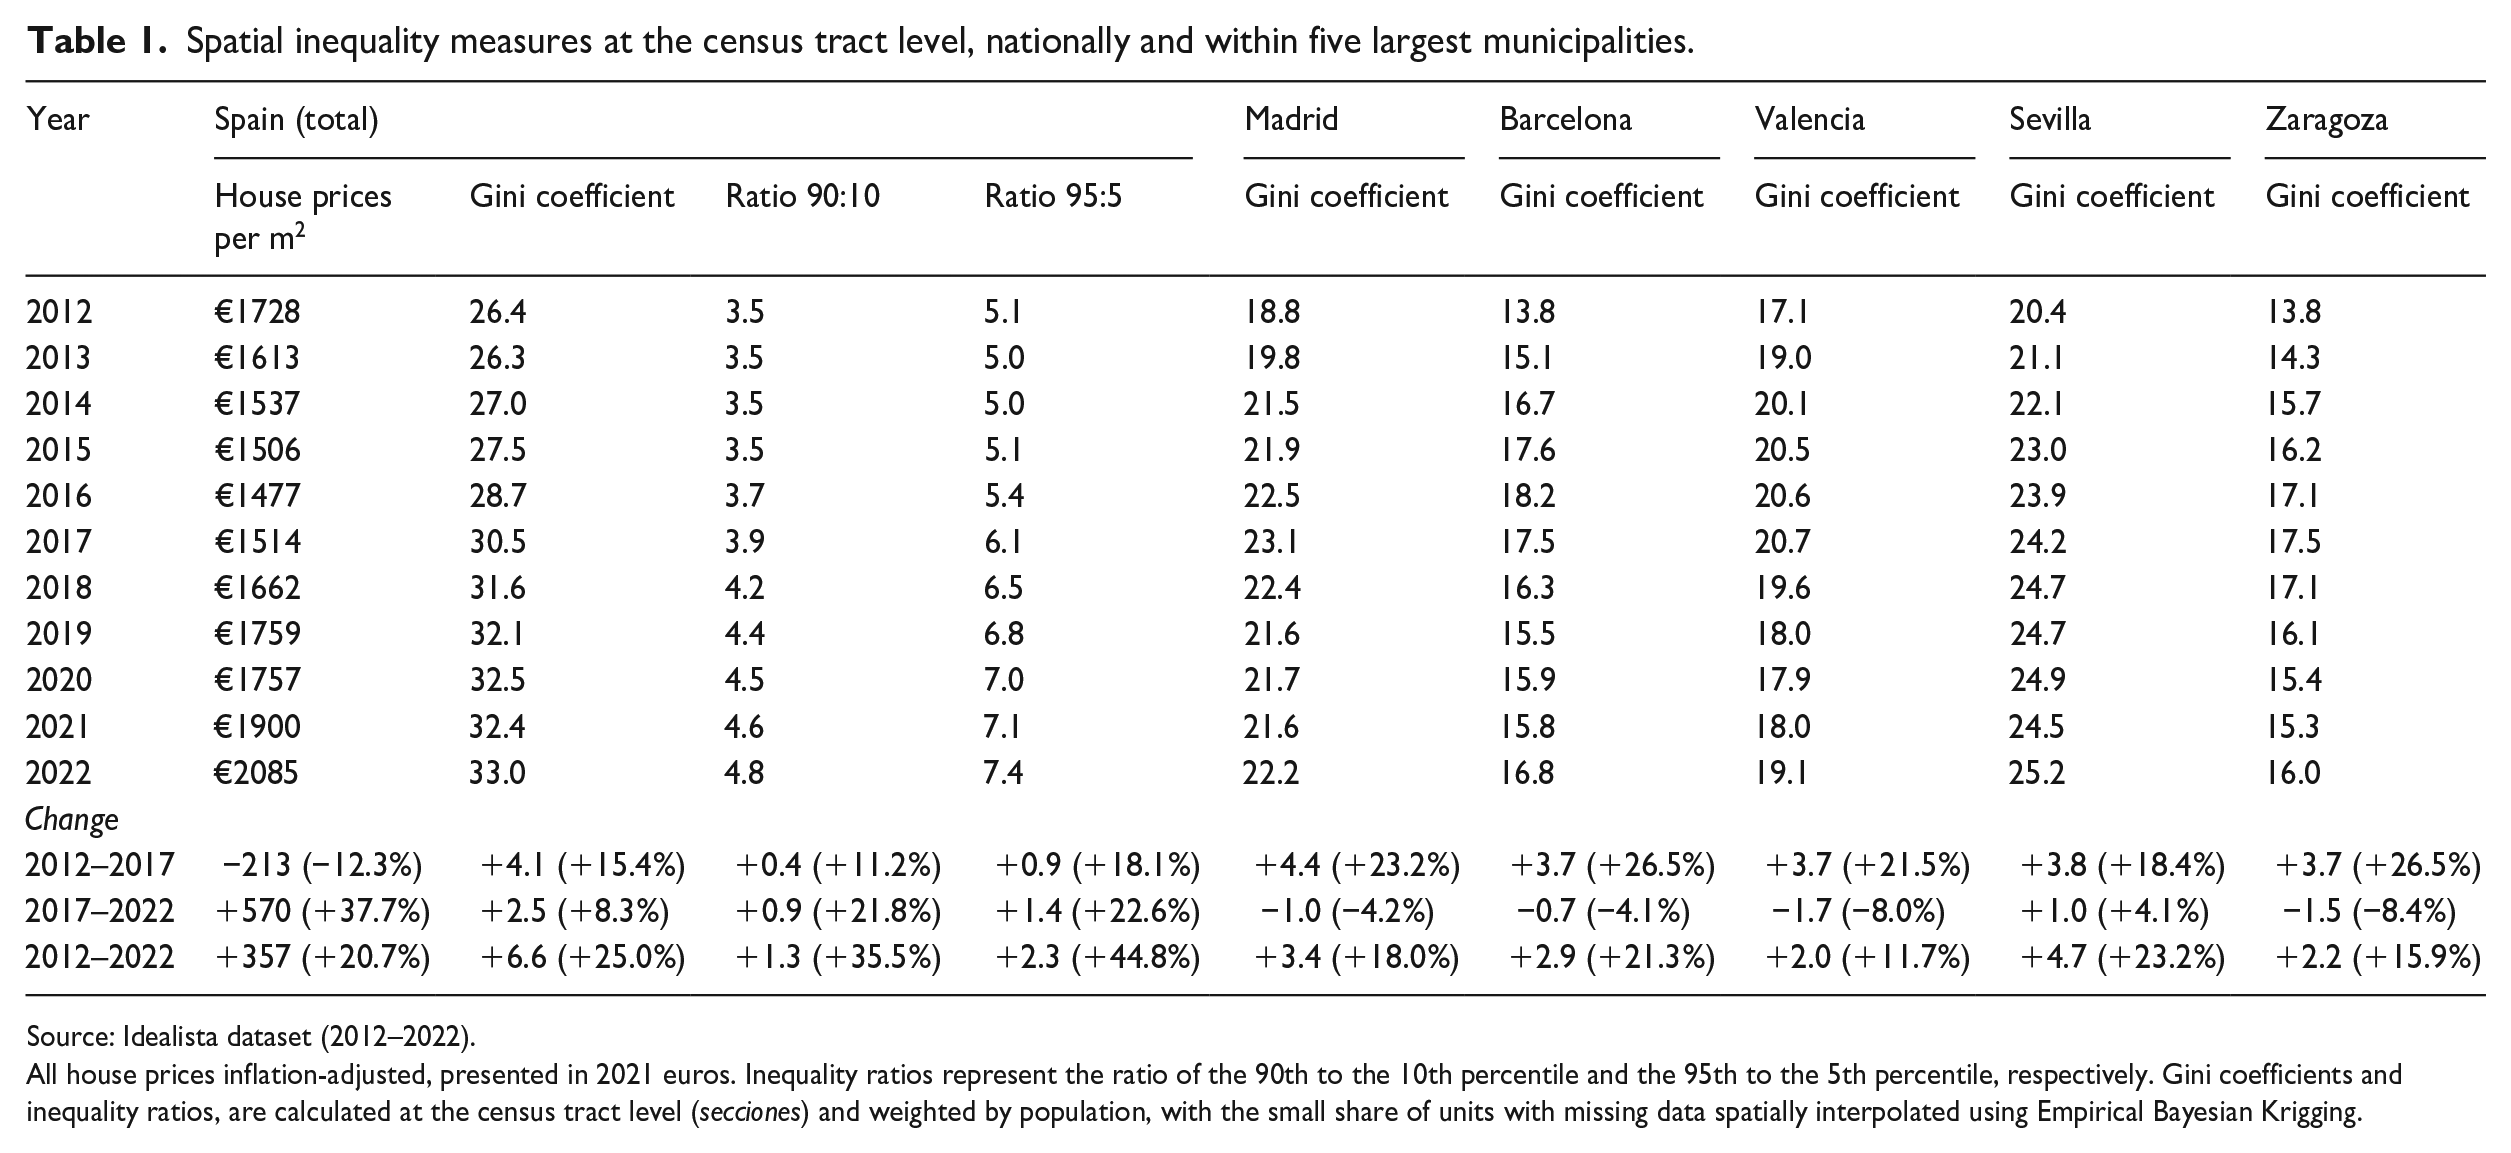
Source: Idealista dataset (2012–2022).
All house prices inflation-adjusted, presented in 2021 euros. Inequality ratios represent the ratio of the 90th to the 10th percentile and the 95th to the 5th percentile, respectively. Gini coefficients and inequality ratios, are calculated at the census tract level (secciones) and weighted by population, with the small share of units with missing data spatially interpolated using Empirical Bayesian Krigging.
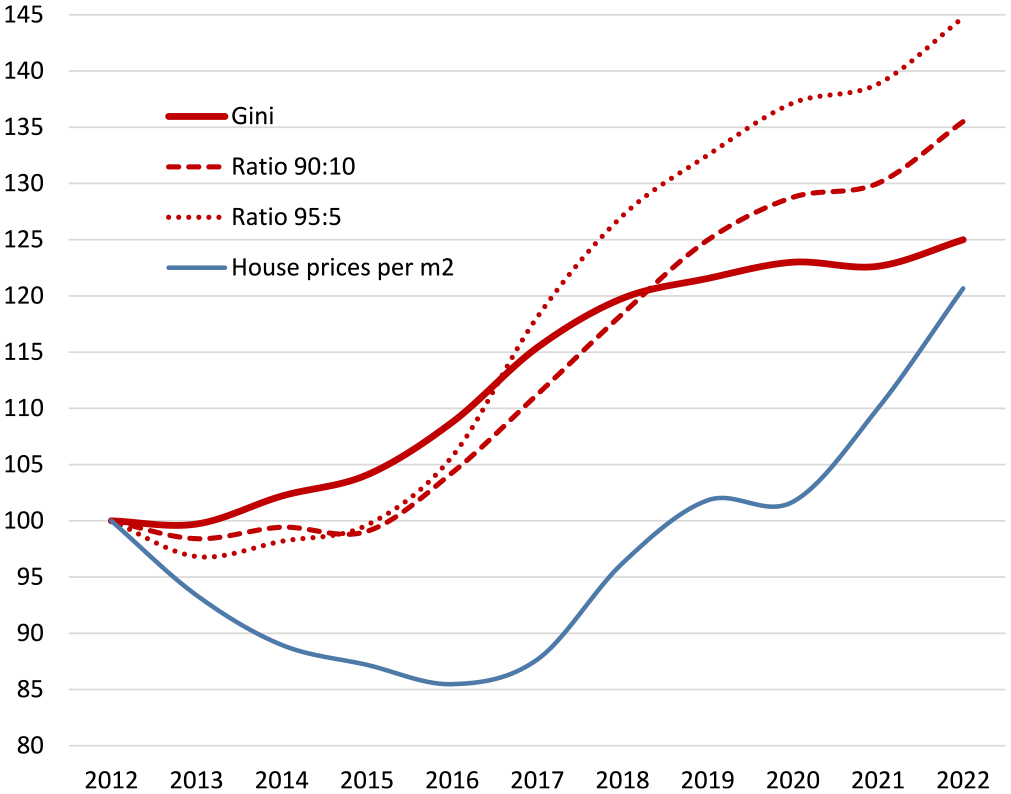
Census tract inequality across Spain and house price development (2012 = 100).
The results of our analyses clearly expose a pattern of spatial polarization. Overall, we see a steady increase in spatial inequality with only a short initial stage of stagnation for the ratios and some slowing or stagnation over the 2020 peak pandemic year. Remarkably, there is no reversal of inequality over the period despite including major shocks of post-GFC declining prices and the Covid-19 pandemic. This is a significant finding and points to a stark resilience in continued spatial inequality despite major housing market upheavals. These findings echo related research from the Netherlands over 2006–2018 which did not find corrections in spatial inequality despite strong boom-bust-boom market developments (Arundel and Hochstenbach, 2020; Hochstenbach and Arundel, 2020). The Spanish results present even starker increases in inequality. The additional analyses using unweighted tracts and pre-interpolation datasets (see Appendix) reveal similar trends and confirm robustness of the findings.
Our results revealing continued spatial inequality over periods of housing market volatility points to a likely stronger resilience of higher-value housing submarkets in ‘weathering’ crises relative to lower value areas. This is supported when further analysing the underlying data where we see that the fifth percentile of worst-performing tracts saw increases of just 2.5%, while the 95th percentile best-performing increased over 86%. These findings align with aggregate research in Spain showing that wealthier households, despite seeing declines in property wealth in the post-GFC downturn, fared better than middle and lower-income households (Amuedo-Dorantes and Borra, 2018).
To understand how housing value gains are distributed across more or less expensive submarkets, we subsequently looked at changes across tracts sorted from the lowest to highest average housing value deciles in 2012 (the start of our analysis period). As expected, highest value deciles do tend to concentrate within urban areas and lower value tracts tend to be more rural although there remains a great deal of internal variety within city and rural areas (see Appendix for a map of their distribution). Figure 4 presents the resulting changes by decile in house values in terms of both rates of change and absolute gains. The results are again striking, revealing a clear pattern of the highest gains among areas of already higher initial value. Absolute changes display large disparities between the highest deciles and lower ones. Even accepting that higher valued areas may have more potential to increase, these disparities are significant as they reveal that a very large share of the property value gained over this period concentrated in the areas already having the highest values.
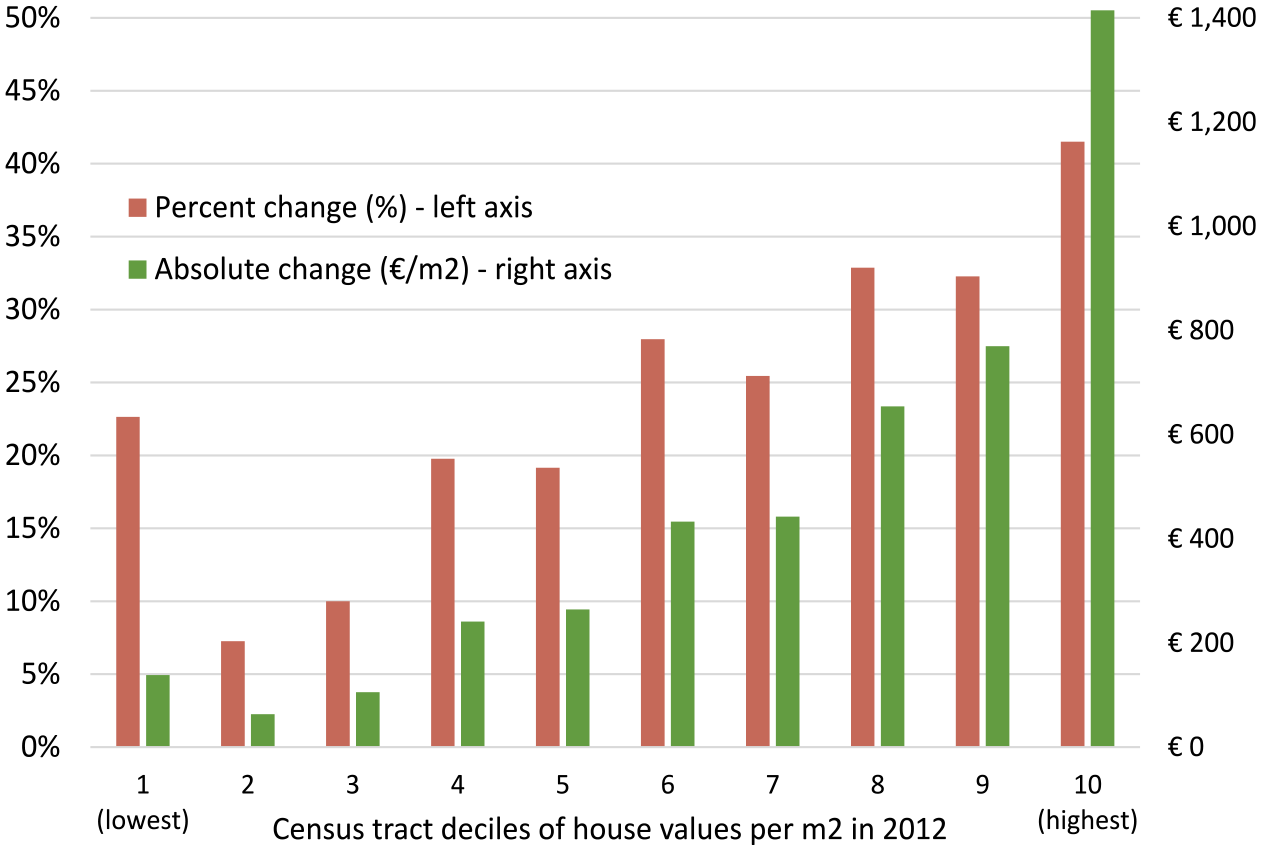
Change in inflation-adjusted house values 2012–2022, by decile of values in 2012.
Turning to the percentage change across deciles (also Figure 4) allows greater insight into the dynamics of unequal accumulation of housing wealth. First, it must be noted that there is more unevenness with the lowest decile presenting an exception of higher value (roughly equal to the total average rate of increase), albeit of course relating to smaller absolute sums being the very lowest-valued census tracts. While beyond the scope of this paper, one explanation is that the lowest-valued areas would include more unusual cases of particularly undervalued areas with more potential to see jumps in value. Nonetheless, we find a clear primary pattern from the second decile onwards. Strikingly, the overall relationship is one of greater percentage increases among the highest value deciles. In other words, not only are absolute gains higher, but the most expensive areas also saw higher rates of growth. This is by no means an intuitive, expected result and has fundamental implications for the housing market’s role in not only reflecting but also amplifying other economic inequalities. The findings reveal that, on average, every euro invested in the most expensive submarkets saw substantially higher rates of return than those invested in lower valued areas. This is most clear in the top decile (areas with the highest initial value) which captured the highest gains at double the full sample average – 42% versus 21%, respectively.
These results have strong implications for the sorting of wealth gains across populations. As access to housing is much more restricted than other commodities given its largely indivisible nature and threshold criteria for mortgage credit (van Hoenselaar et al., 2021), lower-income and less wealthy households are much less likely to be able to invest in higher value submarkets. This is of course evident given strong correlations between socio-economic status and housing values across countries and cities. Given such dynamics of population sorting, the implications of our findings are that, on average, homeowners with less purchasing power experience lower rates of return (in addition to lower absolute gains) in contrast to those with already better economic positions able to buy into more expensive submarkets with higher gains.
Spatial polarization between municipalities
In untangling the potential multi-scalar nature of inequality dynamics, we subsequently examine polarization at the level of municipalities. Figure 5 thus presents the relative change in Gini coefficients, 90:10 and 95:5 percentile ratios (along with the national price trend again for reference). Looking at the results, there are some slight differences in comparison to census tract spatial polarization, such as some decline in the earlier post-GFC period in the 90:10 ratio measure as well as slightly more stagnation over the Covid-19 period. These differences could be explained by the fact that, particularly larger, municipalities that contain some of the highest value submarkets also contain areas with some of the lowest values and hence this tempers variation between municipalities. Nonetheless, the overriding pattern of municipal-level inequality reveals a clear increase over the period. With only the limited exceptions of the 90:10 ratio initially and momentary stagnation, we find a clear pattern of rising spatial polarization in values between municipalities. Although overall rates for municipalities are lower – as expected with larger units – relative increases over the period are even greater. These analyses confirm the multi-scalar nature of increasing housing market spatial inequality across Spain, occurring not only across census tracts but also between more and less successful municipalities. Taking this multi-scalar approach (see Wong, 2019) supports the robustness of these dynamics of rising polarization in property values.
Municipality level inequality across Spain and house price development (2012 = 100).
Conclusion
The research contributes to the lack of empirical evidence on spatial housing market polarization at a national scale. Using fine-grained geographic data derived from listing prices over a 10-year period, our findings reveal a clear pattern of rising spatial inequalities in the rates of housing value appreciations across the Spanish territory from 2012 to 2022. We find both growing inequalities between census tracts as well as divergences between municipalities. Crucially, the trends appear largely resistant to the strong housing market volatilities captured over this period with, albeit a slowing of the trend, no clear reversal in inequalities even during the post-GFC decline and impacts of the Covid-19 pandemic. This points to a structural and significant development in ongoing housing market spatial polarization across Spain and echoes findings in comparable research carried out in The Netherlands (Arundel and Hochstenbach, 2020; Hochstenbach and Arundel, 2020), alongside some more limited assessments across the US and other OECD countries (i.e. Cun and Pesaran, 2018; Gyourko et al., 2013; OECD, 2023a). Sorting census tracts by housing values, we find that not only did areas with higher starting values experience greater absolute gains, but they also saw higher rates of appreciation over the period. In other words, the most expensive submarkets both gained a disproportionately large share of absolute property wealth over this period and were characterized by higher returns on each euro invested within them. These findings crucially point to the housing market not only reflecting socio-economic divides but amplifying inequality through divergent wealth accumulation among homeowners.
Our findings of growing spatial inequality in rates of house value increases have fundamental implications towards driving inequality in housing wealth accumulation across societies. Our research points to increasing differences in the value – and cost – of housing dependent on location, which thus implies a stronger pressure towards segregation of populations dependent on where households can afford to buy. With housing prices strongly correlated with rental costs (Gallin, 2008), this does not only affect those entering homeownership. Increasing segregation along economic lines has a multitude of associated knock-on effects in relation to growing divides in socio-economic opportunities, whether in access to better education, employment or other locational advantages (Acolin and Wachter, 2017; Dorling, 2014; Israel and Frenkel, 2020).
More significantly, these results underscore how not only whether one can buy into the housing market but also where one buys has vital implications towards housing wealth accumulation over the longer term. This is important given the particularity of housing as an asset characterized by a spatially-contingent value, its largely indivisible nature as a commodity, and high barriers to market entry (Adkins et al., 2020; Arundel, 2017). Our results show that higher value areas – representing thus more exclusive market enclaves – have seen higher absolute increases, higher rates of return, and appear more resilient to the volatilities of the housing market. This implies that, on average, those able to buy into these more prime submarkets see greater gains in housing wealth and have been better protected against market downturns. Importantly, dynamics of unequal population sorting and housing wealth distribution are likely mutually self-reinforcing, with capital flows into specific hotspot submarkets exacerbating affordability and access constraints for those without sufficient entry capital, while driving asset growth and rewarding those able to invest in these localities (see Kemp, 2015). Such trends of unequal accumulation of housing assets among a select population thereby facilitates their ability to reinvest in multiple homeownership (often within prime areas) (Boertien and López-Gay, 2023), fuelling a growing private rental sector and promoting further divides, not only among homeowners but between owners and those increasingly shut out of ownership entirely.
While a valuable empirical contribution to the limited evidence on the spatial polarization of housing wealth accumulation, further research would benefit our understanding of these dynamics. A next step would be a direct assessment of how people sort across spatially-unequal housing submarkets, linked with individual wealth accumulation trajectories (see Arundel and Hochstenbach, 2020). While not within the scope of this article, an empirical analysis of the factors that drive spatial housing market polarization represents a further important avenue of future research. Moreover, while this comprehensive analysis of the Spanish territory echoes findings from recent studies in the Netherlands, there remains a dearth of internationally comparative research. As such, additional assessment of spatial polarization across other country contexts would help to uncover the extent to which the phenomenon is widespread, as well as key commonalities and differences. Finally, albeit exploitable data is hard to acquire, analyses over extended time periods would provide a valuable understanding of longer-term dynamics of housing wealth divergence across space. Nevertheless, the findings herein present an essential contribution to assessing the spatial polarization of housing markets and exposing the spatially-contingent nature of housing asset accumulation as a fundamental mechanism of growing wealth inequality.
Footnotes
Appendix
Spatial inequality measures at the census tract level for unweighted and non-interpolated datasets.
| Year | Dataset: unweighted by population, missing values EBK interpolated | Dataset: weighted by population, missing values not interpolated (excluded) | ||||
|---|---|---|---|---|---|---|
| Gini coefficient | p90/10 | p95/p5 | Gini coefficient | p90/10 | p95/p5 | |
| 2012 | 29.35 | 4.206 | 6.468 | 26.148 | 3.465 | 5.073 |
| 2013 | 28.968 | 4.028 | 6.070 | 26.14 | 3.426 | 4.939 |
| 2014 | 29.393 | 4.015 | 5.988 | 26.839 | 3.467 | 5.017 |
| 2015 | 29.697 | 3.932 | 5.900 | 27.361 | 3.454 | 5.093 |
| 2016 | 30.768 | 4.032 | 6.164 | 28.615 | 3.648 | 5.425 |
| 2017 | 32.524 | 4.286 | 6.752 | 30.382 | 3.893 | 6.037 |
| 2018 | 33.86 | 4.59 | 7.373 | 31.539 | 4.142 | 6.516 |
| 2019 | 34.586 | 4.912 | 7.744 | 32.001 | 4.369 | 6.797 |
| 2020 | 35.042 | 5.106 | 8.039 | 32.378 | 4.512 | 7.010 |
| 2021 | 35.041 | 5.201 | 8.159 | 32.284 | 4.549 | 7.093 |
| 2022 | 35.671 | 5.363 | 8.511 | 32.88 | 4.737 | 7.393 |
| Change 2022–2012 | +6.3 (+21.5%) | +1.2 (+27.5%) | +2.0 (+31.6%) | +6.73 (+25.8%) | +1.3 (+36.7%) | +2.3 (+45.7%) |
Declaration of conflicting interests
The author(s) declared no potential conflicts of interest with respect to the research, authorship, and/or publication of this article.
Funding
The author(s) disclosed receipt of the following financial support for the research, authorship, and/or publication of this article: This work was supported with funding from the Dutch Research Council under the grant ‘WEALTHSCAPES: The spatial polarization of housing markets and divided access to housing wealth accumulation’ [grant number: Vl.Veni.201S.031] as well as the Research Project ‘Multi-methodological Approach to Residential Behaviour and Everyday Life (MARBEL)’, code PID2020.119569GA.I00 funded by MCIN/ AEI /10.13039/501100011033.