
Abstract
Urban vulnerability is affected by changing patterns of hazards due to climate change, increasing inequalities, rapid urban growth and inadequate infrastructure. While we have a relatively good understanding of how urban vulnerability changes in space, we know relatively little about the temporal dynamics of urban vulnerability. This paper presents a framework to assess urban vulnerability over time and space to address this gap. We apply the framework to Amsterdam, Rotterdam, and The Hague, the Netherlands. Using high-resolution, anonymised ambulance calls and socio-economic, built environment, and proximity data, we identify three temporal patterns: ’Midday Peaks’, ’Early Birds’, and ’All-Day All-Night’. Each pattern represents a unique rhythm of risk arising from the interaction of people with diverse demographic and socio-economic backgrounds and the temporal flow of their daily activities within various urban environments. Our findings also highlight the polycentric nature of modern Dutch cities, where similar rhythms emerge in areas with varying population densities. Through these case studies, we demonstrate that our framework uncovers the spatio-temporal dynamics of urban vulnerability. These insights suggest that a more nuanced approach is necessary for assessing urban vulnerability and enhancing preparedness efforts.
Introduction
In 2023, Europe, parts of North America, and Asia experienced one of the hottest summers ever recorded. At the same time, flash floods and earthquakes rattled cities worldwide. According to the United Nations Human Settlements Programme (UN-Habitat, 2022), climate change, rapid urban growth, increasing spatial inequalities, and pressures of migration and conflict have exacerbated urban vulnerabilities. While the need to better analyse and reduce vulnerabilities is broadly recognised (Asian Disaster Reduction Center, 2015), rapidly growing and highly dynamic urban areas pose challenges to vulnerability assessment.
Modern cities are complex. This complexity is both spatial, with city centres packed with more places of interest compared to quieter outer residential areas, and temporal, as the ebb and flow of urban life create distinct rhythms. These rhythms are a product of the dynamic interplay between live-work patterns, transportation, and visits to various places of interest, driving health and safety in urban environments (Brelsford et al., 2022; Verma et al., 2021a).
Assessing urban vulnerability, therefore, demands an approach that integrates spatial and temporal heterogeneity. Traditional vulnerability assessments, focussing on spatial inequalities, often miss the temporal layer – even though behavioural rhythms, such as commuting or shopping patterns, significantly influence urban dynamics. This point is further illustrated by studies like Prieto Curiel et al. (2021), which found that crime and road accidents in Mexico City shared similar temporal patterns influenced by the area’s economic activities.
Our investigation aims to understand whether vulnerability in urban spaces adheres to these rhythmic patterns. We hypothesise that by closely examining human behaviour, especially routine activities intrinsically connected to places of interest, we can unveil the complex spatio-temporal variations in urban vulnerability. This approach aligns with recent advancements in urban analytics, which advocate for a more granular examination of vulnerability, considering spatial and temporal dynamics (Champlin et al., 2023; Haraguchi et al., 2022; Quagliarini et al., 2023).
Vulnerability scholars have developed frameworks ranging from generic models (Pachauri et al., 2015) to conceptual approaches that encompass various (urban) systems contributing to and compromising vulnerability (Garfias Royo et al., 2023; Kyprianou et al., 2022). Some have operationalised these frameworks using data (Alabbad et al., 2023; Sun et al., 2020). Given the plethora of vulnerability assessments, there are increasing calls for empirically grounded measurements (Jones et al., 2021). Moving forward, Fekete (2019) and Ho et al. (2019) highlight the need for validation of indicators, indexes and proxies. To address this gap, we use ambulance call data as a proxy to empirically measure urban vulnerability. The rationale is straightforward yet profound: ambulance calls, triggered by a range of urban incidents, offer a real-time snapshot of where and when a city’s fabric shows signs of stress or failure. This approach addresses the spatial and temporal dimensions of vulnerability, providing a multidimensional view of urban dynamics.
By blending vulnerability theory with advances in citizen behaviour and urban analytics, this paper aims to achieve a twofold objective. First, it aims to develop an analytical framework for assessing urban vulnerability across spatial and temporal dimensions. Subsequently, the paper illustrates the application of this framework by investigating the following questions: (1). How does urban vulnerability change across space and time? (2). Are there vulnerability rhythms – identifiable patterns to these changes? (3). What elements of the urban ecosystem primarily shape these vulnerability rhythms?
We utilise open data on ambulance calls from the 112 emergency network for three Dutch cities, Amsterdam, The Hague and Rotterdam, as a proxy for urban vulnerability. This data has a high resolution: the call location as a latitude and longitude pair and the time of the call with a minute precision. We aggregate it over 24 h to generate ‘daily rhythms’ connected to each grid cell and identify rhythms similar in shape. We further dissect it with a one-square-kilometre spatial grid of socio-demographic, built environment and infrastructure attributes and search for attributes of the urban ecosystem that best explain the resulting rhythms.
Background
Urban life follows rhythms
An urban environment is polyrhythmic, consisting of nested fast-changing behavioural rhythms resulting from live-work patterns (Brelsford et al., 2022), transport (Verma et al., 2021a) or visits to different places of interest (POI) (Betancourt et al., 2023). Consequently, the rhythms of human behaviour also drive urban vulnerability. For instance, Prieto Curiel et al. (2021) explored crime and road accidents in Mexico City. The authors found that crime and road accidents have similar patterns, with valleys overnight and peaks during the evening.
However, what is not clear is whether the evolution of vulnerability follows similar rhythms over space and time. We hypothesise that by analysing human behaviour, specifically routine activities connected to places of interest, we can better understand the spatio-temporal variations in urban vulnerability. As a city comes to life, its residents embark on their daily activities, whether work, school, or leisure. These rhythms stem from many factors, including an individual’s age and socio-economic status, their living location, destinations, and the accessibility of various amenities. Our objective is to examine if the patterns of urban vulnerability mirror these behavioural rhythms.
A framework to analyse urban vulnerability
Vulnerability generally refers to the susceptibility of a system to experience damage or adverse effects when exposed to hazards or stressors. Urban vulnerability refers to the potential of a given population, urban space, or infrastructure to be affected by adverse circumstances (Srinivas, 2020). Urban vulnerability assessment is often based on exposure, sensitivity and adaptive capacity (IPCC, 2007). Conventionally, urban vulnerability assessments utilise exposure data (e.g. the presence of a heat island in a particular district) and geographically allocated census data to assess the sensitivity and adaptive capacity (e.g. poor or above 65 y.o.) to a shock or stress (e.g. a heatwave) (Wolf et al., 2015).
Recently, an increasing number of studies have stressed the importance of measuring vulnerability as a spatio-temporal phenomenon, especially in light of COVID-19 (see, e.g. Huang et al., 2021; Li and Huang, 2023). These studies include exposure, sensitivity and adaptive capacity. For instance, Fu and Zhai (2021) examine relations between conventional static social vulnerability and social-distancing behaviours during the COVID-19 pandemic. They found that citizens’ behaviour differs over space and time, and, therefore, the spatio-temporal dimension of social vulnerability becomes critical when designing policies. From the exposure side, Chen and Quan (2021) show how heat exposure varies over the mega-city of Beijing: the core functional area has the highest exposure risk, which decreases outward. Remarkably, the exposure hotspot shifts overnight, demonstrating spatio-temporal variability. Arguably, some of the shifts in vulnerability stem from population movements. However, a recent review on human mobility found that dynamic mobility and movement data are not conventionally part of vulnerability assessments (Haraguchi et al., 2022). In sum, urban vulnerability is a spatio-temporal meta-attribute of a city. Therefore, it is crucial to understand its dynamics over space and time.
Vulnerability assessments have traditionally leaned on socio-economic and district or block-level census data. The emergence of smart cities and advances in urban analytics now allow for a more granular examination of vulnerability in both space and time. Several authors have demonstrated the value of moving towards higher resolutions, both spatially and temporally. For instance, Renner et al. (2018) found that incorporating daily and seasonal fluctuations in people’s mobility reveals vulnerability hotspots. Li and Huang (2023) argue for the analysis on a finer spatial scale of how socio-economic attributes differ within a city. Champlin et al. (2023) point out the differences in behaviour across various social groups and districts. Quagliarini et al. (2023) highlight the hourly and daily variations in how citizens and visitors use different open spaces. Yin et al. (2020) demonstrate that the ambient air temperature has a significant variability over a day and other areas of a city, thus highlighting how exposure to extreme temperatures may differ. While all these studies start to address behavioural patterns or exposure dynamics, what is missing is a vulnerability assessment that is designed to capture the dynamic and multi-rhythmic nature of our cities at a high spatial and temporal resolution.
A proxy for identifying where and when the urban ecosystem gets fractured
Conventionally, vulnerability assessments use a composite indicator. While such an approach was found helpful by some (Wolf et al., 2015), one of its most prominent problems is the lack of ‘ground truth’ to validate it. Given the variability of indicator-based vulnerability assessments (e.g. Birkmann et al., 2022), it is unclear whether postulated and aggregated indicators represent a high or low vulnerability (Copeland et al., 2020). Following the calls for more empirically grounded measurements of vulnerability and resilience (Jones et al., 2021), we use a reverse approach where we first define a proxy to measure urban vulnerability empirically.
The proxy has three requirements: it must have high spatial and temporal resolutions and help reveal when and where an urban system exposes its vulnerability and gets fractured. We propose the number of ambulance calls as a proxy to create insights into urban vulnerability. Our motivation is as follows. When a vulnerable system encounters a situation that exposes its weaknesses, it is more likely to experience a failure or an accident, resulting in an ambulance call. People call an ambulance, but when they do so, they are in a certain location for a particular activity. Therefore, we hypothesise that fluctuations in the number of ambulance calls over space and time will correspond to urban rhythms, particularly daily routines. We expect ambulance calls will allow us to understand the sensitivity, exposure, and adaptive capacity at a high spatial granularity and gain better insights into where and when the urban system is vulnerable.
Several recent studies utilised ambulance call data to study vulnerability. Seong et al. (2023) found that the number of heat-related ambulance calls in the Austin and Travis County areas of Texas is higher in neighbourhoods with more elderly or more people receiving social benefits. Li et al. (2022) demonstrated the connection between historical redlining, exposure to extreme heat and subsequent emergency department visits. The authors found that exposure (land surface temperature) and sensitivity (e.g. old, low-income, etc.) vary over space and may result in more emergency department visits.
Certainly, the number of ambulance calls is not the sole proxy to measure urban vulnerability. Raška et al. (2020) states that any indicator-based vulnerability assessment will capture only a fraction of the ‘true’ vulnerability. That is, this study does not propose ‘the’ proxy but instead proposes an example, which is spatio-temporal and has a high resolution. Later, it can be combined with other proxies, illuminating different aspects of the urban system.
Methodology
Study area and period
We analyse the three largest municipalities of the Netherlands. We understand as continuously evolving entities (Batty, 2013) Given the focus of the paper on urban vulnerability, we follow a pragmatic approach and use the administrative definition and official boundaries of the municipalities of Amsterdam, Rotterdam, and The Hague, with populations of 918,117, 663,900, and 562,839, respectively, in 2023 (CBS, 2023), to demonstrate the application of our approach. These municipalities are often referred to as cities, but they are also part of larger metropolitan areas – Amsterdam Metropolitan Region, Haaglanden, and Rotterdam, The Hague Metropolitan Region, respectively. These metropolitan regions consist of various municipalities. Planning policies in the Netherlands have focussed on establishing compact cities (instead of the urban sprawl typical for many cities in the US) with strong cores and ample opportunity for the different municipalities to develop their own spatial visions and development plans (Claassens et al., 2020). Therefore, in the Netherlands, each municipality functions independently and relies on its own infrastructure, municipal services and unique identity. By focussing on the municipalities (Amsterdam, Rotterdam, The Hague) rather than on the larger agglomerations or metropolitan areas, we can better study the high-paced life and potential vulnerabilities specific to cities. This approach also facilitates comparisons across cities by excluding potential differences in the surrounding satellite municipalities.
Data
In our study, we utilised two open and freely accessible data sets. The first is ‘Kaart van 500 m bij 500 m met statistieken’ provided by Statistics Netherlands (CBS), which offers 2019 data on socio-economic factors, the built environment, and proximity with a spatial resolution of 500 by 500 m. The second is the anonymised ambulance call data from the Dutch P2000 network, managed by 112-nederland.nl. This dataset spans 2017–2020 and includes ambulance call records with spatial details pinpointing 4- and 6-digit postal codes.
Ambulance calls
P2000 is an open network and a part of the Dutch C2000 alarm network maintained by The Dutch Ministry of Justice and Security. Amongst others, this network registers ambulance calls. Importantly, the calls are anonymous and do not have information about who called and the reason for the call. It has, however, a 4 or 6-digit postcode as a latitude and longitude pair with the middle point of the street where it was made.
We aim to analyse a typical weekday – an average across three autumn seasons and five weekdays. Let a i,j (t) be the number of ambulance calls made from coordinate (i, j) at time t. For each year, we constrain t by 1 September and 30 November, and the coordinate (i, j) are constrained by the municipal borders of the case cities.
Autumn is chosen as it is most representative of normal urban activity in Dutch cities, featuring regular work and school schedules without major holidays or events (Verma et al., 2021b). Unlike December, spring, and summer, autumn lacks significant external disruptions, allowing focus on resident-driven dynamics. Additionally, autumn avoids seasonal health impacts like the flu prevalent in January and February (Statistics Netherlands, 2019). We exclude weekends due to intercity travel complicating within-city pattern analysis and lower call volumes (e.g. 87-weekday calls vs 32-weekend calls in The Hague). See the Supplemental Materials for more details.
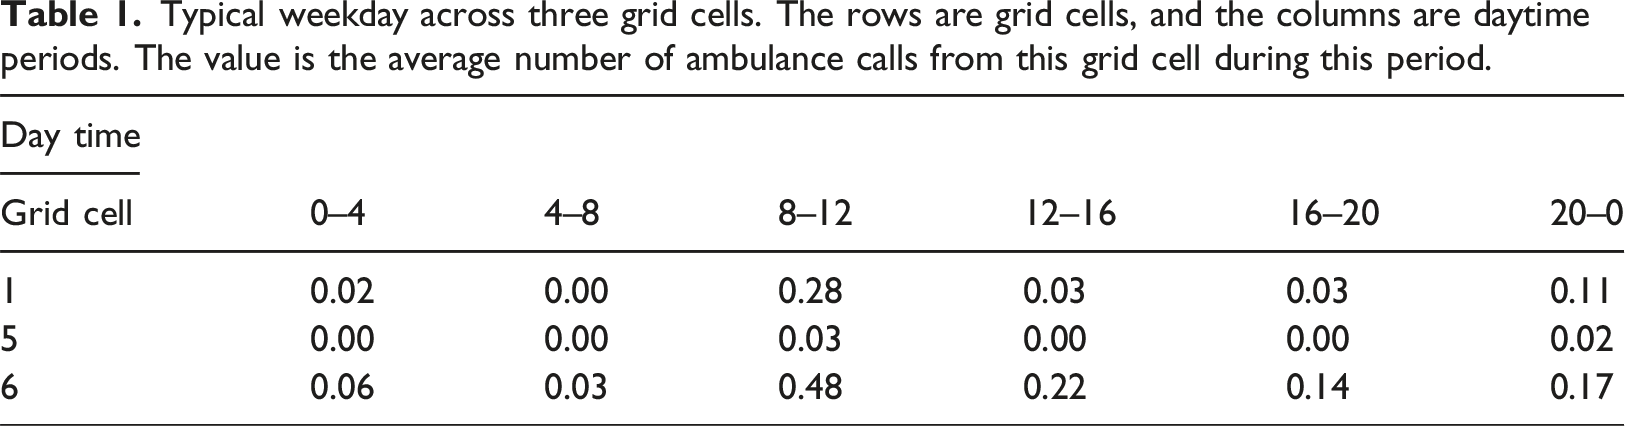
Next, we have three grids consisting of cells of 1 km2 for each case city G. Let g k denote a grid cell k where k ∈ [1,K] and K is the total number of grid cells of the three cities (equal to 775). To connect the calls and the grid cells, we count each a i,j (t) to the corresponding grid cell g k .
For creating a typical weekday, we first aggregate calls into six equal periods T: 00:00–04:00, 04:00–08:00, 08:00–12:00, 12:00–16:00, 16:00–20:00, and 20:00–00:00. It is quite common to smooth the data to analyse temporal patterns (Prieto Curiel, 2023). However, in our case, we work with data of high spatial granularity, which leads to relatively small grid cell sizes and limits the volume of data per grid cell. By aggregating data into four-hour bins, we aim to identify and reason about the urban routines and patterns more effectively. Smaller time bins might introduce noise and obscure meaningful patterns, especially in grid cells with fewer observations.
Next, we average all calls made during the weekdays in each grid cell g k over each period t in T.
Typical weekday across three grid cells. The rows are grid cells, and the columns are daytime periods. The value is the average number of ambulance calls from this grid cell during this period.
Importantly, the number of ambulance calls increases with higher population density (see Section Identifying hotspots: Daily peaks and multiple centres). Our objective, however, is to understand the temporal dynamics of vulnerability. Instead of analysing the number of calls per resident of a grid cell (static), we are interested in rhythms emerging from the changes in population over time. This distinction is critical because footfall and traffic are dynamic phenomena that fluctuate throughout the day. These rhythms may directly affect the number of incidents and, consequently, the number of ambulance calls. To address these dynamic patterns, we used Z-normalisation (with a mean of 0 and a standard deviation of 1). This method allows us to capture the rhythms of incident occurrences while the raw data represents volumes (see Figure S4). Analyzing these rhythms helps us to uncover the polycentric nature of Dutch cities.
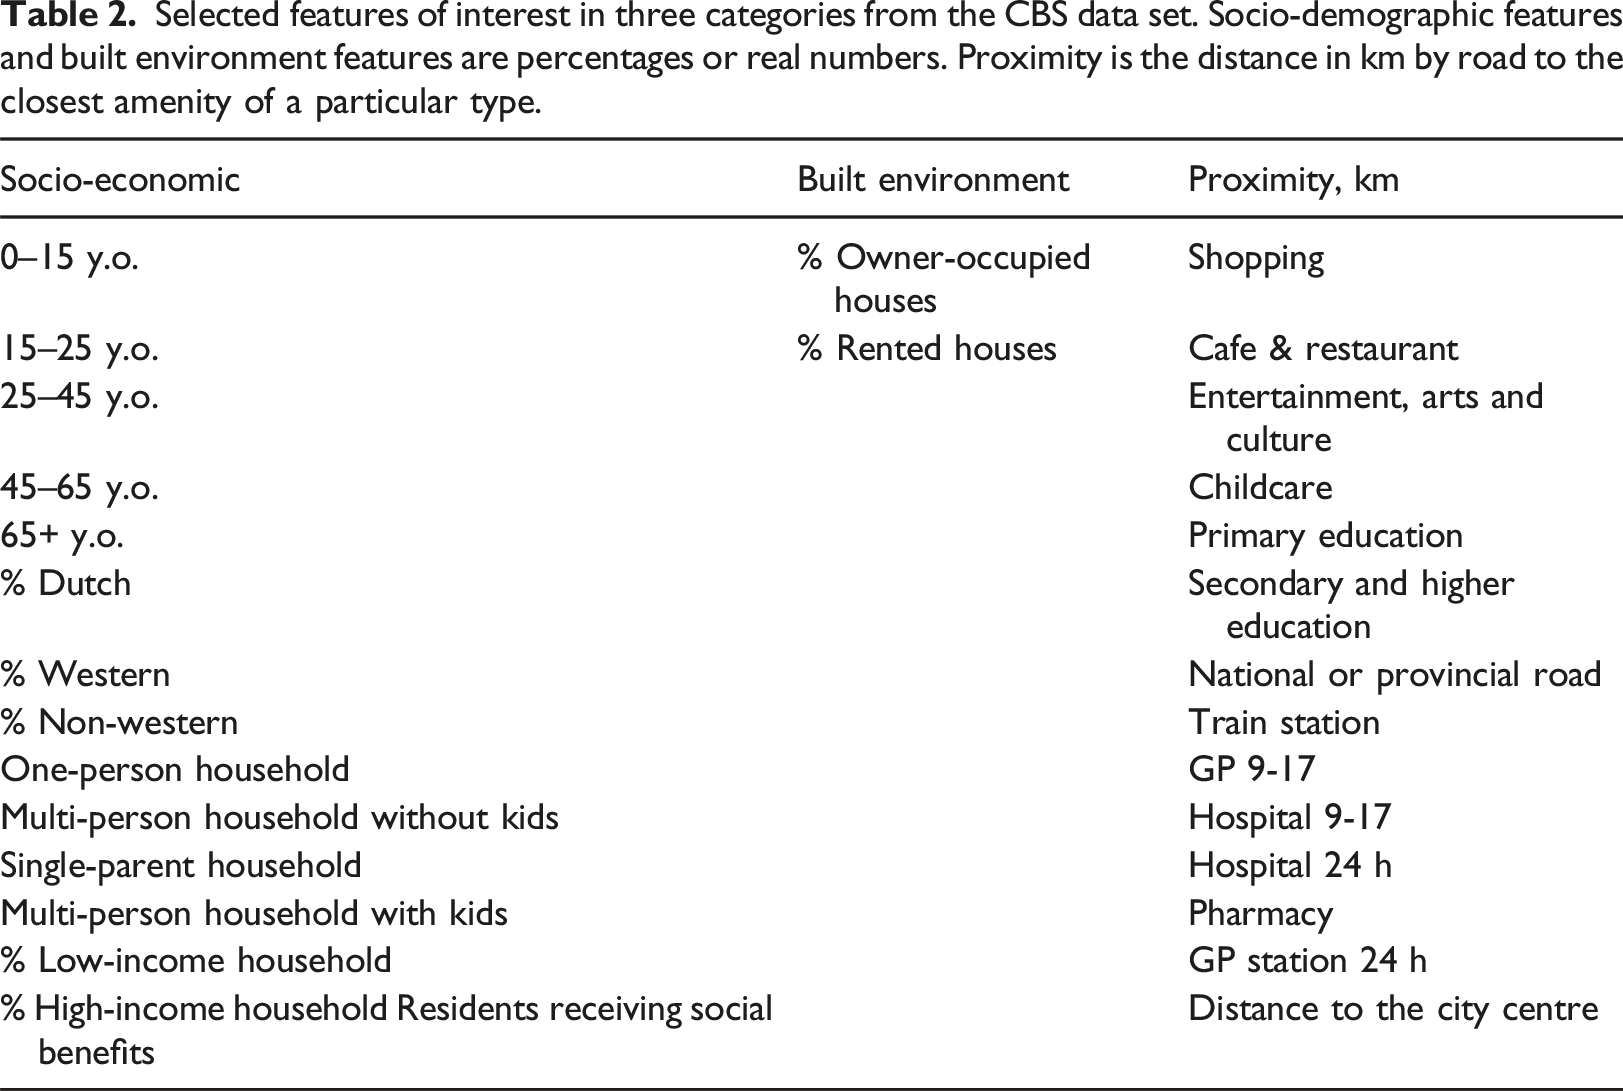
Urban ecosystem
Selected features of interest in three categories from the CBS data set. Socio-demographic features and built environment features are percentages or real numbers. Proximity is the distance in km by road to the closest amenity of a particular type.
Methods
Our goal is to identify the rhythms of vulnerability and identify the factors that explain these rhythms. We do this in two steps. First, we analyse the number of calls temporally and spatially via a hotspot analysis. Second, we cluster the previously constructed typical weekday time series. We finish with the search for attributes that best explain the clusters with an exploratory data analysis.
Hotspot analysis with the Local Indicator of Spatial Autocorrelation (LISA)
The Local Indicator of Spatial Autocorrelation (LISA) is one of the key techniques in urban analytics for revealing local spatial patterns within datasets (Anselin, 1995). Rooted in the Local Moran’s I statistic, LISA identifies spatial clusters and outliers, categorising them into four significant associations: high-high (hotspots), low-low (coldspots), high-low, and low-high. By capturing these nuanced spatial relationships, LISA offers insights into areas of concentrated phenomena – in our case, the number of ambulance calls. We use an open-source Python package, PySAL (Rey and Anselin, 2007), to create LISA cluster maps for each of the 3 case cities.
Time series clustering
Clustering techniques are essential for finding hidden structures and patterns when analysing time series data. Various methods include Dynamic Time Warping (DTW), K-means clustering, spectral clustering, etc. Steinmann et al. (2020) analysed the performance of various algorithms and found that agglomerative clustering scores relatively high when dealing with time series of complex shapes. We use its implementation from the Python package EMA Workbench (Kwakkel, 2017). We aim to cluster typical weekdays constructed from the number of ambulance calls recorded in a specific grid cell.
Results
Identifying hotspots: Daily peaks and multiple centres
Temporally, an apparent trend emerges across all cities (Figure 1): ambulance calls are sparse during the night, reaching the minimum between 04:00 and 05:00 in the morning. Subsequently, there is an increase, peaking at 12:00 for The Hague and 13:00 for Rotterdam and Amsterdam. This peak then tapers off gradually as the day progresses towards midnight. This pattern mirrors typical human activity rhythms, with nocturnal lulls and daytime peaks reflecting our daily routines and habits. Number of ambulance calls recorded during a typical weekday from 00:00 until 23:59 in three Dutch cities: The Hague, Rotterdam and Amsterdam.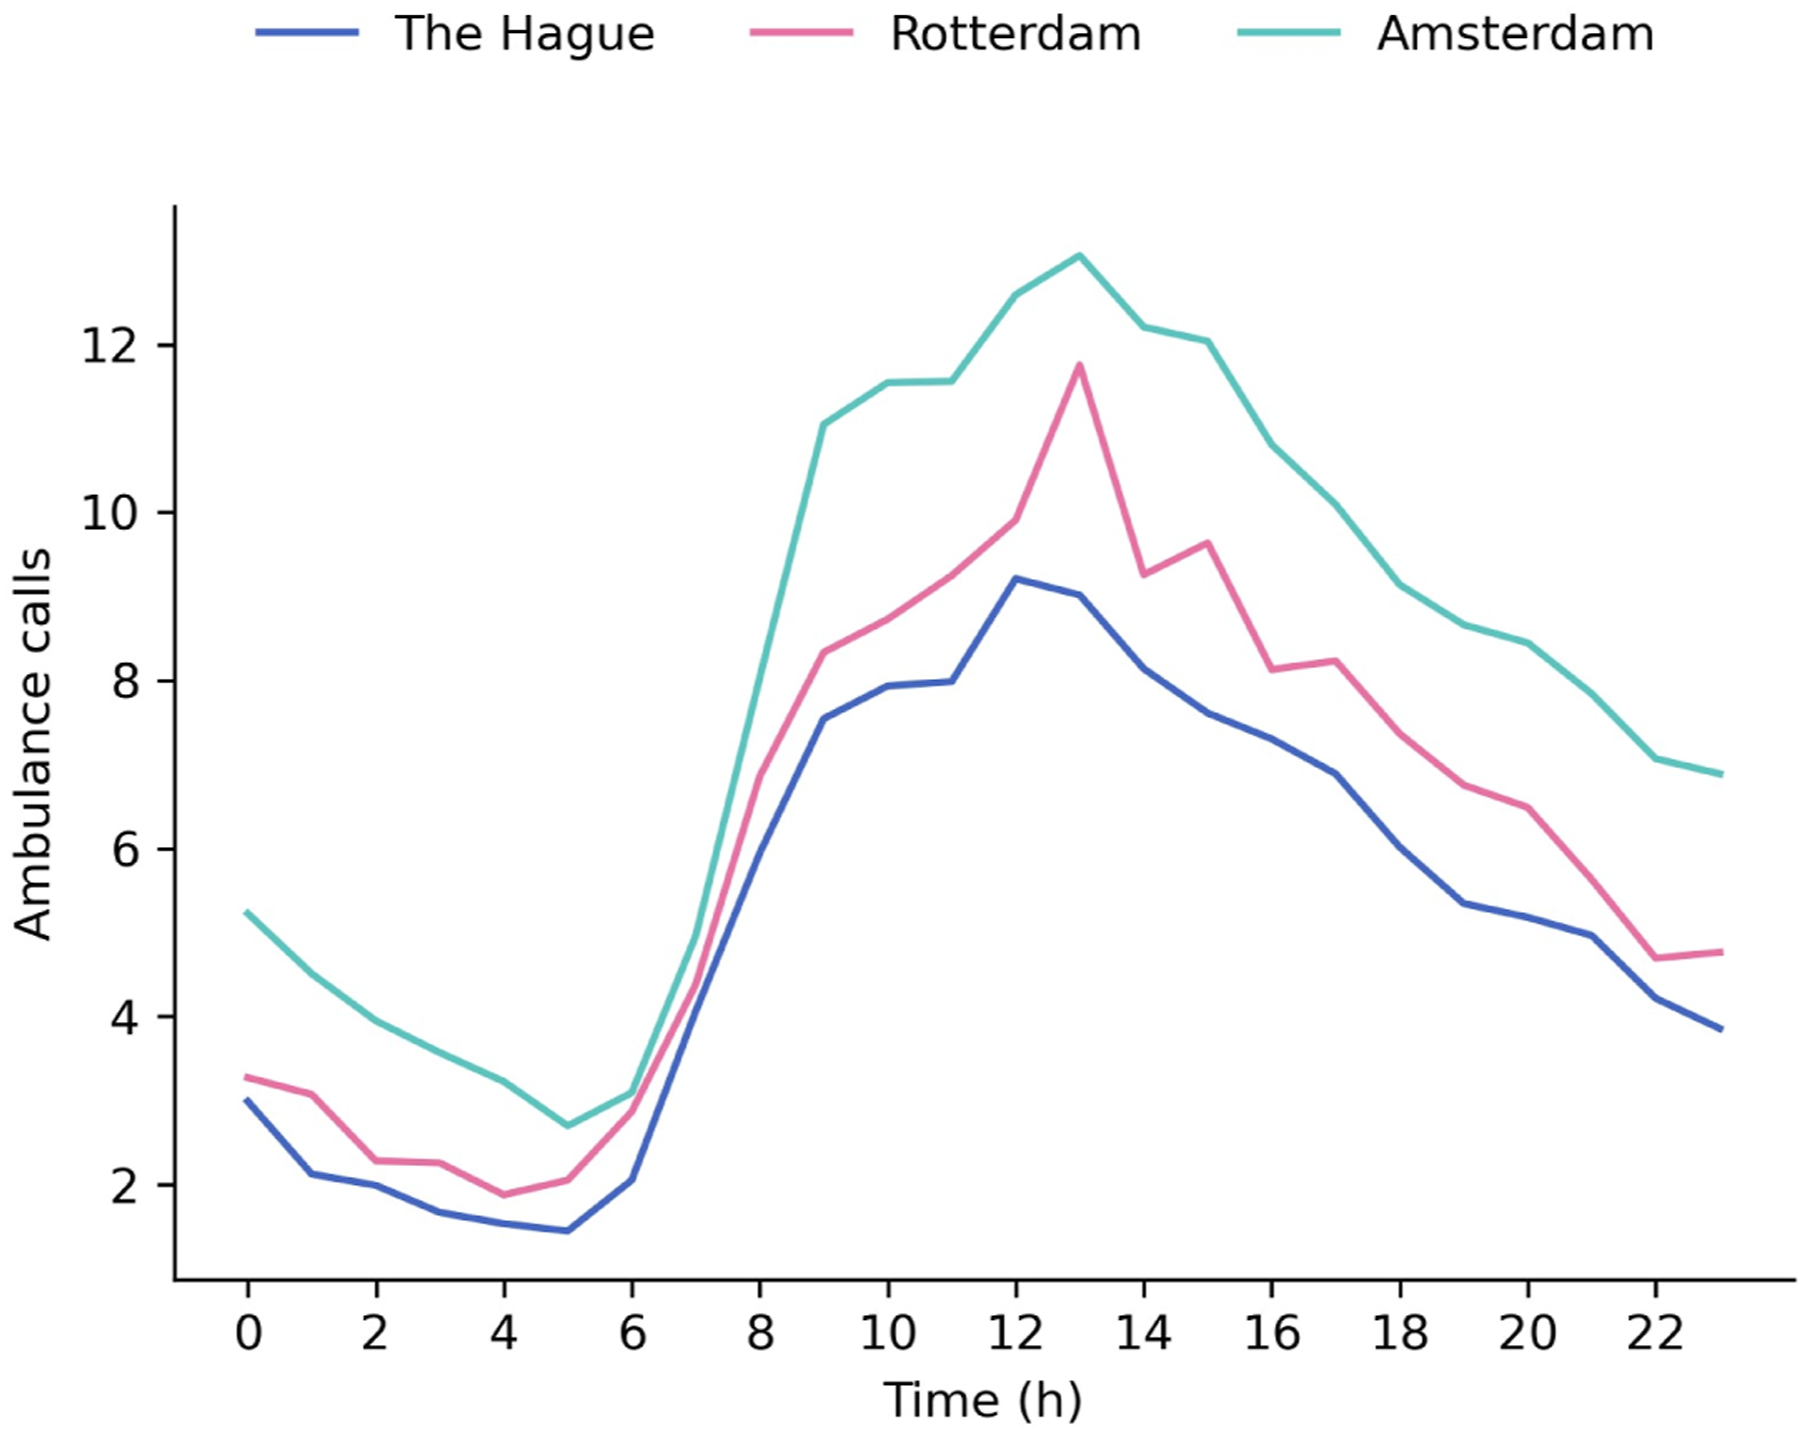
Spatially, the city centres of the three cities register the highest number of calls (left panel of Figure 2). In The Hague, the pattern is straightforward: the central four grid cells record most calls, with numbers tapering off to form concentric rings as one moves outward. Rotterdam, bisected by a river, has two central hubs where calls peak. Adjacent areas to these hubs show slightly fewer calls, with the numbers decreasing further as one moves away. Amsterdam’s city centre, characterised by its network of canals, divides into distinct ‘rings’. Comparative visualisation of emergency healthcare needs in three Dutch cities – The Hague, Rotterdam, and Amsterdam – during a typical weekday. The left panels feature choropleth maps representing the total number of ambulance calls, while the right panels display Local Indicators of Spatial Association cluster maps. Data covers a 24-h cycle. Read legend labels as HH high-high, HL – high-low, LH – low-high, LL – low-low, ns – not significant.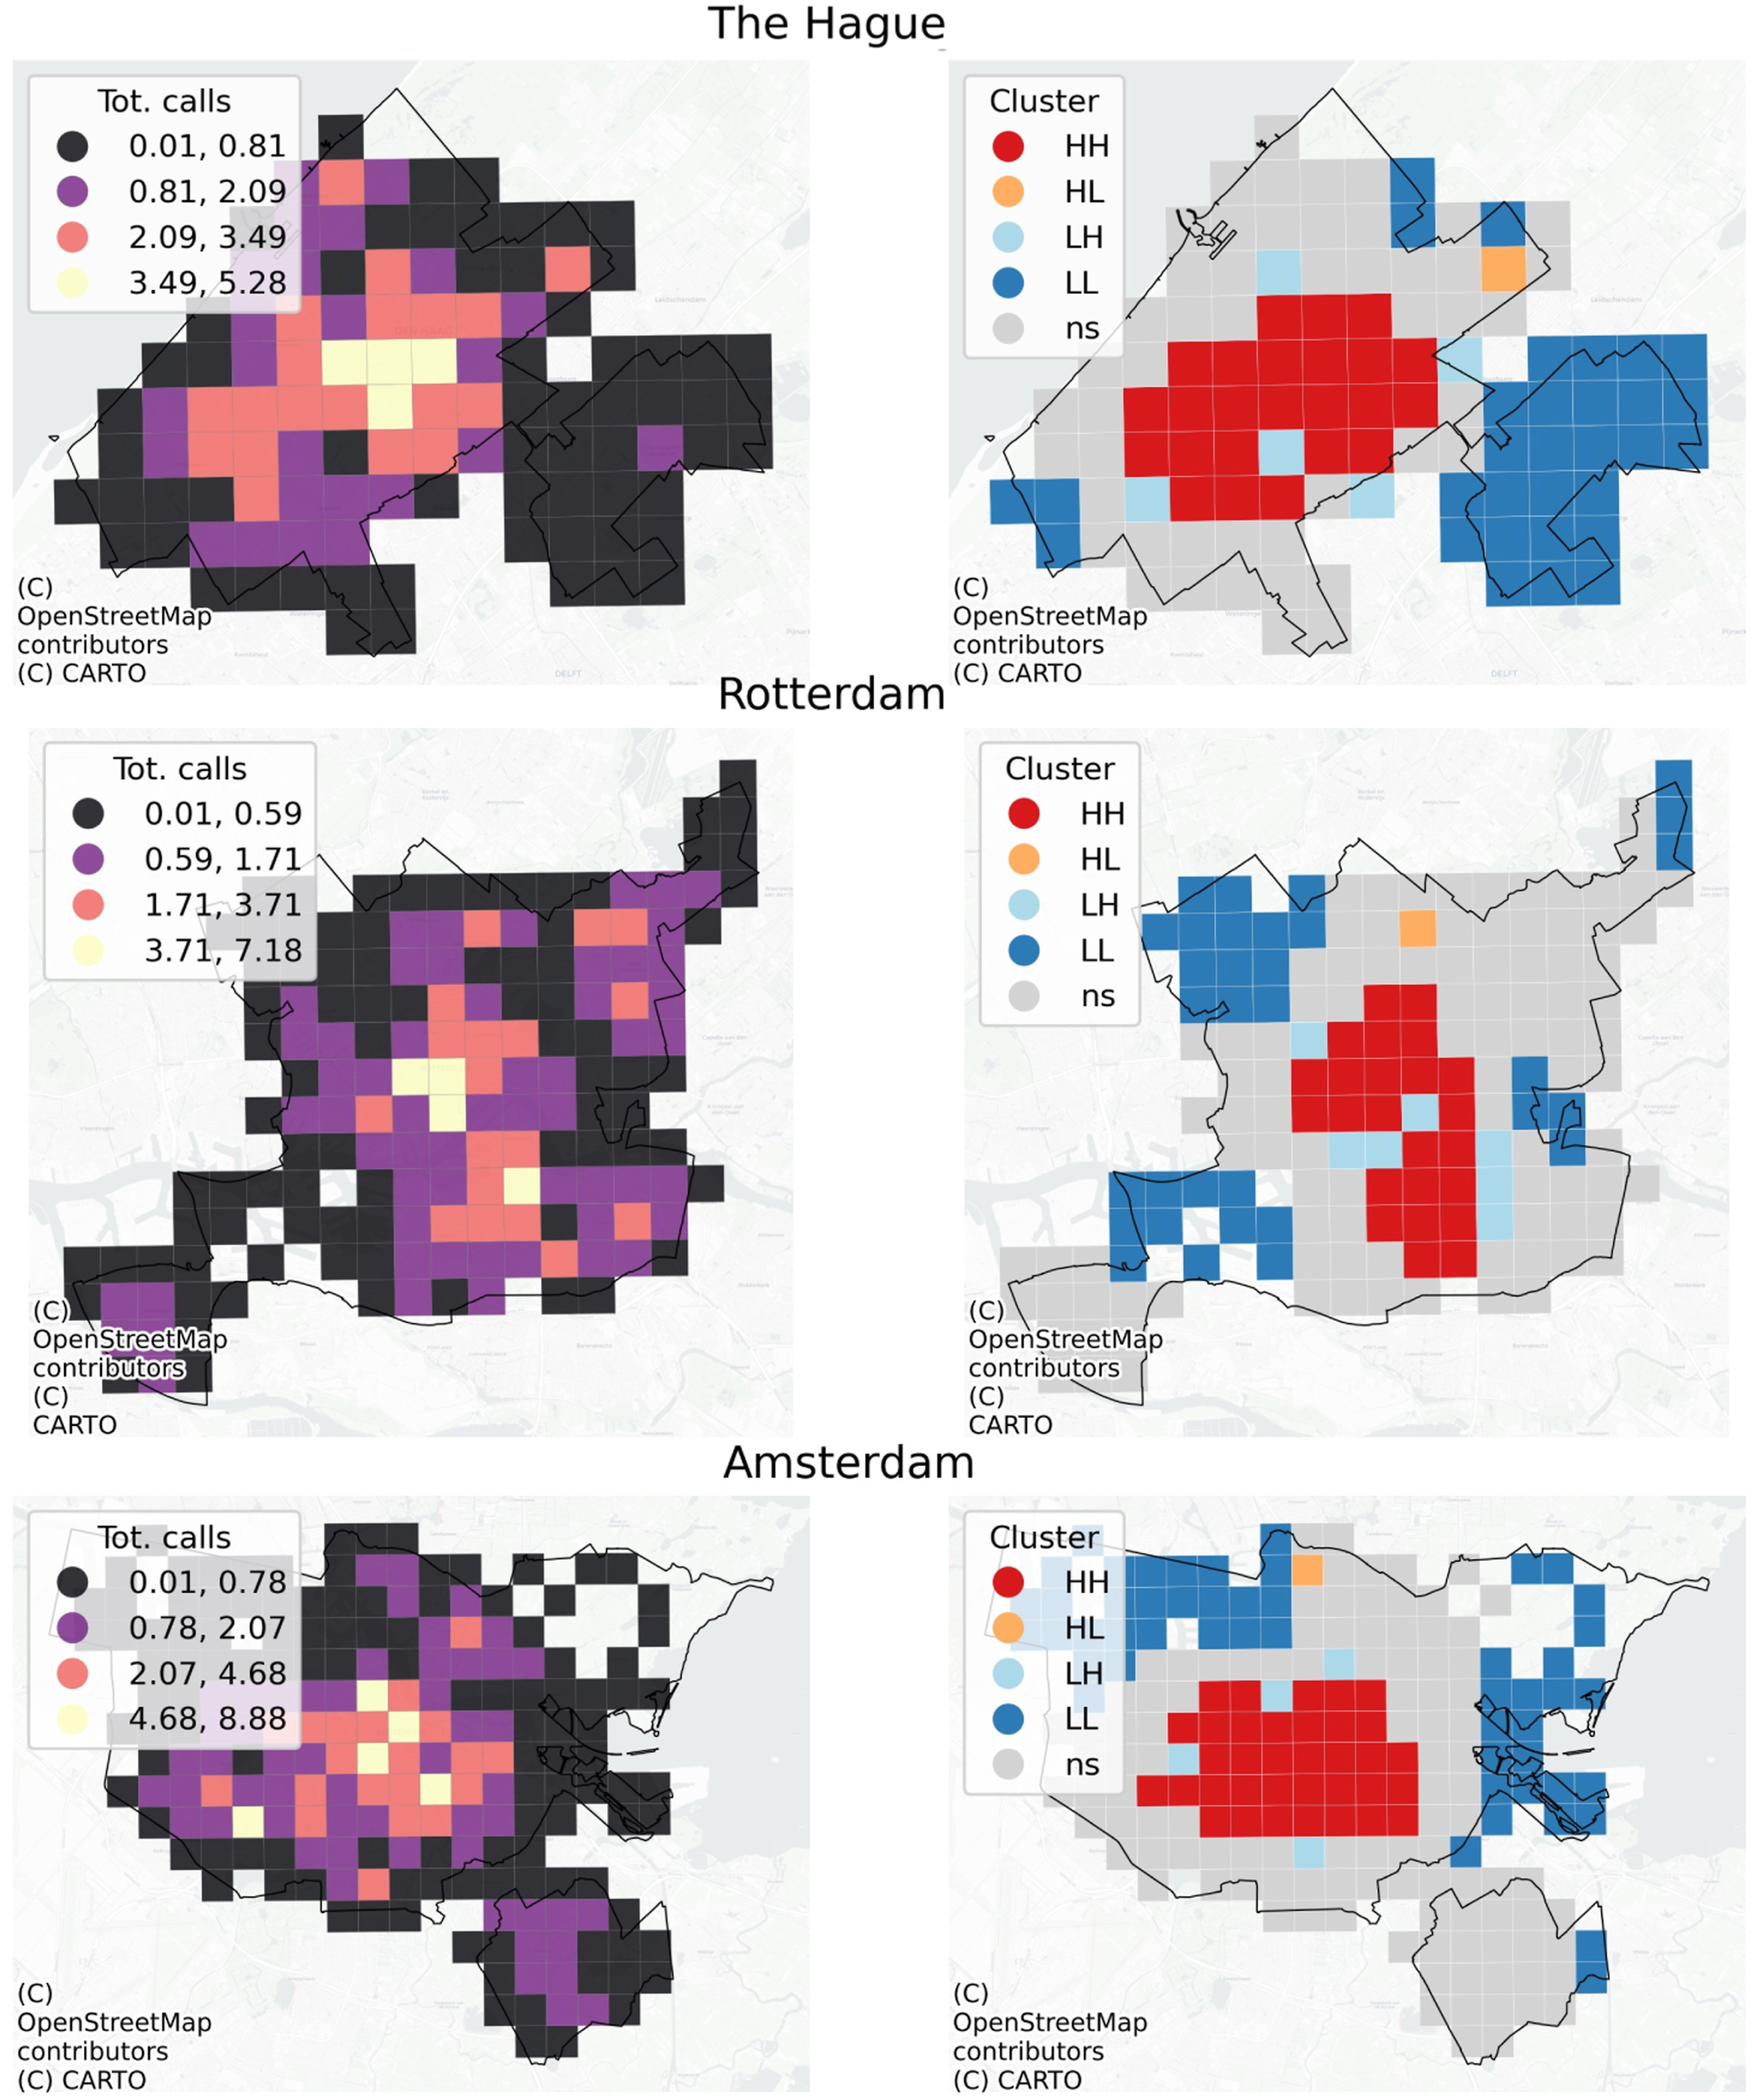
The Local Indicator of Spatial Association (LISA) cluster map supports our hypothesis, pinpointing city centres as hotspots. However, not all peripheral residential areas are characterised as cold spots. Each of the three cities also presents spatial outliers, with grid cells labelled low-high and high-low.
Six distinct daily patterns
Our primary interest now lies in analysing the call patterns. We hypothesise that even though the number of calls might vary, the shape representing the pattern could remain consistent across the grid cells in all cities.
We identified six distinct patterns that can be classified into three main groups (Figure 3). The first group, ‘Midday Peaks’, comprises the two most dominant clusters (0 and 1) and accounts for 48% of the total number of clustered grid cells. These clusters have a major peak during the 12:00–16:00 window. Cluster 1 displays a minor peak from 8:00 to 12:00, while Cluster 0 has its secondary peaks from 04:00 to 08:00 and from 16:00 to 20:00.
The second group, ‘Early Birds’, which encompasses 30% of the data, consists of Clusters 2 and 3. Both clusters primarily peak from 8:00 to 12:00, then see a decline in calls. Cluster 2 experiences a more gradual decrease, while Cluster 3’s decline is more pronounced. A few grid cells in Cluster 2 show fluctuations between 12:00 and 16:00 and again from 16:00 to 20:00. Similarly, grid cells in Cluster 3 also display variations, particularly in the 20:00–00:00 period.
The third group, ‘All-Day All-Night’, represents 22% of the grid cells, Clusters 4 (‘All-Day Active’) and 5 (‘Daytime-Nighttime’), both of which maintain a relatively high volume of calls throughout the day. Cluster 4 peaks between 8:00 and 12:00 and then maintains a consistent call volume until midnight. In contrast, Cluster 5, although more volatile, shows a variance between its 8:00–12:00 values and the subsequent periods. Nonetheless, its average suggests a relatively stable overall call volume. Remarkably, it spikes more during nighttime: 20:00–24:00 and 00:00–04:00.
Temporal patterns of ambulance calls for the top six cluster labels (0–5) across three Dutch cities – The Hague, Rotterdam, and Amsterdam. Each plot represents one of the cluster labels, where ‘n’ in the title indicates the number of grid cells associated with that label. The x-axis denotes the time of day, while the y-axis displays the number of ambulance calls, standardised using Z-normalisation. The plots include the scaled data, mean values, and the 10th and 90th percentiles to capture the range of variability.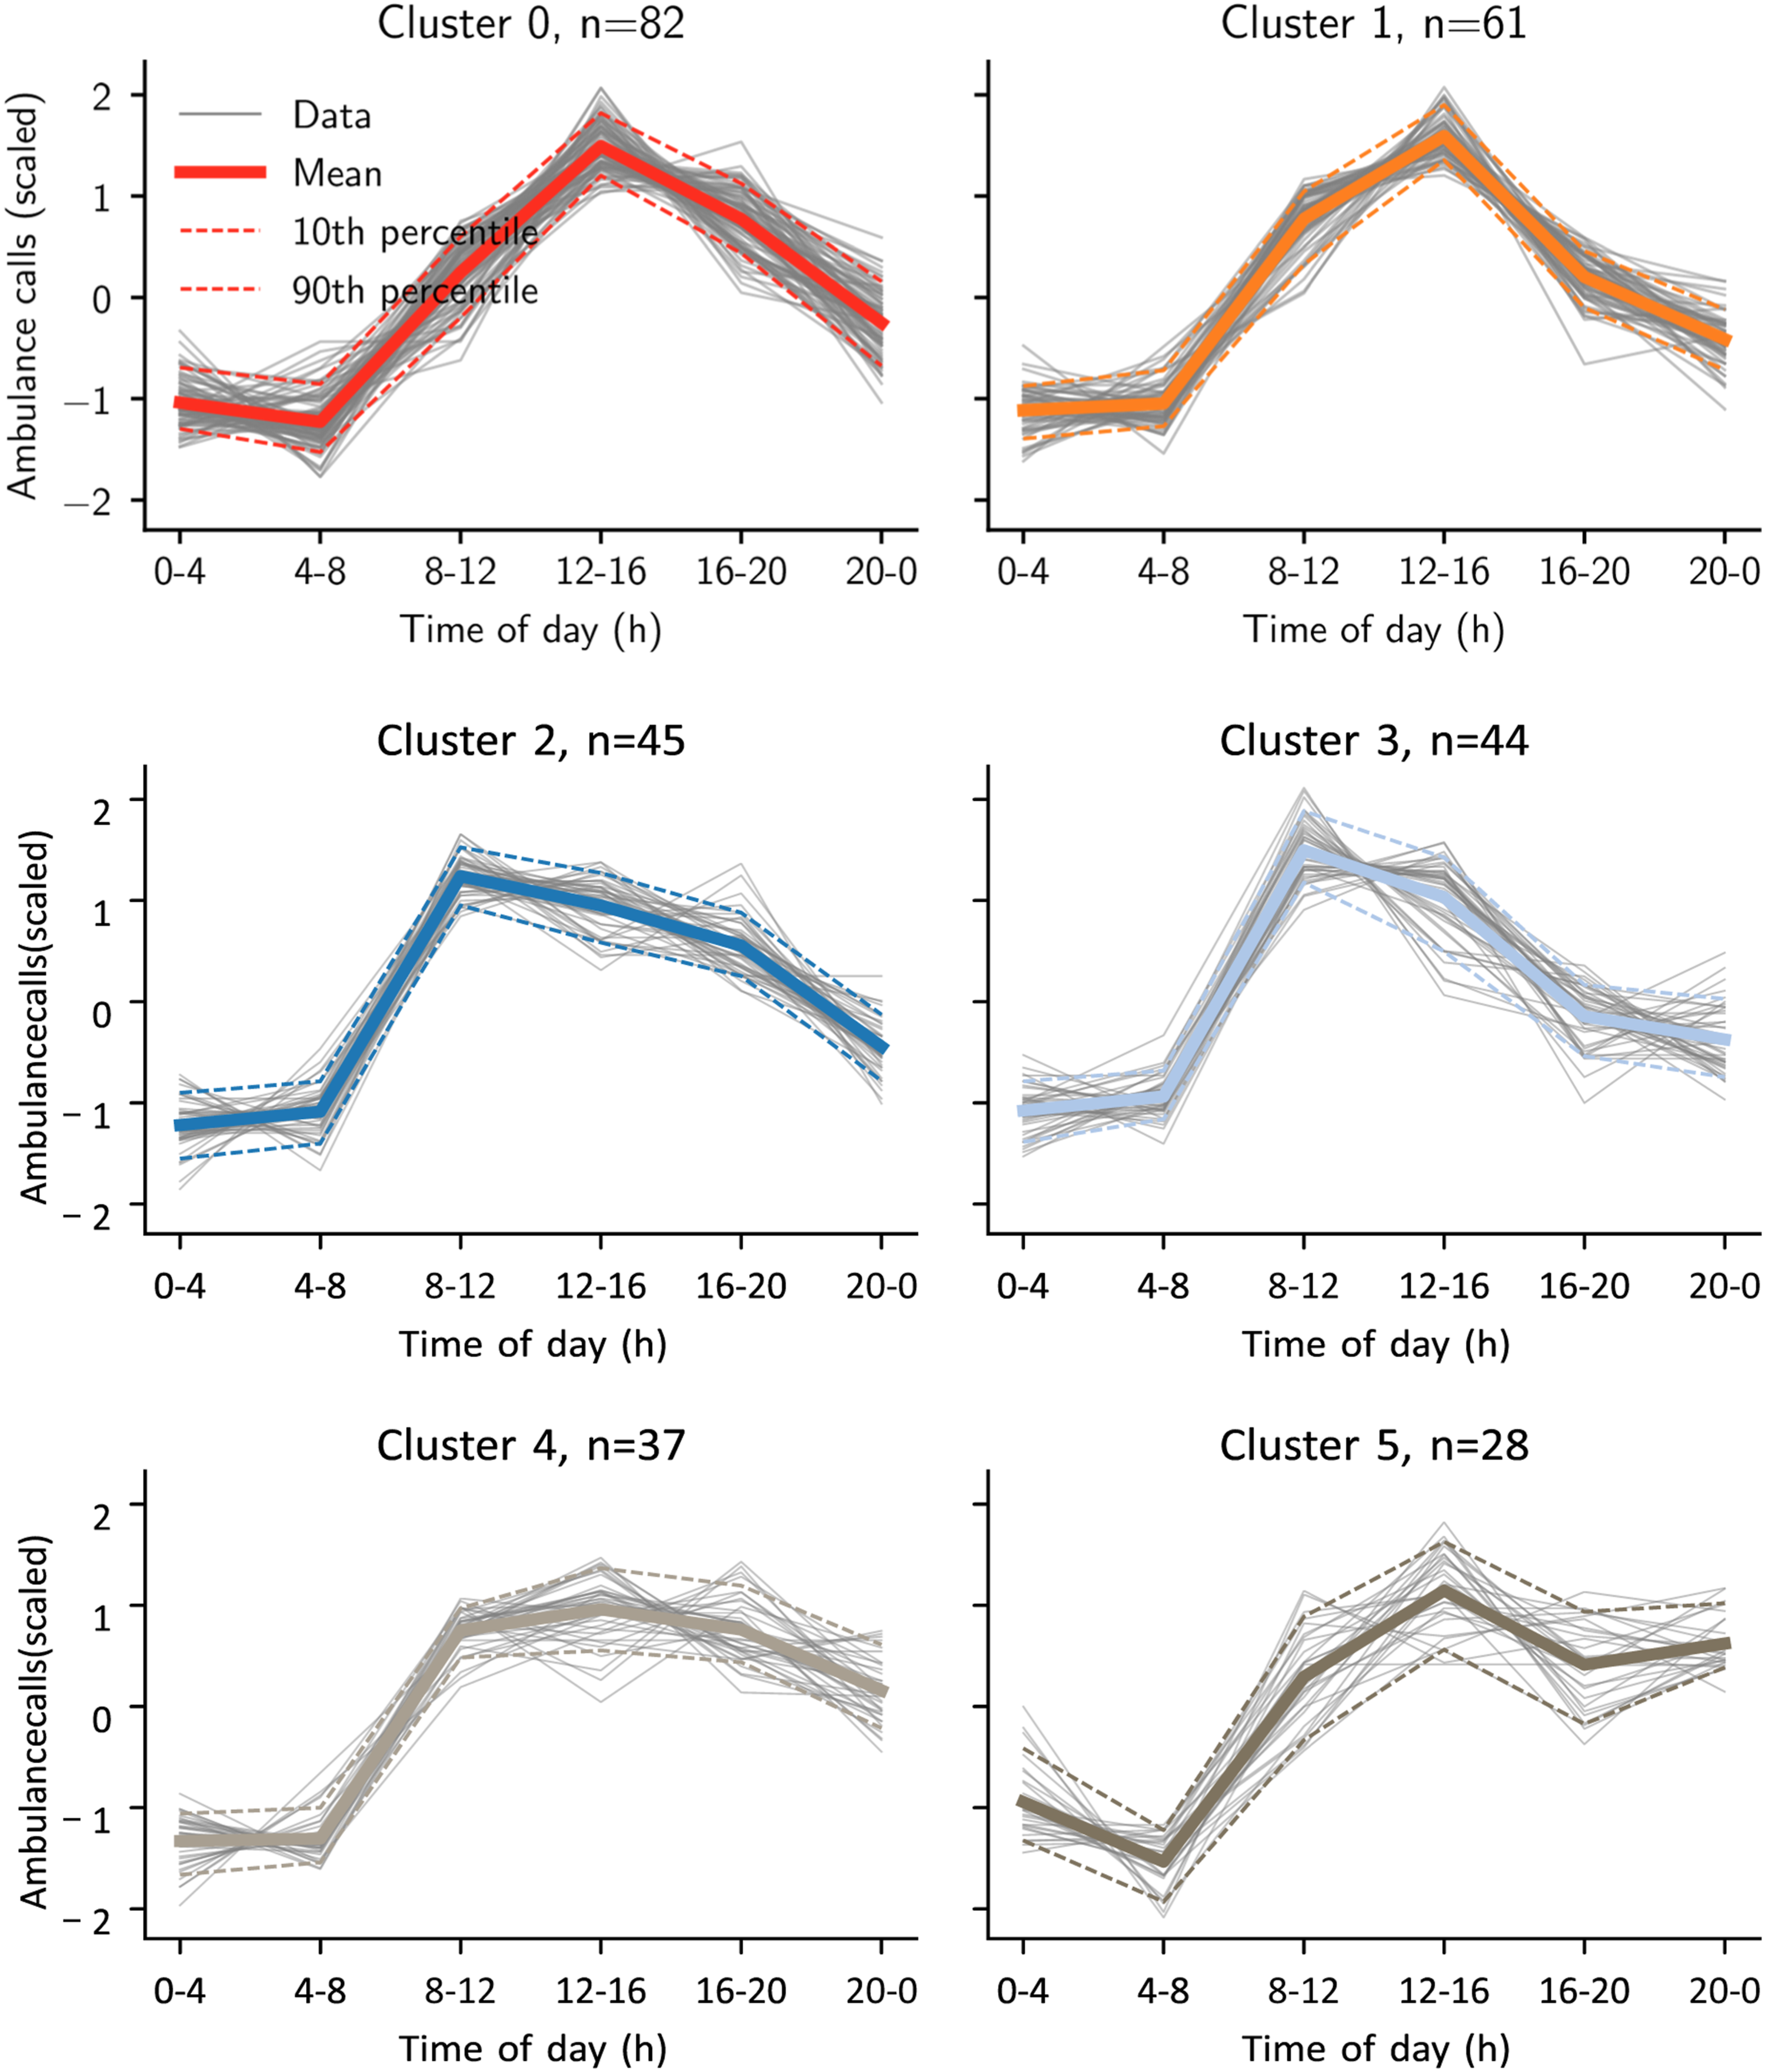
An analysis of the clusters’ geographical distribution offers insight into a potential explanation of vulnerability patterns (Figure 4). Cluster 0, the most dominant cluster, predominantly appears in the city centres or ‘Central Business District’. These areas experience increased foot traffic during working hours (12:00–16:00), primarily due to a higher concentration of shops and leisure amenities, leading to a greater number of calls during this period. Remarkably, individual grid cells labelled as Cluster 0 can also be found outside the centres, for instance, southwest of The Hague and Rotterdam. This finding suggests similar activities are happening in these smaller secondary centres, which often operate autonomously. Cluster 1 (‘Inner-City Periphery’) often surrounds Cluster 0 but tends to be located farther away from the city centre.
Clusters 2 and 3 are predominantly in the ‘Outer Residential’ areas. These clusters peak from 04:00 to 08:00. One possible explanation for such a distribution is that calls from these clusters might be related to incidents coinciding with the start of daily human activities, such as commuting to work. These clusters sometimes overlap with Clusters 0 and 1 in outlying residential districts or smaller secondary city centres.
Clusters 4 and 5, forming the last group of ‘Urban Core’, frequently overlap with Clusters 0 or 1 and are primarily found in the city centre. These clusters have a relatively stable number of calls throughout the day, suggesting these areas are the busiest parts of the cities with consistent footfall, activities, and corresponding incidents. The late-night activity spikes observed in Cluster 5 may suggest the presence of leisure amenities in the area.
The spatial distribution of clusters reveals a multifaceted pattern. While mirroring traditional urban zoning with a generally concentric layout, it also highlights the complexity and polycentric nature of modern Dutch cities. In The Hague, the concentric layout is slightly more pronounced, with a distinct yet gradual transition from the city centre, characterised by Clusters 0, 1, 4, and 5, to the outer residential areas represented by Clusters 2 and 3. In contrast, in Rotterdam and Amsterdam, the pattern is more varied, with different cluster types interspersed throughout the city. Additionally, we observe a complete mix of all cluster types in the more remote parts of these cities. This indicates a polycentric trend, where distinct districts operate independently, suggesting that modern Dutch cities can be described as a conglomerate of smaller cities within a city. Spatial distribution of temporal clusters of ambulance call patterns in The Hague, Rotterdam, and Amsterdam (panels a, b, and c, respectively).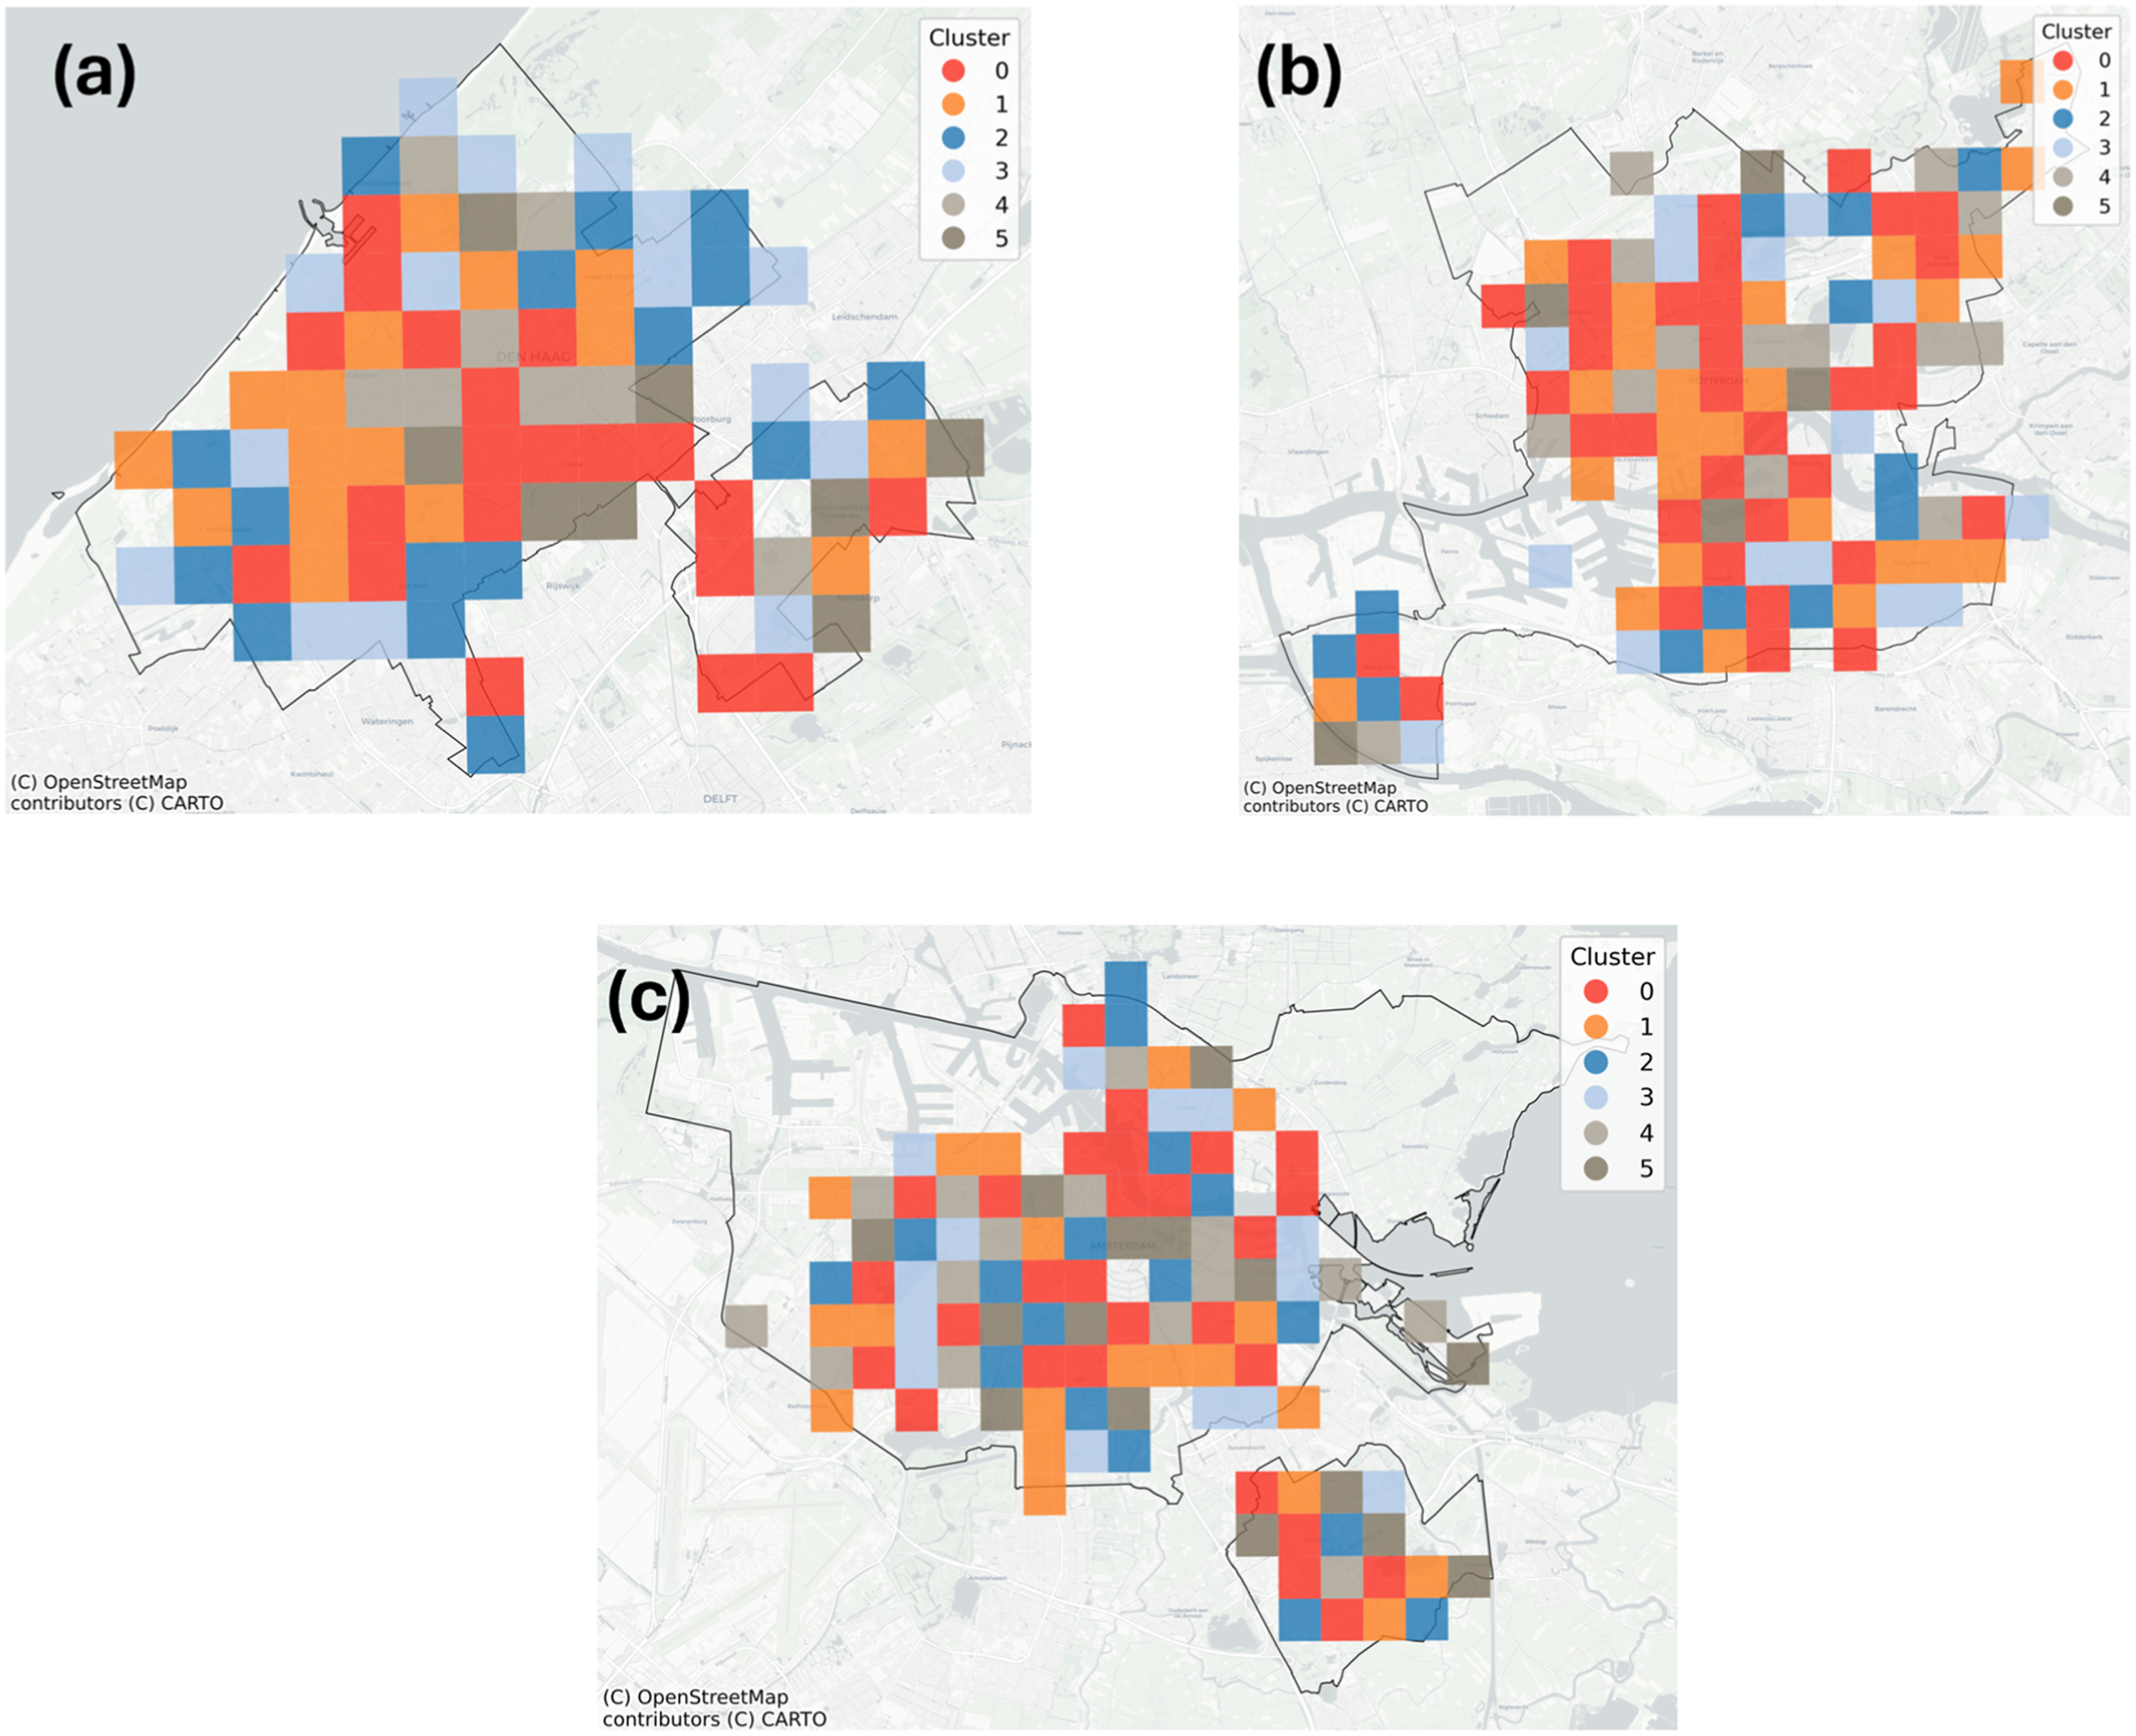
Explaining the patterns
We can partly attribute temporal vulnerability patterns to conventional zoning. The remaining complexity, however, requires us to zoom in and search for features that could explain them better.
The first hypothesis to test is whether the population of a grid cell can explain the number of ambulance calls made during a typical weekday. There is a strong correlation between population and calls, as indicated by Spearman’s rank correlation coefficient of 0.89 and Kendall’s tau of 0.70. Thus, population serves as a reasonably good predictor. However, it is notable that there are outlier grid cells in each city where the number of calls is not adequately explained solely by the population. While the average number of calls made during a typical weekday per 10,000 residents equals 2.16, the data has a significant variance of 160. The total number of grid cells falling below Q1 of 10% or above Q3 of 90% is approximately 20% (89 out of 465). For example, two grid cells in the city centre of The Hague report 5 and 6 calls. The same applies to another part of The Hague, near the national highway. The number of calls there exceeds the mean and equals 5, 6 and even 30 calls. Moreover, such a deviation from the mean expands when we zoom into the number of calls made during a specific time interval. It is, therefore, promising to explore the relations between other elements of the urban fabric and the identified six patterns of urban vulnerability.
Each cluster represents a complex urban fabric, encompassing socio-demographics and economics, the built environment, and business landscapes. Notably, while each grid cell within these clusters displays a mixture of attributes, no single attribute is exclusively unique to any one cell.
Figure 5 illustrates the median values for two sets of features. The process of preparing this figure involves several steps. We first normalise the values by the number of residents in each grid cell. Note that normalisation is only applied to socio-demographic features (panel a), not to proximity features (panel b). Next, we scale these normalised values between 0 and 1 across all grid cells. This scaling highlights the relative differences, making the highest and lowest values stand out. Consequently, the values are relative, representing the highest and lowest values within the city. Finally, we group the grid cells by their cluster labels and calculate the median. We use the median instead of the mean to account for the skewness in the data. In panel a, ‘1′ indicates the grid cells with the highest share of specific socio-demographics, while in panel b, ‘0′ represents the grid cell closest to the amenity and ‘1′ the farthest. This method highlights the relative distribution compared to other grid cells within the cities. Our analysis reveals that, despite some outliers with very high or low values, the median differences across clusters for most indicators are limited, indicating the polycentric and compact nature of Dutch cities (Claassens et al., 2020). Median values for socio-demographic (panel a) and distance to amenities attributes (panel b) of grid cells across the three case cities. The socio-demographic attributes are normalised by the number of residents in each cell. Next, both feature sets have been further standardised between 0 and 1 to ensure comparability. Finally, the median is calculated over the grouped by cluster label grid cell values.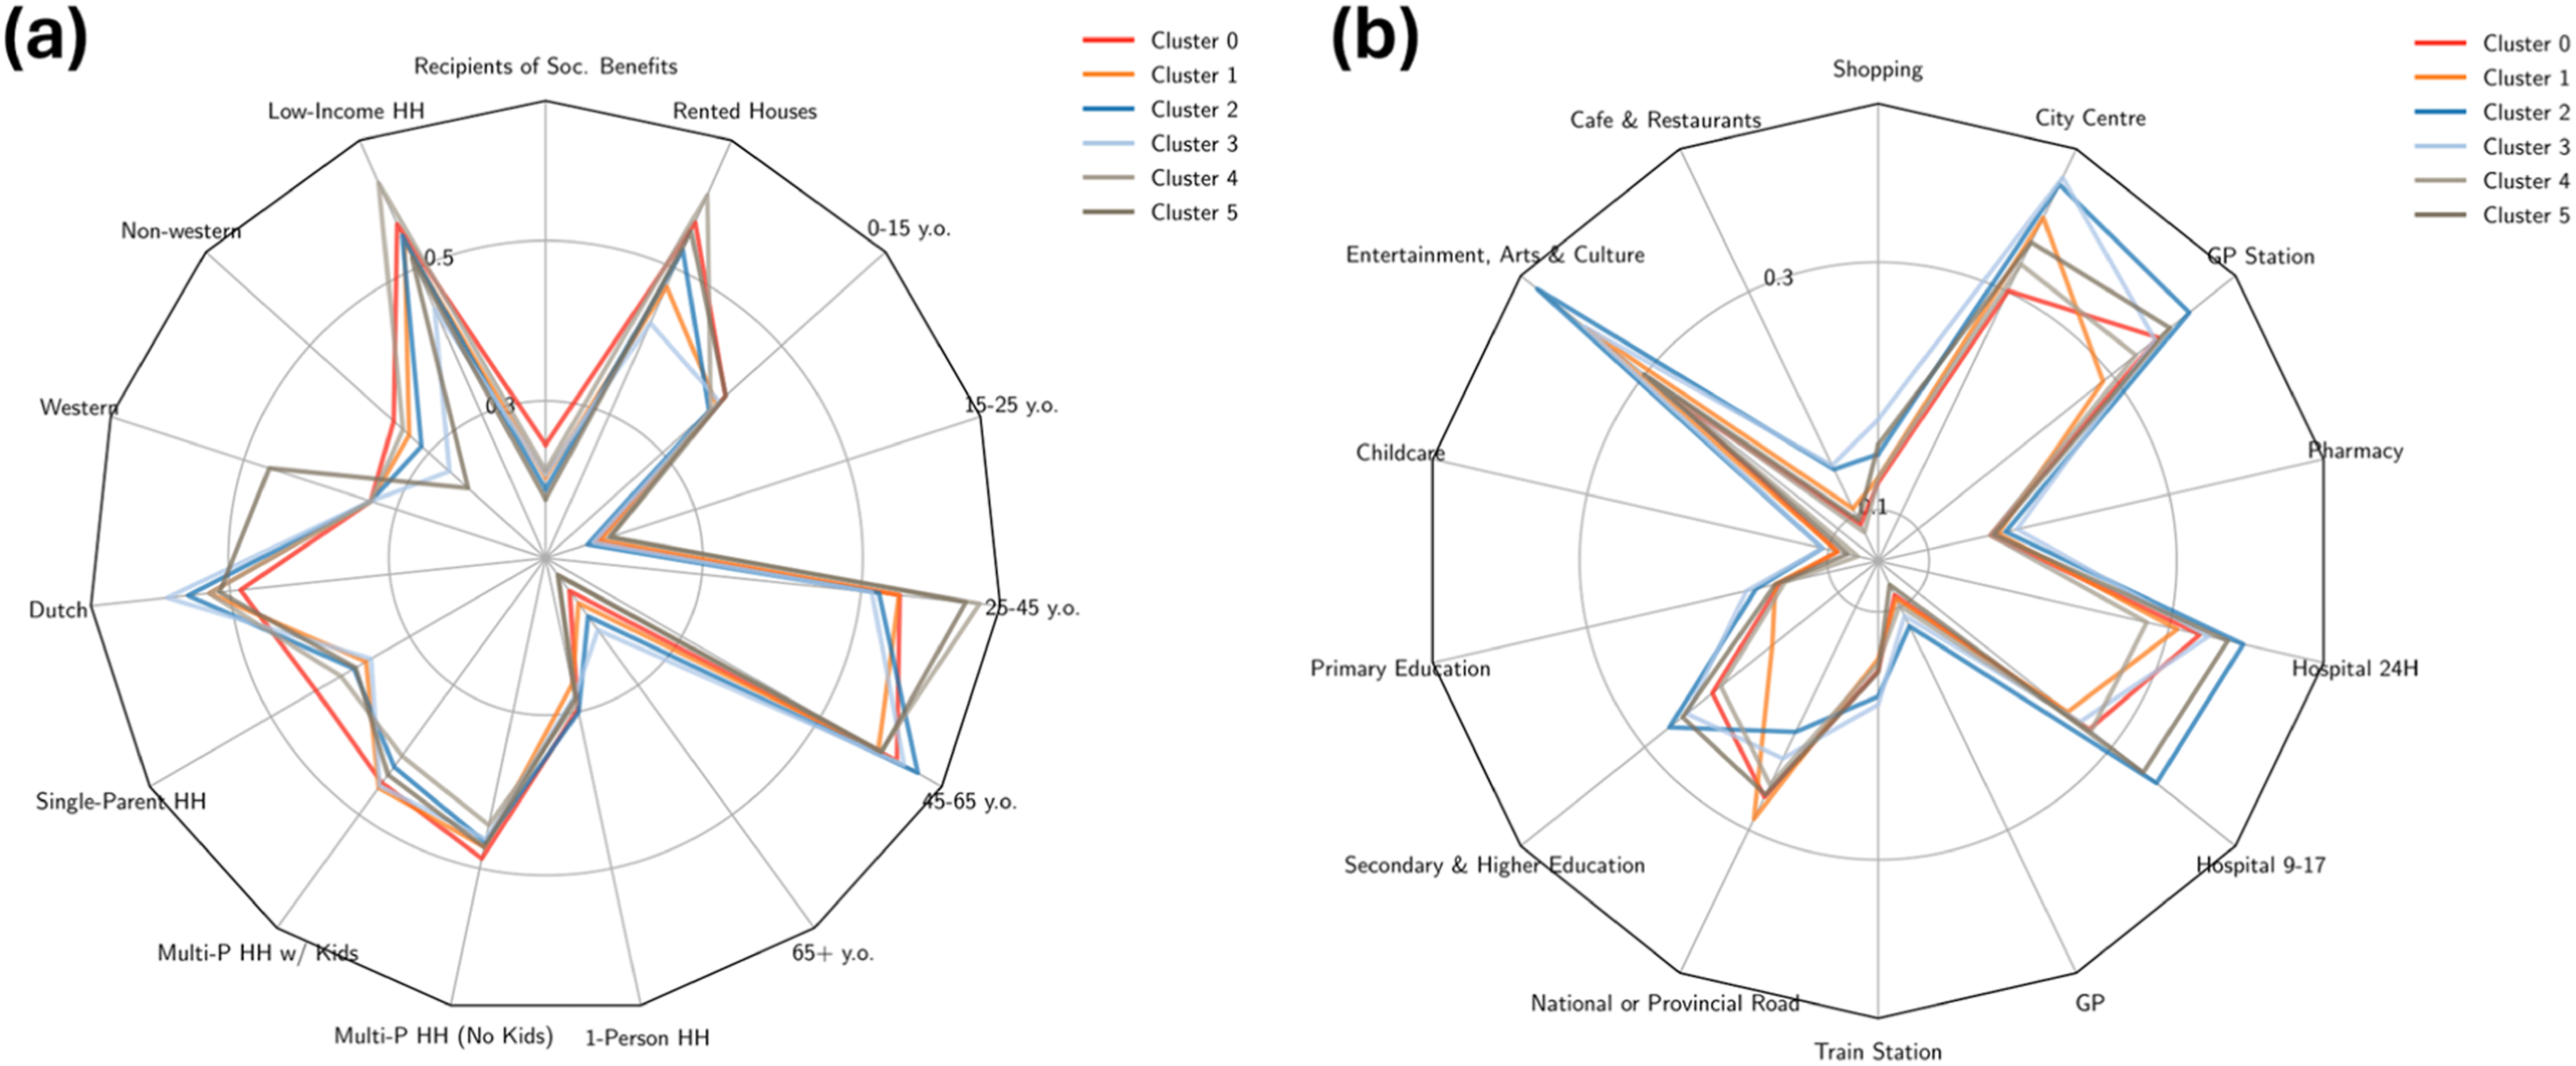
Panel a visualises attributes of three categories: socio-demographic (age, household structure, ethnic background), socio-economic (income and social benefits), and built environment (the share of rented houses in a grid cell). The figure highlights both shared features and those that are unique to each. For instance, all clusters share a similar proportion of residents aged 0–15 and 15–25 years, as well as a mix of 1-person and multi-person households, both with and without children. This sets the stage for us to delve deeper into the unique attributes of each cluster.
Cluster 0 is distinguished by a higher proportion of non-Western residents, single-parent, and low-income households. This cluster’s residents are, relative to other clusters, more likely to receive social benefits and live in rented housing. In contrast, Cluster 1 is characterised by a very balanced demographic composition. The standout feature here is the ethnic background of its residents, who are predominantly non-Western, similar to Cluster 0. However, Cluster 1 notably has fewer single-parent households and rented homes, marking a clear distinction from Cluster 0.
Clusters 2 and 3 exhibit similarities in their demographic makeup, with a higher concentration of residents aged 45–65 and over 65. These clusters have the fewest residents in the 25–45 age group. Yet, there are notable differences: Cluster 3 has a smaller percentage of single-parent and low-income households compared to Cluster 2 and fewer rented houses.
Clusters 4 and 5 share similarities in their age demographics, with the highest percentage of residents aged 24–45, indicating a younger population. However, they differ in other aspects. Cluster 4’s residents predominantly have non-Western backgrounds and include more low-income households and rented homes. In contrast, Cluster 5 primarily consists of Western residents, with fewer low-income households and rented properties. Additionally, Cluster 5 has the lowest proportion of residents receiving social benefits.
Panel b in Figure 5 displays another aspect of the urban fabric: proximity or distance to amenities. Note that the values of this panel are only scaled between 0 and 1 and were not normalised by population. In total, it visualises six categories: health, transport, education, going out, shopping and distance to the city centre. It is worth noticing that all analysed cells have relatively high access to multiple amenity categories.
Cluster 0 cells, positioned closer to the City Centre, benefit from greater access to Shopping, Cafe and Restaurants, and Entertainment, Arts and Culture. These cells are typically further from National or Provincial Roads. Areas with such an amenity composition are often called ‘Central Business Districts’. Indeed, a higher concentration of Cluster 0 cells is found in the geographical centres of case cities like The Hague’s Centrum district, Centrum and Noord in Rotterdam, and Centrum and Zuid districts in Amsterdam. This trend, however, extends beyond these conventional models. Cluster 0 cells are also present in other city parts, such as southeast of The Hague and Rotterdam While these areas may not be identical in amenity count, their proximity to amenities could potentially generate similar urban vulnerability patterns.
Cluster 1 has balanced access amenities for shopping and going out. However, it has a lower distance to a specific subcategory of the latest: Entertainment, Arts and Culture venues. Like Cluster 0, it is also generally further from National or Provincial Roads. Cluster 1 cells have enhanced access to Secondary and Higher education, hospitals, and general practitioners. Considering its composition and spatial distribution, Cluster 1 can be identified as an Inner-City Periphery. These cells are often located around Cluster 0 but are typically slightly further from the city centre.
Clusters 2 and 3 are characterised by their distance from the City Centre, resembling suburban and outer residential areas and have lower access to going-out amenities. Cluster 2, however, is closer to national or provincial roads but has less access to hospitals than Cluster 3.
Cluster 4 shares similarities with Cluster 0 in terms of composition. It is close to the city centre and has high access to going-out amenities. Notably, Cluster 4 cells also have better access to hospitals and GPs.
The final cluster, Cluster 5, often located near the city centre, has balanced access to central business amenities. Its distinguishing feature is high access to Entertainment, Arts and Culture. However, it has lower access to education, transport, and health amenities.
Each of the three cities embodies a complex picture of vulnerability, characterised by six distinct patterns. These patterns of vulnerability fluctuate throughout the day, influenced by various factors of the urban fabric: time of day, location, residents, activities, and the amenities where these activities take place.
Patterns 2 and 3 are more pronounced in the early hours, reflecting the vulnerability that dominates during morning routines. Patterns 0 and 1 become more evident in the afternoon, aligning with the rhythms of urban life in central business districts. Patterns 4 and 5, on the other hand, present a persistent vulnerability throughout the day, indicative of areas with unique demographic or infrastructural characteristics.
While these vulnerability patterns often mirror conventional urban zones – for instance, pattern 0 peaks around noon in central business districts, and outer residential areas see heightened vulnerability between 8:00 and 12:00, coinciding with work commutes – there are deviations. These deviating patterns can emerge in other parts of the city, revealing a polycentric nature in modern Dutch urban landscapes. This suggests multiple ‘centres’ where similar resident behaviours and vulnerabilities are echoed, invalidating traditional city zoning concepts.
Delving deeper, the presence of vulnerable populations in specific areas requires more attention and response. For example, unusual spikes in vulnerability within cluster 0 during night hours might signal emergency needs within vulnerable households. Clusters 2 and 3, predominantly residential areas with a high concentration of families, are situated away from city centres yet near national or provincial roads. This geographic positioning makes these clusters particularly vulnerable during the morning rush hours. In contrast, clusters 4 and 5 are located in the urban core and are abundant with amenities catering to social and leisure activities. This results in a more consistent pattern of vulnerability, reflecting the vibrant, ongoing urban life in these areas. This highlights the complex interplay between amenities, human behaviour, and vulnerability patterns.
Discussion and conclusions
Interpretation of results
We confirm that urban vulnerability arises from spatial-temporal dynamics. Spatially, city centres are hotspots for ambulance calls, likely due to high population densities and elevated human activities. The Hague shows a concentric pattern, while Rotterdam and Amsterdam exhibit polycentric trends, indicating modern cities as networks of interacting sub-cities with nested vulnerabilities. Temporally, ambulance call patterns mirror the circadian rhythm of city life, with peak periods aligning with human activity cycles.
We identified six distinct patterns of urban vulnerability, which can be grouped into three main categories: ‘Midday Peaks’, ‘Early Birds’, and ‘All-Day All-Night’. This classification echoes the inherent rhythms of urban life, shaped by demographic and economic characteristics, infrastructural elements, and human activities. The ‘Midday Peaks’ clusters, predominant in central business districts, highlight a crucial aspect of urban life where the convergence of commercial activities, high population density, and human interaction culminates in a pronounced vulnerability during midday hours. This is a clear deviation from traditional vulnerability models that often overlook the temporal aspect, assuming a uniform vulnerability throughout the day. In contrast, the ‘Early Birds’ clusters show a surge in vulnerability in the early hours, most likely tied to morning commutes and the start of the workday. This pattern is particularly significant in outer residential areas, suggesting a shift in vulnerability from the city centre to suburban areas as the day progresses. Finally, the ‘All-Day AllNight’ clusters, maintaining high levels of calls throughout the day, suggest areas with a continuous interplay of various factors contributing to vulnerability. These could be regions with mixed-use development, a blend of residential and commercial spaces, or areas with nightlife activities, indicating a non-traditional urban rhythm. These findings extend the current understanding of urban vulnerability, traditionally focused on static, spatial aspects, by integrating the temporal dimension, which reflects the dynamic nature of city life.
This research also confirms a polycentric trend in modern Dutch cities, indicating that distinct districts function similarly, essentially making these cities a conglomeration of ‘smaller cities’ within a larger urban area. From a vulnerability perspective, this suggests that similar patterns of vulnerability are evident not only in, for example, city centres but also in outer residential areas, albeit at a reduced scale, as indicated by a lower number of ambulance calls. Such insights are crucial for urban planners and policy-makers, who may need to consider these varying dynamics when addressing the needs and potential policy interventions in different parts of the city.
Our findings suggest that emergency services, such as ambulances, can optimise their resources by focussing on specific clusters during their peak vulnerability times. For instance, increasing the presence of emergency services in ‘Midday Peaks’ areas during 12:00–16:00 could enhance response times and potentially reduce the impact of emergencies. The distinct patterns of vulnerability identified in our study could guide the design and development of urban infrastructure. For areas classified under ‘Early Birds’, for example, enhancing road safety measures and public transport facilities during morning hours could mitigate vulnerability associated with commuting. Similarly, in ‘All-Day All-Night’ clusters, where there is a continuous pattern of vulnerability, urban design can focus on creating safer, well-lit, and easily accessible public spaces.
Limitations and further directions
Our study is exploratory and has several limitations. First, it must be noted that an ambulance call cannot fully capture complex phenomena of risk, exposure and vulnerability. The reliance on ambulance call data, while innovative, does not capture the entire spectrum of urban vulnerability. This data type predominantly reflects emergency health-related incidents, potentially overlooking other aspects of urban vulnerability, such as crime or non-emergency health issues. Future research could benefit from incorporating additional data sources, such as police reports or health service usage data, to provide a more comprehensive view of urban vulnerability. While the proposed proxy has limitations as any other proxy used to assess the vulnerability or resilience of an urban system (Haraguchi et al., 2022), it is critical to use a variety of data to overcome methodological challenges.
Our study is designed to allow others to expand on our initial approach and add other data sets, for example, related to social, environmental, or economic vulnerability. In addition, we hope that our approach will be tested in other contexts and settings, going beyond the case studies that we presented here to test the generalisability of the patterns we identified.
Another set of limitations pertains to the spatio-temporal granularity of our analysis. We currently delineate cities using municipal boundaries, which may not fully capture the extent of the vulnerability as it does not stop at these borders. By integrating additional data sources, such as intercity mobility, we can stress-test our findings and better understand the vulnerability introduced by city visitors. Moreover, conducting the analysis on a finer temporal scale, such as 1-h intervals, would be possible with more observations. This approach would facilitate the development of more targeted interventions.
We are also aware that not all citizens may call an ambulance, even when they are in great need. However, the accessibility of ambulance services in the Netherlands is relatively high. Transferring this proxy to other countries will require extra effort due to the healthcare differences and accessibility.
Conclusion
Our research has put forward an analytical framework to analyse urban vulnerability as a spatio-temporal phenomenon, previously mainly studied as spatial or temporal. At the core of our framework is the number of ambulance calls as a proxy for where an urban system gets fractured. We apply this framework to the three biggest Dutch cities and find that urban vulnerability changes across space and time, challenging traditional notions of static, spatially focused assessments.
These findings offer a more nuanced understanding of modern cities from the vulnerability perspective, depicting vulnerability not as a static phenomenon but as a dynamic one that varies across space and time. This enriched perspective has implications for urban planning and policy-making. Emergency services and planners, therefore, need to adopt strategies that are tailored to the unique temporal and spatial characteristics of different urban areas.
Supplemental Material
Supplemental Material - The rhythm of risk: Exploring spatio-temporal patterns of urban vulnerability with ambulance calls data
Supplemental Material for The rhythm of risk: Exploring spatio-temporal patterns of urban vulnerability with ambulance calls data by Mikhail Sirenko, Tina Comes and Alexander Verbraeck in Environment and Planning B: Urban Analytics and City Science.
Footnotes
Declaration of conflicting interests
The author(s) declared no potential conflicts of interest with respect to the research, authorship, and/or publication of this article.
Funding
The author(s) received no financial support for the research, authorship, and/or publication of this article.
Data availability statement
The data that support the findings of this study are available from the corresponding author upon the request.
Supplemental Material
Supplemental material for this article is available online.
References
Supplementary Material
Please find the following supplemental material available below.
For Open Access articles published under a Creative Commons License, all supplemental material carries the same license as the article it is associated with.
For non-Open Access articles published, all supplemental material carries a non-exclusive license, and permission requests for re-use of supplemental material or any part of supplemental material shall be sent directly to the copyright owner as specified in the copyright notice associated with the article.