
Abstract
Urban vitality (UV) is a commonly used concept that describes the liveliness, diversity, and attractiveness of urban spaces, which foster social interaction and activity. While the concept has received ample attention from researchers, combining big data and traditional data sources to capture UV remains underexplored. To address this gap, we build on contemporary interpretations of Jane Jacobs’s concept of vitality to develop a methodology that identifies dynamically vibrant areas. We propose a conceptual framework comprising three components: the built environment, the static residential population, and the dynamic population presence. The dynamic population presence, derived from georeferenced social media activity, serves as the main proxy for UV, reflecting the dynamic use and interaction within urban space. The built environment and static residential population dimensions are incorporated to contextualize and interpret the spatial patterns of dynamic presence. Vitality is further evaluated through four dynamic attributes: intensity, variability, consistency, and linguistic diversity that describe temporal rhythms and social heterogeneity. Applying this framework to Tallinn, Estonia, we explore the city’s spatio-temporal patterns and spatial clustering to identify its spatial hierarchy of vibrancy and relation to land-use functionality, mixed-use areas, and demographic diversity. The findings demonstrate how combining dynamic data with traditional indicators advances the understanding of UV and supports more inclusive, accessible, and socially cohesive urban planning.
Keywords
Introduction
Urban vitality (UV) is a term commonly applied in urban design. It is usually understood as the quality of urban spaces that attracts diverse groups of people to engage in various activities and interact safely at different times of the day (Liu et al., 2022). UV shares similarities with the principles of agglomeration economics, which suggest that large cities with diverse activities and interactions attract businesses, tourists, and skilled workers, driving economic growth and increasing diversity (Fujita and Thisse, 1996; Glaeser, 2010). Diverse activities and environments support random encounters and interactions between people from different backgrounds (Jacobs, 1961), resulting in more lively human activity, social interactions, and enhancing the experience of urban spaces. Moreover, vibrant urban spaces are perceived as inherently safer due to social control, as Jane Jacobs (1961) argued with her “eyes on the street” concept, where the presence of people helps create a sense of security. However, in academic discourse, the precise definitions of UV differ, particularly in how it can be quantitatively measured using spatial and statistical information (Jakarta et al., 2022; King, 2013).
Examining what constitutes UV has received much attention in urban planning studies for decades. More explicit approaches initially emerged in urban discourse in the 1990s, such as chrono-urbanism (Mouratidis, 2024) and Transit-Oriented Development (TOD) (Ibraeva et al., 2020). These presumably create vitality by reducing car dependency and encouraging transit, biking, and walking. However, UV is challenging to generate through these conservative, top-down planning approaches, which rely on regulating space to create life without a guarantee that it will emerge. Such approaches often fail to recognize the intrinsic emergent dynamics of the cumulative effects of individual actions (Batty, 2018; Osunkoya and Partanen, 2024). To overcome these limitations, alternative data sources and analytical tools are needed to embrace the bottom-up dynamics of vitality.
Yet prior research on UV has not fully explored the potential of novel data sources and techniques (Dogan and Lee, 2024; Li et al., 2022). For example, using advanced spatial analysis with complementary data sources, such as official statistics and big data (Kang, 2020), can provide fresh perspectives on the study of UV. Such studies are rare because they require large volumes of highly detailed data across both space and time. This type of comprehensive data is often unavailable, which hinders the study of UV dynamics in detail, and as a result, many promising methods for analyzing UV remain underexplored (Gao et al., 2024).
Mobile big data refers to the data generated by mobile devices and their associated applications, such as geo-referenced social media content, which is crucial for studying UV. It serves as a proxy for population presence, possibly indicating the level of urban liveliness (Huang et al., 2023; Sulis et al., 2018). Numerous studies have applied this premise and analyzed the frequency of geo-referenced social media posts while studying spatio-temporal variations in urban attractiveness (Liang et al., 2022), mobility (Yin and Chi, 2021), park usage (Hamstead et al., 2018), nightlife (Kim, 2020), subjective happiness, or shrinking cities (Park et al., 2021), along with urban linguistic diversity (Väisänen et al., 2022). However, coherent methodologies for UV studies are only emerging; although earlier examples exist as well, like Chuang et al.’s (2023) method for measuring the frequency and diversity of social media users and Sulis et al.’s (2018) introduction of a framework for measuring vitality through three dynamic attributes: intensity, variability, and consistency of social media content.
Consequently, we recognized the need to develop a framework for systematically measuring UV based on people’s presence through georeferenced social media posts to enhance responsive, sustainable urban policies and design interventions. Here, we consider UV as an emergent, cumulative feature in cities (Huang et al., 2020; Jin et al., 2024). In this study, we ask (1) what are the spatial and temporal patterns of UV across different domains in Tallinn, Estonia, as indicated by geo-referenced social media data? (2) What constitutes different types of UV? (3) How does linguistic diversity factors into the spatial distribution of UV?
To answer these questions, we first apply our conceptual framework to measure and map UV, using statistical data on the built environment, socio-economic characteristics of residents, and geo-referenced social media content to represent distinct vitality domains. Second, we extend Sulis et al.’s (2018) interpretation of Jane Jacobs’s concept of UV by introducing linguistic diversity as an additional variable for identifying vital urban spaces. Third, we examine the spatio-temporal patterns and spatial hierarchies of Tallinn, Estonia, by conducting cluster analyses.
Conceptual framework of urban vitality measurement
A fundamental step in measuring UV is clearly defining what it entails. On one hand, some authors consider that UV reflects the vibrancy of dynamic, physical urban processes, serving as a comprehensive expression of economic, social, and cultural activity (Kim, 2018), urban growth, diversity, and mobility (Liu et al., 2022), or the concentration of population, and land-use diversity (Garau and Annunziata, 2022). On the other hand, many scholars have stressed the role of qualities and characteristics of the urban landscape that support vitality, such as street layouts, public spaces, the porosity of the urban form, access to transit, or functions of buildings, combined with socio-economic profiles of the population from official statistics (Arribas-Bel and Fleischmann, 2022; Liu et al., 2023). Moreover, in recent decades, the online presence, rankings, and promotions of places have become an important factor in influencing the vibrancy of urban spaces and guiding people’s choices (Ballatore, 2025). Here, we argue that these views offer complementary perspectives to UV and the environmental conditions that support it.
UV relies on sustained activity and mobility, which depend on accessible and appealing urban spaces for both locals and visitors (Liang et al., 2022). Activity in urban space is not static but fluctuates over time, reflecting the dynamic use of urban space (Ouyang et al., 2022). Typically, more static data, like official statistics, have been used to reflect both human presence (usually residents) and environmental features (built environment) (Osunkoya and Partanen, 2024). However, new sources of mobile big data, such as social media posts and mobile phone data, can capture the dynamic real-time population presence and their spatio-temporal behavior, unlike traditional statistics (Müürisepp et al., 2025; Wang, 2024). We argue that integrating this approach with more traditional data can provide a comprehensive understanding of urban dynamics (Cao et al., 2023).
To better understand who contributes to UV, we analyzed the languages used in social media posts to distinguish between residents, domestic, and international visitors (Heikinheimo et al., 2022; Väisänen et al., 2022). We adopted the computational approach developed by Sulis et al. (2018) to capture UV based on three dynamic attributes: intensity, variability, and consistency. In their approach, intensity describes the hourly population presence in an area, variability refers to the daily variations in population presence at the same location, and consistency represents the hourly variations in population presence per day. We add a fourth attribute, linguistic diversity, to the initial model, as it allows us to examine the dynamic diversity of people in urban spaces. The co-presence of multiple languages can reflect the inclusivity and cultural vibrancy of the area (Perlin et al., 2021). Using the four variables, we aim to capture the dynamic side of UV more comprehensively.
Therefore, we define the conceptual framework for UV as the interactions within the activity landscape that emerge between the built environment and various population groups. The three components of this framework—the built environment, the static population, and the dynamic population—together shape and influence UV. Among these, dynamic population presence serves as the main proxy for vitality, reflecting real-time human activities and dynamic patterns (Figure 1). The built environment provides the physical affordances for human interactions (e.g., shopping and working), while the population (both static and dynamic) creates everyday social and urban interactions, generating vitality. Diverse and accessible urban spaces improve these interactions, as they increase the chances of people meeting and engaging (Gehl, 2011; Jacobs, 1961). Conceptual framework for assessing UV with the dynamic presence of the population as the main proxy for vitality.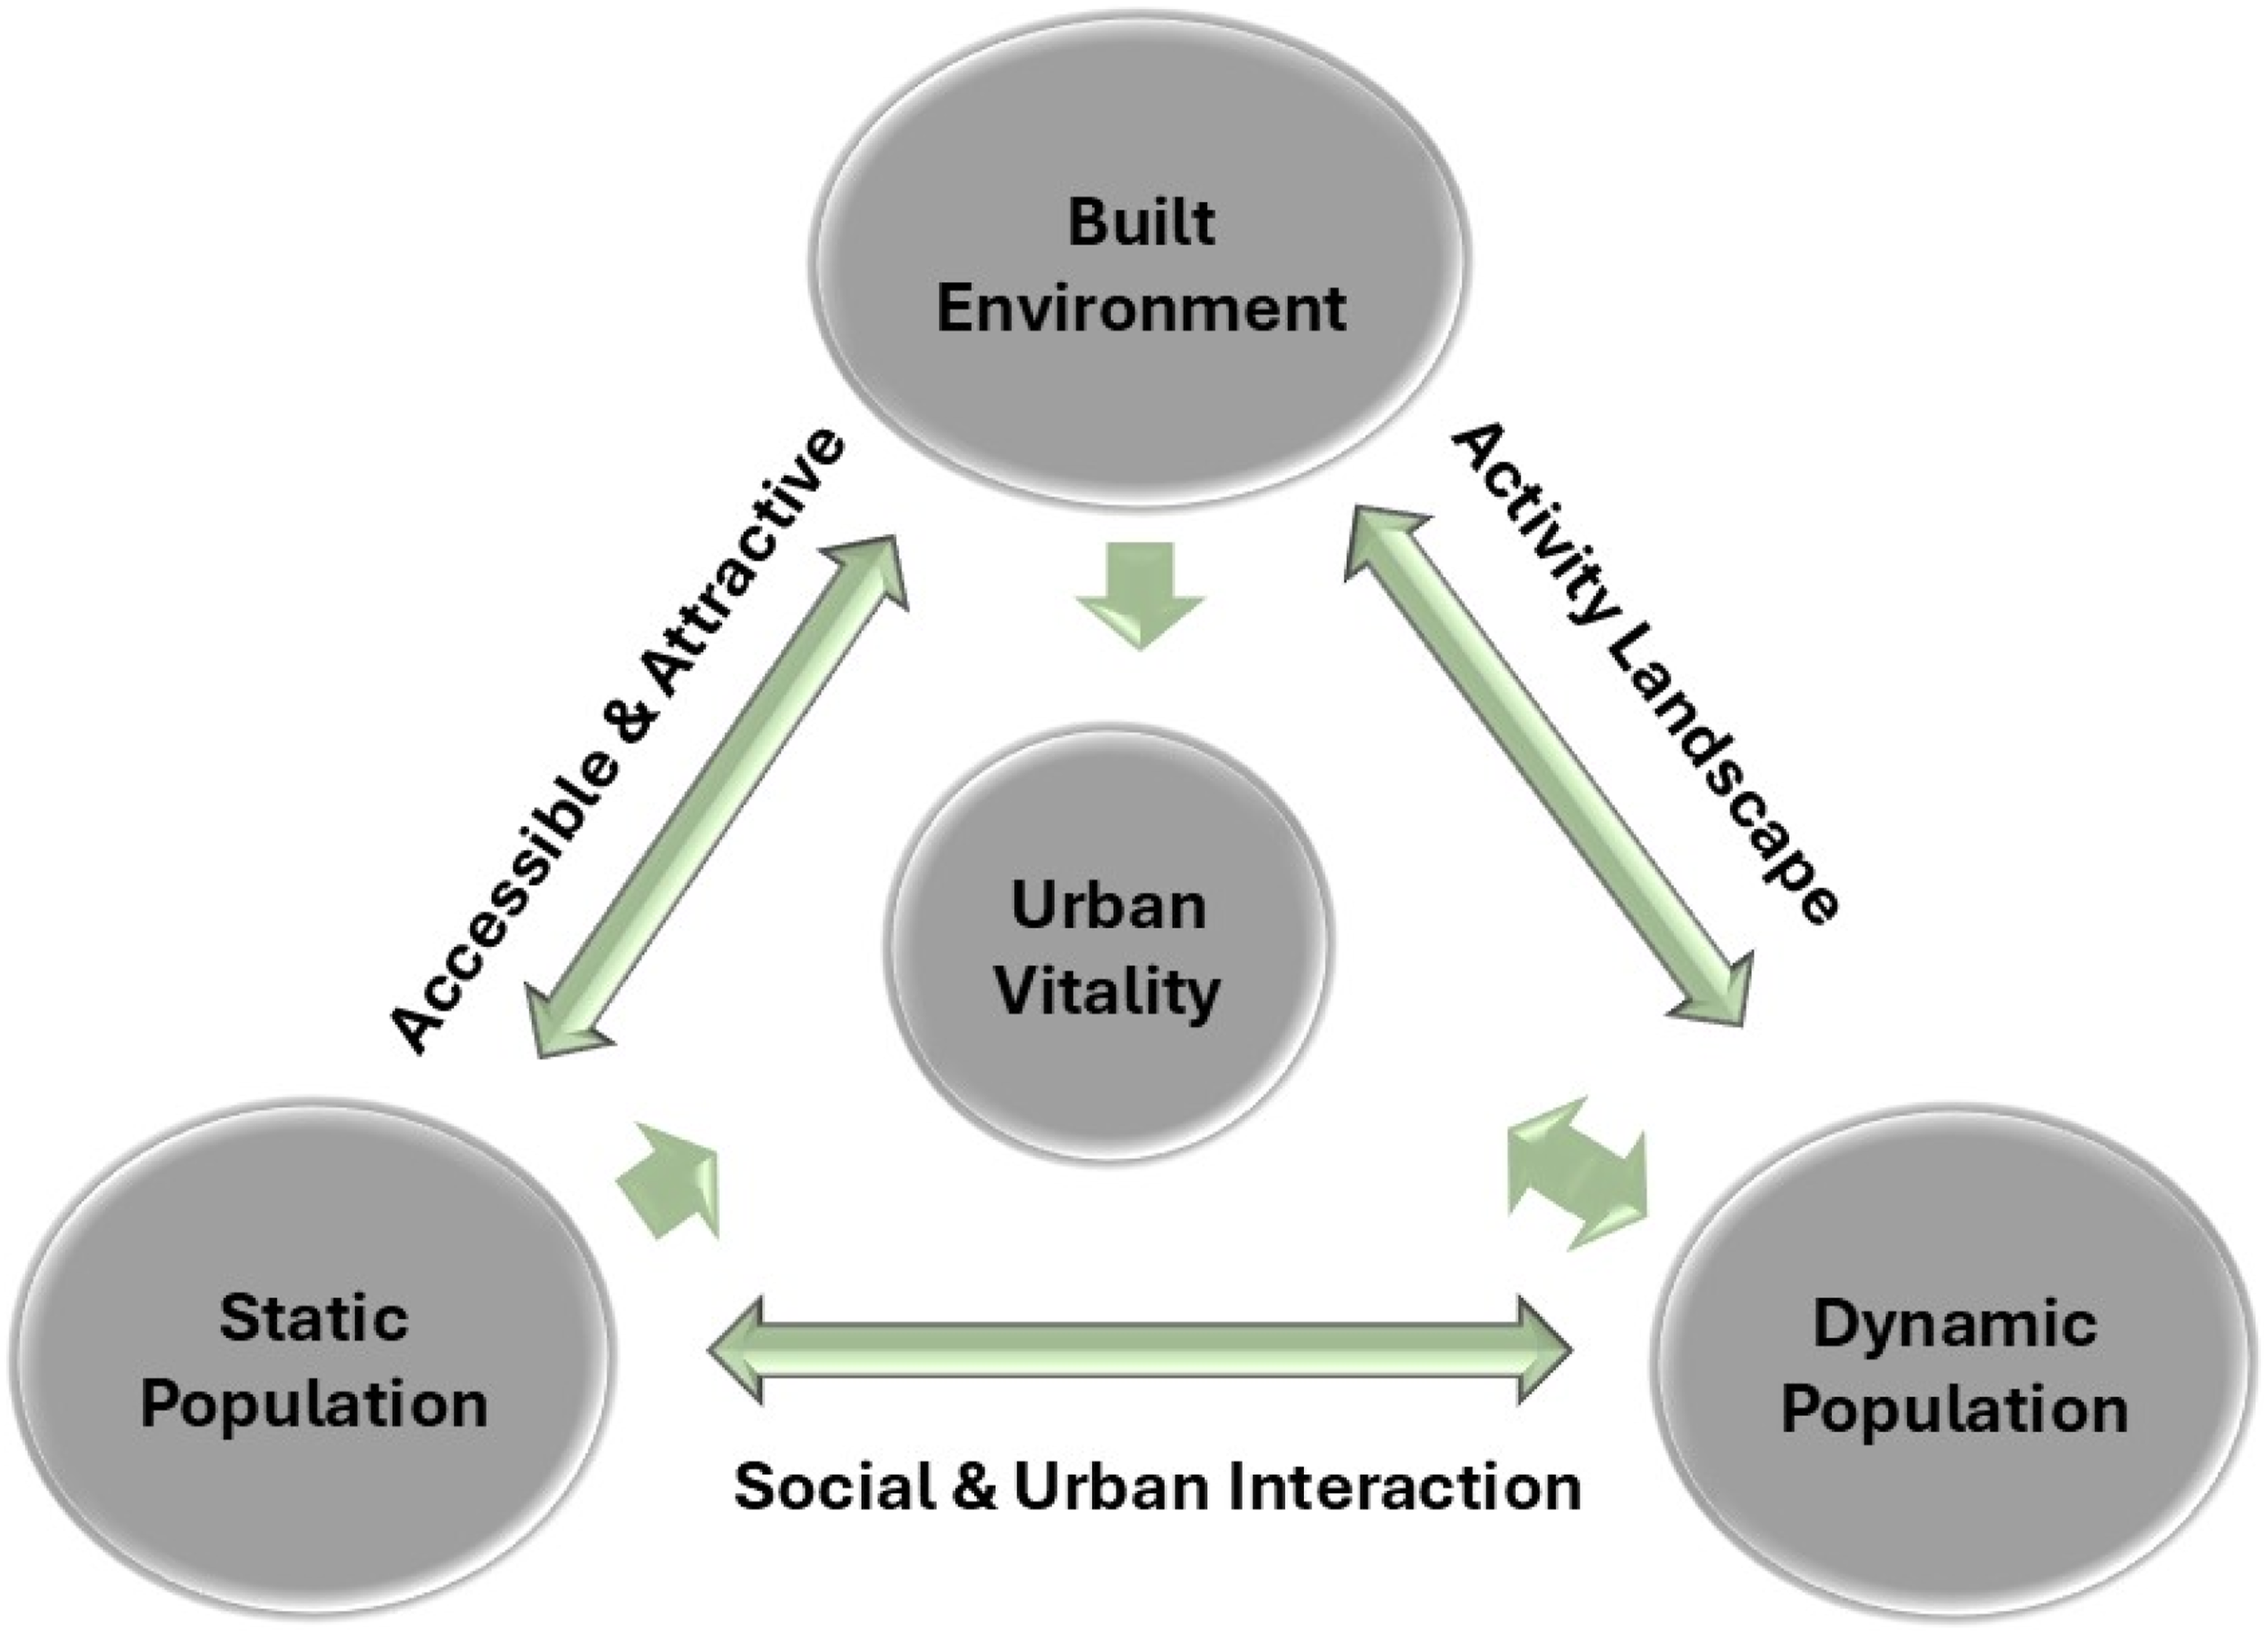
To examine the built environment, we utilize information on the ages of buildings, mixed uses, population density, and street intersection frequency, echoing the pioneering work of Jacobs (1961). This set of aspects has been demonstrated to serve as a proxy for environmental diversity (Osunkoya and Partanen, 2024).
The static population component, known as the residential population, is based on the socio-economic characteristics of neighborhoods. Diversity in age, gender, language, and education among residents indicates greater potential for local vitality (Liu et al., 2022). Moreover, the residents are not passive inhabitants but actively participate in shaping urban spaces and the social rhythm of the city (Lefebvre and Nicholson-Smith, 1991) even if their movements are not captured in official statistics (Chin et al., 2024). For instance, residential areas located near amenities tend to support a broader range of urban uses (Hidalgo et al., 2020).
The third component is the dynamic population, which reflects the fast-paced human presence and movement across the city, including locals, domestic, and international visitors. Their rhythms shape the temporal variation of vitality, as their presence fluctuates seasonally and across holidays, weekdays, and weekends (Ahas et al., 2007) and is observed through geo-referenced social media data, which helps identify active areas across time and contributes to the intensity, variability, and consistency of human activity (Sulis et al., 2018). For example, the seasonal patterns of tourist areas, which may thrive in summer but decline in winter, can be observed through geo-referenced social media data and identify vital places (Martí et al., 2021; Osorio-Arjona and García-Palomares, 2019).
Data and methods
Study area
The study focuses on Tallinn, the capital of Estonia, situated in the northern part of the country along the Baltic Sea coast in northern Europe (Supplement Figure S1). Tallinn is Estonia’s largest city, with a total population of 461,000, and is a primary destination for both international and domestic visitors. At least 84% of Estonian Internet users regularly use their preferred social media platform (Kemp, 2024). While most users utilize Meta services, Twitter is Estonia’s third most popular social media platform (GlobalStats, 2024), and social media usage in the capital region is expected to be very high (Salas-Olmedo et al., 2018). Tallinn makes an excellent case for empirically testing our conceptual framework.
Datasets
We use data from the Estonian building register (as of 2024) and street network data from OpenStreetMap for the “Built environment” component. This data included building ages and uses (Supplement Table S1) population density per grid cell, street intersection count, and network centrality scores for Tallinn (Estonia e-building register, n.d.).
We utilize information on the ages, genders, languages, and education levels of residents from the 2020 Tallinn population dataset, provided by Statistics Estonia, for the “Residential population” component. To assess the “Dynamic population,” we use geo-referenced social media content from Twitter, which provides us with information on the time and location from which the post was sent (Väisänen et al., 2021). Geo-referenced tweets record temporal information and the geographic location from which the tweet was sent (Sowkhya et al., 2018). We collected 155,922 geolocated tweets from Tallinn between October 2020 and February 2023 using a tool developed by Väisänen et al. (2021). We aggregated them into a grid containing the number of users, posts, and languages per cell, along with their hourly, daily, and yearly activity levels.
Measuring the four dynamic attributes of urban vitality
Sulis et al. (2018) captured a distinct level of temporal variation using intensity, variability, and consistency to measure daily, hourly, weekday, and weekend tweet activity, representing a measure of vitality for a given location (Dv). We adjusted the way Sulis calculated the attributes to match our specific datasets and expanded it with a linguistic component (equation (1)) (see Table S2 in the Supplemental Material for a statistical description of the metrics and methodological approach of the three attributes).

where:
The
The
The
The
Measuring diversity of the built environment
We use Simpson’s Index (S) to measure the diversity of the built environment, such as mixed uses, building ages, and population density in grid cells, following prior work of Osunkoya and Partanen (2024) and added street intersections as a fourth variable (Supplement Figure S3(a)).
Measuring diversity of the residential population
We measured the diversity of the residential population (gender, age, language, and education) and aggregated the dataset from its original spatial cell size of 250 m × 250 m to 500 m × 500 m to enable spatial joining with other datasets. We followed the same method to calculate and classify the Simpson diversity values for the residential population variables and to evaluate their influence on other UV components and variables.
Regression and clustering analysis
We applied multivariate linear regression (equation (1)) to estimate the influence of the four dynamic attributes as independent variables (Dvs) and tweet count as the dependent variable, with the variables selected based on their conceptual relevance to dynamic urban activity and presence, following Jacobs’s vitality models (Jacobs, 1961; Sulis et al., 2018). Multicollinearity was evaluated with the Variance Inflation Factor (VIF), with all values below the accepted threshold of 5, indicating no significant collinearity issues (Supplement Table S3). Next, spatial clustering patterns were examined using attribute-based K-means analysis (Supplement Table S7).
Results
Spatial patterns of the four dynamic population attributes of urban vitality
The four dynamic population attributes, intensity, consistency, variability, and language diversity, reveal distinct spatial patterns across Tallinn. We observed a very high tweet intensity in areas with both dense and sparse residential uses, seasonal and large-scale recreational spaces (Supplement Figure S2(a)). High-intensity regions were observed in mixed-use areas such as university campuses, business and commercial districts, and around tourist landmarks. Areas with medium intensity formed linear corridors that intersected diverse urban environments, including recreational areas, institutional facilities, and transit hubs, across various building densities and land-use types. Low tweet intensity was observed in areas with lower traffic flow, good street connectivity, mixed-use low-rise buildings, and heritage structures.
Variability describes how the number of users varies within a cell (Supplement Figure S2(b)). High variability is concentrated in districts close to the central areas of Tallinn, commercial areas in more peripheral districts, and around major transit and institutional hubs. Medium variability was observed in zones adjacent to those with high variability and in other districts with diverse uses. Low variability was observed across all districts in zones with stable activity levels, characterized by consistent patterns and operational hours with less fluctuating use, as well as relatively low population densities.
Consistency is high in urban cores, coastal locations, and mid-rise residential apartment blocks in central districts (Supplement Figure S2(c)). Medium-consistency areas follow the surrounding zones of higher consistency and places with recurring daily usage patterns. Low consistency is in areas surrounded by high-consistency areas and in more peripheral districts, indicating that these areas have limited or uneven intra-day tweet activity.
Linguistic diversity is very high in central areas, forming a dense belt that extends east-west through the city’s core and slightly toward the southeast (Supplement Figure S2(d)). High diversity forms a buffer around the very high language diversity zone. A moderate level of linguistic diversity is scattered around the high and very-high-diversity core, extending into inner suburbs and mixed-use neighborhoods. Very low linguistic diversity is observed in peripheral or less densely populated urban areas. Together, they form a spatial pattern that extends outward from the city center, suggesting variation in linguistic representation across the urban landscape.
Comparison of the original and extended models (Dv vs Dvs)
Figure 2(a) presents the original model (Dv), which is based on three combined attributes: intensity, variability, and consistency. Vitality peaks in Tallinn’s city center and decreases toward the outskirts, forming a core-periphery gradient. This demonstrates very high diversity of tweet activity in the urban core, followed by high to low diversity, with very low diversity observed in the core, the inner suburban ring, near peripheral zones, and city edges. These areas indicate demographically uniform or homogeneous neighborhoods. Spatial patterns of UV in Tallinn derived from (a) Sulis’s original dynamic vitality model (Dv) and (b) the extended model integrating linguistic diversity as dynamic population presence (Dvs) show expanded high-vitality zones reflecting multilingual and intercultural activity areas.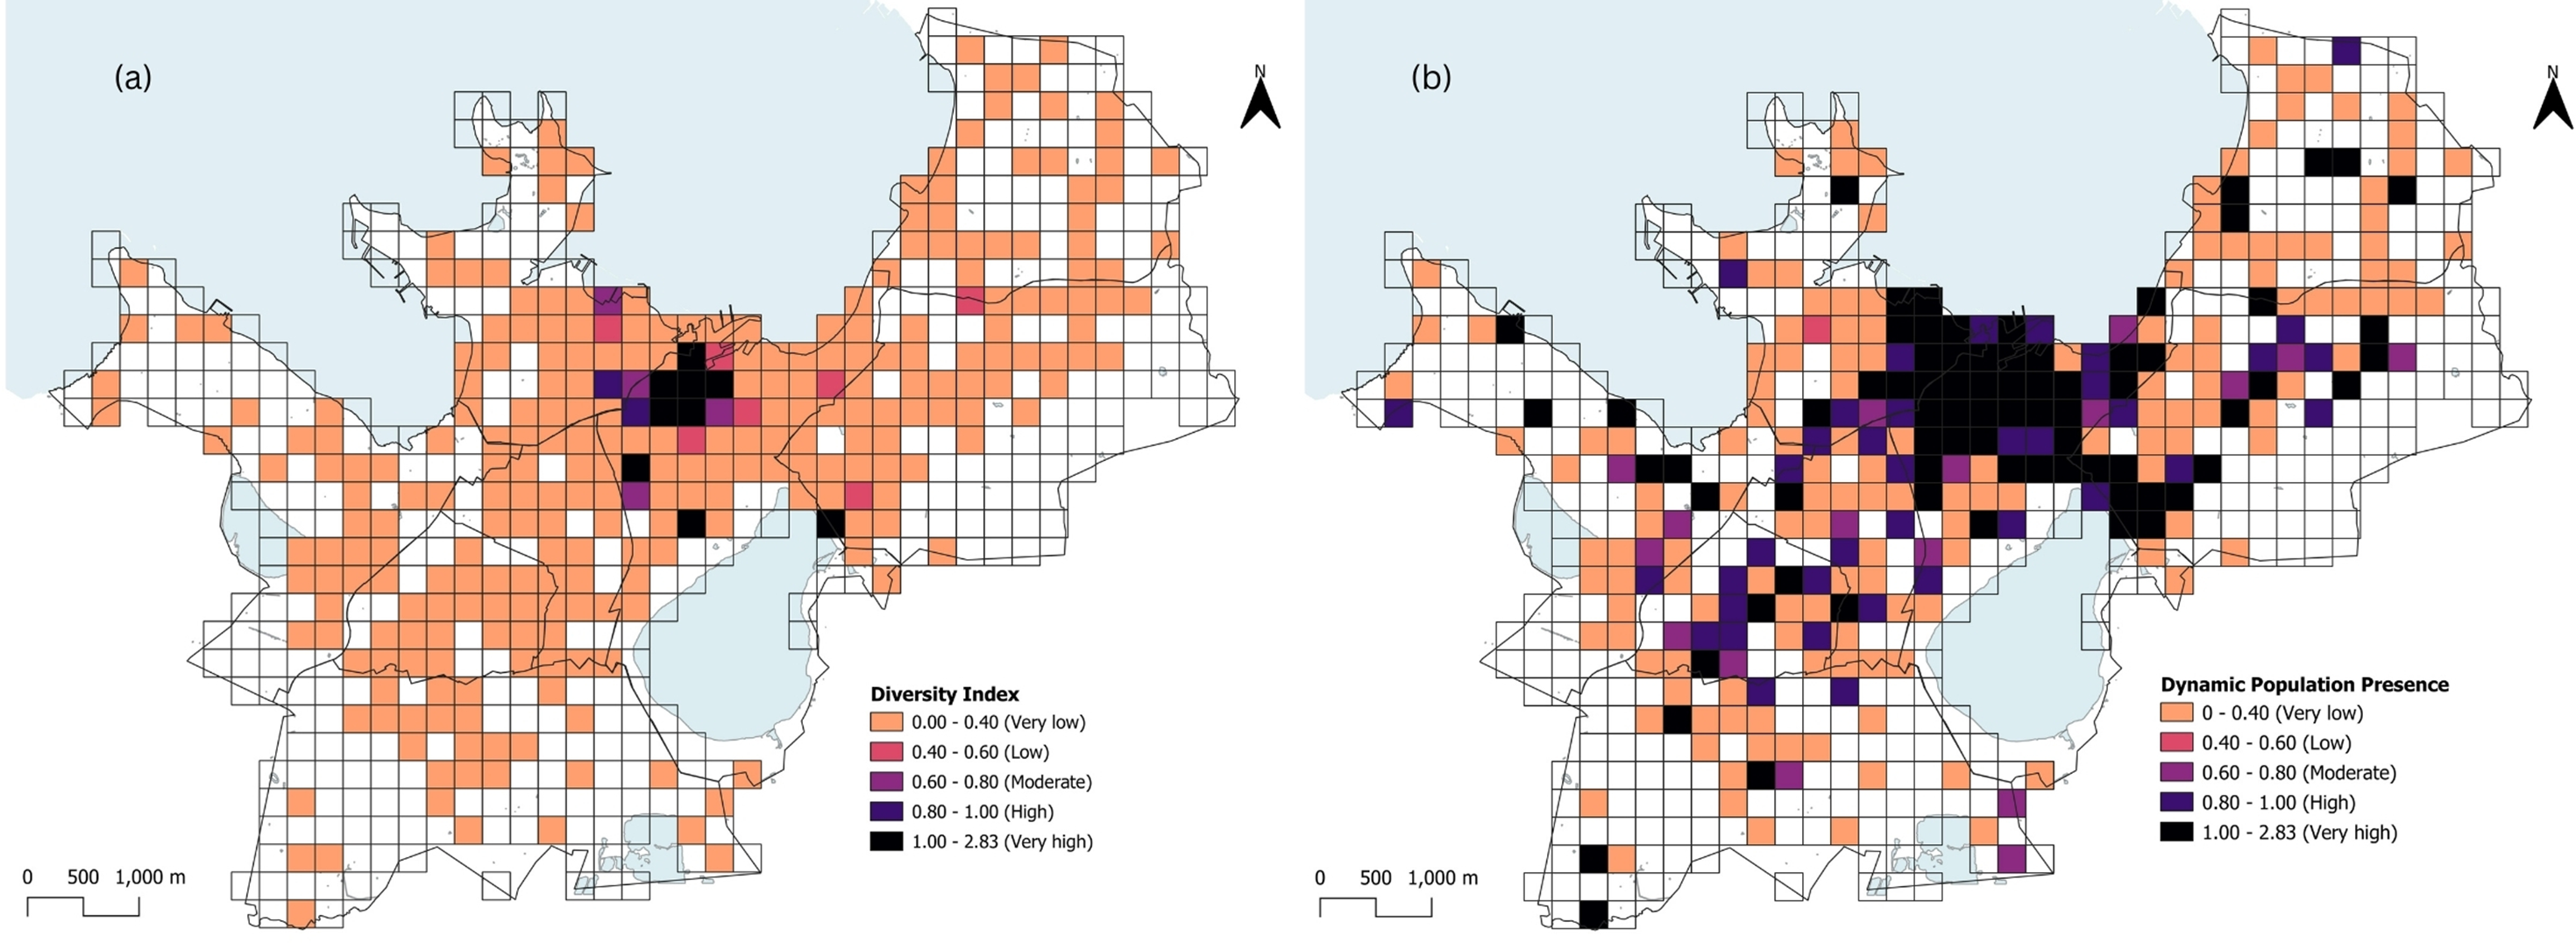
The extended model (Dvs) in Figure 2(b) adds linguistic diversity as a fourth attribute and expands the high-vitality area beyond the city core, particularly into the multicultural districts of Lasnamäe, Kesklinn, and Mustamäe, where multilingual interactions are prominent. Several grid cells shift from low or moderate vitality in Dv to high vitality in Dvs, particularly in linguistically diverse cells, indicating that linguistic diversity captures intercultural and transient activity patterns not reflected in the original model. In contrast, the Dvs model provides a broader and socially heterogeneous view of UV, highlighting how linguistic heterogeneity enhances the city’s dynamic presence.
Multiple regression analysis
This model demonstrated that the relationship between the combined four attributes Dvs (independent variables) and the initial model Dv (dependent variables) was statistically reliable, as indicated by Multiple R = 0.774, R2 = 0.598, Adjusted R2 = 0.598, and P < 0.001. The model showed that changes in human activity are correlated with the level of vibrancy in areas and that we can consider Dvs a strong candidate predictor of UV (Supplement Table S4).
The static components of urban vitality
i. The Built Environment: It illustrates the spatial variation of the built environment variables (building age and use, population density, and street intersection density) (Supplement Figure S3(a)). High built environment diversity is concentrated in the central historical areas and along main corridors in several central districts. In the outer central areas of mid-peripheral regions, moderate diversity zones offer a mix of contemporary and historic built environments. The low-diversity area is widespread throughout the outer city and is interspersed between very low and moderate-diversity regions. ii. Residential distribution is concentrated in central and southern urban zones, as well as in some scattered hotspots in the western and eastern areas (Supplement Figure S3(a)). The high diversity forms a dense belt around the urban core. It extends into the east and west corridors, indicating considerable variation in residential patterns, with the highest diversity areas forming distinct and discontinuous “islands” across the city. Moderate diversity areas are widely found in inner and middle urban areas, serving as a transition zone with a moderate level of variation in residential distribution. While low-diversity areas are dominant in some outer ring and southern and northern districts, this gives relatively homogeneous residential distribution environments.
Multilayered view of urban vitality
To understand how various factors influence UV in the model, we analyzed the impact of built environment diversity (BED) and residential population diversity (RPD) on dynamic population diversity (Dvs) and the original vitality model (Dv). The statistical relationships between these components are shown in Tables S5 and S6 in the Supplemental Material. The regression results show that both BED and RPD significantly influence Dvs, supporting their roles in UV and providing the foundation for the K-means clustering analysis.
The influence of the BED over Dvs
The regression model yields a statistically significant result (R2 = 0.046, p < 0.001), indicating that BED has a moderately positive effect on Dvs (β = 0.559). This suggests that a diverse, mixed-use, and connected urban environment attracts a more dynamic population.
The influence of RPD on the Dvs
Similarly, the regression result (R2 = 0.027, p < 0.001) is positive and statistically significant with an impact on Dvs (β = 0.308), supporting that RPD contributes to more varied Dvs. These findings highlight the role of diverse residential socio-economic characteristics in shaping UV and a dynamic population.
The influence of RPD variables on the Dv
Among the RPD variables, only language diversity significantly predicted Dv (β = 0.141, p < 0.001), while age, gender, and education showed no significant effects. The model revealed a positive and statistically significant relationship between RPD’s variables and the Dv (R2 = 0.040, p < 0.001), suggesting that linguistic diversity within residential communities contributes most meaningfully to spatial-temporal urban activity.
The influence of BED variables on Dv
The model explained 11.2% of the variance in UV (R2 = 0.112, p < 0.001), with street intersection density being the most influential variable (β = 0.380, p < 0.001), underscoring the importance of urban connectivity and pedestrian-friendly neighborhoods. Population density showed a small but adverse effect (β = −0.109, p = 0.034), while building use diversity and the presence of aged buildings had a marginal impact, falling just below statistical significance.
Spatial clustering of urban vitality components
To understand the spatial distribution of UV across Tallinn, we performed K-means clustering (Figure 3, Supplement Table S7) on the mean diversity scores for the three core components: BED, RPD, and Dvs. We used k = 3 as it showed the best performance in our Elbow method analysis. Cluster 3 (vital areas) is concentrated in the urban core and central belt, stretching east-west across the city, recording the highest diversity scores across all indicators (BED = 0.421; RPD = 0.460; Dvs = 1.081). Cluster 1 (transitional zones) dominates the northwest, southern, and northeastern edges, with low to moderate values (BED = 0.334; RPD = 0.513; Dvs = 0.016). Cluster 2 (outer zones) is characterized by low demographic and activity presence (BED = 0.138; RPD = 0.003; Dvs = 0.004). Finally, we evaluated cluster stability using Silhouette scores and found good cluster stability, with all clusters above 0.5 (Cluster 1 = 0.719, Cluster 2 = 0.716, and Cluster 3 = 0.550), confirming the UV measurement derived from the multilayered model. Spatial distribution of UV clusters (Cluster 3 = vital areas, Cluster 1 = transition zones, and Cluster 2 = outer zone) based on k-means classification of BED, RPD, and Dvs indicators in Tallinn.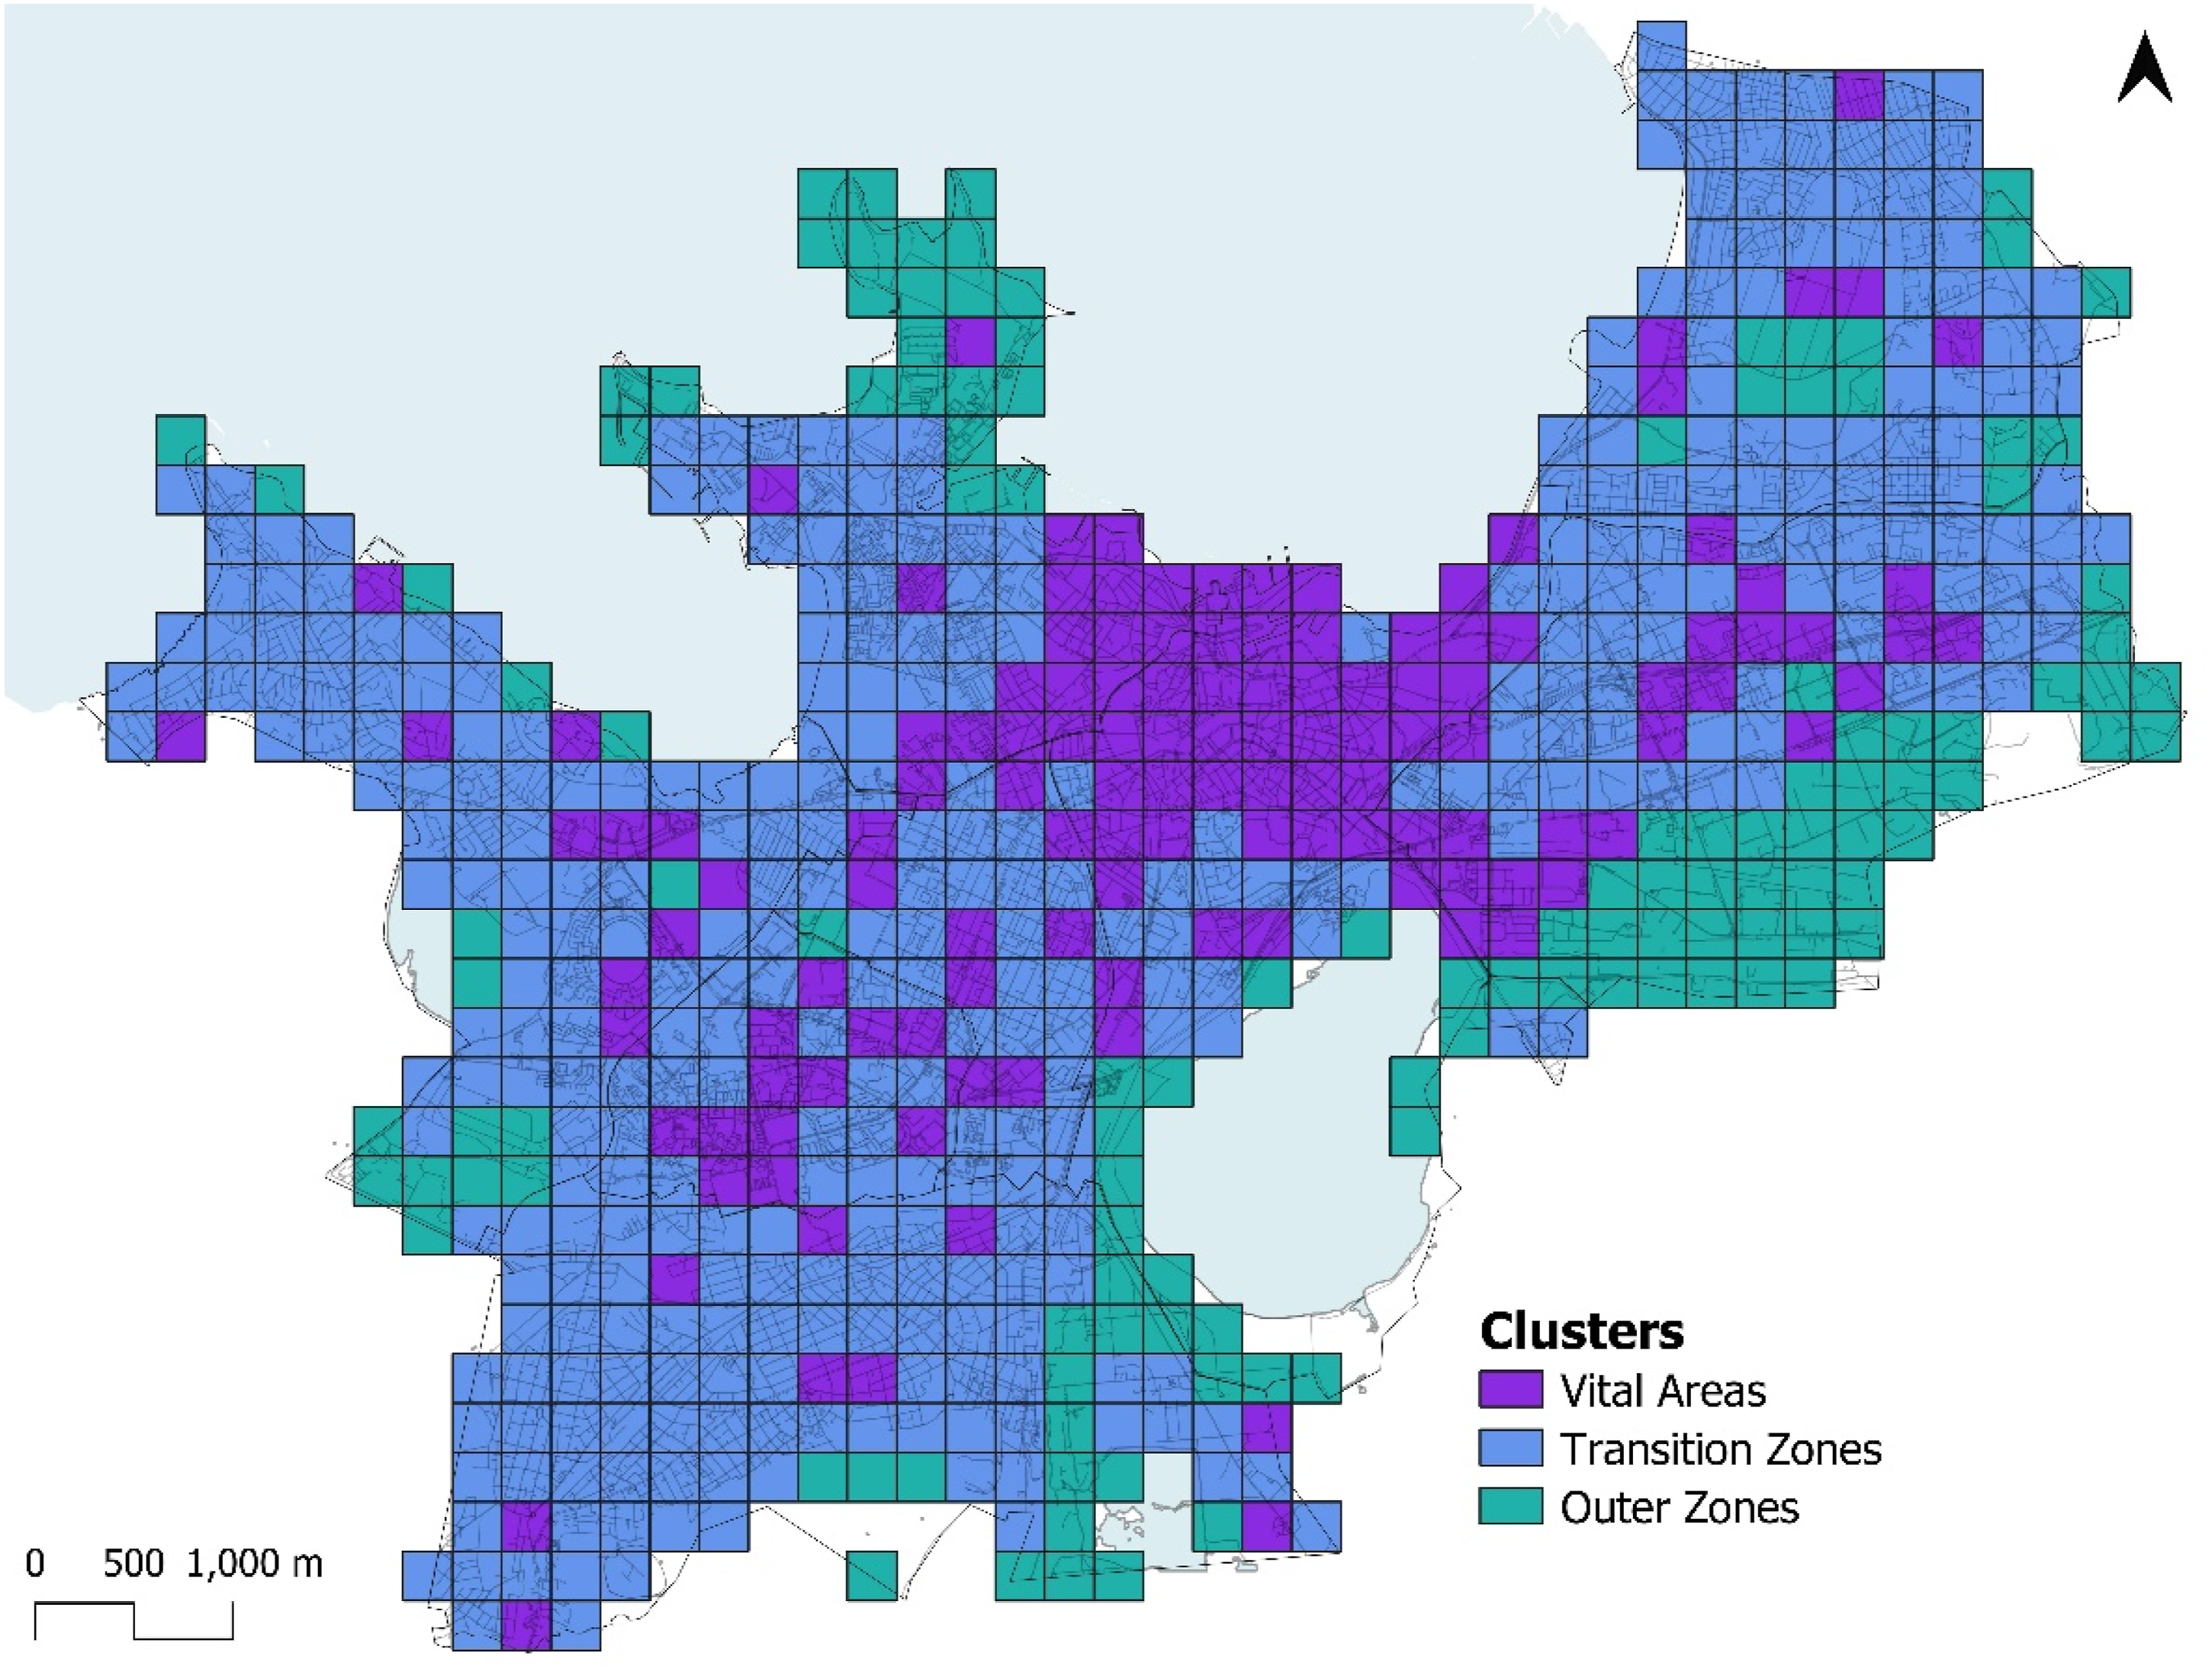
Discussion
The findings show that three interrelated forms of diversity shape UV in Tallinn: the built environment (building age, land-use mix, population density, and street intersection density), the residential population (age, gender, education, and language), and the dynamic population (Dvs) (as represented by tweet-based indicators of intensity, variability, consistency, and linguistic diversity). Each component offers a distinct perspective on how vitality is perceived across space and time. The integration of linguistic diversity further enriches this perspective by capturing cultural heterogeneity and enhancing the granularity of UV assessments.
The spatio-temporal distribution of urban vitality
The model emphasizes that while certain aspects of the built environment offer opportunities for interaction, the temporal dimensions of urban life are more effectively captured through dynamic data sources, like mobile big data, shown to be an effective lens for identifying urban spaces (Sulis et al., 2018), and this work demonstrates such interactions.
The spatial pattern of Tallinn shows a core-to-peripheral gradient of diversity, with high-diversity zones characterized by a dynamic population presence and diverse social groups concentrated in the central and inner urban areas, similar to findings in other studies (Chin et al., 2024). These zones are where density, access, and opportunity attract people from various backgrounds to live, work, and interact due to continuous social and economic activity. Moderate diversity areas exhibit sustained, though slightly reduced, activity during both work and leisure hours, supporting a variety of functions. Located in residential neighborhoods with periodic commuting flows and secondary commercial centers, low-diversity zones show fewer dynamic activities, consist of single-use spaces, and have limited public or commercial functions. This spatial pattern aligns with urban hierarchy theory, which indicates that population density and functional complexity are generally highest at the urban core and decrease outward (Bigotte et al., 2014).
The findings on the diversity of the built environment align with Jane Jacobs’ theory of land-use diversity, which emphasizes that vibrant urban centers thrive on a mix of functions and active street life (Jacobs, 1961). Similarly, contemporary urban research confirms that both physical and social diversity tend to decline with distance from the core (Fanelli et al., 2024). However, integrating dynamic population data adds a richer temporal dimension to this understanding. The city center not only hosts dense, multifunctional environments but also maintains sustained and fluctuating activity throughout the day, reflecting the rhythms of economic and social life. The “splintering” spatial structure of vitality we observed indicates that population dynamics are playing a part, but it can also signify the development of the city of Tallinn from a city with one clear center to a polycentric city (Arribas-Bel and Sanz-Gracia, 2014; Brezzi and Veneri, 2015).
The K-means clustering analysis also supports a concentric urban pattern, where Cluster 3 aligns with UV centers in the urban core, and Cluster 1 reveals homogeneous outer areas with limited diversity or interaction in suburban, low-density, or car-dependent areas. Cluster 2 highlights low-vitality zones in the periphery with lower activity variation and fewer triggers for engagement. This uneven distribution reinforces the notion that UV is not evenly distributed across space and time but is somewhat shaped by a combination of infrastructure, access, and spatial roles.
Different perspectives on urban vitality in Tallinn
The initial model, excluding linguistic diversity, identified the city center as the most vital zone, characterized by a balanced combination of high tweet intensity, consistency, and variability. These indicators mark Tallinn’s urban core not only as a multifunctional environment but also as a central hub of continuous economic and pedestrian activity, extending its influence on transit spaces such as the train station, the bus terminal, the airport, and commercial corridors.
By expanding the model to include linguistic diversity, we introduced a richer, population-centered perspective that provides information on the heterogeneity of dynamic population groups, capturing areas with high temporal presence despite lower built environment diversity. Zones with high tweet-based linguistic diversity but modest infrastructural density challenge the assumption that UV strictly correlates with centrality or form. This finding suggests that UV is not solely a function of spatial design but is also profoundly influenced by who occupies the space and when. What constitutes a “vital urban area” can vary depending on the individual or population group (Pienimäki et al., 2024).
Indeed, relying solely on presence or density data risks overemphasizing central locations, where the daily flow of people is naturally highest. Incorporating demographic characteristics, such as language, age, and education, helps decentralize the analysis, drawing attention to urban spaces that serve diverse community functions across time. Therefore, recognizing these population-specific dynamics is essential to designing inclusive urban environments and understanding the spatial significance of under-recognized nodes of activity (Müürisepp et al., 2025; Vertovec et al., 2024).
Moreover, the built environment perspective reinforces the idea that static form alone is insufficient to explain vitality. The extended model demonstrates that vital urban areas emerge through the interaction of demographic diversity and physical infrastructure. The urban core, while central for many, may not serve all equally. The idea of “whose vitality?” becomes central, highlighting that experiences of space differ by life stage, cultural background, and social position. For instance, a district vital to students may vary from one vital to families with children or older people (Neal et al., 2015; Ye, 2019).
Linguistic diversity in urban vitality
We find that linguistic diversity provides a relevant addition to assess UV. By comparing the two models, we observe that language use plays a considerable role in shaping the spatial distribution of vital urban areas. In Tallinn, like elsewhere, urban core zones with multilingual public information and services tend to promote an inclusive environment and active public spaces (Pienimäki et al., 2024).
The regression analysis shows that linguistic diversity is also a significant indicator of UV. Language is a key factor in individual and group identities (Tabouret-Keller, 2017), and using information on languages can give indications about which population groups are represented, but can also be used when big data does not provide actual identities of users (Heikinheimo et al., 2022).
Likewise, high linguistic diversity can indicate spaces of intercultural encounters and attract a broader population (Perlin et al., 2021). Understanding which demographic groups utilize urban areas and the spatiotemporal patterns of such use is crucial information for urban planning, fostering UV, and understanding segregation patterns (Kang et al., 2021; Liao et al., 2025). The proposed approach represents an improvement over previous vitality studies, as it encompasses two key elements: the sustained presence of people in spaces and the diversity of these individuals, including residents, workers, and non-residents. We consider this to be a novelty in the research. However, high linguistic diversity can also indicate regions where diverse population groups are co-present but that are not attractive or vibrant when measured with other approaches. This illustrates the importance of using more holistic approaches when using linguistic diversity as a variable.
Limitations
Mobile big data can be massive in size, but it also carries several inherent limitations (Toivonen et al., 2019), which also apply to this work. First, there is bias in geo-referenced social media content as the data may disproportionately reflect specific demographics (e.g., younger, tech-savvy individuals) and exclude others (e.g., older adults and lower-income groups) due to the digital divide (Dutton and Reisdorf, 2019), lowering the representativeness of the data. However, combining such data with more reliable sources, such as population registries or census data, can give the analyses firmer ground to stand on, as outliers and biases can be more easily identified. Secondly, social factors such as the use of minority languages, historical background, or limited use of specific social media platforms can impact how well the cultural presence is reflected in the data (Hargittai, 2020; Leppämäki et al., 2025).
Conclusion
In this study, we demonstrated that urban vitality is shaped not only by physical infrastructure and population density but also by temporal activity patterns and socio-cultural heterogeneity. We found that UV in Tallinn follows a clear spatio-temporal gradient, with the most vital and active areas concentrated in the urban core and inner districts progressively declining as one moves towards the urban periphery. We identified different clusters of UV, revealing different activity profiles across the city. This analysis highlighted the role of information in shaping population diversity through linguistic diversity, serving as a unique indicator of UV. Overall, the extended model demonstrates that a comprehensive understanding of UV must move beyond infrastructure and population counts to include temporal dynamics and demographic plurality.
Supplemental Material
Supplemental Material - Mapping urban vitality through dynamic population presence: A social media-based analysis in Tallinn
Supplemental Material for Mapping urban vitality through dynamic population presence: A social media-based analysis in Tallinn by Kofoworola Modupe Osunkoya, Tuomas Väisänen, Jenni Partanen, and Olle Järv in Environment and Planning B: Urban Analytics and City Science
Footnotes
Acknowledgments
The authors would like to thank the Digital Geography Lab, University of Helsinki, for preparing and processing the raw Twitter data for the study, and the Research Council of Finland (Flagship of Advanced Mathematics for Sensing Imaging and Modelling, FAME, grant number 359182) for supporting this article.
Author contributions
Conceptualization and methodology: Kofoworola Modupe Osunkoya, Tuomas Väisänen, and Olle Järv; formal analysis: Kofoworola Modupe Osunkoya and Tuomas Väisänen; writing—original draft preparation and visualization: Kofoworola Modupe Osunkoya; writing—review and editing: Tuomas Väisänen, Jenni Partanen, and Olle Järv.
Funding
The Future City Professorship project partners (including Mainor OÜ, Mainor Ülemiste, Telia Eesti, Ericsson Eesti, TalTech, and the City of Tallinn) funded the project. This work was also funded by the Academy of Finland (BORDERSPACE: Mobilities and Interactions of People Crossing State Borders: Big Data to Reveal Transnational People and Spaces, grant number 331549).
Declaration of conflicting interests
The authors declared no potential conflicts of interest with respect to the research, authorship, and/or publication of this article.
Data Availability Statement
Most of the data used in the article are open-source and freely available from OpenStreetMap and the City of Tallinn web portals. However, the data from Statistics Estonia is a data product that can only be accessed by requesting it directly from Statistics Estonia. The original Twitter data cannot be published openly due to privacy concerns, but it can be provided upon request.
Supplemental material
Supplemental material for this article is available online.
Author biographies
References
Supplementary Material
Please find the following supplemental material available below.
For Open Access articles published under a Creative Commons License, all supplemental material carries the same license as the article it is associated with.
For non-Open Access articles published, all supplemental material carries a non-exclusive license, and permission requests for re-use of supplemental material or any part of supplemental material shall be sent directly to the copyright owner as specified in the copyright notice associated with the article.