
Abstract
The effective and ethical use of data to inform decision-making offers huge value to the public sector, especially when delivered by transparent, reproducible, and robust data processing workflows. One way that governments are unlocking this value is through making their data publicly available, allowing more people and organisations to derive insights. However, open data is not enough in many cases: publicly available datasets need to be accessible in an analysis-ready form from popular data science tools, such as R and Python, for them to realise their full potential. This paper explores ways to maximise the impact of open data with reference to a case study of packaging code to facilitate reproducible analysis. We present the
Introduction
Recent years have seen an increasing volume of data being collected and generated, in a phenomenon that has been labelled a ‘data revolution’ (Kitchin, 2014). Our interactions with socio-technological systems create a vast amount of data on our behaviour, actions, society, and other aspects of our lives (Bannister and Botta, 2021; Botta and Gutiérrez-Roig, 2021; Conte et al., 2012; Lazer et al., 2009; Vespignani, 2009). Governments, statistical agencies, international organisations, and non-profit entities also collect, produce and release large volumes of data on the state of society, nations, economies, and a whole suite of useful indicators. To analyse these data sets and deliver the maximum amount of insight from them increasingly requires knowledge of data science techniques, such as predictive modelling, geographic data analysis and machine learning (Bengfort et al., 2018; Kuhn and Johnson, 2013; Lovelace et al., 2019b).
However, merely making datasets open access is not enough to unlock their potential value. Open access is a necessary but not sufficient condition to ensuring that the value invested in datasets is returned to society. Datasets need to be shared in formats that are easy to work with in the popular analytical tools used in data science, documented, and packaged in ‘analysis-ready’ formats to meet their potential. We loosely define ‘analysis-ready’ formats those data formats that enable the application of analytical tools in the corresponding programming language, such as
The wider point is that datasets on one topic (journey times in this case) may be relevant to research outside that topic. Additionally, lowering entry barriers to data sets to allow researchers to more easily explore what information is in the data can enable a wide range of people to explore the data, providing more opportunities for usage of the data.
Here, we use an England-based data set that is regularly released by the UK Department for Transport (DfT) as an example of how publicly available data can be coupled with publicly available code to maximise value – including to the public sector bodies who may be most interested in using it. It is important to note that there is nothing special about these data or this example – it merely serves to demonstrate a point, and we could have chosen any number of other examples of data released by other public sector bodies. Here, though, our case study is data released by DfT on journey time statistics (Department for Transport, 2019). To show the additional insights that can be gained when data are more accessible in a format that allows easy data linkage, we show a visual comparison of journey time statistics to data on relative deprivation, and so provide a way of assessing the accessibility of places and services with socio-economic information of the population. We emphasise that it is the combination of code, data and geometries with a clear linking method which allows for such analyses to be performed, rather than any individual part. Data on relative deprivation is retrieved directly from the UK Department for Levelling Up, Housing and Communities website (Department for Levelling Up, Housing & Communities, 2019). We also emphasise that we use data on deprivation levels as an interesting example of how packaging code and data can allow for easy and efficient data linkage. Whilst there are a number of questions which could be studied in the intersection between accessibility of services and deprivation of different areas, here this is only an example and we could have chosen other openly available data sets instead.
In our particular case study of journey time statistics, the data are crucial for understanding a broad range of questions in both academic research and policy. For example, the interplay between travel times and socio-economic inequalities is particularly acute in some types of area where inequalities may be exacerbated by poor access to education or services. Therefore, the availability and accessibility of data (and tools) to study these issues is crucial for improving our cities and rural areas. The open source software presented here aims to provide simple tools to perform this analysis and to make these valuable data more easily accessible for research. Starting from a relatively complex data structure, we provide open tools that allow most data scientists to work with these data using standard data science pipelines.
The data sets that we attempt to make more accessible in this paper, and the open source software that facilitates this within a reproducible research pipeline, are relevant to a wide range of academic research and policy questions. Variable travel times underlie many social phenomena, ranging from spatial variability in energy use (Breheny, 1995) to inequalities in educational opportunities (Moreno-Monroy et al., 2018). An easier and wider availability of data on travel times and accessibility of destinations can allow urban geographers and data scientists to study the interplay between more compact cities and pollution, inequalities and segregation. This makes open data on journey times valuable, particularly when provided at high spatial resolution, and when provided with reference to a wide range of transport modes and purposes. We envisage our work to support this, and many other, applications.
A further added value of making data sets openly available is that they can be combined and enriched by other existing open data sets. To demonstrate this, the main version of the package presented here, developed in Python, is also able to retrieve data on relative deprivation level directly from the government website. The English Indices of Multiple Deprivation (IMD) is published on the Department for Levelling Up, Housing and Communities’ (formerly the Ministry of Housing, Communities & Local Government) website and provides a measure of relative deprivation of areas in England across seven different domains: Income; Employment; Education; Health; Crime; Barriers to housing & services; and Living environment.
Data – journey time statistics (JTS)
This data set is released by DfT and contains statistics on modelled journeys to key services in England, such as employment centres, schools and hospitals. The data is broadly divided into three key statistics: average minimum journey time, which is the shortest travel time to a specific service by mode of transport (car, walking, cycling, or public transport); origin indicators, measuring the number of different services in an area that can be reached in a given time (such as 30 min); and destination indicators, measuring the proportion of users that can access a service in a given time. The data is provided at different levels of spatial aggregation, from Lower Layer Super Output Areas (LSOA) to national, regional, and local authority level.
It is important to highlight that the JTS data does not represent actual journeys, but rather idealised trips generated by DfT using commercial software. In particular, the journeys are modelled based on the average journey completed on a Tuesday in the second week of October of the corresponding year during the morning peak travel time between 7am and 10am. More information on the JTS data and how the journeys are calculated and aggregated can be found on the DfT website (Department for Transport, 2019).
The data are released by DfT in the Open Document Format, more specifically Open Document Spreadsheet, which is an open file format for sharing documents, texts, and spreadsheets. However, the complex nature of this data set with a large number of files and tables, formatting issues such as the inconsistent presence of footnotes and superscripts and large number of observations, make it difficult for data scientists to quickly explore the data and efficiently perform any analysis; additionally, whilst the Open Document Spreadsheet format could be directly read into both R and Python, the size and number of the files, coupled with the inefficiency of the format, mean that this is a very slow and memory-intensive process, which we found too resource intensive on a regular laptop. We believe that this inefficiency can act as a barrier to all interested researchers, broadly intended, who want to explore the data set to better understand what information is included in it. Having a lower entry barrier with a much more efficient way of exploring the data enables a broader range of people to experiment with the data, thus maximising the potential impact of the data set itself. The open software that we released alongside this paper first converts the files to the simpler .
Code
The open source software presented in this paper can be integrated into a reproducible research pipeline that can then be used by academics and policymakers alike. The main version of this package has been developed in Python, with the R version replicating some of the key functionalities, reflecting the increasing popularity of Python as the main programming language in data science pipelines. The software, both in its main Python version as well as that in R, is built in a simple, modular structure to allow ease of use as well as to enable data scientists to easily add features over time.
Both implementations of the software rely on a version of the JTS data which has been converted from the original . Code and data workflow | Packaging code and data to enable easy access to and analysis of government data is becoming increasingly important to maximise the value to public sector bodies of making their data openly available. Here, we use data on journey time statistics (JTS) from the department for transport (DfT) as a case study. The data is generated by DfT and released publicly in open document spreadsheet format (green box at top). We then convert the data to a more user friendly csv format and use that as the basis of our R and Python packages (red box at bottom).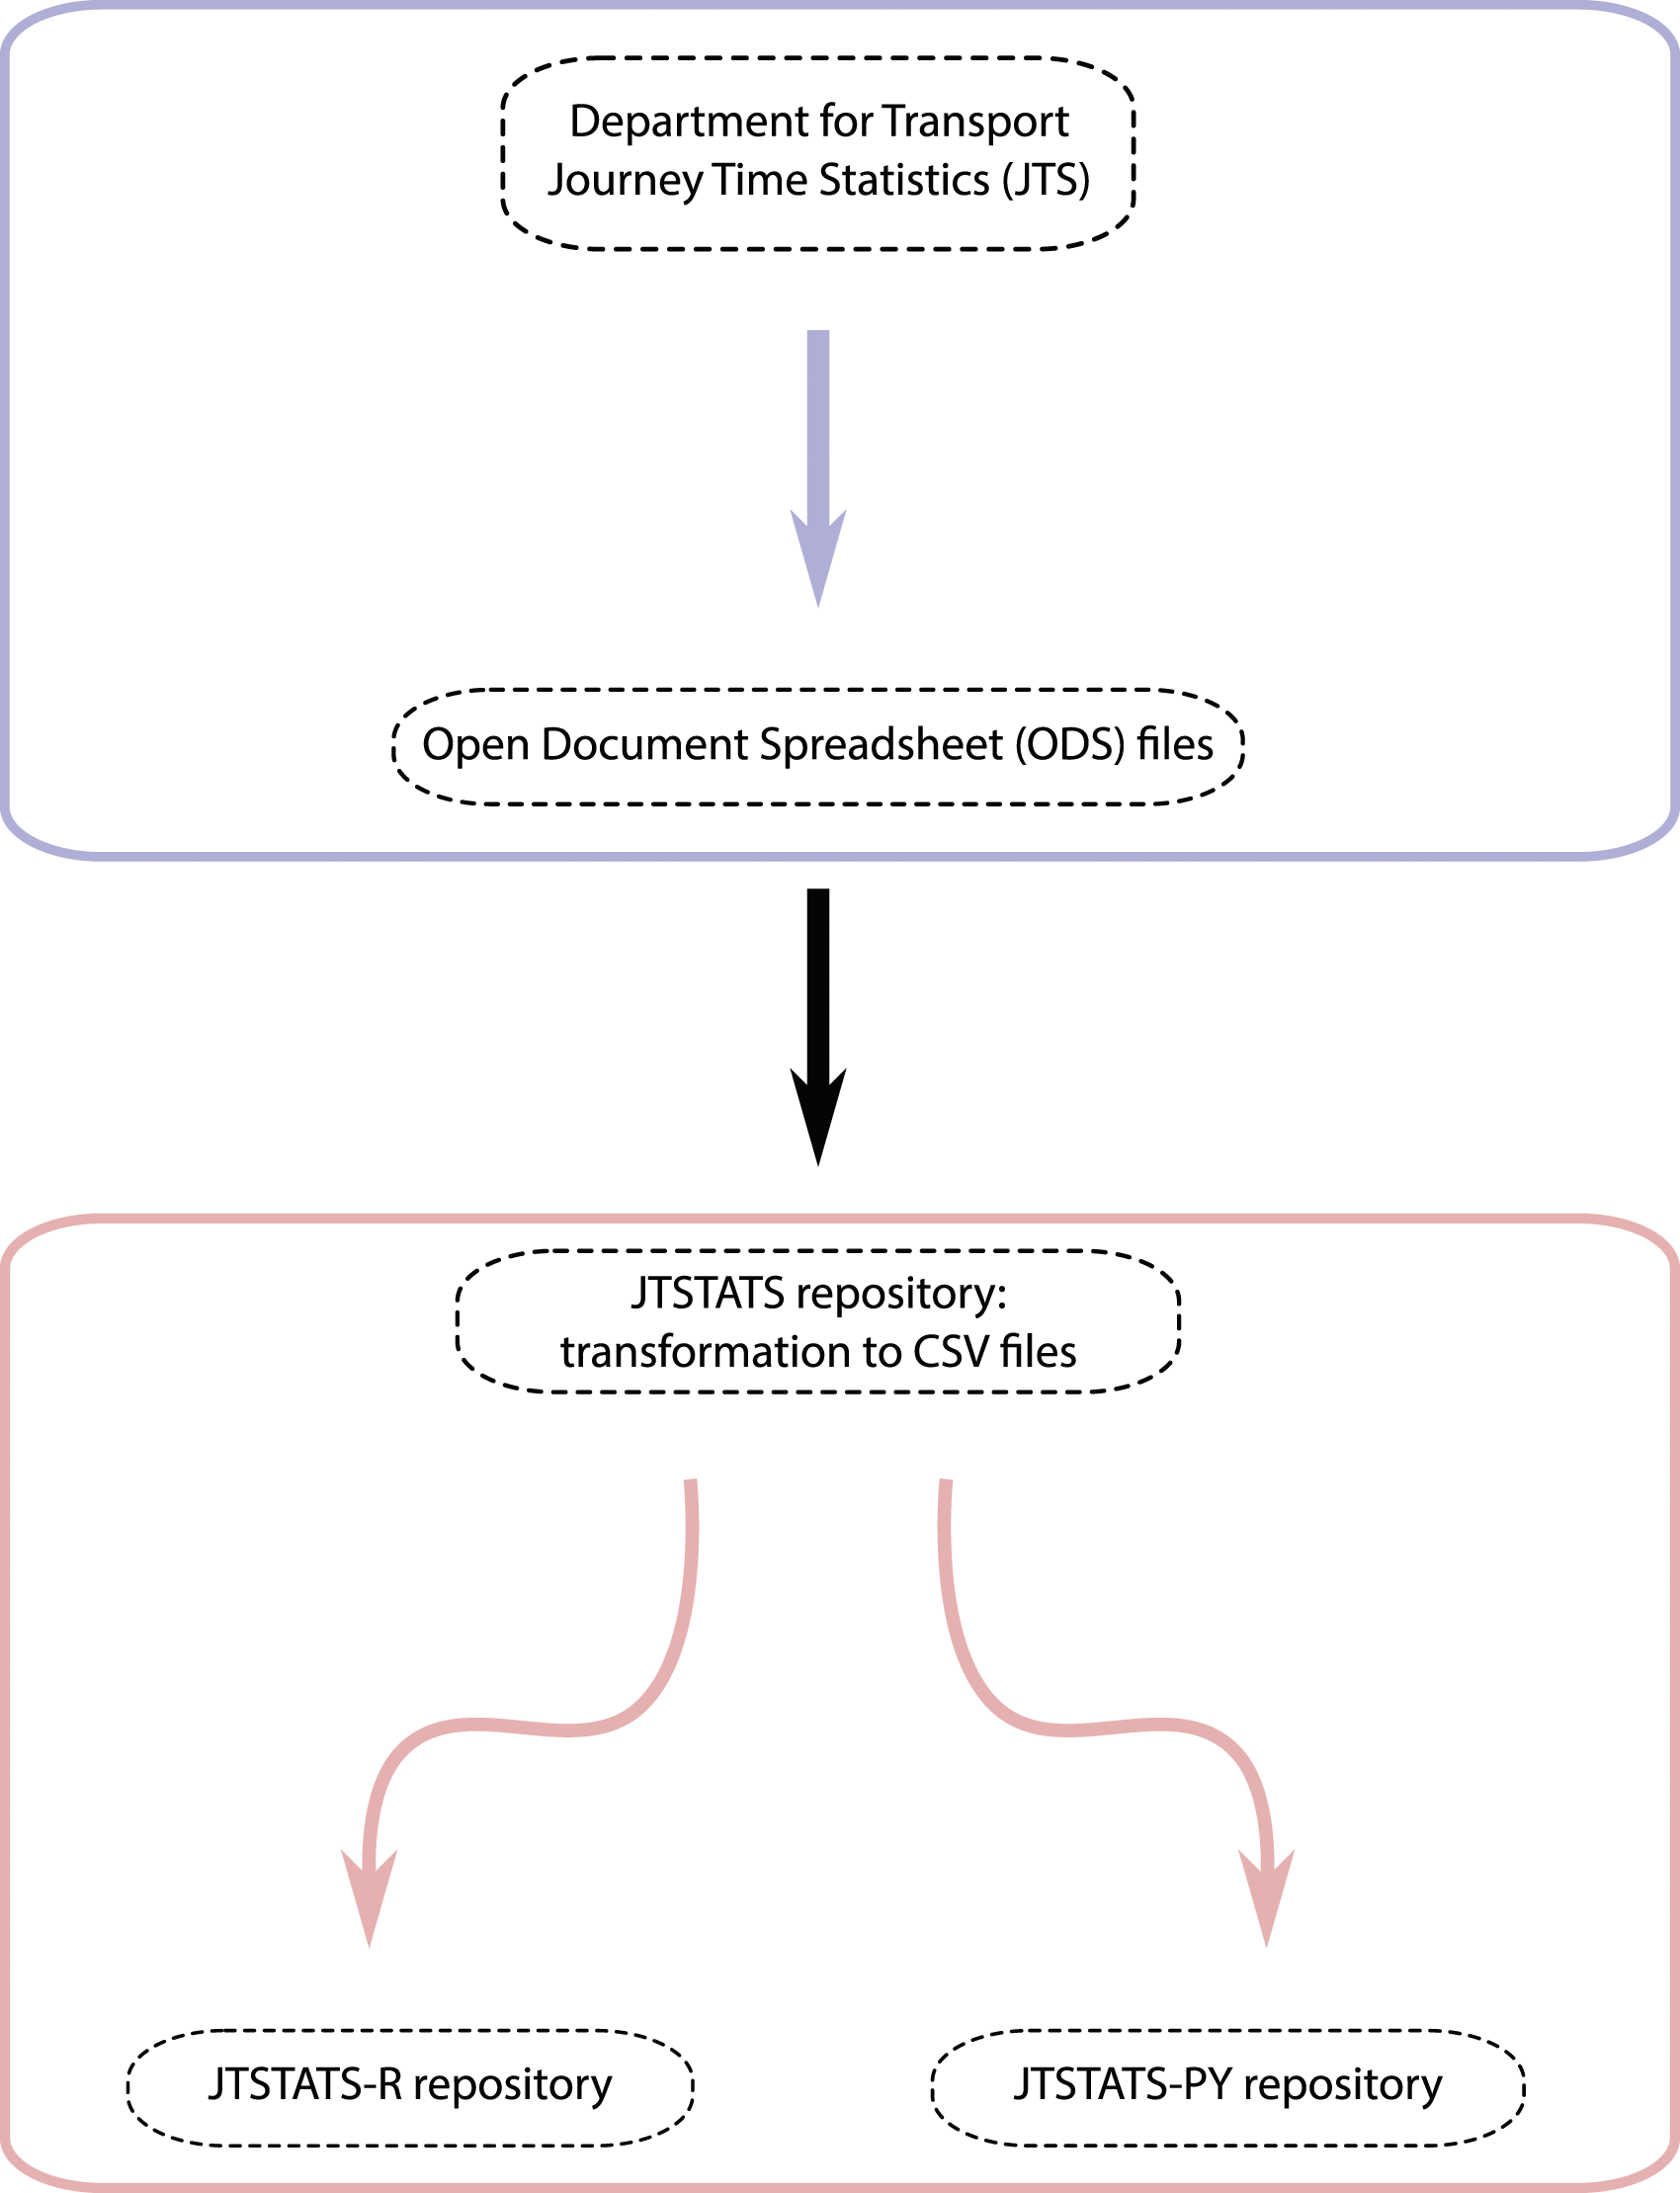
Python
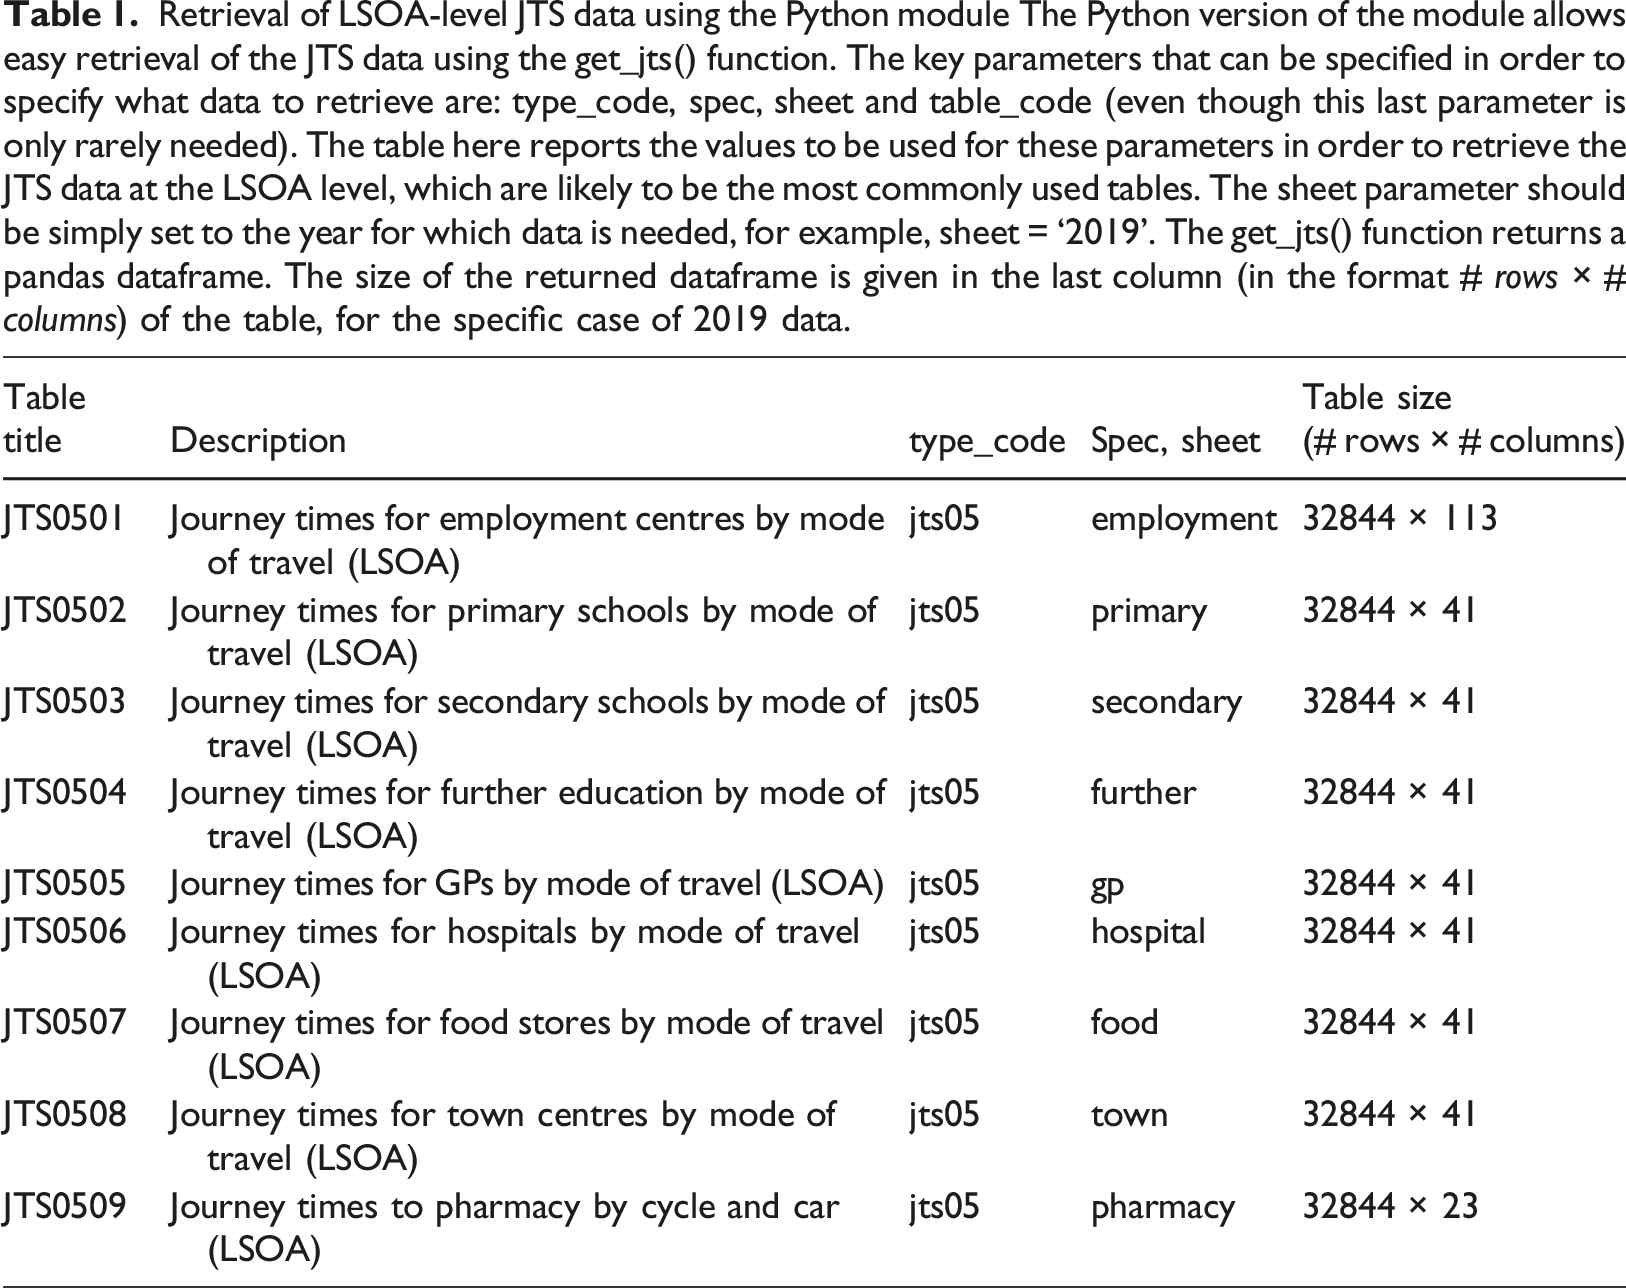
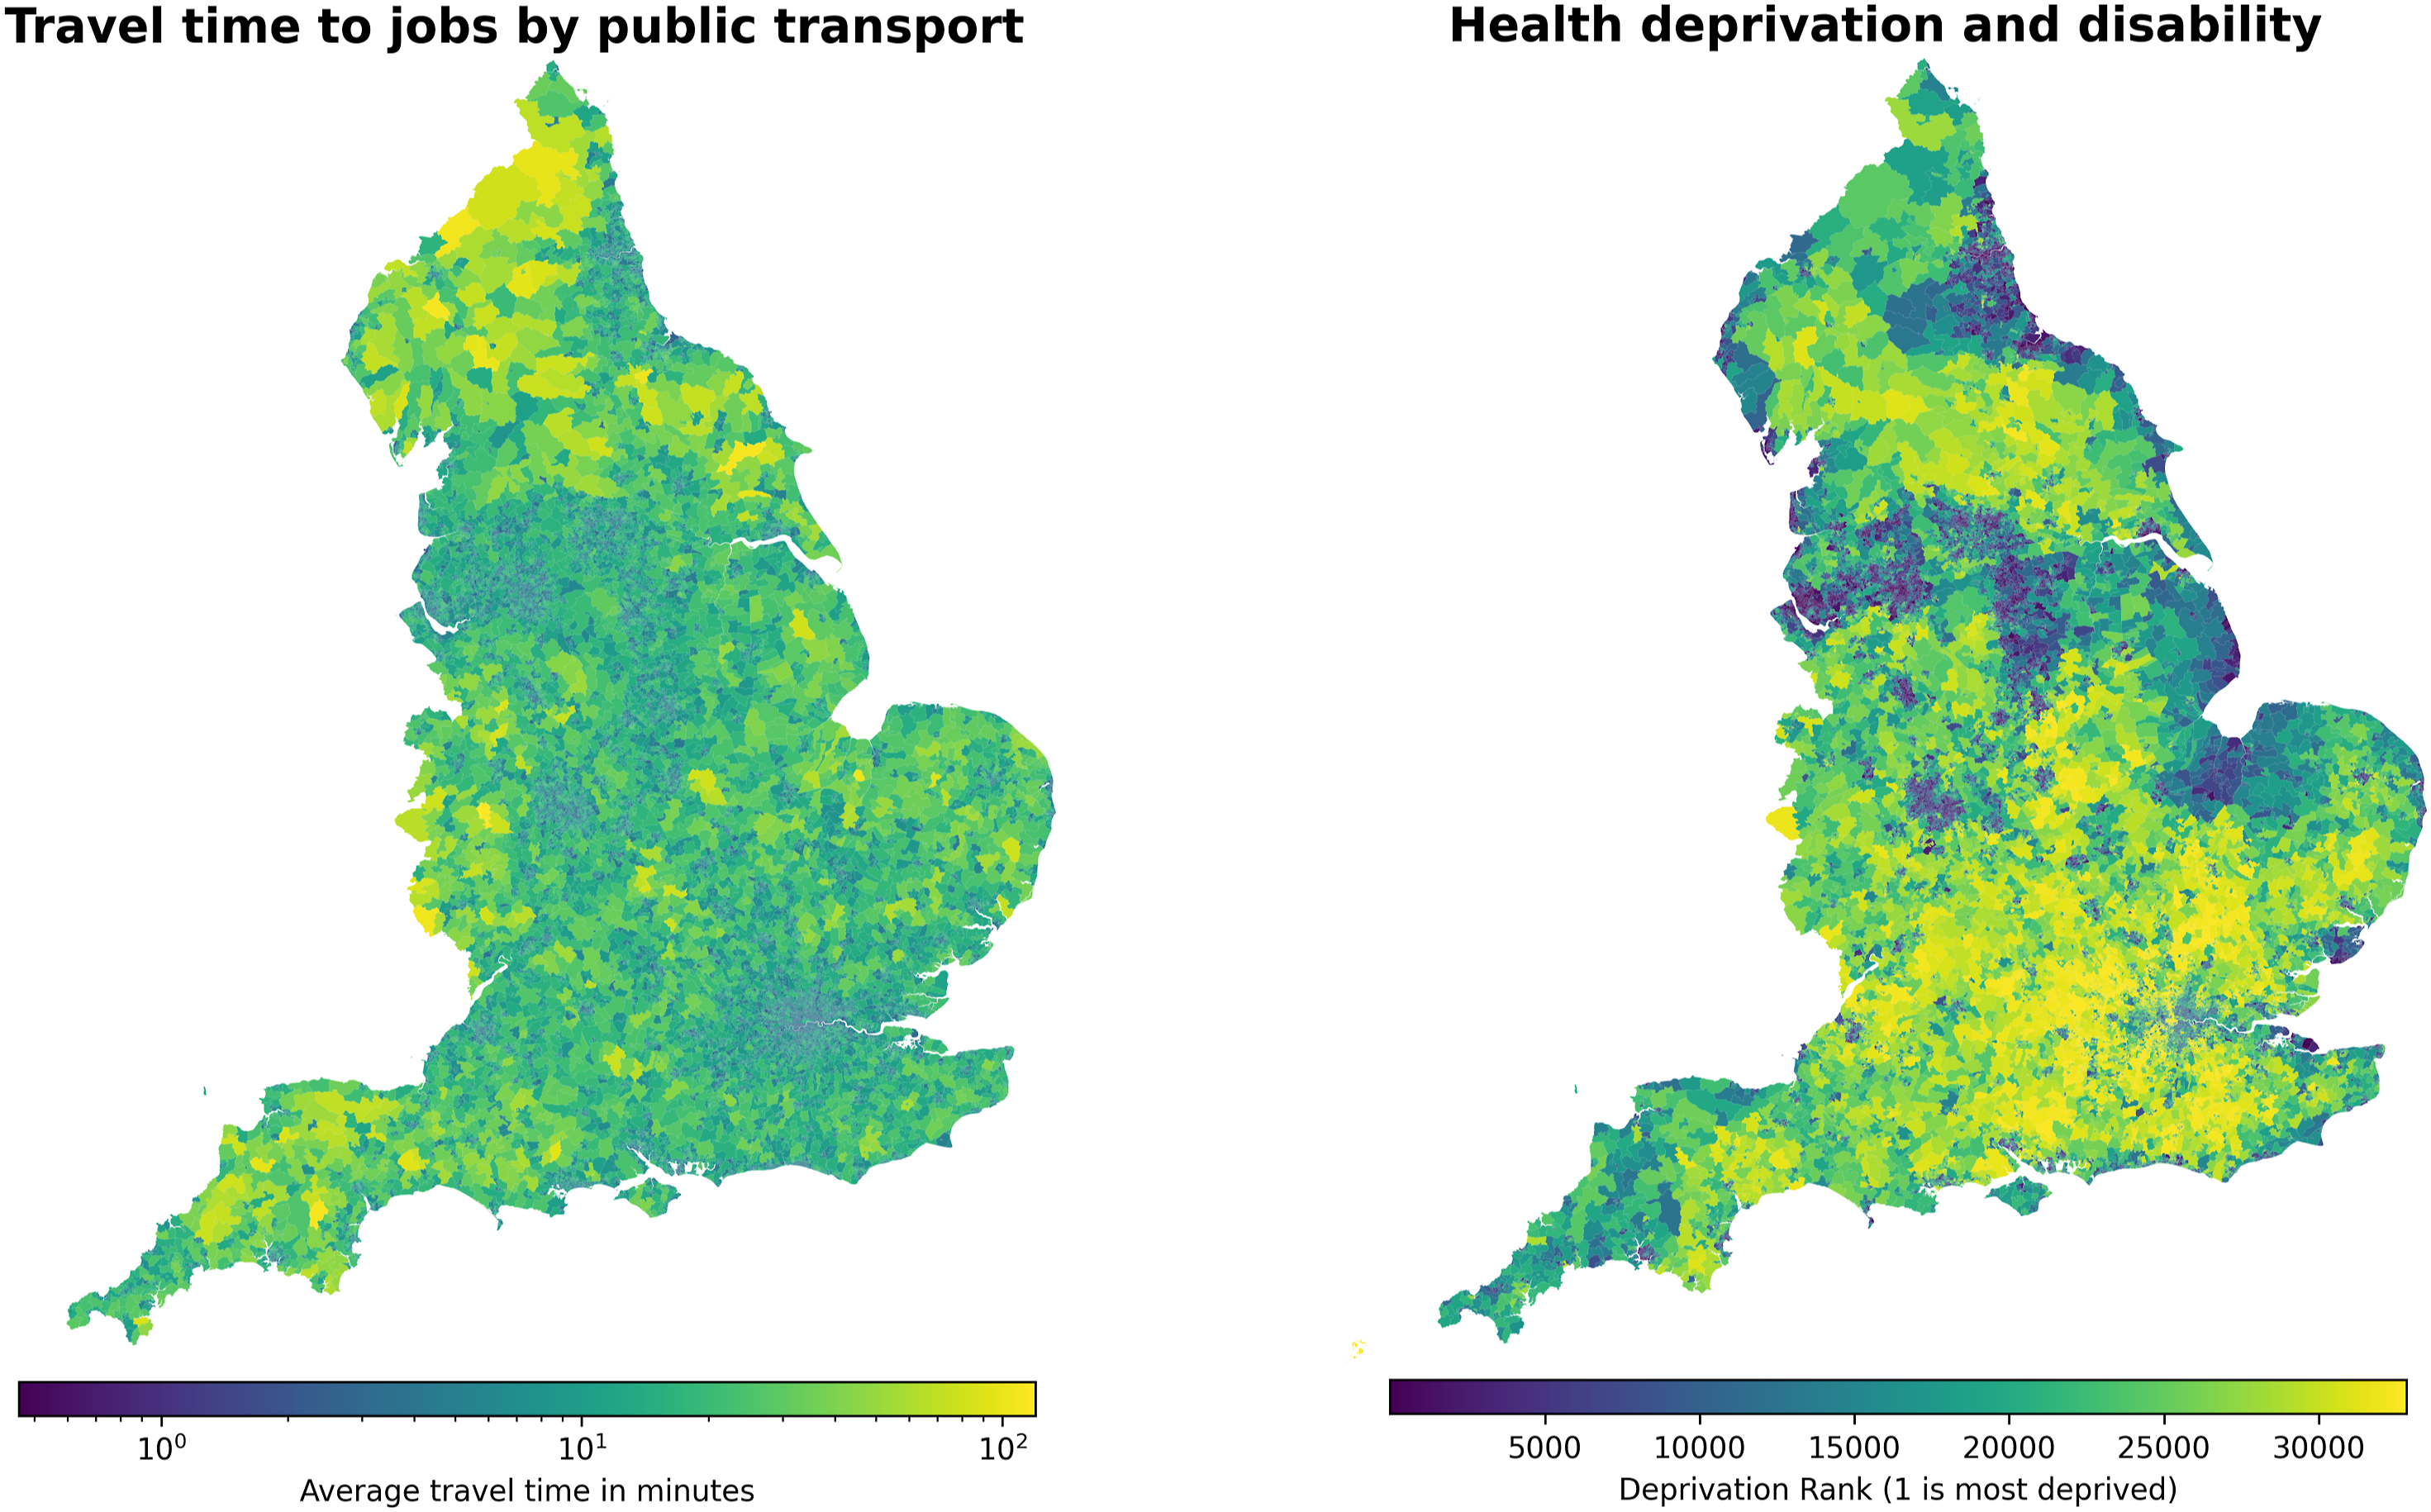
The Python implementation of this package has been developed in a Poetry environment running Python 3.9.1 and consists of four main parts: • • • • Retrieval of LSOA-level JTS data using the Python module The Python version of the module allows easy retrieval of the JTS data using the get_jts() function. The key parameters that can be specified in order to specify what data to retrieve are: type_code, spec, sheet and table_code (even though this last parameter is only rarely needed). The table here reports the values to be used for these parameters in order to retrieve the JTS data at the LSOA level, which are likely to be the most commonly used tables. The sheet parameter should be simply set to the year for which data is needed, for example, sheet = ‘2019’. The get_jts() function returns a pandas dataframe. The size of the returned dataframe is given in the last column (in the format # rows × # columns) of the table, for the specific case of 2019 data. Journey time statistics and deprivation data we demonstrate the potential use of our package by depicting two variables from the data sets made easily available for analysis within our code. (left) Here, we depict the travel time to employment centres with 100 to 499 jobs by public transport as made available by the journey time statistics data set published by the department for transport. Travel time is capped to a maximum of 120 min. (right) We also present data on relative deprivation. In particular, we show here deprivation ranks related to health and disability, as published by the Ministry of Housing, communities local government in 2019.
A brief tutorial script is also provided on the GitHub page to demonstrate basic functionalities and usage of this package (https://github.com/datasciencecampus/jtstats-py).
Thanks to its modular structure, retrieving different data sets, or different variables within a data set, can be easily done within this software. For instance, the data needed for Figure 2 can be retrieved by simply calling Travel time to food stores by mode of transport | Our package enables easy access to the data by returning a nicely formatted data frame which can be used for analysis. Here, we depict an example of the data which can be retrieved with our package: travel time to food stores over the years, disaggregated by mode of transport.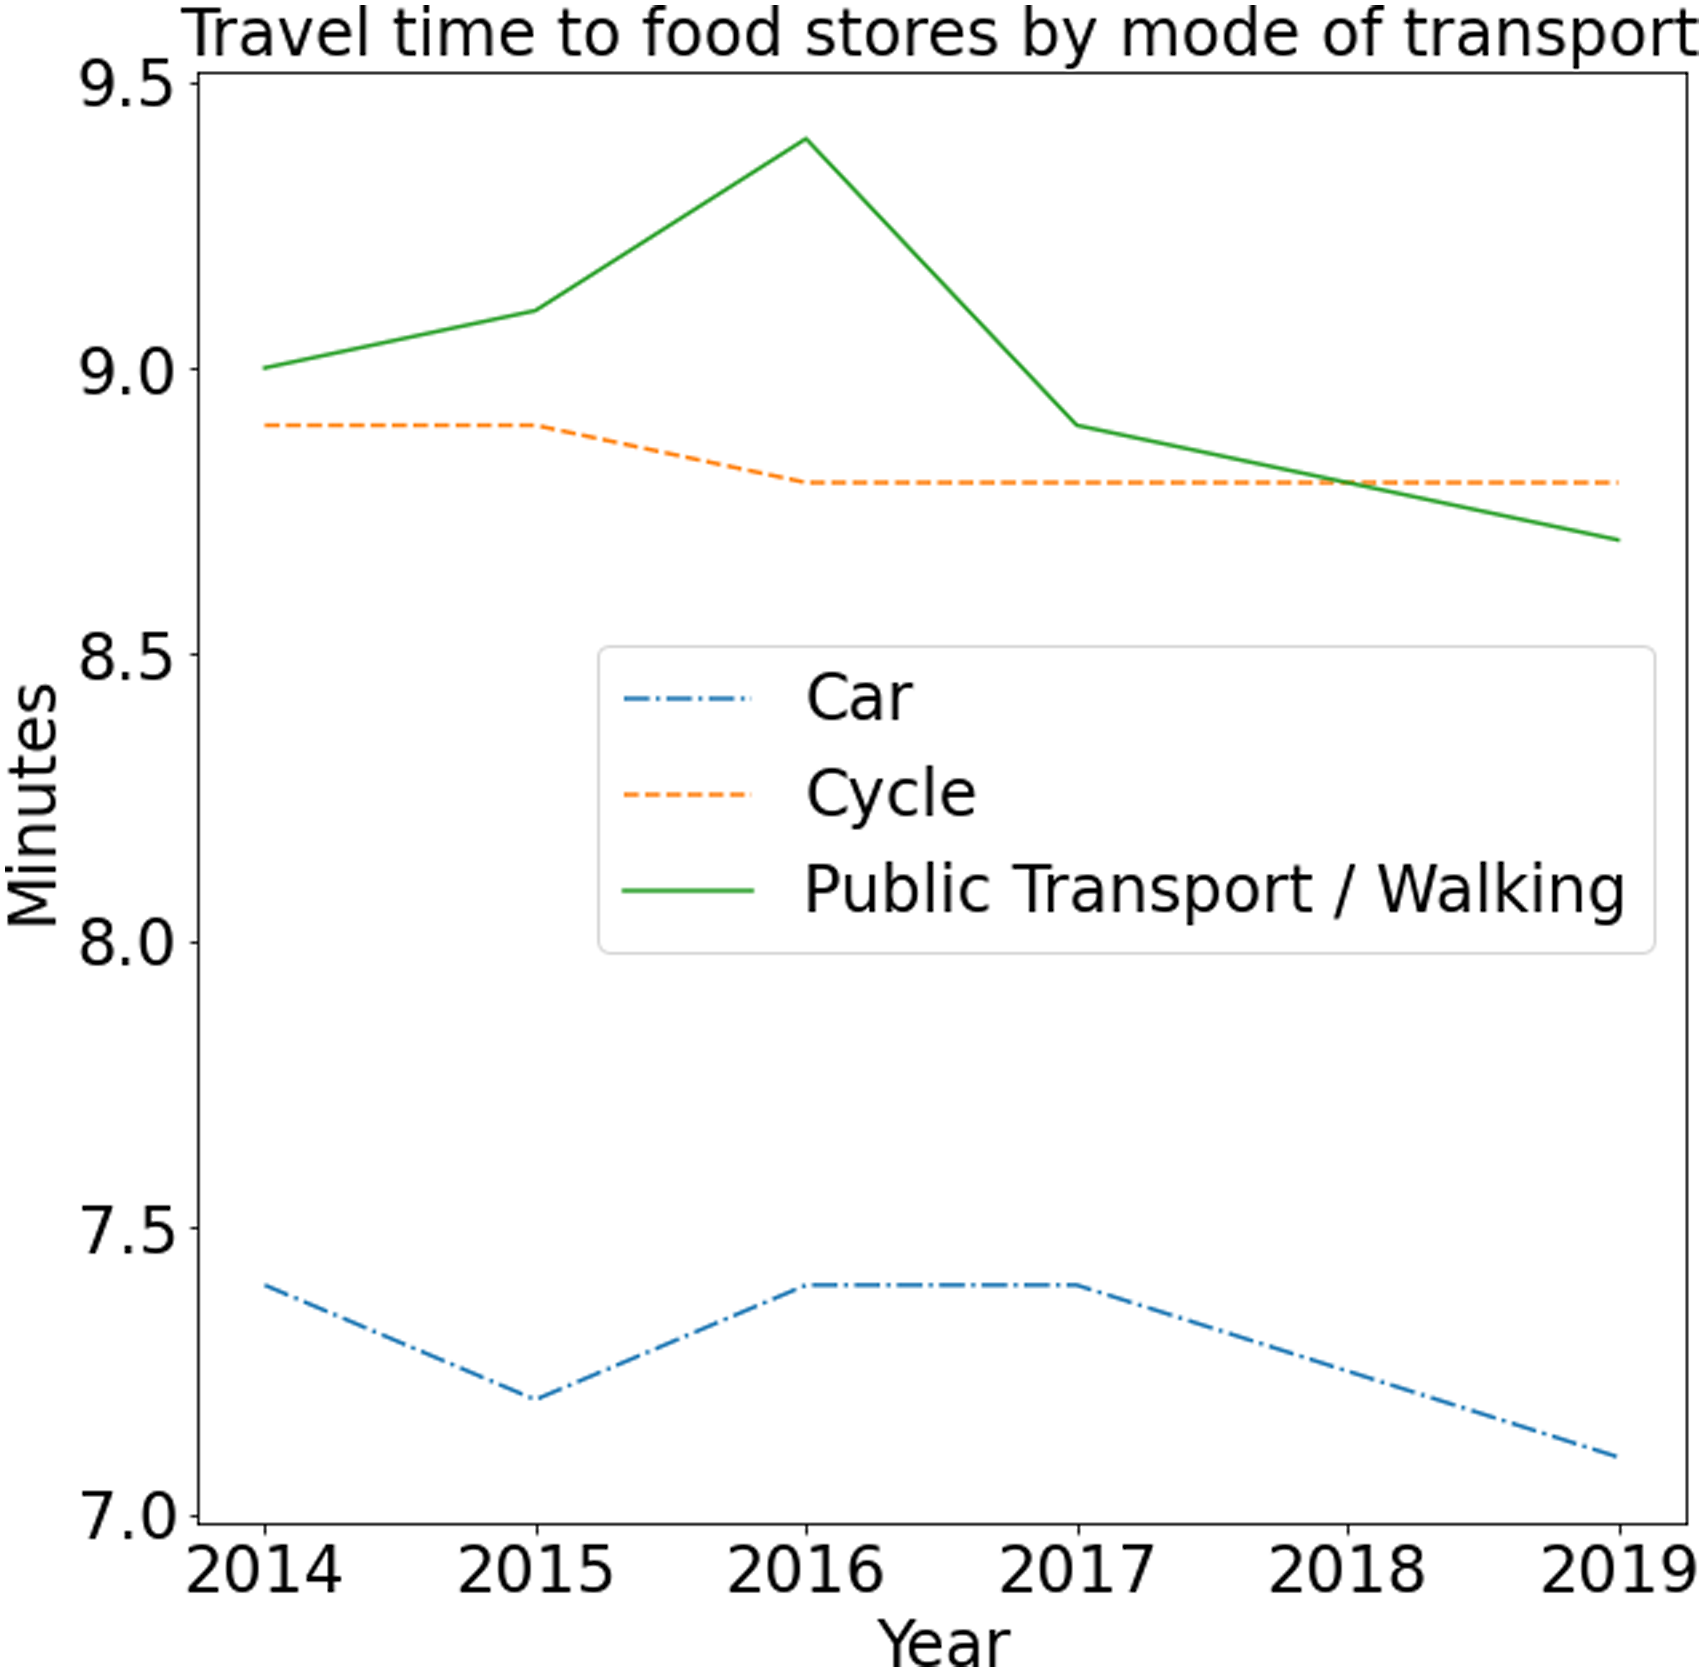
To support further future development of the package, we also implemented, and provided alongside the package, a series of tests written using
A final note to mention regards missing values in some of the JTS tables. In particular, the JTS09 tables contains entries of the form ‘..’, which have been replaced with missing values in the package (as NumPy
R
The R version of the package replicates some of the key functionalities of the Python version presented above.
After the package has been installed and loaded, you can start using it to get any of the 192 tables available from the JTS project. You can get the table JTS0101 with the following command:
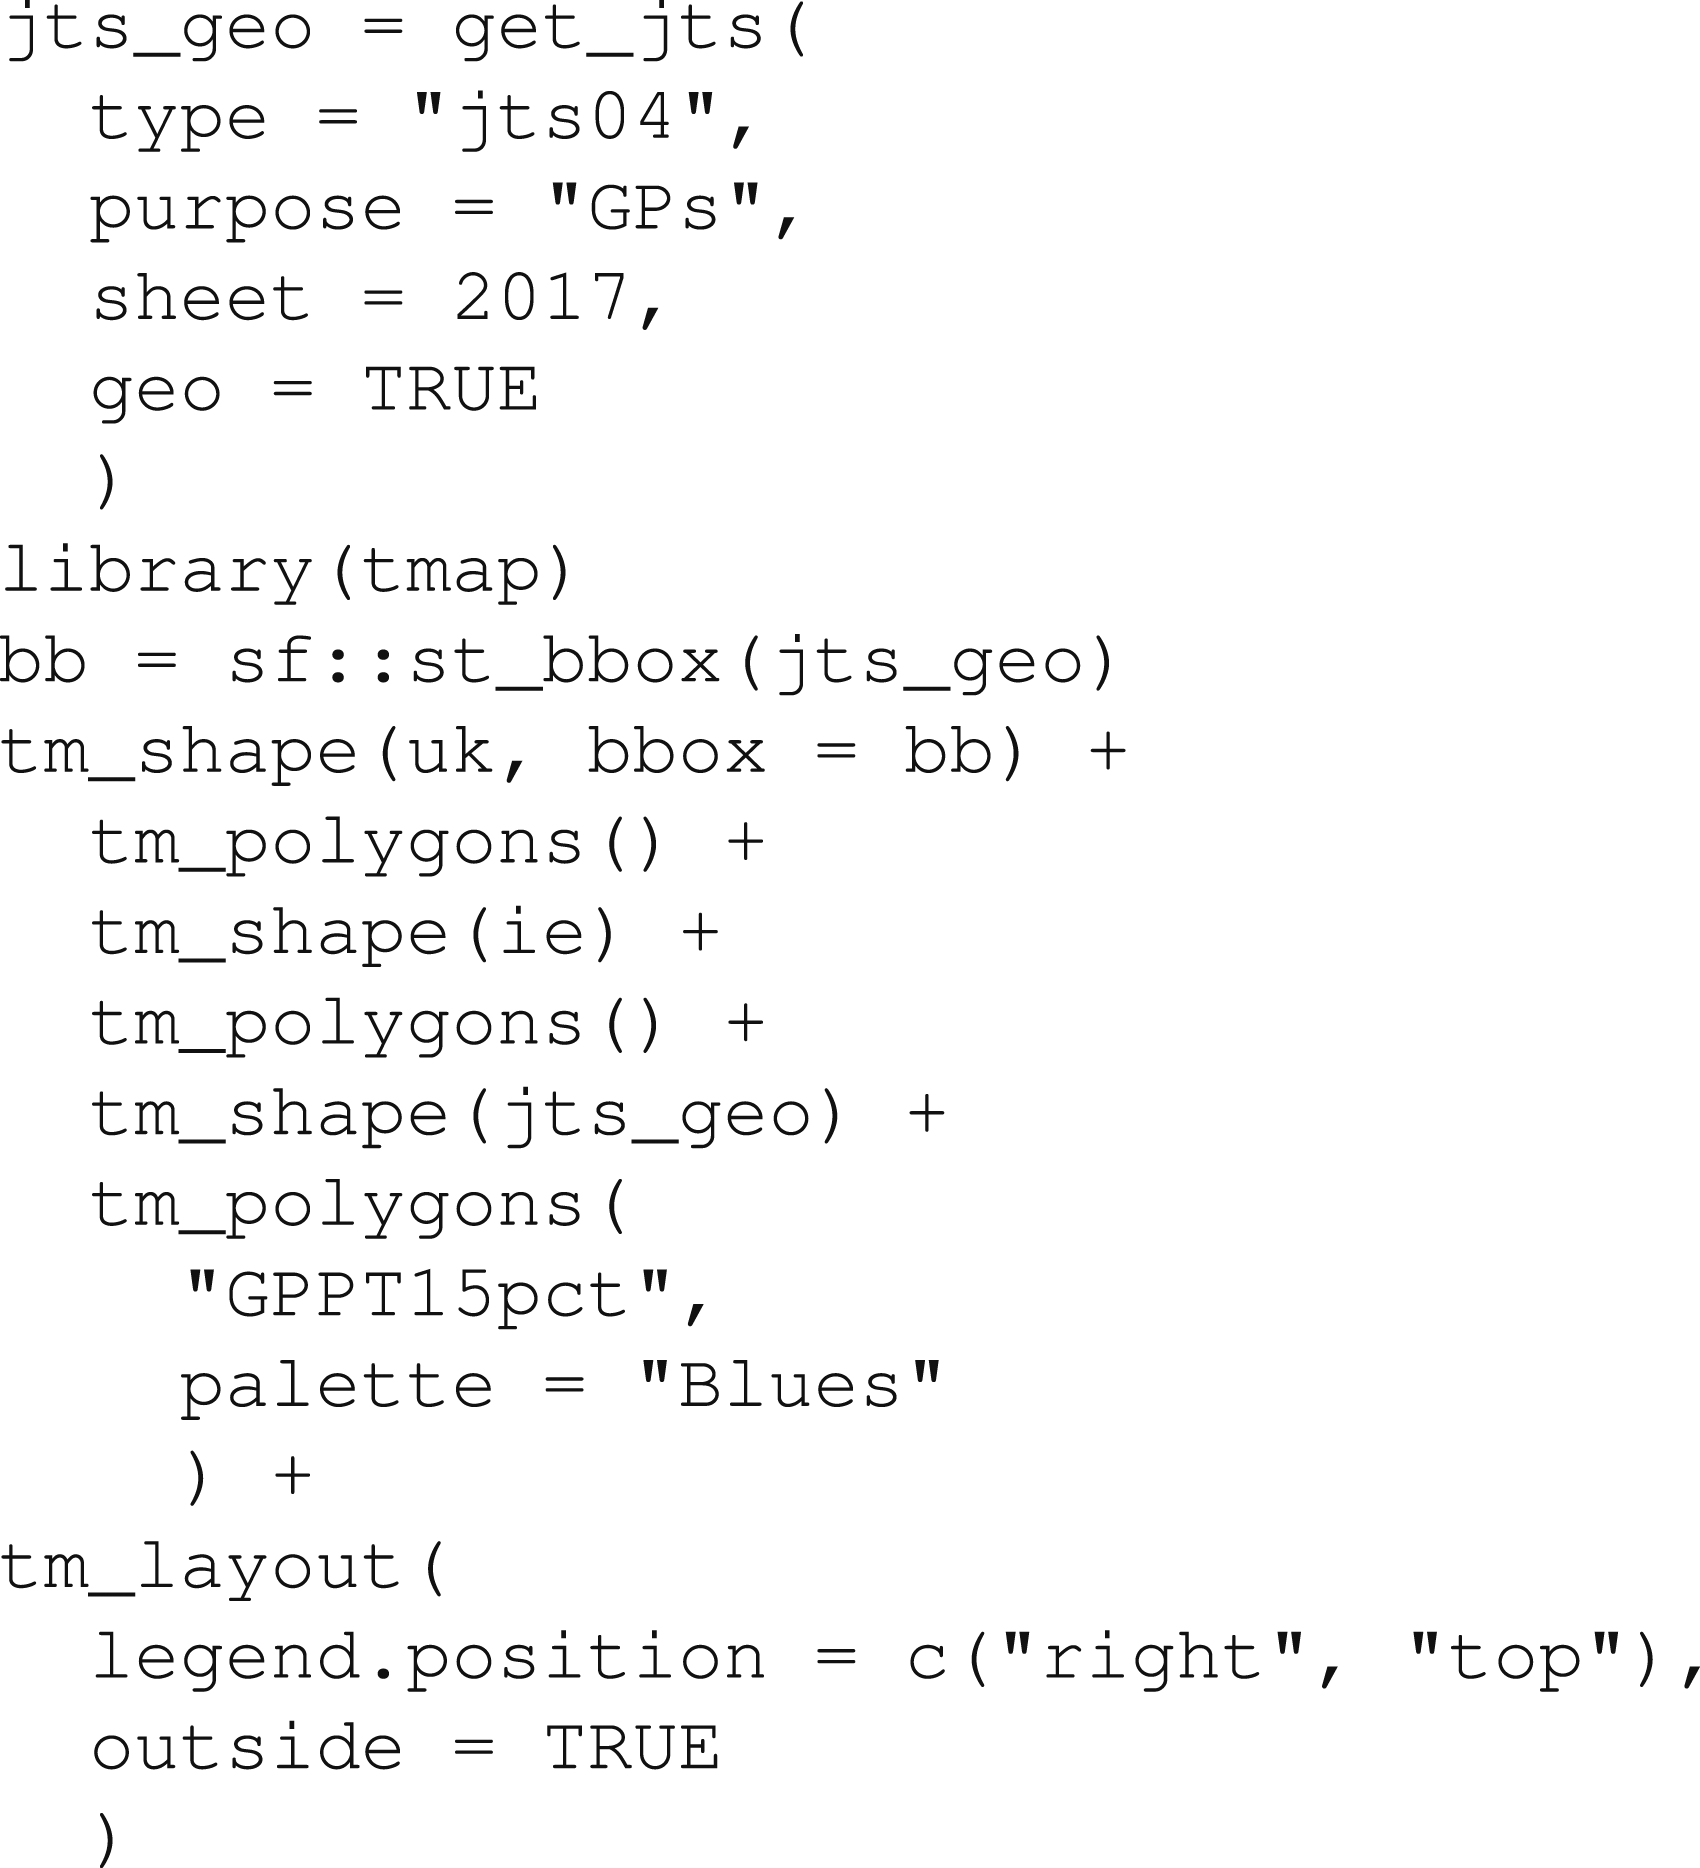
You can get geographic datasets (such as LSOA boundaries) for relevant tables by setting the geo argument to TRUE, as follows:
The Travel time to healthcare by public transport: colour is proportional to the percentage of people in each LSOA who can reach general practitioner (GP) locations by rail or bus within 15 min.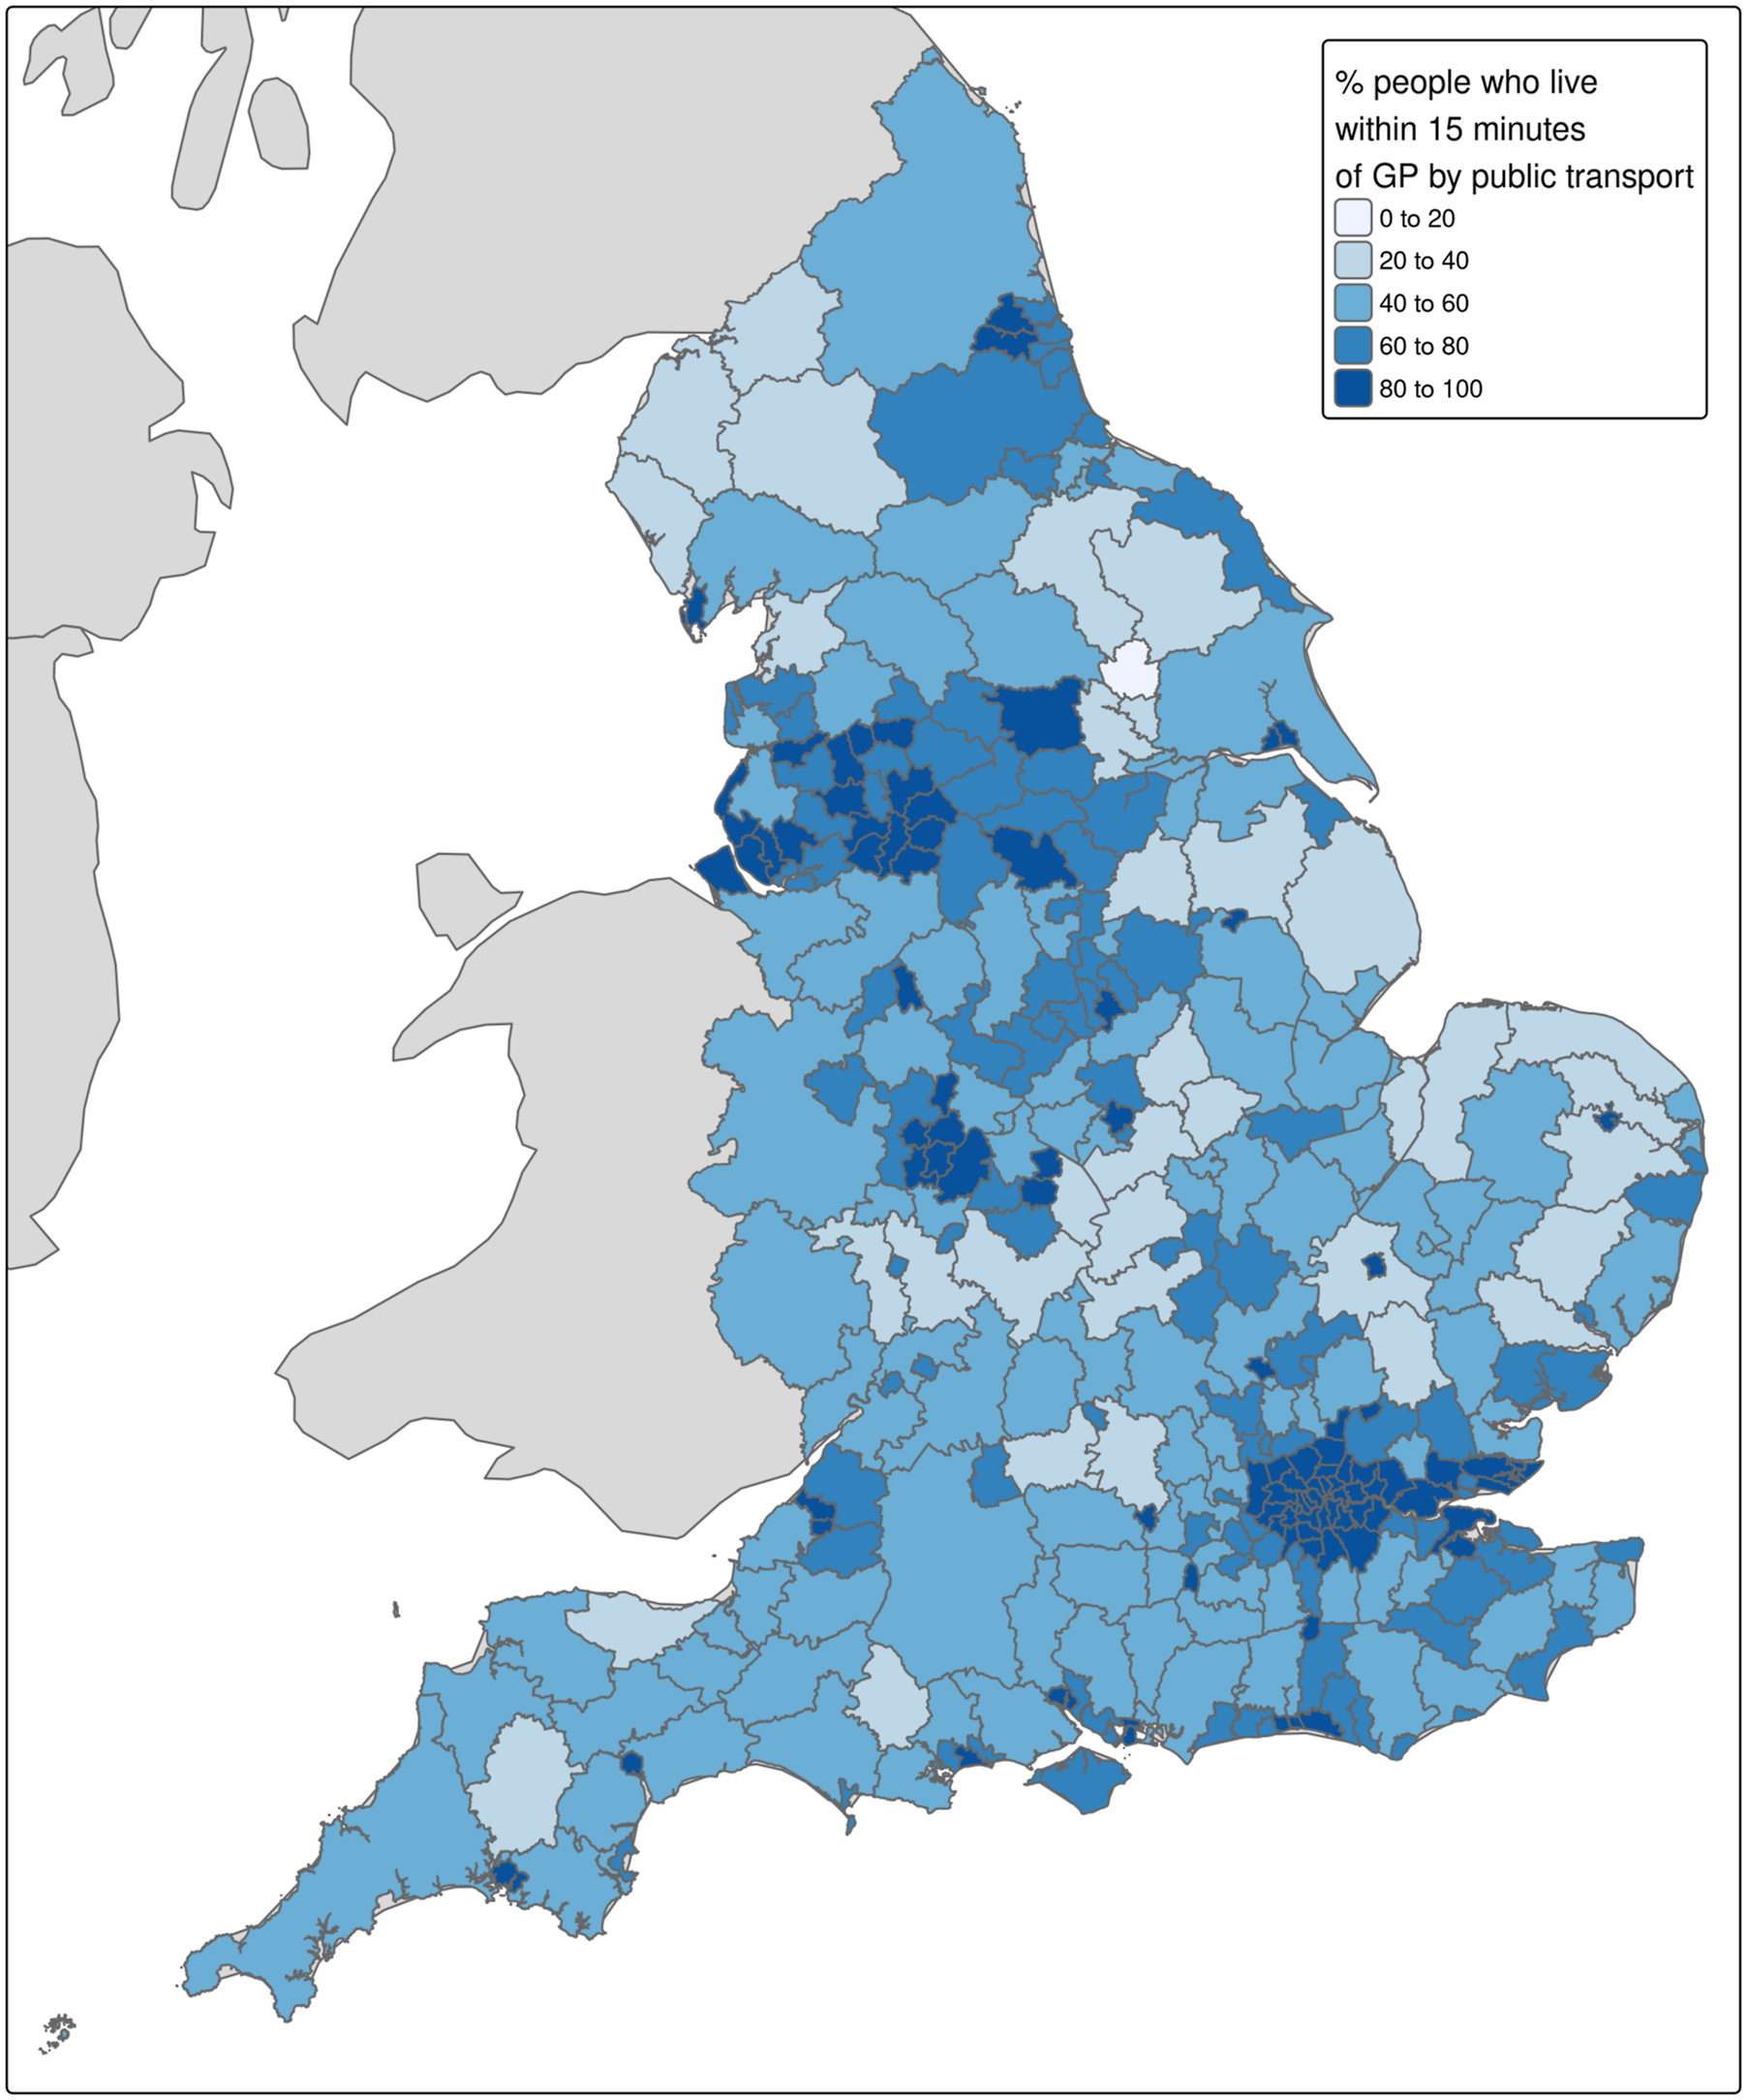
Conclusion
Our experience of developing Python and R packages to enable the import of JTS data more easily demonstrates how software development can enable reproducible data science for public bodies and beyond. Government bodies are increasingly tasked with providing large and complex data sets to multiple stakeholders. ‘Packaging-up' tools to enable direct access to them can support this task while building software development capacity and ensuring transparency and reproducibility of research with official datasets. Transparent and reproducible research is also important in promoting an ethical use of data, as everyone is able to see and reproduce the process used to go from the original data set to the output of an analysis.
The JTS data files used here showcase the challenges faced by many public sector bodies wishing to obtain the maximum value from their data: developing documentation, providing pipelines for data cleaning, providing context (e.g. provision of geometries alongside entries representing administrative zones), and releasing data in the most relevant formats, all take extra resources. Developing tools such as that presented here requires significant initial time investment in writing and testing the code, ensuring it works as expected and that it performs the right processing of the data. We suggest that adopting this approach of packaging code and data together from the onset of a project can be beneficial in the long term. Investing in this can enhance the ability of researchers and analysts to work with the data. The case study presented here not only provides tools for accessing the data, but it also encourages a range of users by supporting two of the most popular languages for data science. Whilst not all policy makers will have the skills or background to use such tools, we anticipate these becoming more common and widespread in the future, as a larger number of people are trained in data science methods. The true potential of publicly available data sets can only be realised when a broad range of data scientists and analysts can work with them, with minimal barriers to entry. Other benefits of the approach include reducing risks of each researchers introducing errors into their work, leading to results that are not only erroneous, but hard for others to fix further down the ‘data pipeline'.
The approach we have taken is not without limitations or challenges. Indeed, there are many additional improvements that could be made, including the provision of intermediate data files in a compressed and analysis-ready format (such as Apache’s Parquet format), enabling future proof and high performance in memory analysis using the multi-lingual Arrow framework (currently files are provided in .csv format); further development of the R version and more rigorous tests to ensure that the outputs from R and Python implementations of
The
Footnotes
Acknowledgements
We would like to thank Greg Haigh (Advanced Analytics, Department for Transport) and Stephen Reynolds (Travel and Environment Data and Statistics (TRENDS) Division, Department for Transport) for feedback on the paper.
Declaration of conflicting interests
The author(s) declared the following potential conflicts of interest with respect to the research, authorship, and/or publication of this article: The views expressed are those of the authors and may not reflect the views of the Office for National Statistics, Active Travel England, 10DS, or the wider UK Government.
Funding
The author(s) disclosed receipt of the following financial support for the research, authorship, and/or publication of this article: This work was supported by the Economic and Social Research Council (ESRC) & ADR UK as part of the ESRC-ADR UK No.10 Data Science (10DS) fellowship in collaboration with 10DS and ONS (Federico Botta, grant number ES/W003937/1; Robin Lovelace, grant number ES/W004305/1).