
Abstract
Accessibility of different places, such as hospitals or areas with jobs, is important in understanding transportation systems, urban environments, and potential inequalities in what services and opportunities different people can reach. Often, research in this area is framed around the question of whether people living in an area are able to reach certain destinations within a prespecified time frame. However, the cost of such journeys, and whether they are affordable, is often omitted or not considered to the same level. Here, we present a Python package and an associated data set which allows to analyse the cost of train journeys in Great Britain. We present the original data set we used to construct this, the Python package we developed to analyse it, and the output data set which we generated. We envisage our work to allow researchers, policy makers, and other stakeholders, to investigate questions around the cost of train journeys, any geographical or social inequalities arising from this, and how the transport system could be improved.
Introduction
Being able to travel to jobs, or services such as hospitals and food stores, is a basic need that we should all be able to achieve (Cass et al., 2005; Kaufmann et al., 2004). However, the discussion often revolves around the accessibility of public transport or private vehicles to reach these destinations in a reasonable time, or indeed, at all (Durán-Hormazábal and Tirachini, 2016; Liao et al., 2020; Pereira, 2019; Wu et al., 2021). The affordability of such journeys has often been overlooked, and a comprehensive understanding of the social exclusion resulting from the cost of journeys is still missing (Mattioli et al., 2018; Titheridge et al., 2014; for the North, 2022; Crisp et al., 2018). Indeed, transport affordability and the more general notion of transport poverty have been recognised as issues that require significant further research and have been under-explored (Lucas et al., 2016). Unaffordable transport (in relation to households income and living costs), lack of accessibility to key activities or even to transport infrastructure, and the exposure to external factors (such as increased road traffic casualties or pollution exposure) compound their effects and can push sectors of the population into transport poverty. However, the available data to study transport poverty is often lacking, not available or not suitable for analysis (Lucas et al., 2016).
A better understanding of the economic aspect of public transport journeys also holds significant importance in the transition towards net zero to reduce the reliance on car journeys (Edenhofer, 2015). Previous research has highlighted how low-income, deprived communities are not being reached by the sustainable transport agenda, and many living in those areas can be considered “forced car owners” (Curl et al., 2018). If net zero is to be achieved, public transport is likely to need to grow in order to reduce private vehicle emissions.
Here, we present a novel Python package, with an associated data set, which provides a starting point to study the cost of train journeys in Great Britain. We envisage the code and data presented here to be useful to all practitioners, academics and policy makers alike, interested in this topic. We provide an example application of this tool by calculating the cost of accessing key services, such as hospitals, by rail in England, combining the tool presented here with a data set on the location of such services. We also believe that our work here provides further evidence that coupling openly available data with openly available tools can help maximise the usability and impact of analysis, facilitating reproducible research (Botta et al., 2024; Fleischmann et al., 2022; Rey, 2023; Yap et al., 2022).
Data
ATOC fares data
Data on rail fares were retrieved in February 2022 from the Rail Delivery Group (RDG), which is the British rail industry membership body bringing together rail companies and passenger groups in Great Britain. The RDG releases data on timetable and fares for all trains in Great Britain to encourage reuse and promote rail travel: data.atoc.org. Here, we particularly focus on the fares data, but a complete description of both the timetable and fares data sets is available at the URL above. The fares data set contains detailed information for all rail journeys in Great Britain. It is important to highlight that the fares structure of rail tickets in Great Britain is particularly complex, with a wide range of options on how fares can be constructed for journeys. Fares can depend on time of travel, rail company, specific routing of the journey, and whether the ticket has been booked in advance or not; split ticketing, where a passenger travels from station A to station B by purchasing a series of tickets for intermediate stations (e.g., A to C, C to D, …B), can, and often does, affect the price of the journey and, perhaps somewhat counter-intuitively, can make the overall journey cheaper; finally, due to the number of rail operating companies, there is a relatively large number of discounts and railcards available to passengers, which can make journeys cheaper. The tool and analysis presented here focus on the lowest available fare for a single one-way any-time journey, but the code is easily customisable to select a different fare of interest.
At a high level, the fares data set contains fares for all pairs of points in the rail network in a fare and flow format: each potential journey between a pair of points in the rail network is assigned a flow id, and each flow id is then assigned a fare. Note that we refer to flows as between pairs of points in the rail network rather than between pairs of stations; this is because, to simplify the format in which the data set is released by the RDG, a flow can either be between a specific pair of stations (e.g., London Liverpool Street and Manchester Piccadilly), or between clusters of stations. Clusters of stations are used to group together stations for which the cost of a flow from that cluster to the destination is the same for any station in the starting cluster. This is particularly useful for long journeys, where starting from two stations which are very close to one another (in relationship to the overall distance of the journey) makes no difference in the price of the journey. Note that a flow can be between pairs of stations, from a cluster to an individual station, from an individual station to a cluster, or between pairs of clusters. Each train station can, and typically does, belong to many clusters, depending on the specific flows. This allows clusters to encompass stations in a smaller or larger geographical area depending on the flow (typically long distance journeys are associated with geographically large clusters); it is also worth mentioning that there are some further subtleties to the fares data such that stations can also be grouped together in station groups, which are distinct from station clusters, and which are only used for naming purposes (and station groups can be part of clusters themselves). Figure 1(B) depicts an example of a station cluster containing a station group. This cluster is the destination of a flow leaving from Penzance, in the south-west of England, and contains all stations for which the specific ticket associated to this flow is valid. Amongst the stations in this cluster, those highlighted in yellow correspond to the station group of Birmingham Stations: Birmingham New Street; Birmingham Snow Hill; Birmingham Moor Street. This station group is only used for naming purposes of those three stations, but can appear in multiple station clusters, whereas a station cluster cannot itself appear in other station clusters. Each flow id, regardless of whether it is from/to a station or a cluster, can be assigned to multiple fares, which correspond to the different ticket types which are available for that flow; these can be, for instance, one-way any-time single tickets, return tickets, advance, or other special discounted tickets. Thus, to identify the fare for a specific journey between two stations and for a specific ticket type, we have to parse all possible flows in the data, identify the one corresponding to the pair of stations (which, in turn, may require breaking down station clusters and groups down to individual stations), and then retrieve from the fares data the entry corresponding to a specific ticket code and flow id. This will give us the cost of that journey. However, it is important to emphasise that this pipeline may not result in an individual fare, because typically there are multiple flows associated between pairs of stations, particularly for long distance journeys. This can be for a number of reasons, such as the journey taking different routes, or relying on different rail companies for connections. Below, we will mainly focus on the lowest possible fare amongst those available for a flow, but note that this will typically not be the most convenient or efficient way of travelling between stations, particularly for long journeys.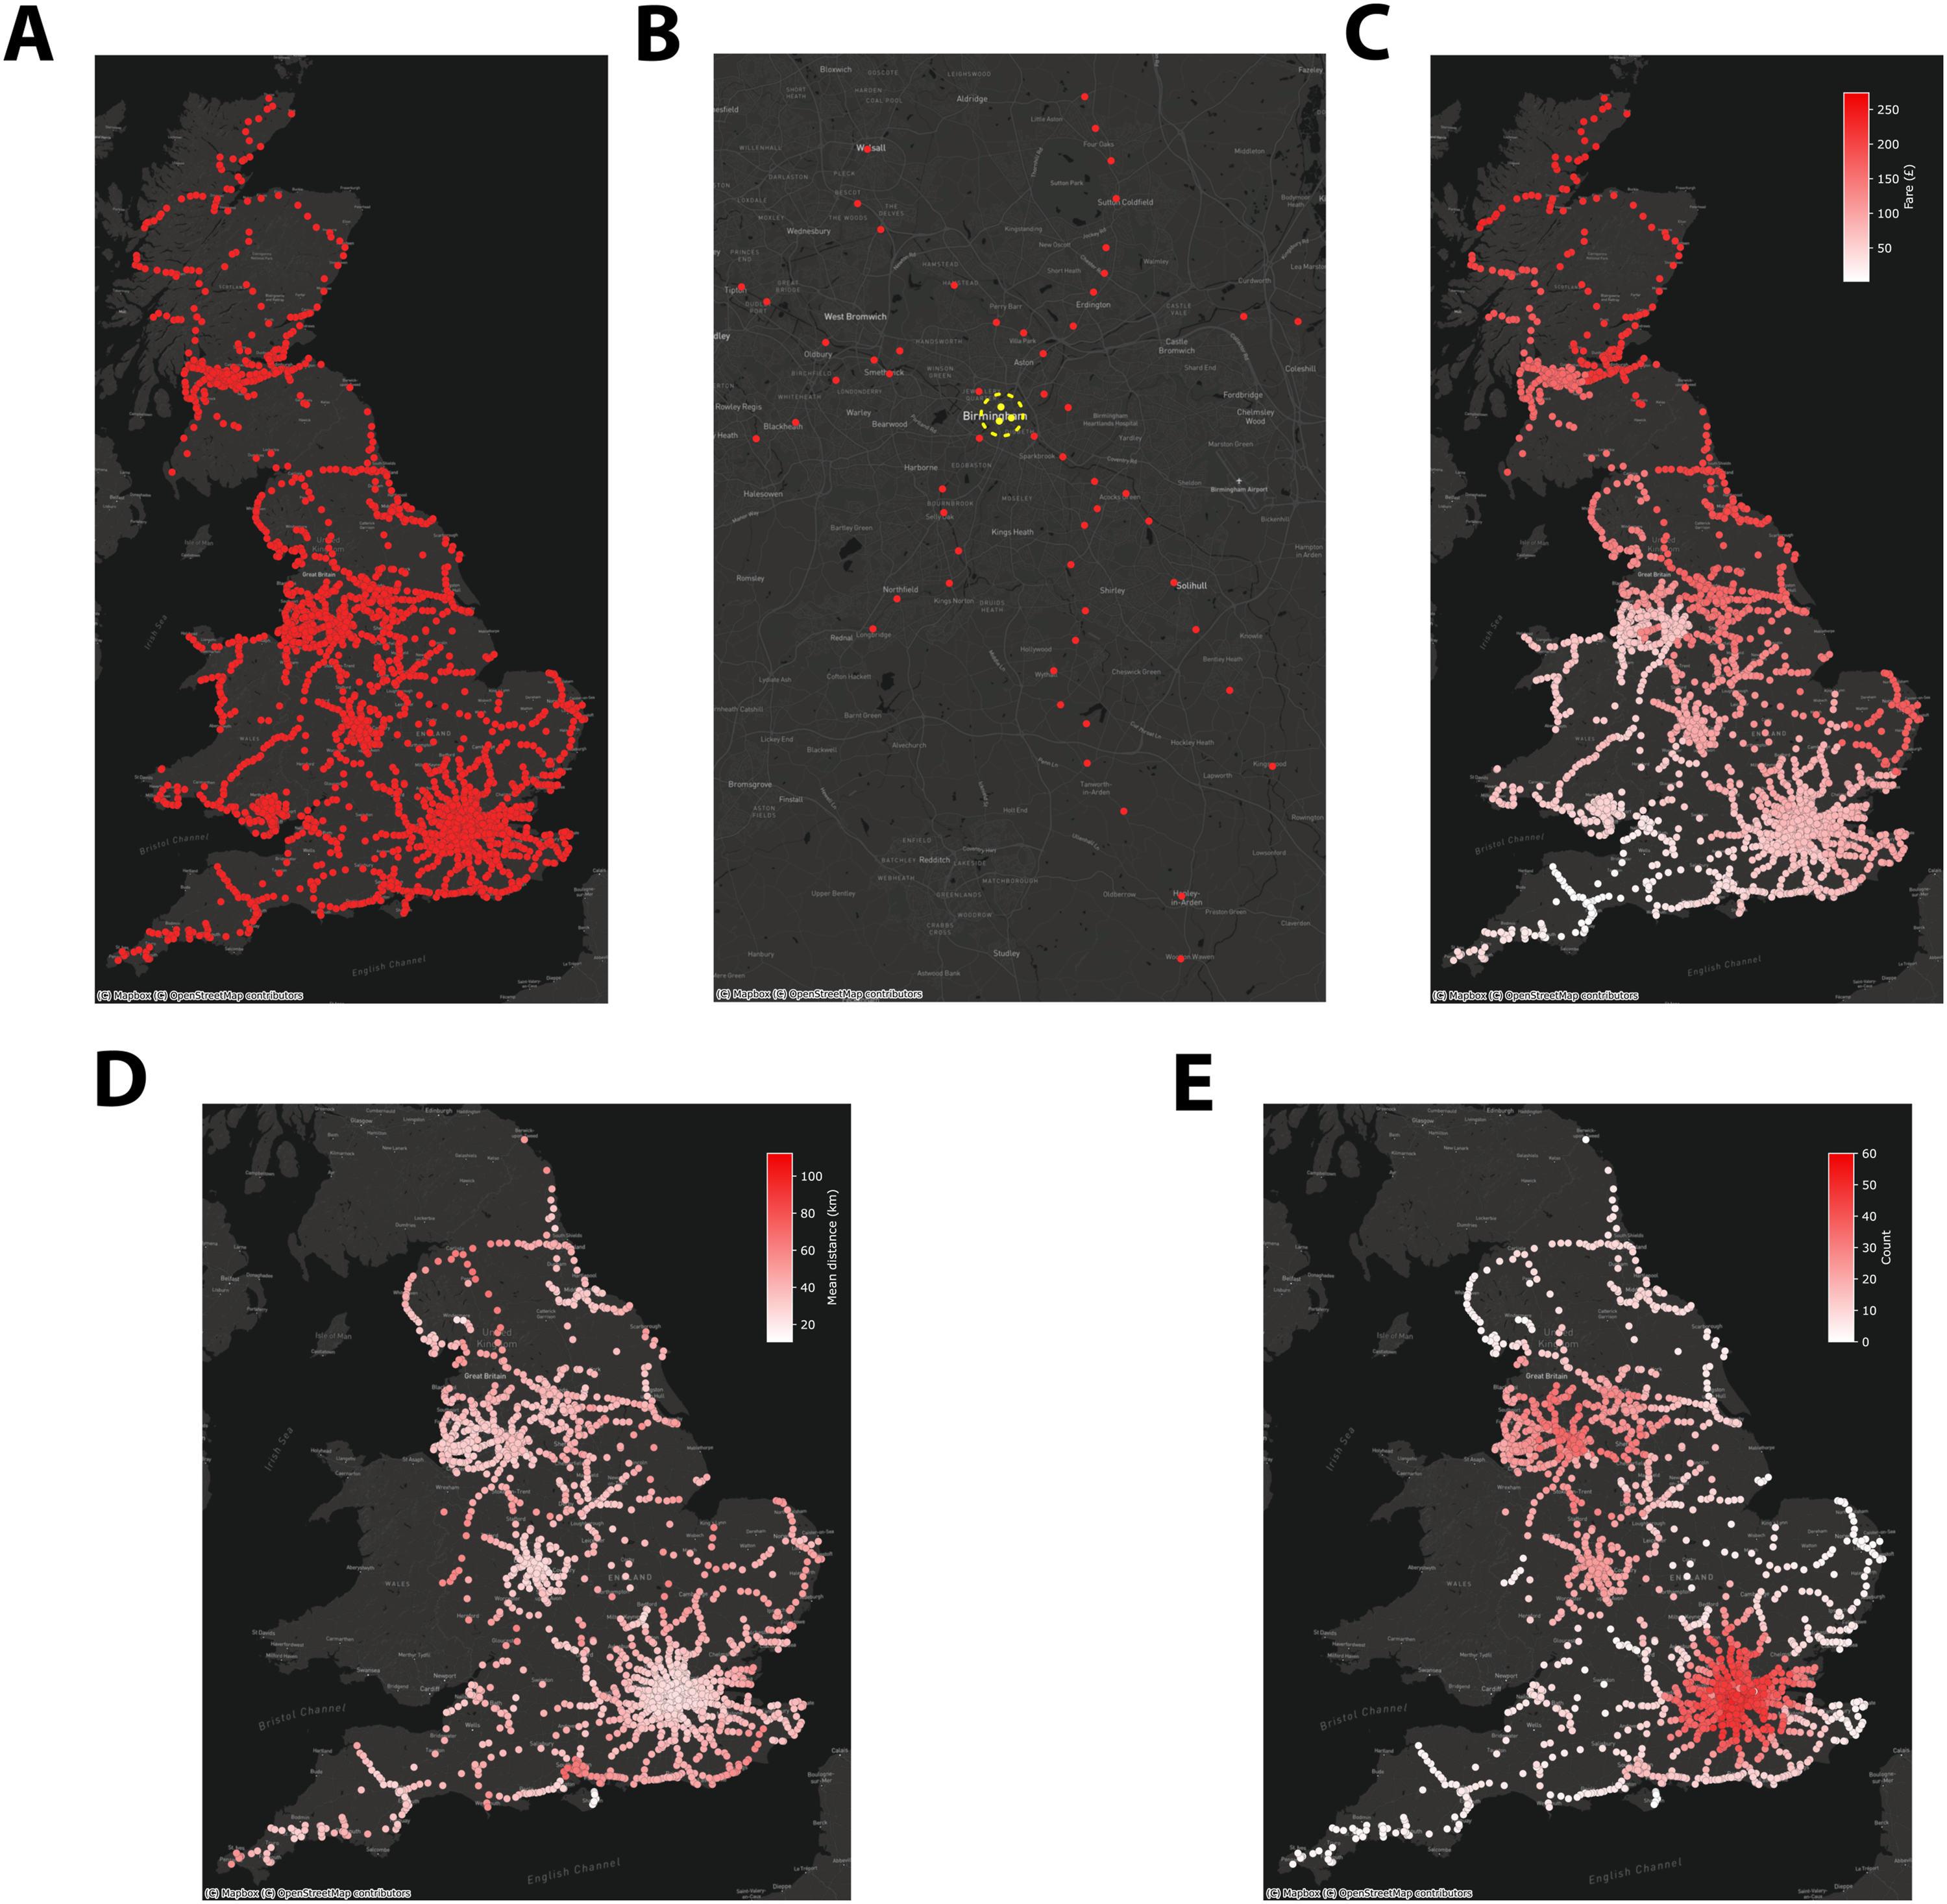
NAPTAN data
We retrieve data from the National Public Transport Access Nodes (NaPTAN), which is Great Britain’s official data set of all public transport access nodes: https://www.gov.uk/government/publications/national-public-transport-access-node-schema. In particular, the NaPTAN data set contains the location of all public transport access nodes, such as bus stops, train stations, tram stops, and other services. Here, we specifically use the NaPTAN data on the location of train stations in Great Britain.
Department for Transport’s Journey Time Statistics
We retrieve data from the UK Department for Transport (DfT) on journey times to key services, such as food stores, health care and employment centres: https://www.gov.uk/government/collections/journey-time-statistics. The specific content of this data set is beyond the scope of this paper, but, to summarise, it contains statistics on journey times by different modes of transport to a range of key services. The location of those key services, such as hospitals and employment centres, is released as part of this data set by DfT, and we use it to be able to calculate the cost of accessing such services by rail.
Code
The Python implementation of this package has been developed in a Poetry environment, and is available on GitHub https://github.com/FedericoBotta/railfares. The core of the package is in the
Alongside the Python package, we also release some Python scripts which use the package to analyse the data: • • • •
A brief tutorial script is also provided on the GitHub page to demonstrate basic functionalities and usage of this package (https://github.com/FedericoBotta/railfares).
Output data
Using the data sets and Python package described above, we can construct a new data set containing exclusively the minimum fares for travelling between each pair of rail stations in Great Britain using a one-way any-time single ticket. We extract from the RDG data the cost of journeys for individual pairs of stations and release this as a new data set, which can be used to investigate the minimum cost of journeys between pairs of stations. Figure 1 depicts an overview of this data set, where each circle represents a train station. Panel C shows the cost of travelling to any station in Great Britain starting from Exeter St David’s, a city in the South West of England. As we would expect, the cost of travelling increases the further you move from the starting station, with the north of England, Scotland, and parts of the East of England showing the highest prices. Panel D depicts the mean distance you can travel from each station in England with a maximum budget of £25. We can easily see a clear distinction between stations in urban and rural areas.
The Python package also allows to calculate some metrics about the services and opportunities that can be accessed by train with a range of budgets. The relevant scripts are available on the GitHub repository, and briefly described in section above. Figure 1(E) shows the number of hospitals you can reach from each station with a maximum budget of £25. Note that we assume a hospital can be reached by train if it is within a five kilometres radius of a train station. Visual inspection easily reveals that people in cities experience access to a larger number of hospitals. It is worth highlighting that this is for illustrative purposes of the data and Python package only. However, this example demonstrates how the Python package can easily calculate the reachability, by cost, of destinations of interest as long as the user has data on their location.
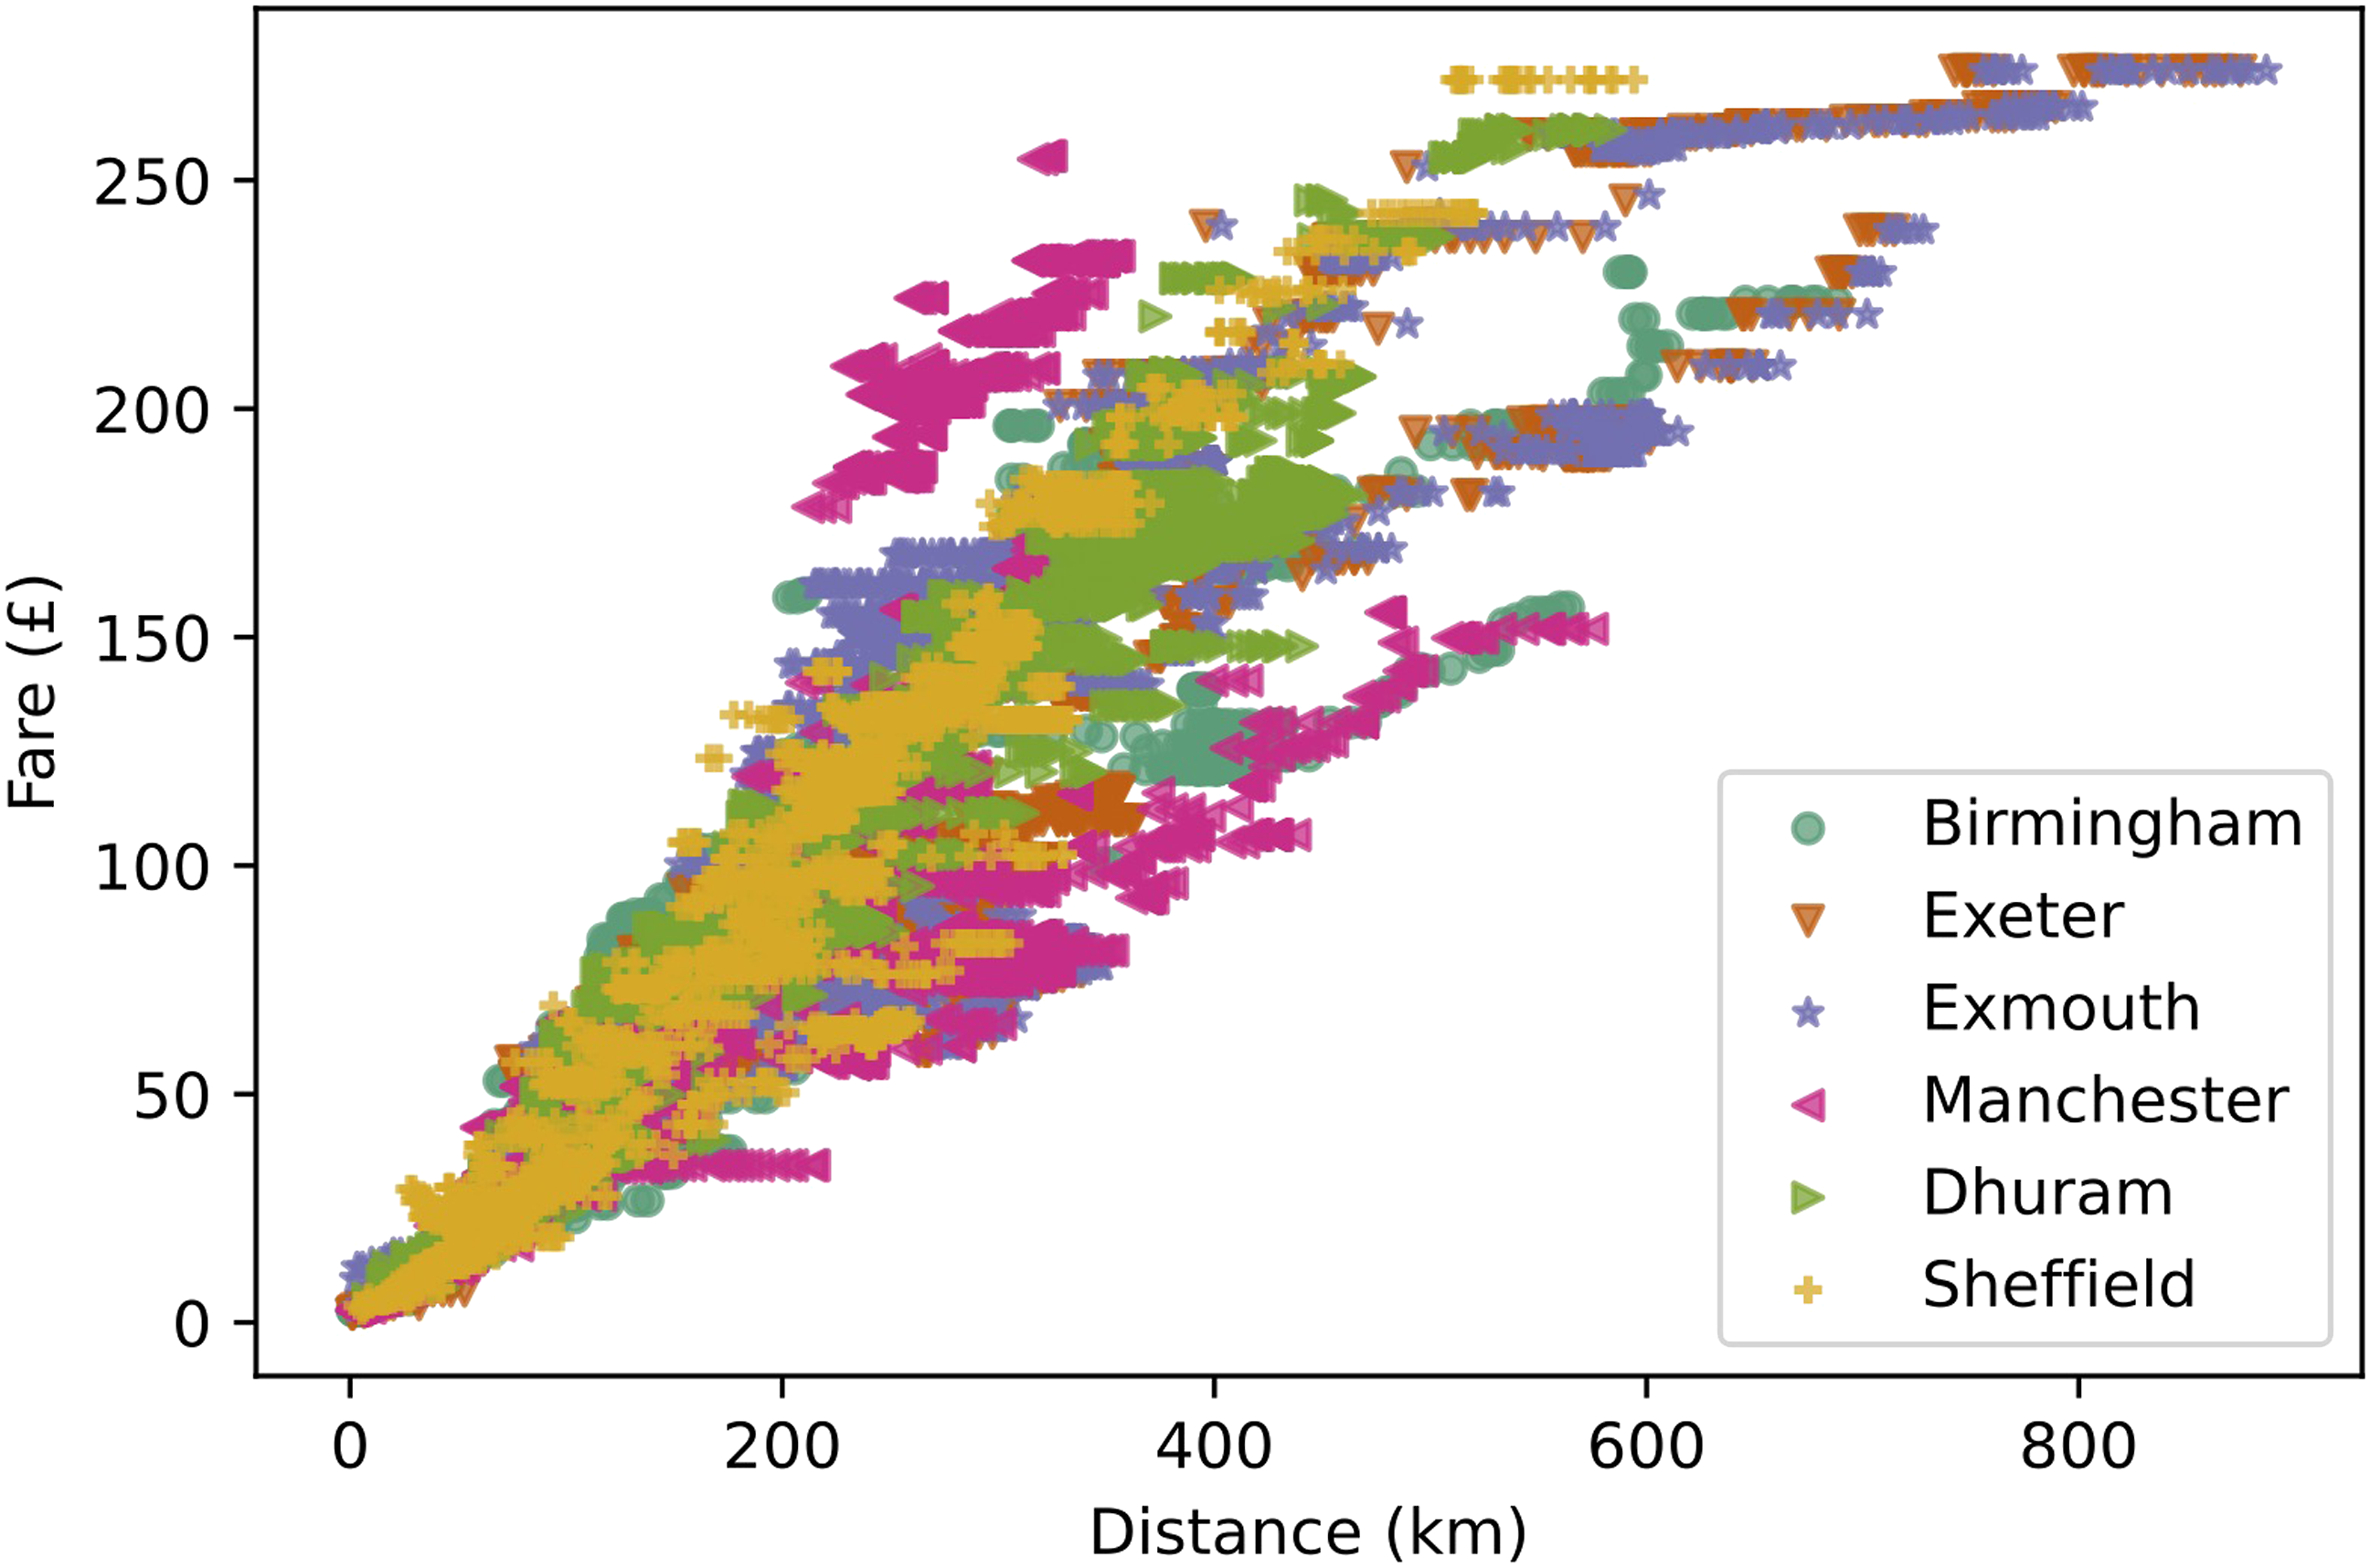
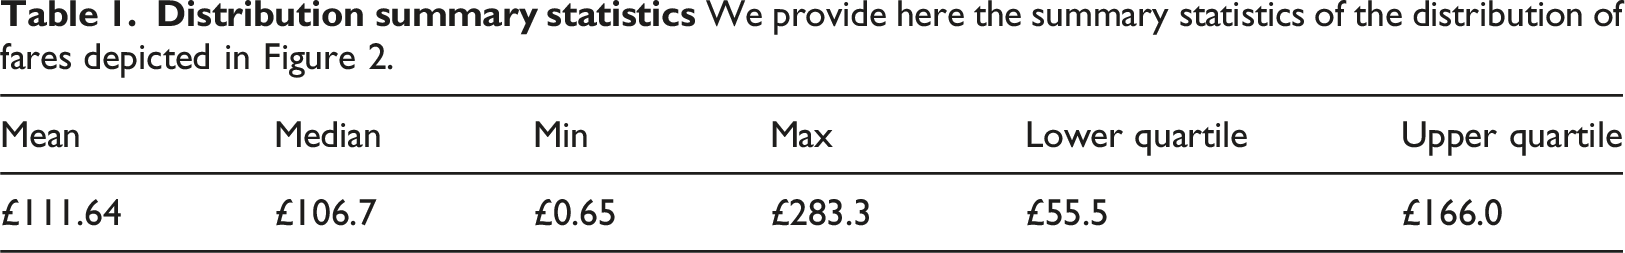
The data on the minimum fares and the data on the number of hospitals, employment centres, and town centres, is made available as a release on the GitHub page of the project (https://github.com/FedericoBotta/railfares/releases/download/v1/Results.zip), and a description of the files format is given in the README file (https://github.com/FedericoBotta/railfares/blob/main/README.md).To demonstrate the capability of the Python package, and the associated data set, Figures 2 and 3 provide an overview of some general properties of the data. Figure 2(A) depicts the distribution of (any-time, single) ticket prices for all journeys in Great Britain, and Table 1 provides the summary statistics for this distribution. To further investigate differences between stations, Figure 2(B) shows the distribution for two stations in quite different locations: Birmingham New Street is the main station in the city of Birmingham, the UK’s second largest city, which is located in the middle of England and acts as a transport hub connecting different parts of the country together; Exmouth is a small seaside town in the south-west of England, which is a relatively rural part of the country with significantly fewer train links compared to Birmingham. Finally, Figure 3 depicts the relationship between the cost of tickets and distance travelled for six different train stations in England: Birmingham New Street; Exeter St David’s; Exmouth; Manchester Piccadilly; Durham; Sheffield. These stations are in significantly different locations, with Birmingham and Manchester being large cities and transportation hubs; Sheffield, Durham and Exeter are cities in different areas of England and of varying sizes, and Exmouth a small seaside town. Visual inspection reveals a positive correlation between price and distance, which is to be expected, but also some interesting variation across stations as well as some clusters in the points. The Python package presented here allows to generate such figures and analyse the corresponding data set easily, lowering the entry barrier to this data set and enabling a wide range of people work with it. We anticipate that the work presented here will enable the study different features of this data set and how they can be used to study transport poverty. Furthermore, the transition to net zero will require a shift from private vehicles to public transport, and an increased understanding of the different costs of driving versus train journeys is needed to inform policies to encourage modal shift.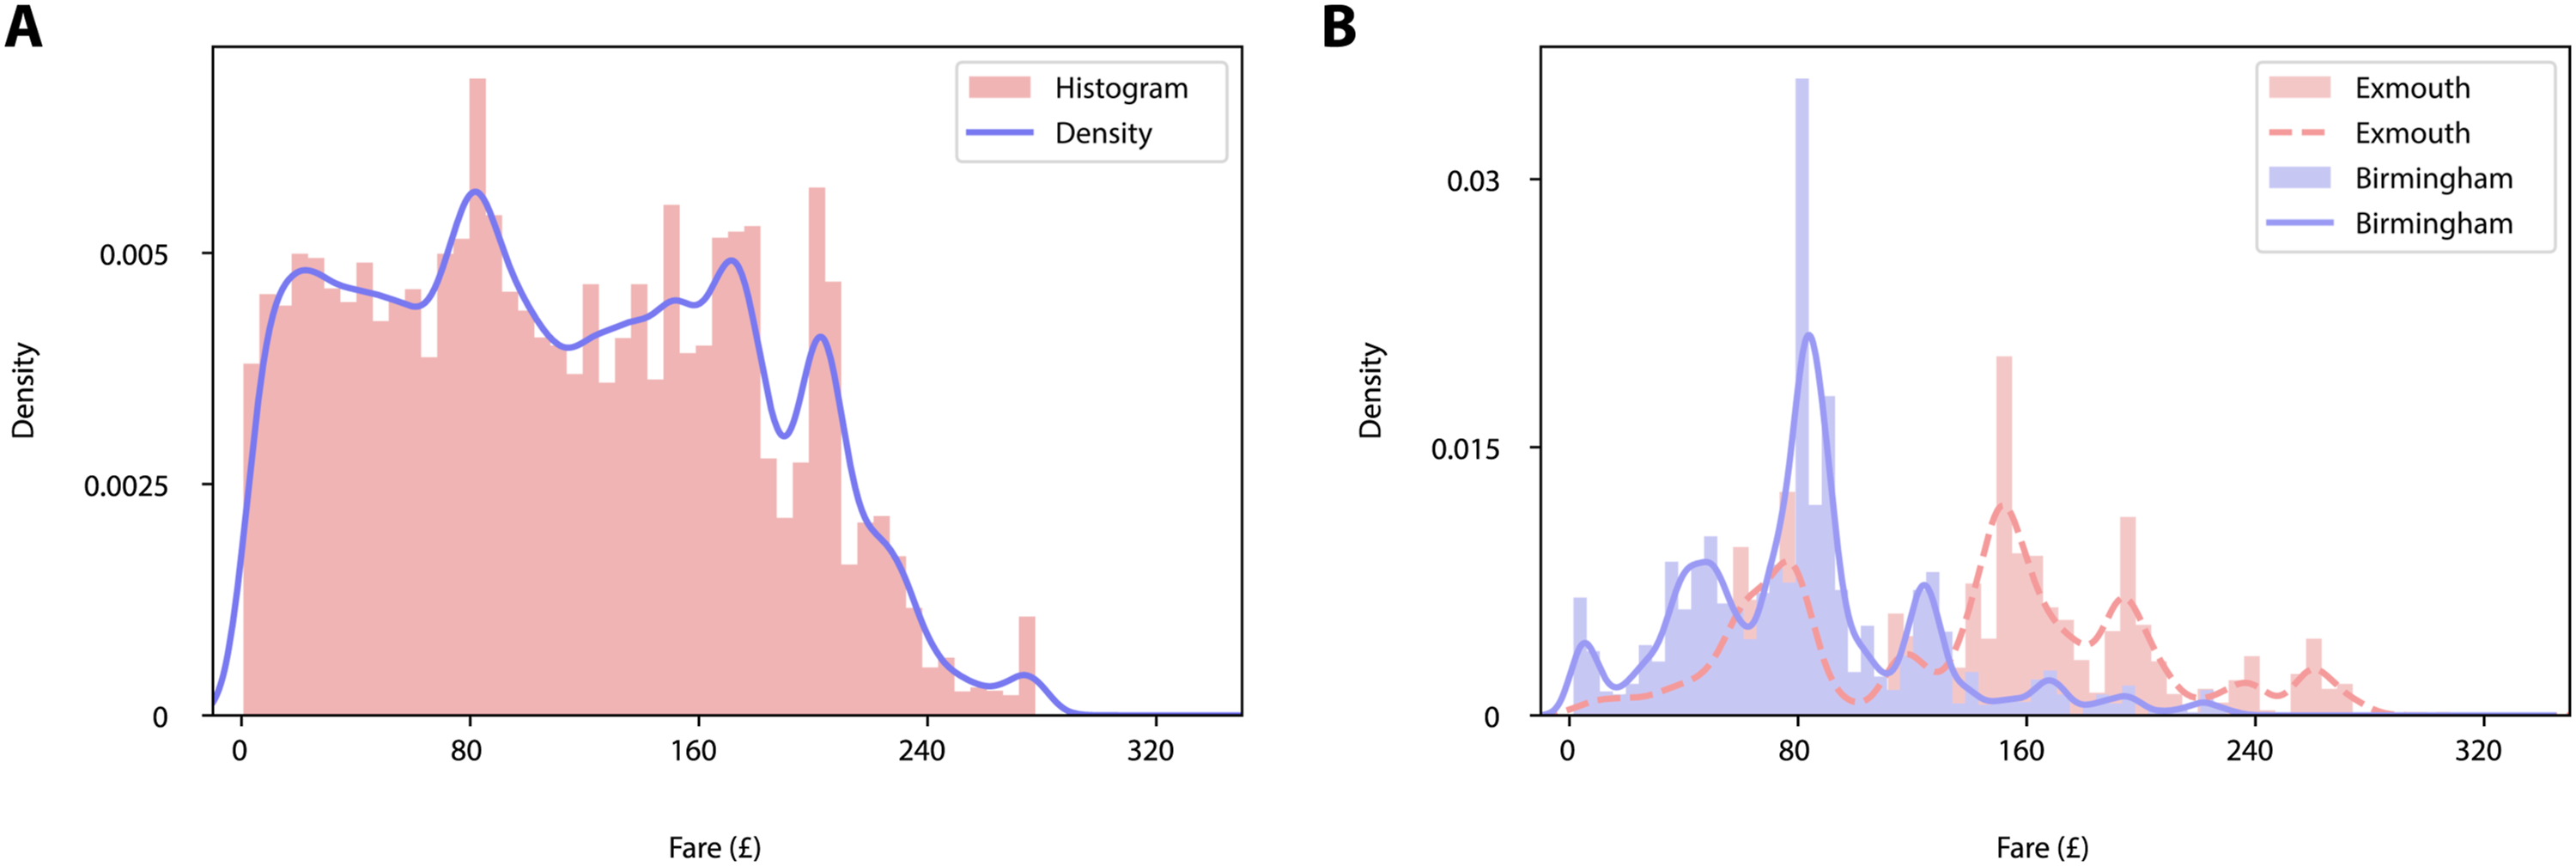
Conclusion
We presented a first effort to enable data science practitioners to study the cost of train journeys across the whole of Great Britain. Our work builds on official data on rail fares and we release a Python package and an associated data set that allows to calculate the cost of journeys between pairs of stations, investigate accessibility of different types of services, and analyse spatial variations in the fares.
Recent years have witnessed an increased effort to “level up” the UK, with a drive to reduce the strong geographical inequalities which are present in this country (Department for Levelling Up and Communities, 2022), with the UK being recognised as the most spatially unequal large high-income country (McCann, 2020). Access to opportunities has been identified as a particularly important issue to tackle, with an increased understanding that “while talent is spread equally across our country, opportunity is not” (Department for Levelling Up and Communities, 2022). As such, transport is an area of key importance for this purpose, and a stated goal by national government is that of ensuring that local public transport connectivity reaches standards comparable to that of London. Our library allows to identify and study inequalities in the cost of travelling by train, and could be used to provide evidence for policies aimed at reducing the cost of travelling by train in certain parts of the country. For instance, in future work we intend to use this tool to investigate how the cost of commuting to work by train varies in different regions, and whether people living in different areas face similar costs to access job opportunities.
Undoubtedly, there are a number of limitations and challenges too. The current version of the Python package requires users to download the most recent version of the data from the Rail Delivery Group, should they wish to use the latest fares. The complex ticketing system in Great Britain requires to make some simplified choices in order to make comparisons, but this is likely to result in some inconsistencies at times. However, we believe our Python package allows to consider different ticket types to those discussed here, and the interested researcher should be able to edit the relevant parameters in the calls to the functions calculating the cost of journeys. This is already possible in the current version of the package, albeit it could probably be made more explicit and easier to do. Finally, it is clear that the true cost of a journey is more complex than what discussed here, since it should include the cost of reaching a train station, any additional travel at the destination, as well as further barriers to travelling, such as accessibility of train stations. We envisage the work presented here as a starting point for the interested community to build upon.
Footnotes
Declaration of Conflicting Interests
The author(s) declared no potential conflicts of interest with respect to the research, authorship, and/or publication of this article.
Funding
The author(s) disclosed receipt of the following financial support for the research, authorship, and/or publication of this article: This work is funded by the Economic and Social Research Council (ESRC) & ADR UK as part of the ESRC-ADR UK No.10 Data Science (10DS) fellowship in collaboration with 10DS and ONS (grant number ES/W003937/1). The views expressed are those of the author and may not reflect the views of 10DS, the Office for National Statistics and the wider UK government.
Data Availability Statement
The datasets generated during and/or analyzed during the current study are publicly available and are accessible as part of the Python package described here.