
Abstract
Urban planning and design aim to encourage active mobility by promoting various models that assess a city’s transportability and accessibility. In practice, these models are not attuned to a huge part of the population that have mobility impairments, therefore they uphold a flawed city design and prevent these populations from being an equal part of the inclusive city vision. We suggest an approach to develop new visually impaired mobility accessibility indices of urban space using open-source geospatial data and showcase them across different wards and boroughs in Greater London. Results show the various urban accessibility levels for visually impaired pedestrians, pointing to existing problems this community faces when navigating the city, such as challenging street network connectivity and dangerous walking areas. These indices can be used for more inclusive city planning and design, enhancing urban mobility and walkability equality, and improving this community’s quality of life.
Introduction
Walkability in urban settings has emerged as a crucial component of sustainable city design, impacting public health, environmental resilience, and economic prosperity. Research highlights the benefits of walkable areas, such as promoting healthier lifestyles and community engagement, while also being associated with economic perks like increased retail activity and property values (Cortright, 2009). The focus on pedestrian infrastructure represents a shift towards inclusive urban spaces that cater to a diverse population, supporting not only mobility but also social equity (Talen, 2003). The intersection of walkability with urban planning thus signals a paradigm shift towards creating cities that prioritize human-scale development and accessibility (Ewing and Cervero, 2010).
Accessibility is a critical component of urban spaces, allowing people with disabilities to have the same access to physical environments, transportation, technological and communication systems, and other facilities and services as those without disabilities. Mobility is a critical aspect of accessibility for people with mobility impairments, and urban design and infrastructure play a crucial role in supporting mobility accessibility (Gilart-Iglesias et al., 2015).
Despite the growing social awareness towards maintaining urban accessibility, many urban environments still fail to provide basic accessibility for people with disabilities, and comprehensive information on existing urban mobility accessibility is still missing (Stafford and Baldwin, 2017). This study examines the urban space characteristics that hinder and promote mobility accessibility of visually impaired pedestrians (VIPs), including city structure, street network, urban design, and physical as well as temporal barriers.
VIPs face significant challenges in navigating urban spaces due to their visual impairments. They are unable to take advantage of landmarks and road networks that allow seeing pedestrians to orient themselves and instinctively avoid physical obstacles. Consequently, VIPs often opt to remain indoors, limiting their social integration and equality (de Boer et al., 2004). While technological solutions today provide navigation services to mitigate existing urban accessibility limitations, they often do not address or improve the underlying flawed conditions of the urban environment that make it difficult for VIPs to navigate. Therefore, comprehensive insights and understandings of the different levels of the city’s design and planning are needed to promote better urban accessibility for all.
The study proposes developing customized accessibility indices related to mobility that are specifically designed for VIPs, based on geospatial open data, to allow scalability and reproducibility across different cities worldwide. The indices consider a range of environmental and topological variables, including the geometry, complexity, and type of street networks, as well as temporal factors like Pedestrian Activity Levels (PAL). The results of urban analysis with the accessibility indices are shown for boroughs and wards of Greater London, indicating the accessibility levels for various city scales and pointing out problems stemming from flawed city design. This approach provides an accessibility assessment of urban spaces and formalizes customized accessibility measures of urban space designed specifically for VIPs.
Related work
Extensive research has advanced in efforts to assess and enhance urban accessibility for individuals with disabilities. Traditional approaches, while foundational, have shown notable limitations due to their inability to encompass the multifaceted nature of urban accessibility comprehensively. Historically, these methods have included direct observations of street layouts (Mackett et al., 2008), targeted surveys (Beale et al., 2006), and detailed interviews (Hashim et al., 2012), which while insightful, are constrained by their labour-intensive nature, high costs, and limited temporal scope.
To address these shortcomings, some researchers have turned to integrating geo-crowdsourced accessibility maps, which have demonstrated effectiveness in gathering detailed data (Prandi, 2023). This method is illustrated in studies like Rashid et al. (2010) where users annotate accessibility features via multimedia inputs, thus providing real-time, user-generated insights into urban navigational challenges. Karimi et al. (2014) further highlighted how such interactive maps could foster a more inclusive mapping environment, yet they noted the absence of comprehensive evaluations across varied urban scales.
Information and Communication Technology, GPS, GIS, smart sensing, and cloud computing, have significantly improved evaluation of urban accessibility for individuals with disabilities. These technologies facilitate real-time monitoring and comprehensive assessments of accessibility. For instance, GIS combined with decision analysis methods has modelled service accessibility for disabled persons (Alzouby et al., 2019), the mPASS system integrates sensing, crowdsourcing, and social systems for mapping accessibility (Prandi et al., 2014), and techniques like geoparsing and social media analysis offer insights into temporary urban obstacles (Rice et al., 2013). Yet, a holistic evaluation of urban spaces remains unaddressed in the literature.
Numerous academic studies have developed and analysed various urban accessibility indices, yet none specifically address the evaluation for VIPs. Historical methodologies, such as those from 1977 by Black and Conroy, explored the measurement of physical accessibility and travel behaviour, highlighting the significant impact of urban planning on accessibility (Black and Conroy, 1977). More recent studies, like Horner’s 2004 research, have utilized GIS-based analysis to investigate residential and employment accessibility in U.S. metropolitan areas, revealing patterns of urban sprawl and enhancing assessments of urban form (Horner, 2004). Additionally, research by da Silva et al. in 2020 introduced the Accessibility of Walkable Spaces index, which assesses pedestrian accessibility in urban areas, further refined by auditing sidewalk conditions in Paraná, Brazil (da Silva et al., 2020). Furthermore, the application of machine learning algorithms on mobility data has opened new avenues for predicting accessibility challenges and proposing solutions. By analysing patterns from historical data, researchers can forecast potential accessibility issues and proactively address them (ZENG et al., 2023). While these studies effectively quantify accessibility and serve as vital tools for planning and implementing more inclusive urban environments, they fall short in providing specific solutions for evaluating accessibility for VIPs.
Incorporating these diverse technologies and methodologies, the current research landscape is moving towards a more integrated and comprehensive approach to urban accessibility in term of VIP need and preferences. The challenge remains to harness these advanced tools in a manner that not only addresses the spatial aspects of accessibility but also incorporates temporal dimensions, thereby fostering a truly inclusive urban environment.
Methodology
To develop an accessibility index for VIPs, we conducted systematic interviews with VIPs and Orientation and Mobility Instructors (OMI), coupled with field observations in Israel and the US. This included open-ended and conversational interviews with 15 participants in Israel and training sessions that delved into VIPs navigation strategies. Additionally, in the U.S., interviews, and sessions with 3 VIPs highlighted environmental challenges and adaptations. Our approach captured real-time experiences and diverse navigation techniques, laying a foundation for understanding VIPs wayfinding in various settings (Cohen and Dalyot, 2021).
We identified several crucial spatial and environmental elements that significantly influence the wayfinding and navigation of VIPs: • Simplicity – VIPs prefer straightforward routes along roads with distinct boundaries like curbs, avoiding complex paths with multiple turns. • Landmarks – Reliable and distinguishable landmarks such as buildings, traffic lights, and bus stops are essential for VIPs to orient and navigate through the city safely. • Assistive Technologies – Devices that provide auditory information about pedestrian signals at intersections are invaluable for VIPs safe movement. • Obstacle Avoidance – Routes should avoid areas with potential hazards like roundabouts or crowded city squares, which can impede safe navigation for VIPs. • Intersections – The safety and accessibility of intersections are paramount. VIPs are better served by well-controlled crossings with clear pedestrian signals and crosswalks, rather than complex junctions with obstructed visibility or multiple intersecting roads. • Pedestrian Traffic – High pedestrian traffic can disrupt a VIPs spatial memory and orientation (Golledge et al., 1991). The use of white canes may become less effective and even hazardous in such settings (Shoval et al., 2000), whereas guide dog users find navigating busy areas particularly challenging (Bradley and Dunlop, 2002). Conversely, too few pedestrians can also be problematic, as quiet streets lack auditory cues and may require assistance from others (Sánchez and de la Torre, 2010).
Based on the above, we built a criteria system of preferences and strategies to evaluate mobility accessibility in terms of walking safety and convenience for VIPs. Accordingly, the street network, which is presented by a graph, is weighted by these considerations.
Defining urban accessibility for VIPs
Criteria implementation
WayType
The WayType criterion, that is, road type, depicted in Figure S1, characterizes the primary function of every graph edge in the urban environment and is defined according to OSM’s ‘highway’ tag. 1 Since this tag can store dozens of values, we divided this criterion into six classes reflecting road suitability for VIPs: from (1) = preferred to (6) = must avoid. For example, the ‘footway’ value will be the preferred class (1), defining a graph edge that is designed for pedestrian use only, and hence is ideal for VIPs use as it enhances their accessibility and safety. The ‘steps’ value, for example, is more challenging for VIPs – although commonly used by them and is therefore given the class less preferred (4), or neutral (3) if it has a ‘handrail = true’ tag. The ‘Service roads’ value is given the class must avoid (6), because it is mostly not regulated for walking (e.g. in industrial areas) and is often shared with cyclists and cars, hence imposing danger and risk for VIPs.
In addition, this criterion also considers edge properties related to accessibility. For example, for the ‘Footway = crossing’ tag, which represents a footway that serves as a crossing, the degree of control at the crossing is considered, for example, in case accessible aids and road markings exist, affecting the resulting class, and hence edge cost.
Vision impairment assistive landmarks
Human navigation is assisted by certain types of landmarks (Filomena and Verstegen, 2021). Similarly, local, permanent, and stationary landmarks, urban features with distinctive smells (e.g. bakeries), sounds and shapes traffic lights, trees, and bus stops, are meaningful elements that assist VIPs in wayfinding activities and for successful and more accessible navigation. These landmarks are defined as VIAL that decrease the graph edges’ cost if they are easily accessible and identifiable within several metres of a certain street segment (Tsuji et al., 2005). In the current implementation, all landmarks are given a similar cost, regardless of their type. This criterion is applied through supplementary OSM data as point landmarks (e.g. ‘shop = bakery’, ‘highway = bus_stop’) that are commonly found along or near street segments.
Equation (2) displays the mathematical process in which the VIAL criterion is applied
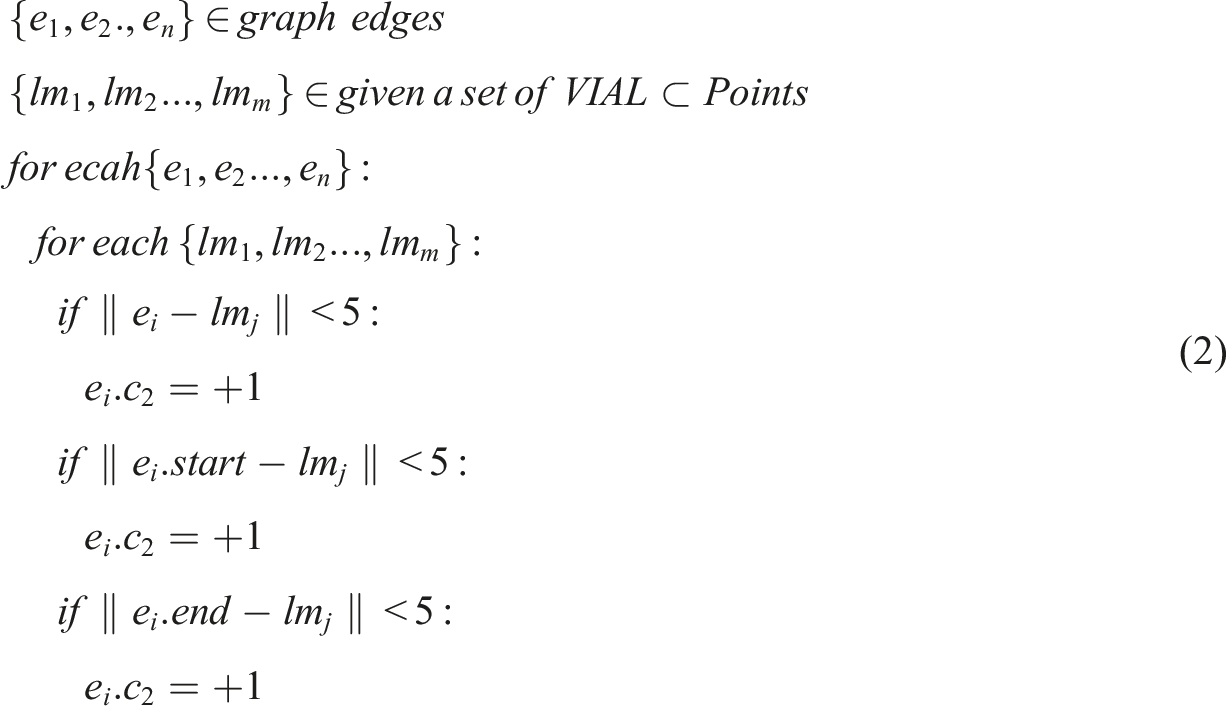
Each VIAL point (lm j ) within a distance of 5 m to a certain graph edge (e i ) increases the cost by 1 (e i .c 2 ). Threshold of 5 m can be considered in order to take into consideration landmarks that belong to building facades, such as supermarkets and bakeries, which are cognitively perceived by VIPs by smell and sound. Landmarks located near navigational decision points – mainly intersections – are recounted.
Path complexity
VIPs often struggle to navigate bending routes, as they can be challenging to orient and navigate through. It has been observed that the difficulty of navigation is positively correlated with the width of the angle between two consecutive street segments and the amount of bends. Therefore, we calculate the angle (α {0, π}) between the azimuth values of two consecutive adjacent segments for network edges that consist of more than one segment. Deviations from straightness are considered when angles are greater than or equal to 10 degrees, except for arcs that are composed of numerous short segments with small angles, which collectively form a substantial bend. Ultimately, the network edge cost is the sum of the calculated angles α.
Pedestrian activity levels
PAL affects the route choice of VIPs. According to Helbing and Johansson, 2009, five pedestrian traffic crowdedness levels exist, while (Golledge et al., 1991) found that VIPs experience these levels differently than seeing pedestrians, both in scale (termed here level) and sense. To quantify these levels, we adopted the findings of the Cohen and Dalyot (2020) that divided PAL quantification to three levels: • Level 1: sparse PAL, meaning that streets are empty, and pedestrians are walking more than 15 m apart, which is less optimal for VIPs, mainly in terms of possible assistance and orientation. • Level 2: medium PAL, meaning that pedestrians are walking within a distance of 15 m from one another. This level is considered as the optimal for VIPs, assuring they can move easily in terms of orientation and safety, and in terms of required assistance. • Level 3: dense PAL, meaning that a street is overcrowded, and pedestrians are walking within a distance of less than one metre from one another. This level is the least optimal and hence is not recommended for VIPs, as it does not allow them to move easily and safely.
Since PAL has spatio-temporal characteristics, it cannot be generated while relying solely on geometry and topology derived from the (static) OSM data. To calculate the cost value for this criterion, machine learning analytics were used to build a PAL prediction model. This model relies on the OSM data elements, that is, street network, land use, and amenities combined with temporal attributes, while using a large set of sample PAL data to train the model (Cohen et al., 2021).
Final weight calculation
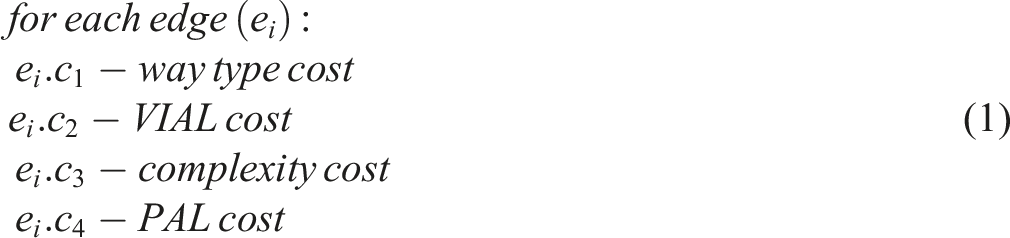
The last step in generating the weighted network graph is calculation of the final weight for every network edge, based on the aggregative costs derived from the criteria. The final weight is based on the WayType (c
1
), VIAL (c
2
) Complexity (c
3
) and
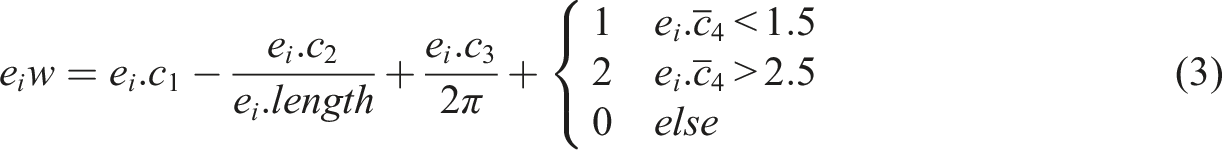
WayType is the most important criteria, since certain street types pose serious life-threatening issues to VIPs navigating the city (Cohen, 2017). Therefore, the WayType cost value is added to the final weight without any modification. Complexity and VIAL are normalized to account for the impact of walking distance: VIAL is divided by the edge length so that a short edge with several landmarks will be considered more accessible than a longer one with the same number of landmarks. Complexity is divided by 2π that is a permanent reference value that indicates a highly complex network edge. While the WayType and Complexity criteria increase the final weight, the landmark criterion decreases it, so its cost is added to the final weight by using negative values (− (minus) sign).
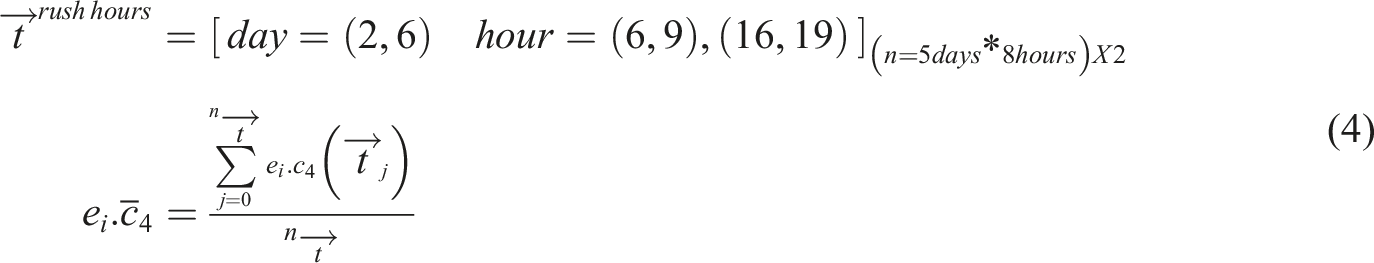
In terms of PAL, various c4 values can be obtained for one edge depending on the time-of-day and weekday. For example, during the morning hours, a street in a business district is usually very busy, so according to the prediction model its representative edge PAL value is 3. It is less busy in the afternoons, so the PAL value is 2, and it has sparse pedestrian activity at night and on weekends, so the calculated PAL value is 1. To simplify the number of edge weight values, for each graph edge an average PAL was calculated for rush hours only, as depicted in equation (4). Rush hours are defined between 06:00–10:00 and 16:00–19:00 on weekdays (Monday–Friday).
The worst PAL condition for VIPs is when a street is overcrowded, and therefore a PAL level larger than 2.5 will add 2 to the final edge weight. Streets with few people are also not optimal, yet it is somewhat better than an overcrowded street, thus cost value less than 1.5 will add 1 to the edge weight. The optimal case (a value between 1.5 and 2.5) does not change the final edge weight.
VIPs accessibility index
This section presents the formulation of the visuaLly impairEd Accessibility inDex (LEAD) that is aimed to bridge the knowledge gap in assessing urban mobility accessibility for VIPs. LEAD highlights the existing levels of urban mobility accessibility, allowing us to compare different regions, districts, neighbourhoods, and even entire cities. In addition, LEAD can quantitatively identify urban structures that improve or hinder safe and accessible mobility.
Two analytical indices that address different aspects of urban structure and pedestrian behaviour are presented as follows (e.g. Figure S2): (1) LEAD, a discrete method that is based on the graph edges (street segments) providing accessibility evaluation disregarding street’s topology and connectivity; (2) LEADR, a routing-oriented method, in which numerous routes are generated on the graph, and then the weight ratio between the optimal route (for VIPs) and the shortest route (commonly used by seeing pedestrians according to distance criterion only) is evaluated. With the LEADR, accessibility is not measured by the intensity of accessibility of an area according to its aggregated streets, but rather by the extent to which VIPs have equal access to their destinations.
Street-based method (LEAD)
The LEAD method is based on averaging the weights of all graph edges for a given area, according to equation (5). Graph edges that are shorter than 10 m are excluded from the analysis since they are mostly topological graph anomalies – and not tangible city streets. Accordingly, LEAD can be implemented for different urban scales, that is, spatial extent, where each is derived from the graph segments comprising the analysed area
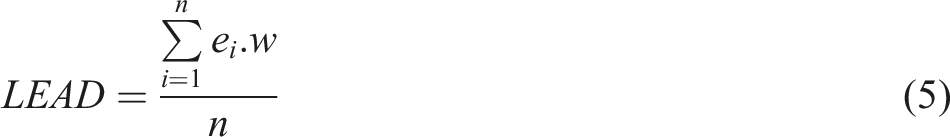
The lower the LEAD value the more accessible the area. Since we consider WayType (with range values of 1 and 6) to be the most influential criterion in LEAD, the resulting range of LEAD values is mostly between 0 and 9, whereas PAL and Complexity can increase the value and VIAL decreases it. Accordingly, LEAD value lower than 2 indicates very good accessibility for VIPs, meaning that the path is designed for pedestrians, having VIAL to assist the VIPs, while also showing geometrical low-Complexity, and optimal PAL, and thus supporting safe navigation in the area. A LEAD value between 2 and 5 indicates moderate accessibility, either because some streets are less or not accessible nor safe, or because some streets are too complex to navigate and/or the PAL is not optimal (either too high or too low). A LEAD value larger than 5 indicates an area with poor accessibility, having mostly inaccessible ways and complex streets, scarce VIAL along the streets, and mostly non-optimal PAL.
Figure S3 shows one example of the process implementation on Westminster’s streetscapes in greater London. Each panel displays the assessment outcomes of individual accessibility factors on the street segments (refer to Figure S3, panels (a) through (d)). These factors are then synthesized into a composite ‘final weight’ using equation (3), which considers the interplay of the various elements (Figure S3-panel (e)). Subsequently, the consolidated data is aggregated according to equation (4) and equation (5), enabling a coherent, overall evaluation of accessibility within the specified urban context (Figure S3-panel (f)).
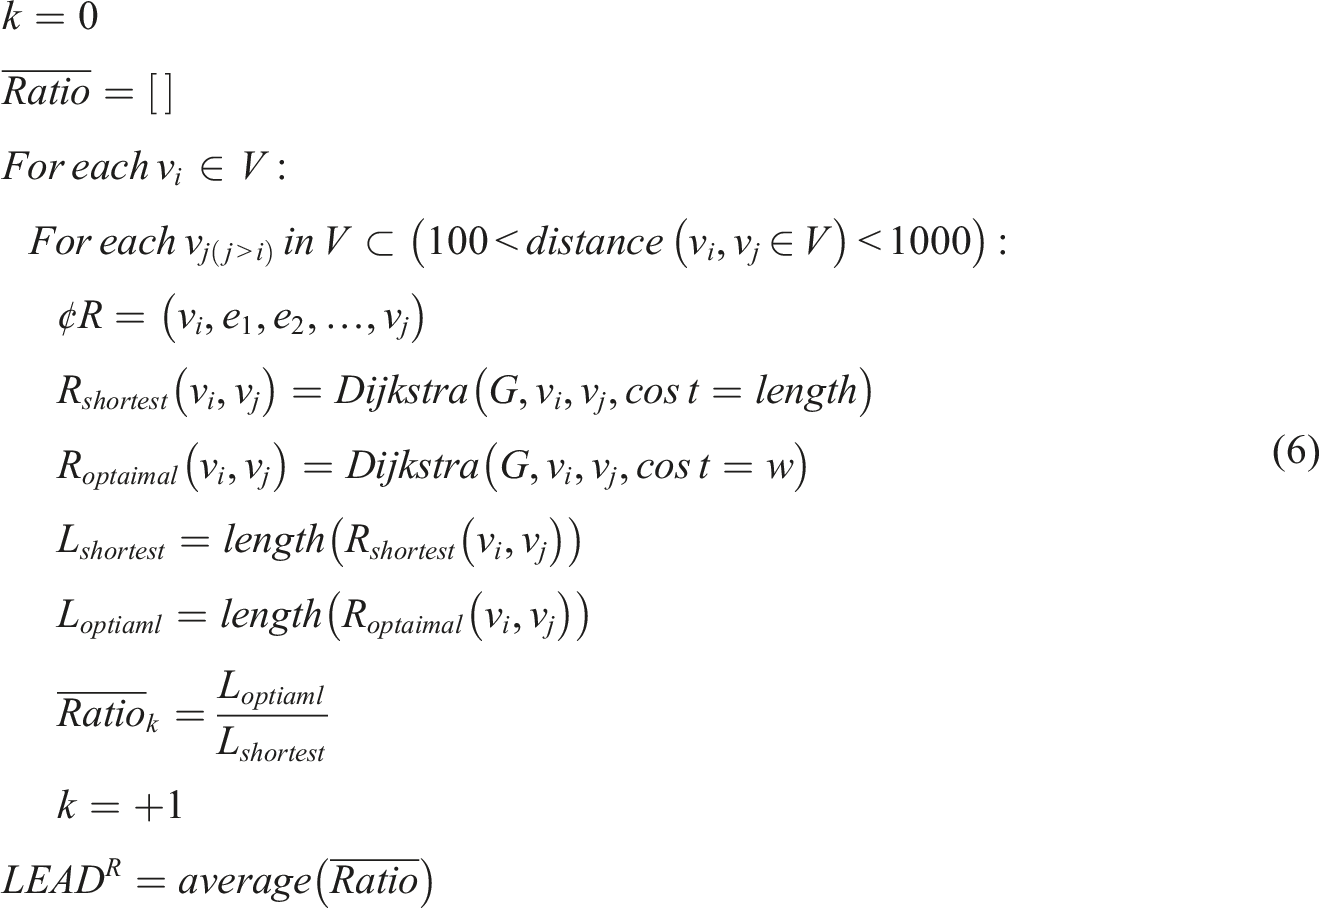
Route-based method (LEADR)
For all vertices in the graph, all possible routes are calculated using Dijkstra’s algorithm (Dijkstra, 1959) to all other vertices, as long as the route distance is between 100 and 1000 m. The 1000 m maximum threshold is derived from the ‘15-min city’ vision (Patrick Sisson, 2023), which is based on current research of city archetypes improving both living conditions and wellbeing of urban populations. The research found that daily urban necessities, for example, work, home, shops, entertainment, education, and healthcare should be allocated within a 15-min reach on foot from, for example, public-transport stations. We used the upper limit of the mean pedestrian walking speed, which is about 4 km per hour (Knoblauch et al., 1996; Polus et al., 1983), meaning that in 15 min a pedestrian walks a route of approximately 1000 m. We also excluded routes shorter than 100 m assuming that in short route lengths the optimal and shortest paths will be analogous, thus the accessibility index is meaningless, biasing the overall accessibility evaluation.
As shown in equation (6), for each pair of origin/destination vertices
Urban accessibility evaluation
The methodology steps conceptualized in the previous chapter are applied for Greater London to calculate the two accessibility indices. Greater London is chosen as a case study due to its vibrant mapping community (Haklay, 2010), which produces exceptionally detailed OSM data, making it an ideal focus for exploring urban socio-spatial dynamics (Ballatore and De Sabbata, 2018). In addition, London’s OSM (especially in Central London) stores numerous micro-mapping geographic elements, such as points of interest, shops and buildings, that play an important part for correct accessibility estimation (Rabiei-Dastjerdi et al., 2020). To implement the methodology, 421,107 street segments, 377,164 points, and 634,871 polygons were downloaded from OSM, and processed using Python programming language, mostly with the following Python packages: GeoPandas, NetworkX, and OSMnx. For data visualization, we used the ArcGIS Pro software.
Greater London
Greater London is a formal county of England that makes up most of the London region, covering 1,572 km2 and, as of 2023, is home to approximately 9.75 million people. 2 Greater London is organized into 33 local government districts – the 32 London boroughs and the City of London, which is located within the region but is separated from the county. The London boroughs were created by combining groups of former local government units called wards, so that each ward has an average electorate of about 5,500 people – 633 electoral wards in Greater London County. The LEAD is constructed and calculated for each borough and for each ward within the borough. Implementing LEADR is computationally consuming, such that only one exemplary borough – Barking and Dagenham – was chosen as case studies.
A street network was generated for each borough according to its bounding polygon (The Mayor of London, 2020). Using the Overpass API and the OSMnx python package, the desired streets within the borough boundaries were downloaded and modelled as an appropriate walking network. In total, 1,433,142 OSM street segments, points, and polygonal elements were used to implement the index.
LEAD
The first evaluation was performed using LEAD, which averages the street segments’ weight values using PAL level for rush hours on the borough scale. Since values are aggregated on a borough level, the differences of the LEAD values are not expected to be large (boroughs’ area is around 50 km2). The calculated LEAD values for all boroughs, depicted in Figure 1, are in the range of 2.22 and 3.74, showing that they are all within the medium accessibility level. It appears that the central London boroughs, such as the City of London, Westminster, Hammersmith and Fulham, and Kensington and Chelsea, are generally more accessible than those on the outskirts, such as Hillingdon, Richmond upon Thames, and Hounslow. LEAD classes for all London boroughs from relatively good accessibility (blue) to medium accessibility (red). The LEAD classification is produced using the Jenks Natural Break method (Jenks, 1967). Numbers depict borough ID (boroughs’ names and IDs are listed below). Projected CRS: EPSG:3857.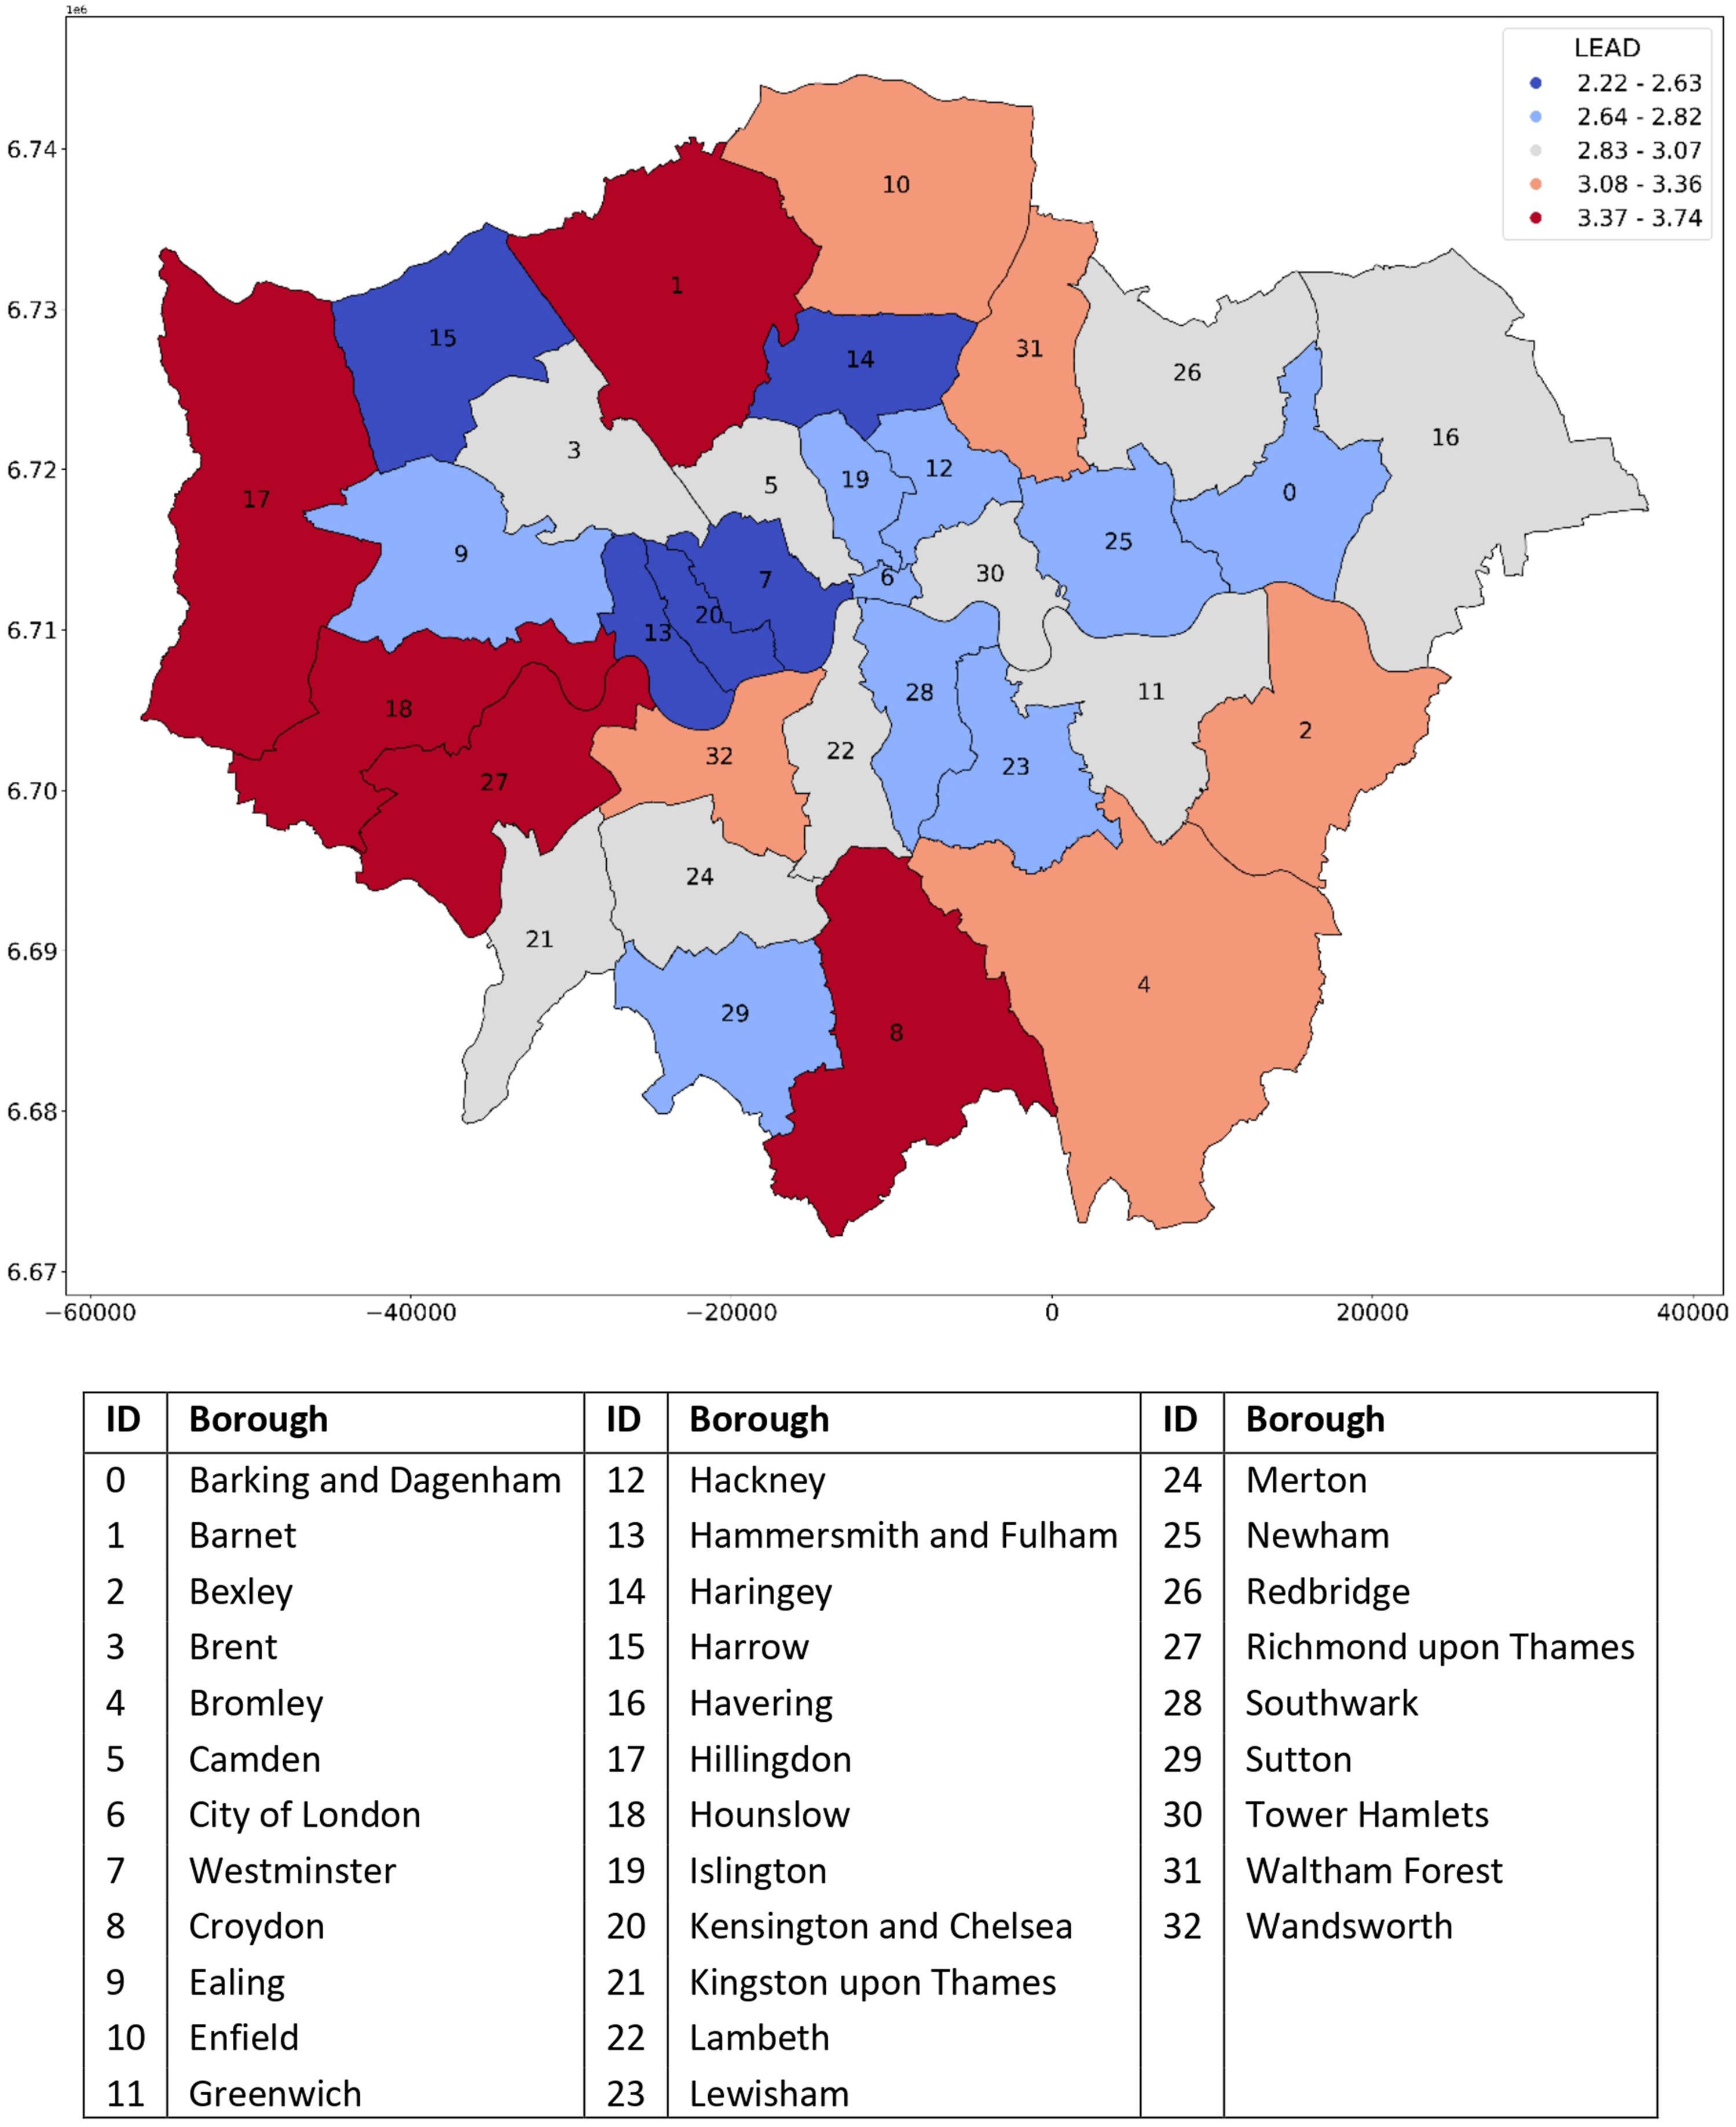
When comparing the average LEAD values for each class with the land use distribution across boroughs 3 . Table S1 displays these values alongside the average percentages of land use, including domestic buildings, domestic gardens, non-domestic buildings, and green spaces. As indicated in Table S1, classes with higher accessibility tend to have a higher density of dwellings (R2 = 0.993) and fewer green spaces (R2 = 0.993).
Richmond upon Thames (ID 27) is the least accessible borough (LEAD = 3.74). The poor LEAD value of Richmond upon Thames is somewhat surprising since this borough ranked in 2020 as London’s happiest place to live for the sixth year in a row.
4
In addition, Richmond upon Thames is one of London’s wealthiest boroughs on many measures.
5
Figure 2 clarifies the reason for the unexpected low LEAD value for this borough: it is approximately half parkland, meaning that large areas of London’s open spaces fall within its boundaries, including Richmond Park, Kew Gardens, Bushy Park, and Old Deer Park. The least accessible Richmond upon Thames’ wards with LEAD values close to 5 and the areas with high density of inaccessible segments are found within the boundaries of Richmond and Bushy Parks, depicted as red areas in the heat map (Figure 2). These parks are partly biological sites of special scientific interest designed for wildlife conservation, so extensive areas in these parks are intentionally undeveloped – and therefore mostly less accessible (e.g. ‘WayType = service’). Richmond upon Thames spatial extent and its ward boundaries (black polygons). The spatial distribution of land uses, and wards’ LEAD values (denoted by coloured circles according to the classification scheme introduced in Figure 1). Top Left – Heat map of poor accessible street segments (in red).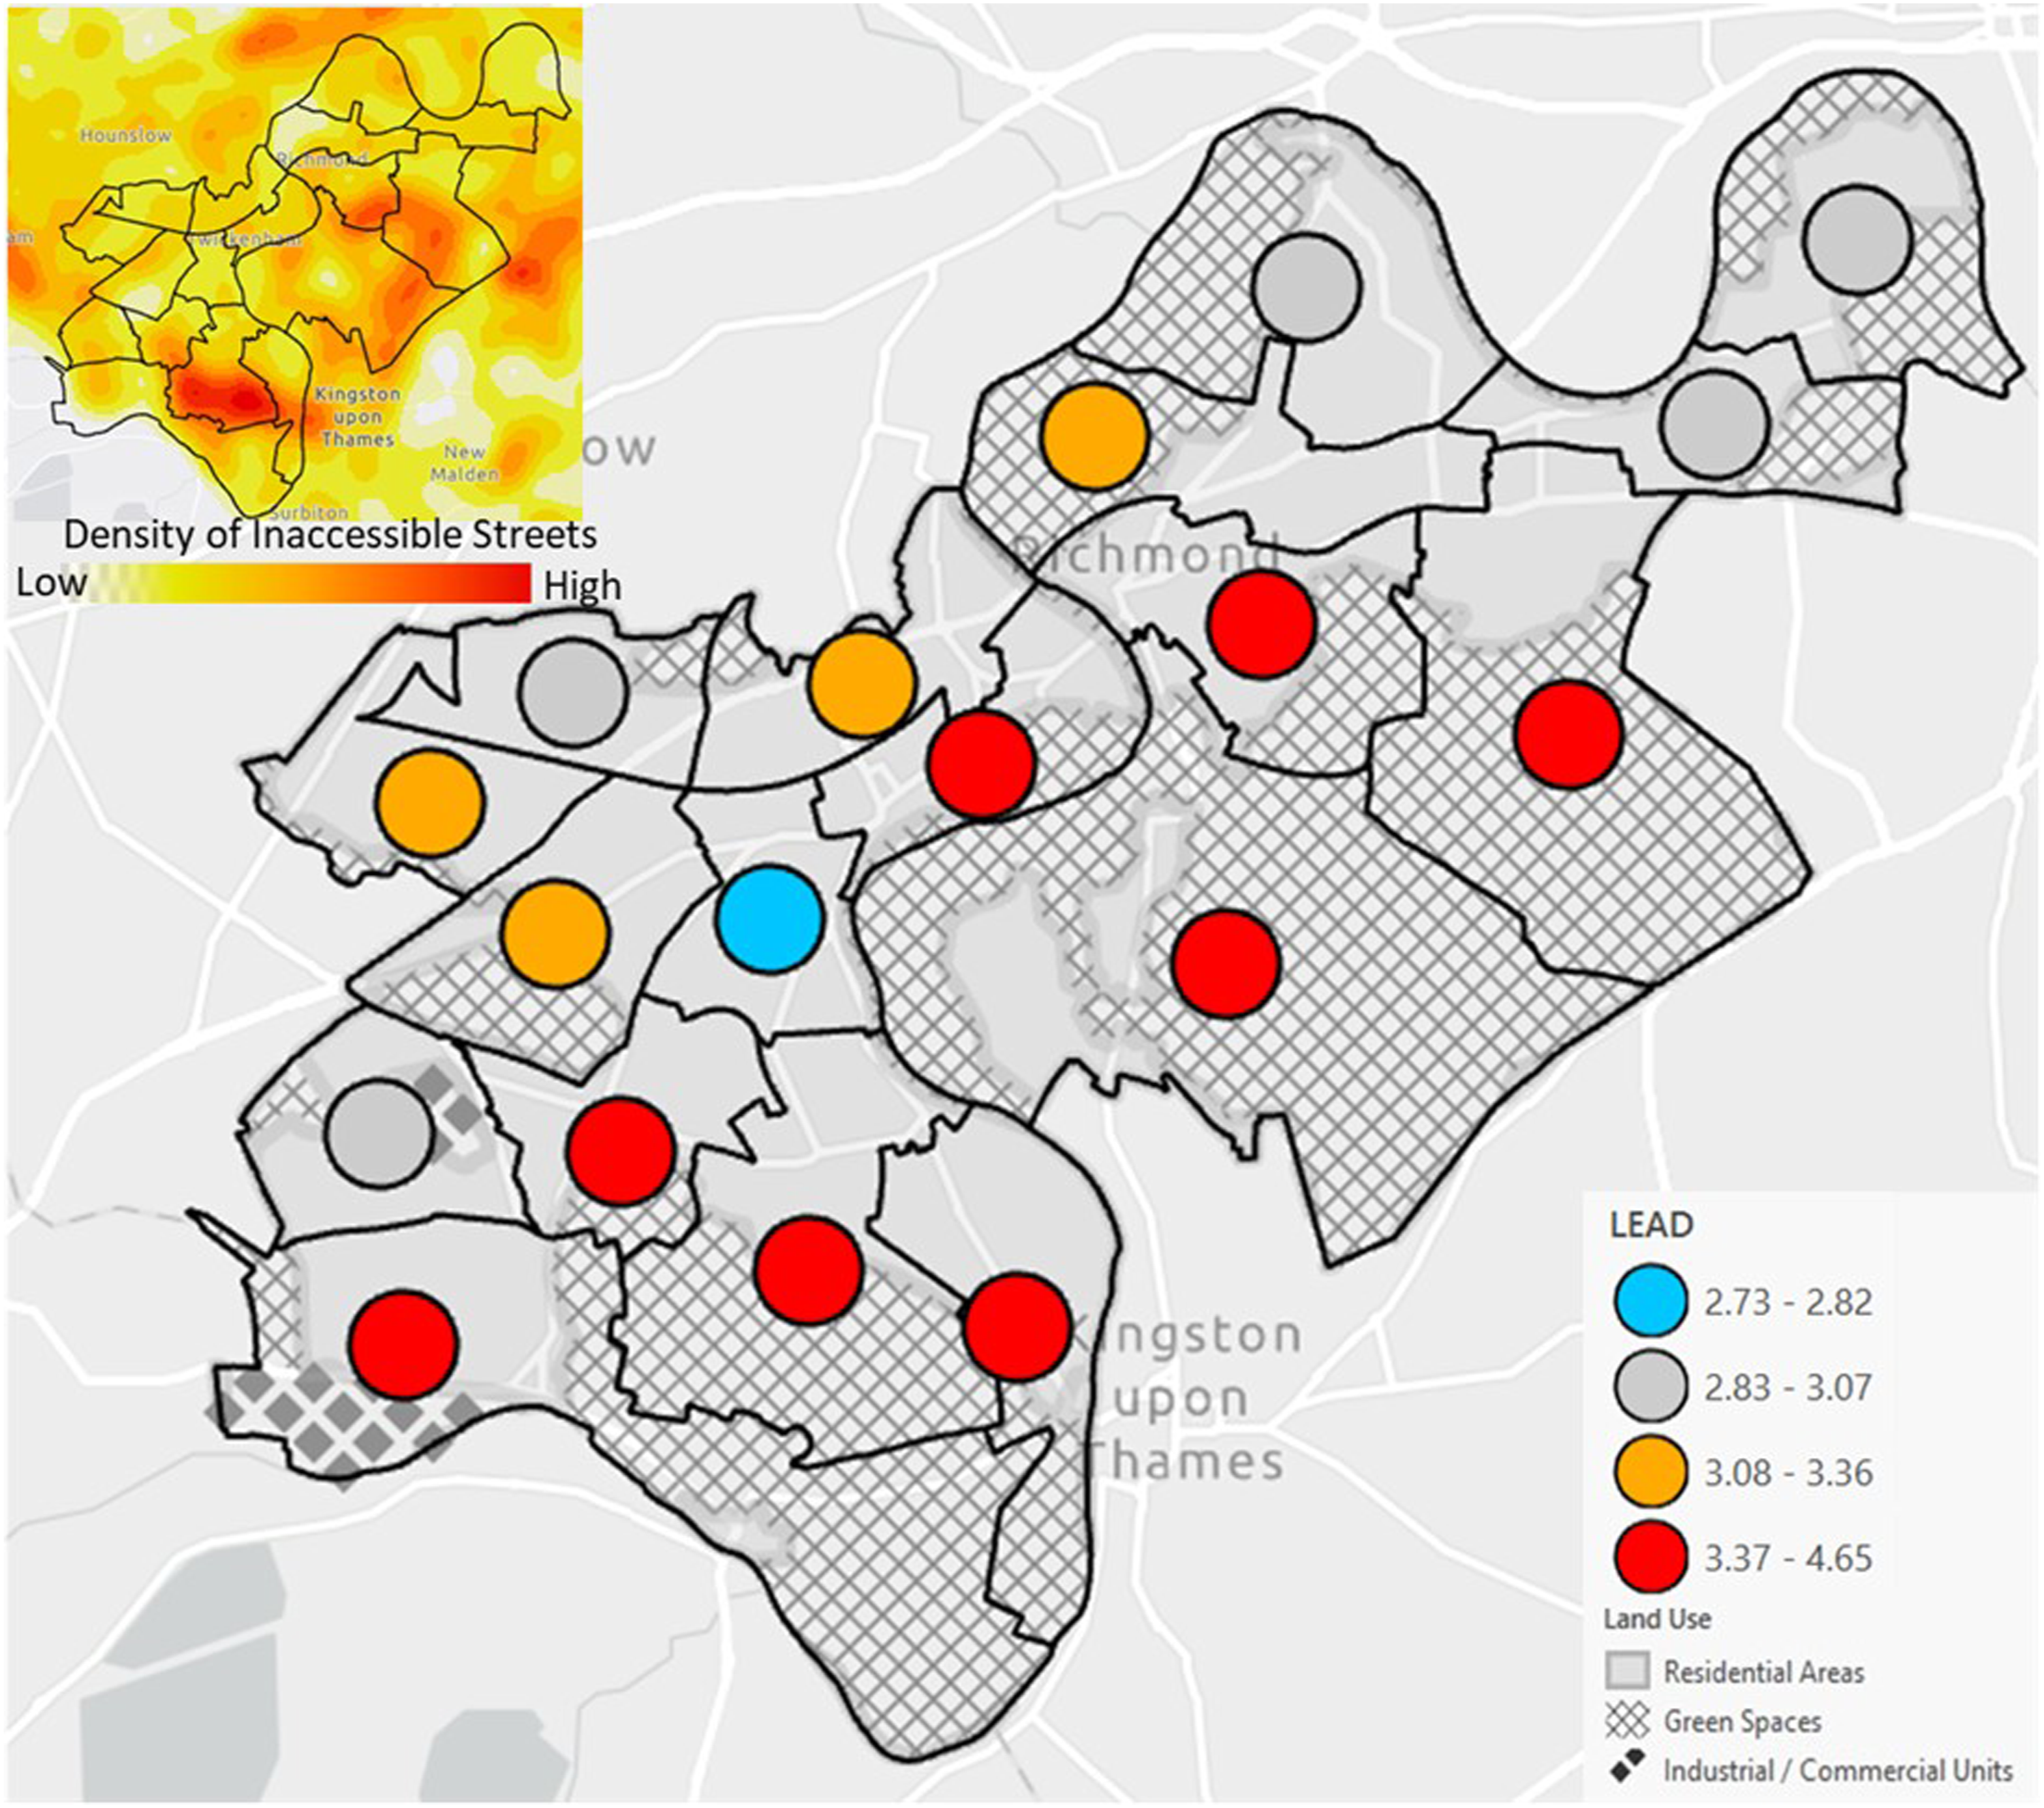
Kensington and Chelsea (ID 20) is the most accessible borough in Greater London (LEAD = 2.22). The borough is the second smallest after the City of London and is among the most densely populated cities in the world. It is a very popular tourist destination with a number of museums, historical sites, and universities. It includes affluent neighbourhoods, such as Notting Hill, Kensington, South Kensington, Chelsea, and Knightsbridge. Consequently, there are many landmarks in this area (0.008 landmarks per metre compared to 0.002 landmarks throughout London). The average pedestrian PAL is within the optimal range (1.693), 77% of street segments meet the preferred WayType criteria (score = 1), and 61% of the streets in this borough are considered very accessible (weight less than (2) compared to 33% for all of London. Figure 3 illustrates that 15 of 18 wards within its boundaries are rated in the top class (LEAD value) of accessibility. Kensington and Chelsea spatial extent and its ward boundaries (black polygons). The spatial distribution of land uses, and wards’ LEAD values (denoted by coloured circles). Top Left – Heat map of poor accessible street segments (in red).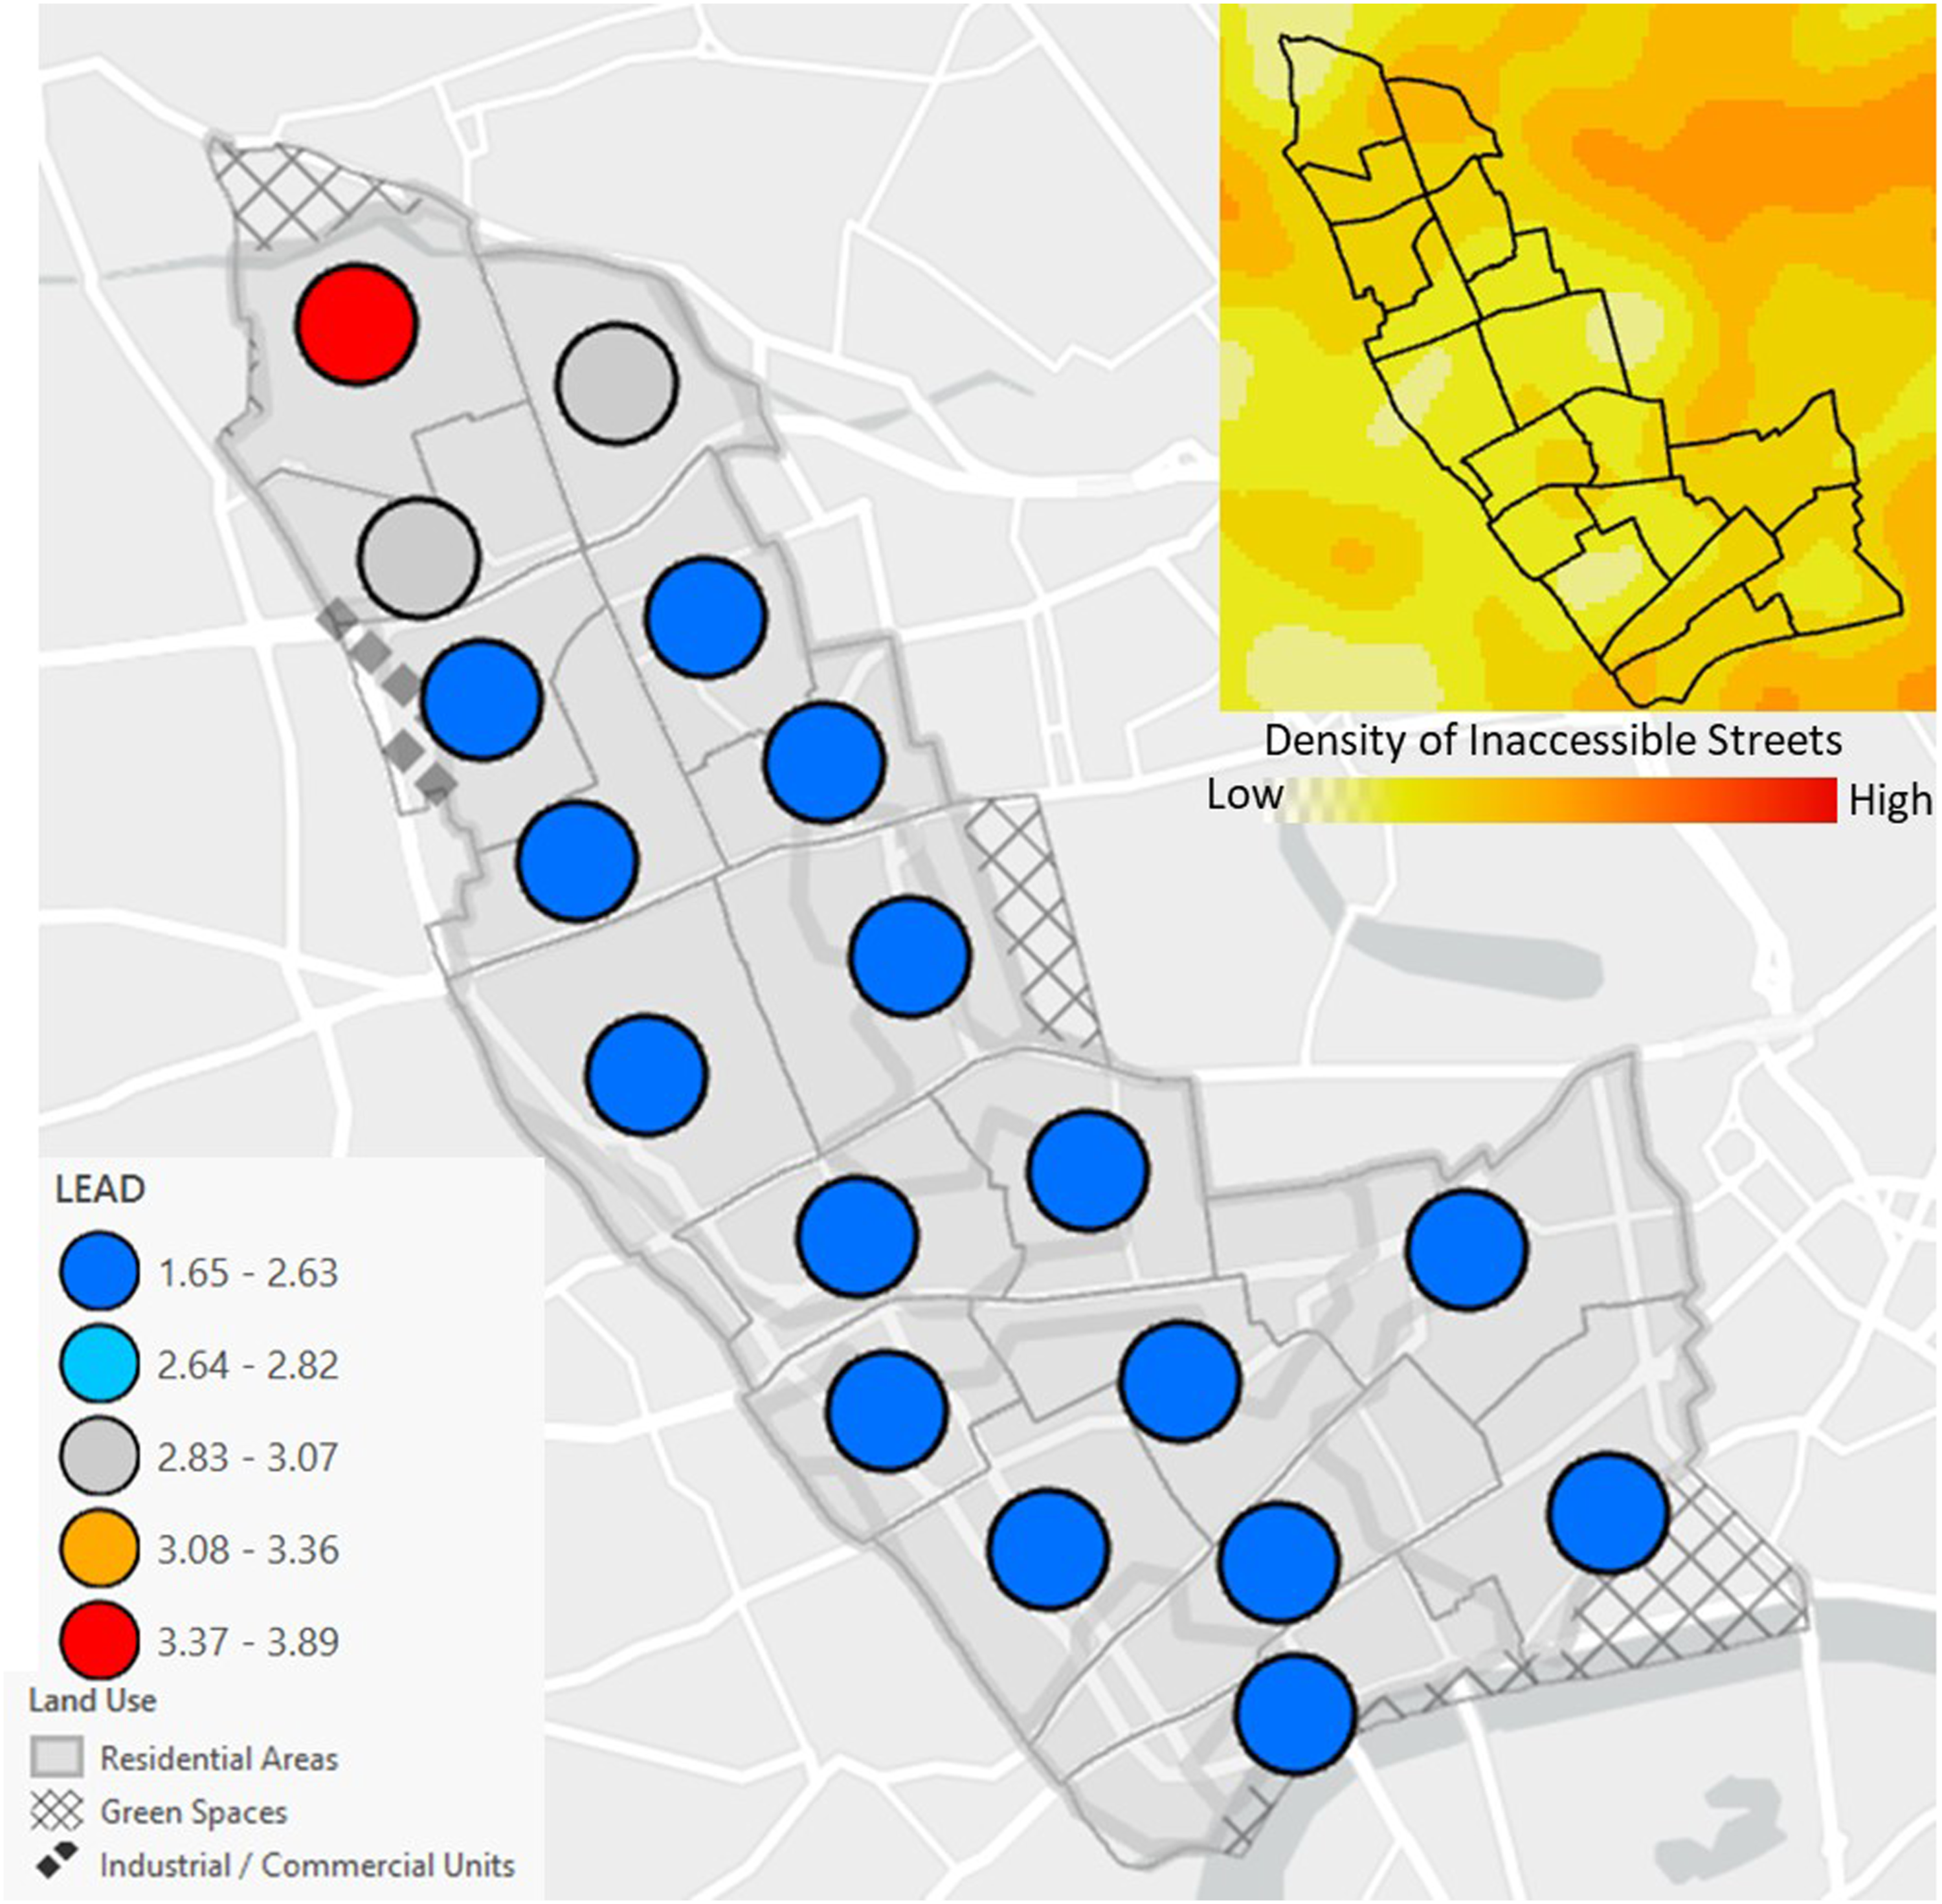
LEADR
751,134 shortest and optimal routes were calculated (more than 1.5 million in total) between each pair of intersections 100 to 1000 m distant from one another. The average length of the optimal routes is 1,315 m and the average weight is 40, while the average length of the shortest routes is 1,186 m and the average weight is 47. This shows that, in general, accessible routes in Barking and Dagenham are longer by 11%, but they are more accessible (in respect to our cost system by 17.5%) than the shortest ones.
For Barking and Dagenham wards (column B) – LEAD and LEAD R values (column B and C) and rankings (column D and E), as well as the differences between the rankings (column F).
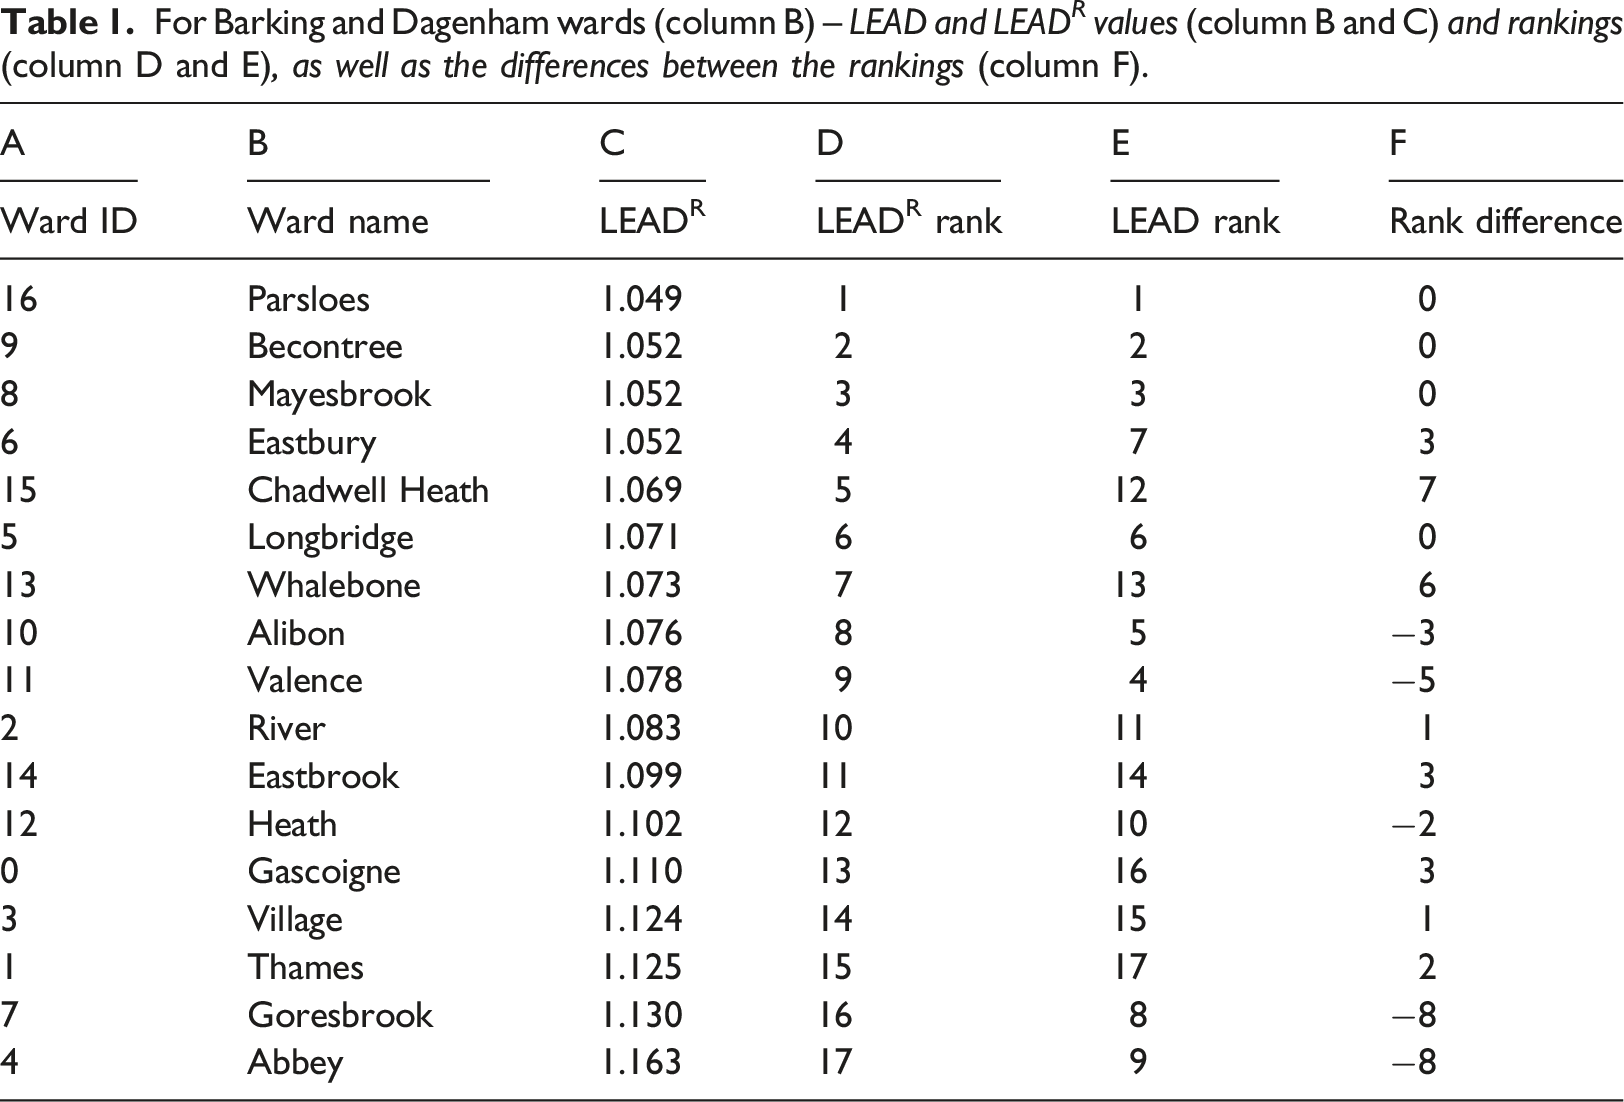
The highest improvement is seen in Ward 15 when using LEADR (ranked 5 compared to 12 in LEAD), which is due to its streets’ topology and structure: although 46% of the streets are considered with medium or bad accessibility (the average is 30%) they do not play a dominant role when calculating the shortest routes. This can be explained by looking at the centrality measure – betweenness 6 used in the Graph Theory and Network Analysis (Cooper, 2015). In Ward 15, inaccessible street segments have low betweenness values, whereas accessible street segments have high betweenness values. In contrast, Wards 7 and 4 rank the worst in LEADR accessibility estimation. Ward 4 receives its low ranking due to the opposite reason mentioned for Ward 7; namely, in many cases the inaccessible streets are also central streets, which makes an optimal route much longer. The poor accessibility evaluation for Ward 7 reveals a drawback with LEADR estimation. As explained in section 3.3.2, LEADR determines the accessibility index value by calculating the ratio between the shortest possible route and the optimal route lengths, regardless of the weight of the shortest routes. However, in Ward 7 many optimal routes are slightly more accessible than the shortest route, but much longer, and hence distort the overall accessibility of the ward.
Discussion
Using Greater London as a case study, this paper presents the results of LEAD for measuring urban accessibility for VIPs. LEAD functions well to detect local areas with either limited or good accessibility for VIPs. Implementing LEAD, most boroughs demonstrate medium accessibility levels with some variations. Most boroughs with relatively limited accessibility are located on the outskirts of the city. Alzouby et al. (2019) presented similar trend when measuring accessibility for disabled people in the Greater Irbid Municipality Area, Irbid. Parallel insights emerge from Stockton et al., 2016, which developed a walkability index for London, highlighting that central areas of London tend to be more walkable compared to peripheral zones. However, a comparison between our results, as illustrated in Figure 1, and theirs reveals that higher walkability does not necessarily mean improved accessibility.
LEAD shows that boroughs with more residential areas tend to be more accessible, in contrast to boroughs with large green public areas. The latter often incorporate shared pathways for pedestrians and other road users, thereby cultivating environments that are less accommodating and present heightened risks for VIPs. Therefore, neighbourhoods with a large number of green public spaces, commonly known for supporting residents’ wellbeing and happiness (Campisi et al., 2021), are generally less accessible to this community and prevent them from enjoying equal living conditions.
LEADR evaluation of Barking and Dagenham Borough shows similar results to LEAD evaluation, where the majority of streets are inaccessible or highly accessible. However, when the urban setting presents a wide range of accessibility levels, LEADR is particularly useful for determining the impact of streets with poor accessibility on navigation and orientation for the entire area. According to LEADR, a region can still be considered accessible if: (1) streets that are less accessible are short and sporadic throughout the region; thus, LEADR is likely to find an accessible alternative route that is not much longer than the shortest one, or (2) inaccessible streets are clustered in a less central part of the region; as a result, their impact on the calculation of LEADR is minimal.
Despite LEADR’s novel routing-oriented approach to calculating accessibility, it still suffers from a number of limitations. One limitation is that LEADR observes relative accessibility levels among the given regions, but it does not clarify whether the regions are indeed accessible. Currently, no previous research has examined how much longer a VIPs is willing to walk a safer and more accessible route instead of the shortest one that might impose danger. Regarding sighted people’s views, Huang et al. (2014) compared comfort to shortest routes and found that pedestrians are willing to take a more comfortable route if it is less than 8.8% longer than the shortest; however, the authors note that this value varies according to the individual. Thus, one conclusion is that Barking and Dagenham have 10 out of 16 wards (Table 1) that should be considered accessible. Another limitation emerges in cases where LEADR fails to provide accurate estimation (section 4.3); one solution can be to integrate the weight ratio between the optimal and shortest route in LEADR. Another, more technical limitation, is that LEADR requires heavy computing resources, such that parallel computing approach should be applied for analysing large areas (e.g. cities and countries).
The results demonstrate the differences between two analytical indices that aim to assess VIPs accessibility. The best index to use will depend on the specific needs of the user. If one is interested in a general and more global evaluation that disregards the urban structure (such as street connectivity), LEAD should be suitable for the task. When interested in determining how easily and safely VIPs can navigate in a given urban space (e.g. neighbourhood), LEADR will provide the information, while pointing to possible street network problems.
OSM data were found to be valuable for accessibility and to plan strategies at a larger scale, such as on the metropolitan level or to compare entire cities. Yet, the indices, to a large extent, depend on the quality of OSM data – the geometric completeness of the mapping and availability of elements, as well as the correctness of the associated tags. Since some mapping issues do exist, even for Greater London, future applications can suggest including the development of ML models to complete missing data and verify the correctness of the associated tags.
LEAD and LEADR differ not only technically but also conceptually, in terms of how accessibility should be addressed in urban areas. On one hand, there is a practical perspective (Gharebaghi et al., 2018) that suggests designing and developing our environment so VIPs can move easily and safely between places, even if some small and unconnected streets remain inaccessible. A more realistic approach would be to analyse only streets connecting VIPs destinations, such as transit stops and rehabilitation centres, and enhance accessibility in such areas to minimize the optimal route’s length. Though, it is doubtful that this perspective reflects the aim of inclusive city vision (Espino, 2009), or the commitment of countries to ensure equal access to urban streets and services. Meaning that as long as sighted people are permitted access, VIPs should not be excluded, so accessibility should be evaluated in that light. For the future, a holistic accessibility index should be formed that will consider the accessibility of all mobility disabled groups, such as the LEAD and LEADR proposed here, to provide a more comprehensive and accurate understanding of city design and planning.
Conclusions
This study introduces a universal framework for evaluating urban walkability with a focus on VIPs, leveraging open-source geospatial data. It aims to enhance our understanding of urban design’s impact on the mobility, safety, and lifestyle of VIPs, offering valuable insights for creating more inclusive and navigable cities. The research not only aids urban planners and policymakers in improving city accessibility but also supports the geospatial volunteer community in enhancing services for people with disabilities. Additionally, the findings have broader implications, potentially benefiting other groups with mobility issues, such as elderly people and wheelchair users, thereby extending the research social impact.
Supplemental Material
Supplemental Material - How accessible are cities for visually impaired pedestrians? A case of Greater London
Supplemental Material for How accessible are cities for visually impaired pedestrians? A case of Greater London in Achituv Cohen, Sagi Dalyot, Asya Natapov, and Trisalyn Nelson in Environment and Planning B: Urban Analytics and City Science
Footnotes
Declaration of conflicting interests
The author(s) declared no potential conflicts of interest with respect to the research, authorship, and/or publication of this article.
Funding
The author(s) received no financial support for the research, authorship, and/or publication of this article.
Data availability statement
The code used to implement the methodology described in this study is available in the following repository: GitHub. The GIS files created for the LEAD and LEADR indices are stored at this Google Drive link.
Supplemental Material
Supplemental material for this article is available online.
Notes
References
Supplementary Material
Please find the following supplemental material available below.
For Open Access articles published under a Creative Commons License, all supplemental material carries the same license as the article it is associated with.
For non-Open Access articles published, all supplemental material carries a non-exclusive license, and permission requests for re-use of supplemental material or any part of supplemental material shall be sent directly to the copyright owner as specified in the copyright notice associated with the article.