
Abstract
With a population of more than 120 million people, most Mexican cities suffer from socioeconomic inequalities and these are worsened by spatial inequalities resulting from their urban form and structure. A number of studies have been published looking at limited public services and how this may affect those on lower incomes in Mexico. However, very few studies have used spatial accessibility as a means of explaining urban inequalities and informing city planning. Spatial accessibility is defined as the measurable geographical access from residential locations to destinations for services and public goods. This paper investigates the potential of a spatial accessibility index to provide evidence for making location/planning decisions that benefit the largest number of residents. To achieve this aim, we combine three geographical secondary data sets with geospatial analysis. First, two important urban public services, i.e. health and education, are located, and catchment areas are then generated according to their respective sizes. For the second set, the integration values of each city at metropolitan and district scales are calculated using Space Syntax to observe how its configuration may influence the distribution of activities and the way the inhabitants live and move. The third set is demographic data from the 2010 national census of Population and Housing, analysed at the residential block level. This paper focuses on the results of combining two accessibility indices (cumulative opportunities and Space Syntax’s integration value) that examine the degree to which the lack of a basic public service could be associated with the spatial segregation of an area to provide evidence (comprehensible by decision-makers) for making location and planning decisions that benefit the largest number of residents.
Introduction
During the 2012 Sixth-year Presidential Address, Felipe Calderon Hinojosa remarked that a major achievement of his administration was complete population coverage for two basic public services: elementary education and health (Notimex, 2012). For education, this statement meant that the supply of pupil places in all elementary schools adequately covered the demand of children enrolling. In terms of health, the declaration was even more daring: the whole Mexican population would be able to access all levels of health service, from primary healthcare service (general practitioners (GPs)), to clinics and even hospitals (Notimex, 2012). Again, the statement was referring to all people enrolled in any of the three tiers of the public health system available in Mexico.
International organizations such as the OECD confirmed the first achievement: elementary school supply had reached almost 100% coverage and all compulsory educational levels (consisting of preschool, middle-school and high school) was around 90% (Santiago et al., 2012: 20). However, this was not the case with healthcare provision by 2017: when OECD compared the Mexican system with other countries, Mexico’s coverage was not only below the average, but nowhere near the full coverage claimed by President Calderon (OECD, 2017: 2).
Inequalities in access to the services and resources of cities are a global phenomenon (Weiss et al., 2018) and Mexico is not an exception. The aim of this paper is to assess the Mexican situation and evaluate these statements for health and education using large secondary data sets. We selected the 21 largest Mexican Metropolitan areas and investigated the extent to which 100% population coverage in education and health provision has been achieved based on Federal regulations related to the coverage area.
Spatial or distributive justice
The concept of justice applied to the city or spatial justice has been discussed extensively since Lefebvre’s Right to the City and more recently Harvey’s (2009) Social Justice and the City. Two of the main discussants, Peter Marcuse and Edward Soja, have attempted to define how this idea can be comprehended and applied to the city, while aiming for a public policy towards a ‘fair distribution of benefits and mitigating disadvantage’ (Fainstein, 2009: 4). Marcuse affirms that there are two ‘forms of spatial injustice: involuntary confinement and unequal allocation of resources across space’ (Iveson, 2011: 252). This idea can be complemented with Soja’s assertions of forms of spatial injustice: ‘locational discrimination, the political organization of space and the unequal distributive outcomes of capitalist urbanization’ (Iveson, 2011: 253).
Although both scholars are concerned with the idea of a just city, each of them focuses on different (but complementary) themes. On the one hand, Marcuse observes that the idea of a just city fails because it focuses on the notion of justice as a distributive outcome, whereas a broader concept should be the complete development of every single inhabitant, despite unequal allocation of resources over space (Marcuse, 2009). On the other hand, Soja (2011) is more interested in using the spatial factor as an explanatory variable to ‘add new and interesting strengths and strategies to justice struggles of all kinds, and especially to the building of cohesive, lasting and innovative coalitions across divisive lines of class, race and gender’ (262). Reinforcing this idea, it has been demonstrated that social segregation and inequality are amplified by the spatial factor: ‘spatial isolation seems to have a role in exacerbating the effects of poverty and isolation, as residents are not only socially but also spatially cut off from jobs, networks, institutions and facilities’ (Eijk, 2010: 6).
These ideas are essential for the development of our paper as we measure the degree of universal coverage of resources in relation to spatial integration of residential areas (census blocks) and compare the outcomes across different services for a range of Mexican cities.
Accessibility as a way of measuring spatial justice
As suggested in the previous section, spatial justice is associated with the spatial distribution of resources and opportunities in cities, i.e. the limitations that residents face in accessing their essential or preferred urban services. When access to resources is limited or even non-existent, it can be seen as a social injustice because it is a barrier to improving the quality of life of the inhabitants (Macedo and Haddad, 2016; Rodrigue et al., 2009; Thiam et al., 2015; Weiss et al., 2018). The reduction of this and other types of inequalities has been a major theme on the global agenda for years, resulting in the United Nations considering it as a transversal term in the 17 goals to transform the world for 2030 (United Nations, 2015), putting ‘them at the base of any national strategy against poverty and socio-economic development’ (Thiam et al., 2015: 48). Besides being a transversal term, Goal 11 (Make cities inclusive, safe, resilient and sustainable) is more specific about the objective that all cities should provide ‘opportunities for all, with access to basic services, energy, housing, transportation and more’ (United Nations, 2015). Here, we adopt the definition of accessibility as the ‘ease with which a certain site (destination) can be reached, from other points in the territory (origins), so it synthesizes the opportunities for contact and interaction between certain origins and destinations’ (Goodall in Garrocho and Campos Alanís, 2006: 353). It is notable that this broad definition refers to the probabilities for interaction (based on physical distance) rather than the actual use or demand of the urban service. Thus, with the former, it is possible to observe the potential for place accessibility while the later can be represented with a real or personal accessibility index.
Garrocho and Campos Alanís (2006) have grouped different types of indices into five categories: spatial separation, cumulative opportunities, spatial interaction, utility-based and time-space. Each of them presents different trade-offs between different types of data, the simplicity of the index and the sophistication of the interaction between origins and destinations (Handy and Clifton, 2001). These indices have been well-described and discussed extensively in the available literature (Bhat et al., 2000; Geurs and Eck, 2001; Geurs and Wee, 2004; Handy and Clifton, 2001; Handy and Niemeier, 1997). Therefore, we have used two criteria to select the type of measurement to be developed in this paper. The first is based on the notion that a model is a simplified representation of reality; therefore, the kind of data (location of services and urban form) to be included should be the necessary ones to support our main argument. The second criterion is a range of characteristics for the possible indices that we could use, i.e. a solid theoretical basis, ease with which the measure can be used in practice, direct comparability of the results for different areas (without the need of a second calibration), possibility of a graphic representation, interpretability and ease of communication.
To reduce the social and economic injustices of Mexican cities, a network of Urban Observatories was created in 2005 to design indicators that could help to tackle this problem. One of these indicators was an accessibility index to public services that could help the authorities to improve the population’s wellness, especially for vulnerable groups (Garrocho and Campos Alanís, 2006). A number of studies have been published looking at the improper provision or location of public services and how it may affect those on lower incomes. However, very few studies in Mexico have used potential spatial accessibility as a means of understanding urban inequalities or as a tool for improving city planning.
Methodology and data sets
It is important here to clarify the implications of access to public urban services in Mexico: every citizen has the Constitutional right to use both services (health and education) free of charge at the point of use. In terms of education, it is compulsory for everyone to attend from preschool until high school (‘Basic Education’ in the Mexican education system). The criterion used by authorities to assign GPs (also Family Medicine Units, Health Centres and Family Clinics, depending on which one of the three public health systems is available) and pupils to schools is proximity of the service to home address. However, in the case of education, families are allowed to register their children at a school closer to their parents’ workplace, or to relatives that help take care of their children during working hours, or if the quality of the selected school is better than the nearest school.
To investigate the first objective of examining the spatial coverage of education and health services (according to the Mexican regulations), a Cumulative Opportunities Index was implemented. This index enumerates the number of facilities within a given distance (or travel time), providing an indication of the range available to residents (Handy and Clifton, 2001: 68). For the purpose of this research, we implemented a variation of the index: the origins are locations of schools or medical clinics and the destinations or ‘catchment areas’ are the residential blocks surrounding each facility.
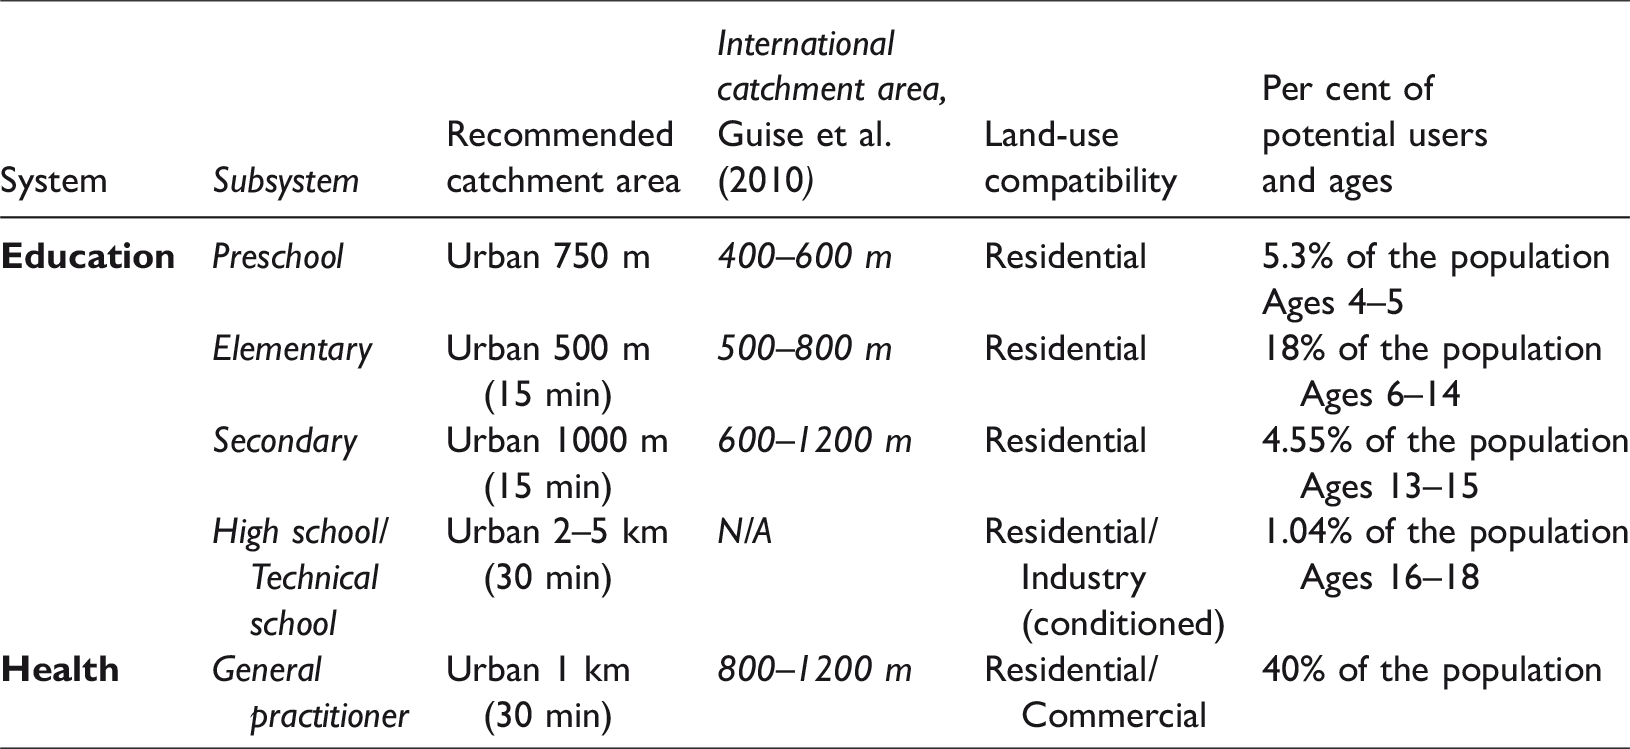
To correspond to the official criteria for the provision of these urban services, we used the catchment areas recommended in the Urban Service’s Regulatory System published by the Social Development Secretariat (SEDESOL, 1999). The catchment areas were designed without considering the capacity of each facility and logistic constraints for its users, providing only an estimate of physical access. Table 1 presents a summary for the two service systems (education and health) with the three main features of interest: recommended catchment area, land-use compatibility and potential users (as a percentage of the whole population). Since we used catchment area as one of our variables, we included a frequently used standard proposed by Guise et al. (2010) to examine whether Mexican regulations are within international standards.
Urban service’s regulatory system for Mexican cities (SEDESOL, 1999).
Using the official ‘Recommended catchment area’ and identifying each type of service for the 21 cities, we created service areas for each facility covering the blocks that can be reached within the distance specified in the street network as shown in Figure 1 for the city of Oaxaca. The census block centroids that fell within 1000 metres (30 minutes travel time) from each health GP facility were classified as being served in terms of primary healthcare. The same process was repeated for each city and for each subsystem of education.
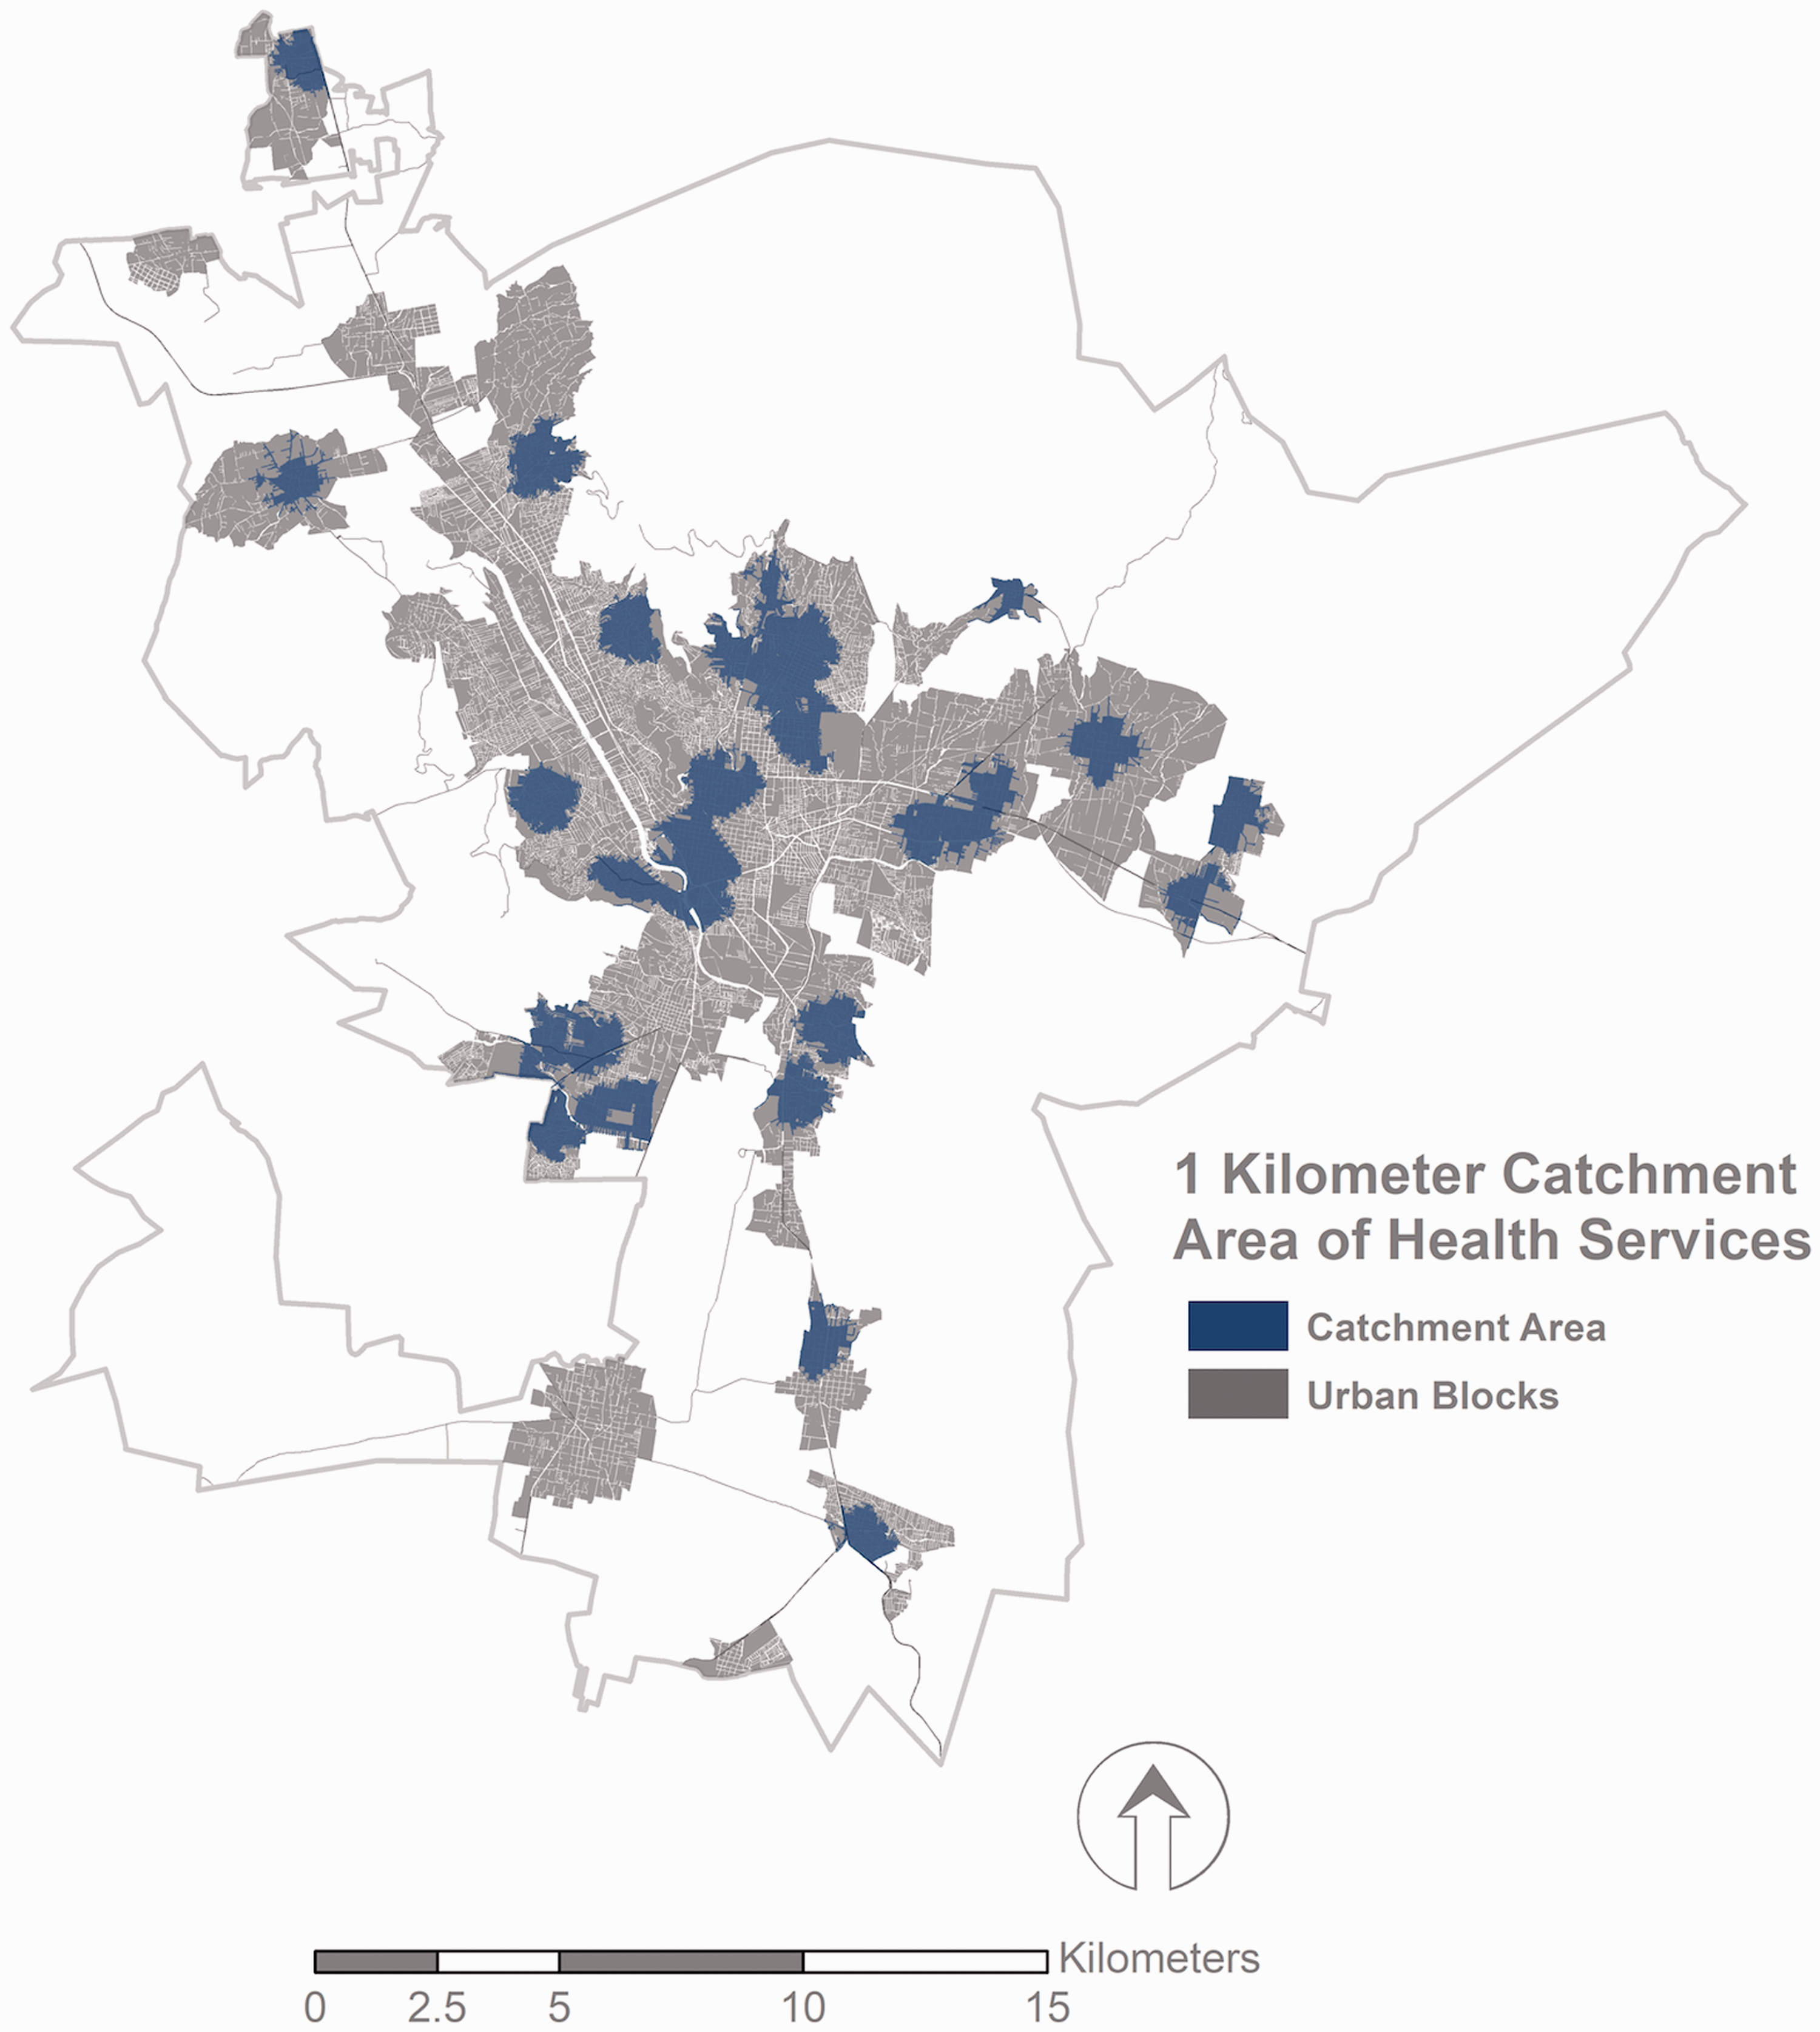
Population density and catchment area of 1000 metres for primary healthcare (GPs) for Oaxaca. Maps prepared by the authors using open data from The National Institute of Statistics and Geography (INEGI).
The second accessibility index calculated here was the Integration value according to Space Syntax. This index is calculated from the shortest routes in a network resulting from the underlying planar graph of the physical connections (Batty, 2009: 192). This index can also be considered as a variation of the Spatial Separation group because it measures the relative nearness of each component of the street network. It has been demonstrated in the relevant literature that the Integration value can be taken as a potential indicator of attraction for each line, with urban implications such as the movement around the city, land-use location decisions, land value, safety and security (Hillier and Vaughan, 2007). Figure 2 shows the Global Integration Index by street segment for the city of Oaxaca. The centre of the urban fabric is the most integrated, indicated by red lines and higher values. The global integration values decrease along a gradient, reaching the most segregated areas (lines in blue). The global integration index was calculated for each city separately, given the computational constraints resulting from the large number of segments within each city.
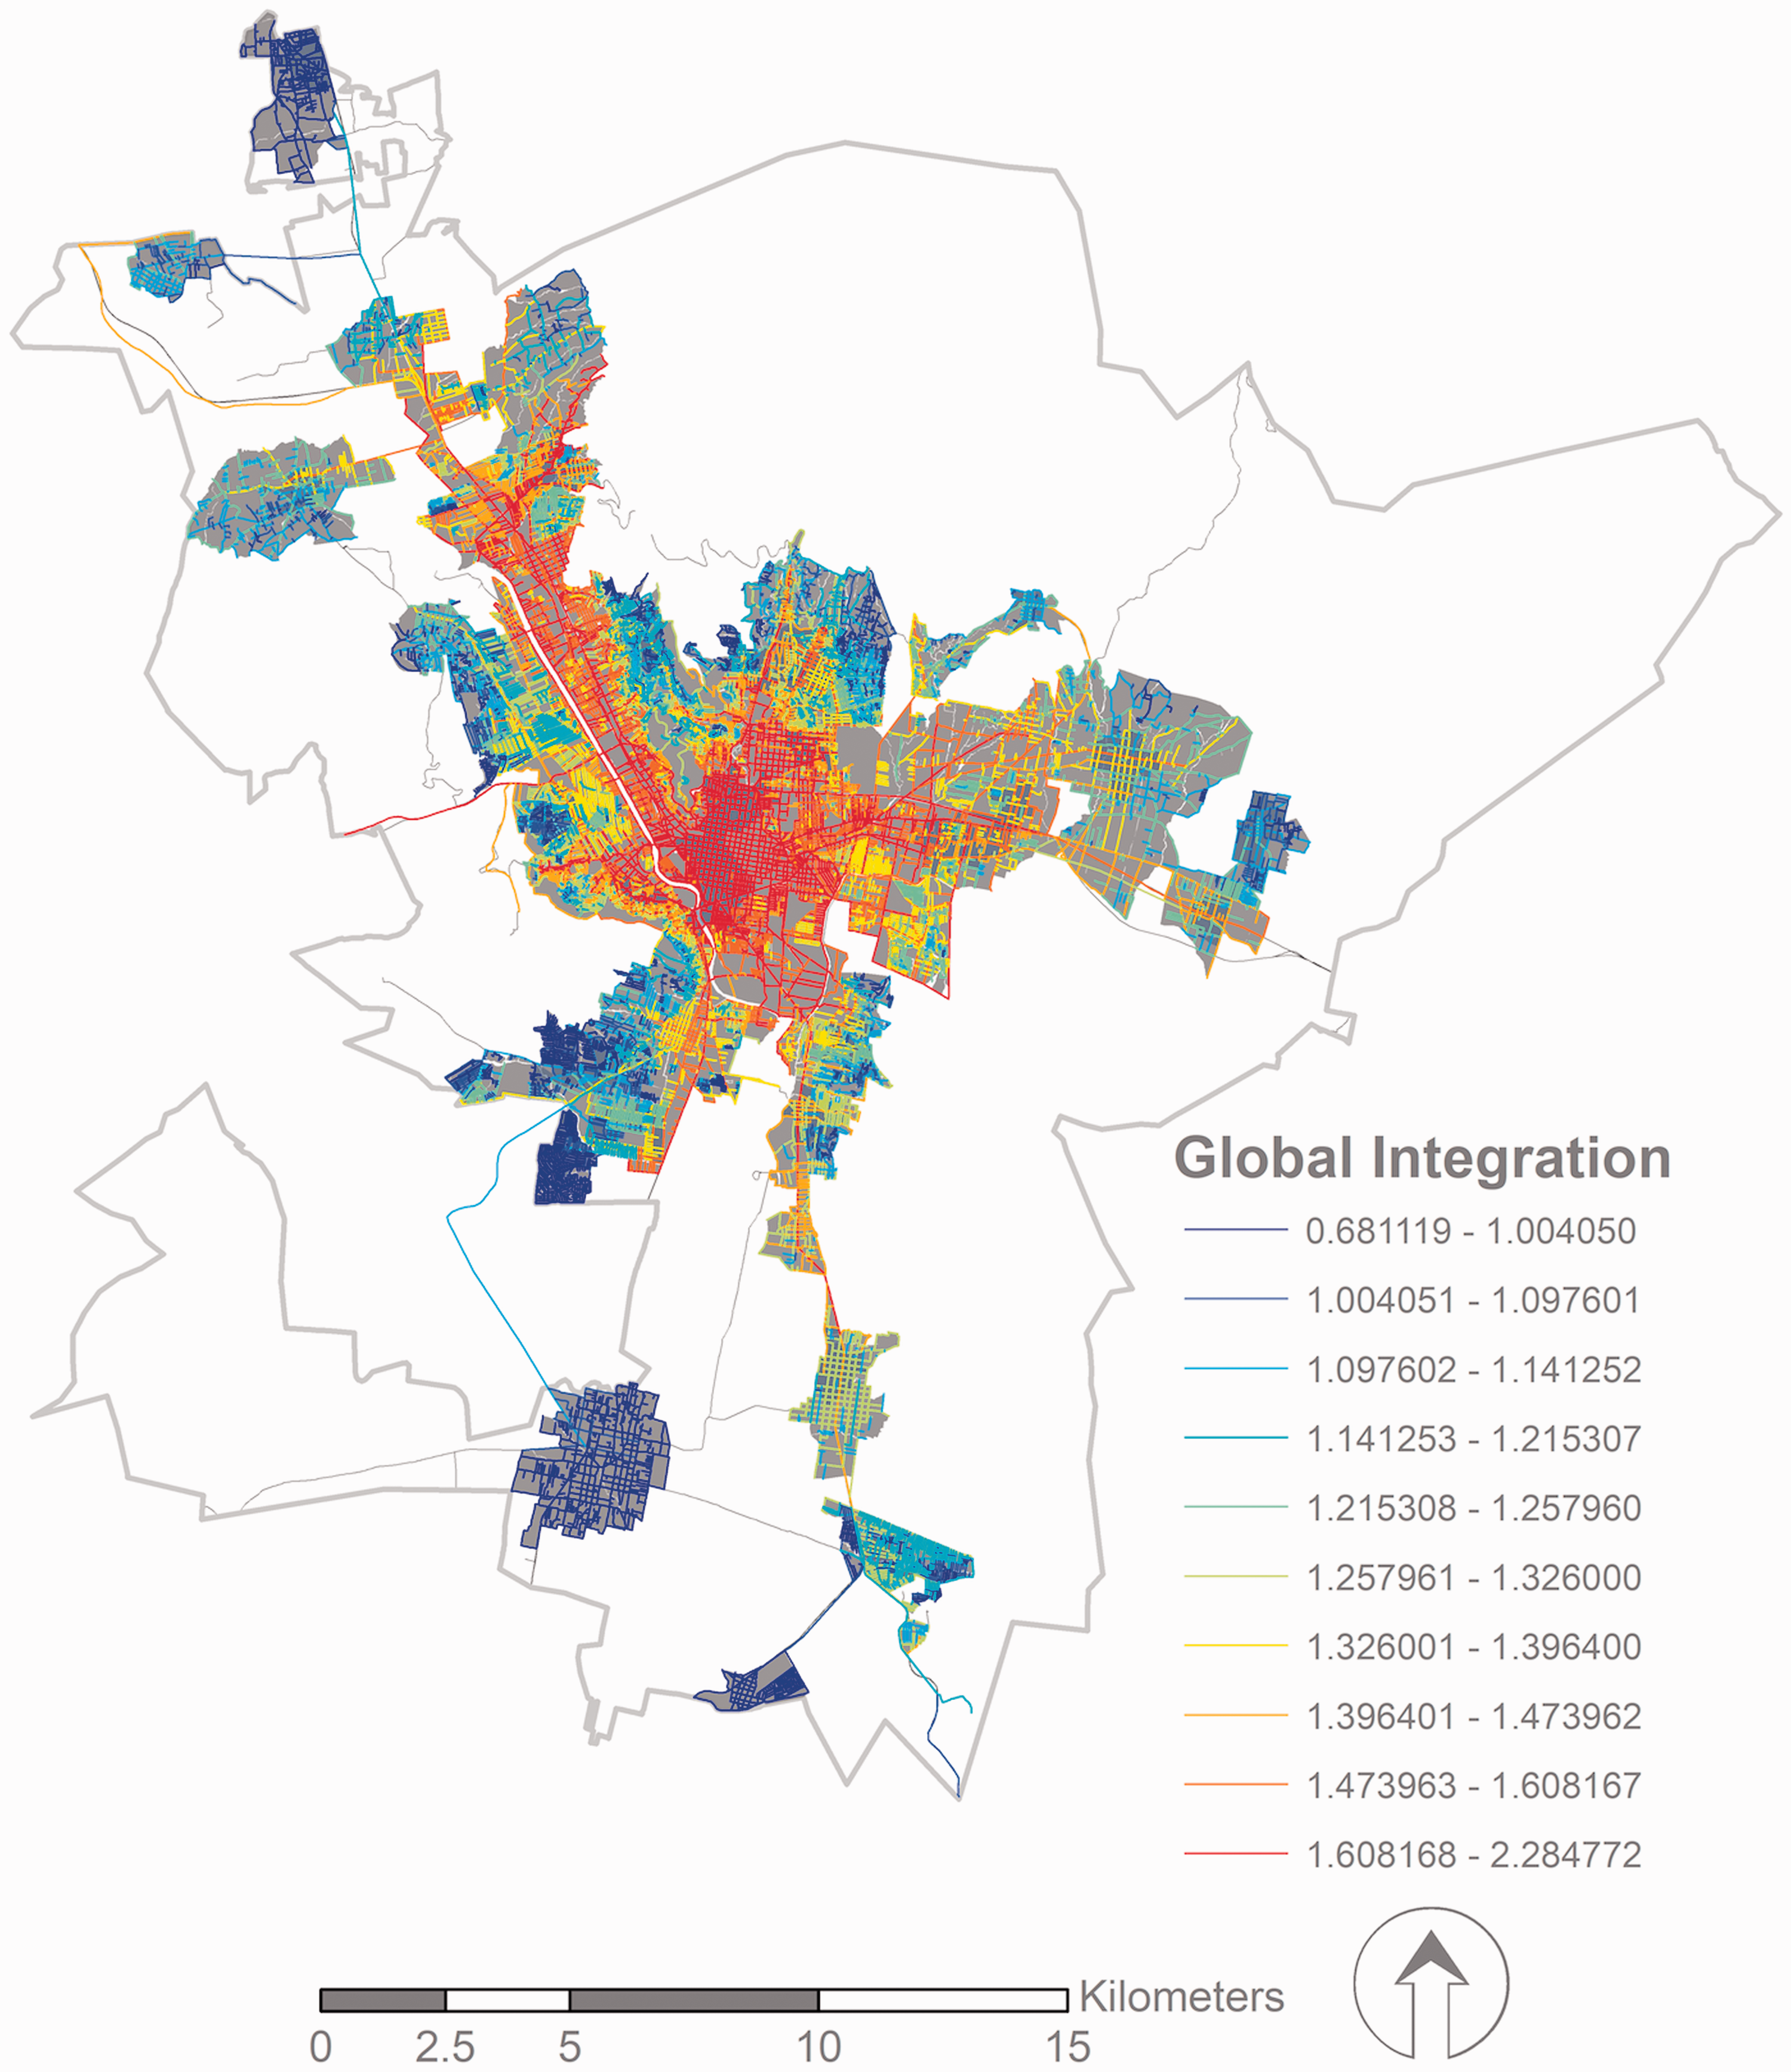
Global Integration Index with higher values (red) indicating more integrated streets for Oaxaca. Maps prepared by the authors using open data from The National Institute of Statistics and Geography (INEGI).
Compared to the population distribution, it can be seen that it is not necessarily the areas with the highest density (shown as darker census blocks in Figure 1) that are the best integrated (shown as red segments in Figure 2).
Given that population density and catchment area are allocated to census blocks while integration is calculated for street segments, we had to identify a common spatial reference for more detailed analysis beyond the visual comparisons of maps. We, therefore, developed a spatial identification method where we allocated values of the integration index from the surrounding street segments to the respective census block, as shown in Figure 3 for Oaxaca. This resulted in a complete data set where the analysis was subsequently completed at the census block level for all 21 cities.
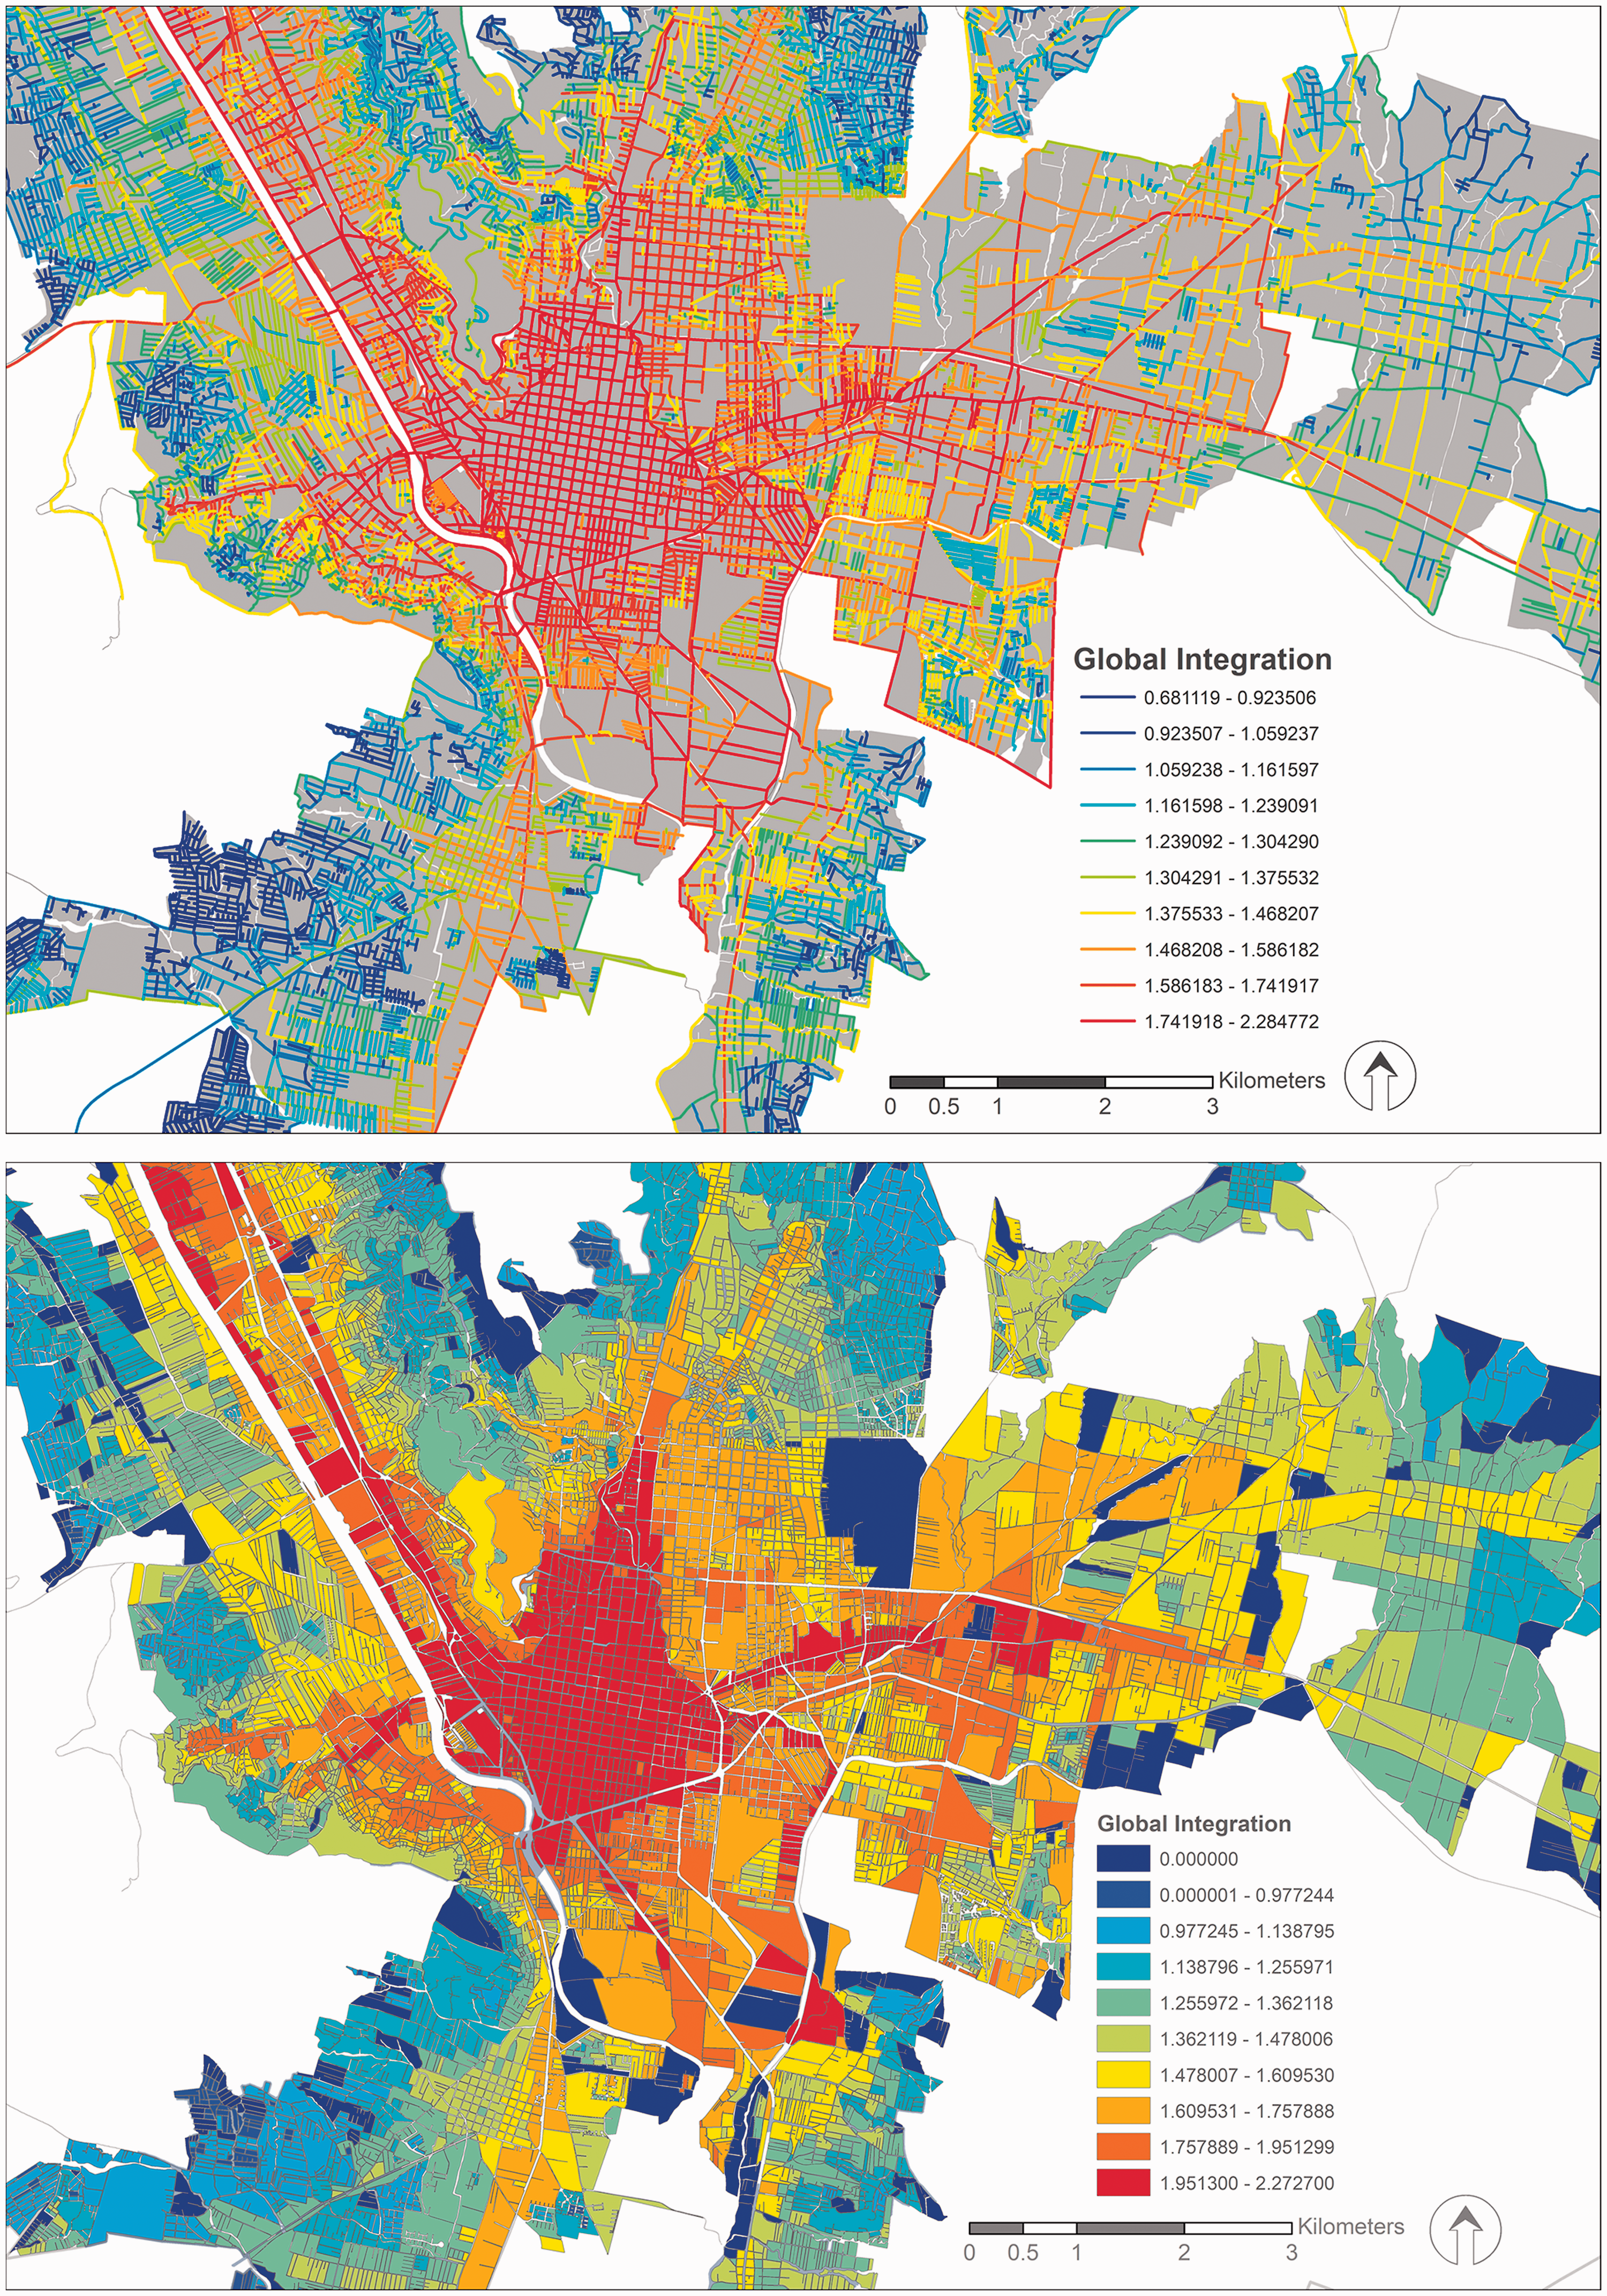
Global Integration Index values transferred from segments (upper figure) to census blocks (lower figure) for a part of Oaxaca. Blue indicates lower and red indicates higher level of integration by segment/block.
Results and discussion
The complete data set is subsequently analysed through a series of violin graphs for each service subsystem. The violin graphs are a means of comparing the distribution of a variable (in this case the integration index for each census block) against different subgroups (in this case census blocks within and outside the catchment areas). The health and education systems for Oaxaca are shown in Figure 4, with each pair of violin graphs representing a different service for the catchment area serving (Yes) or not serving (No) the respective census blocks.
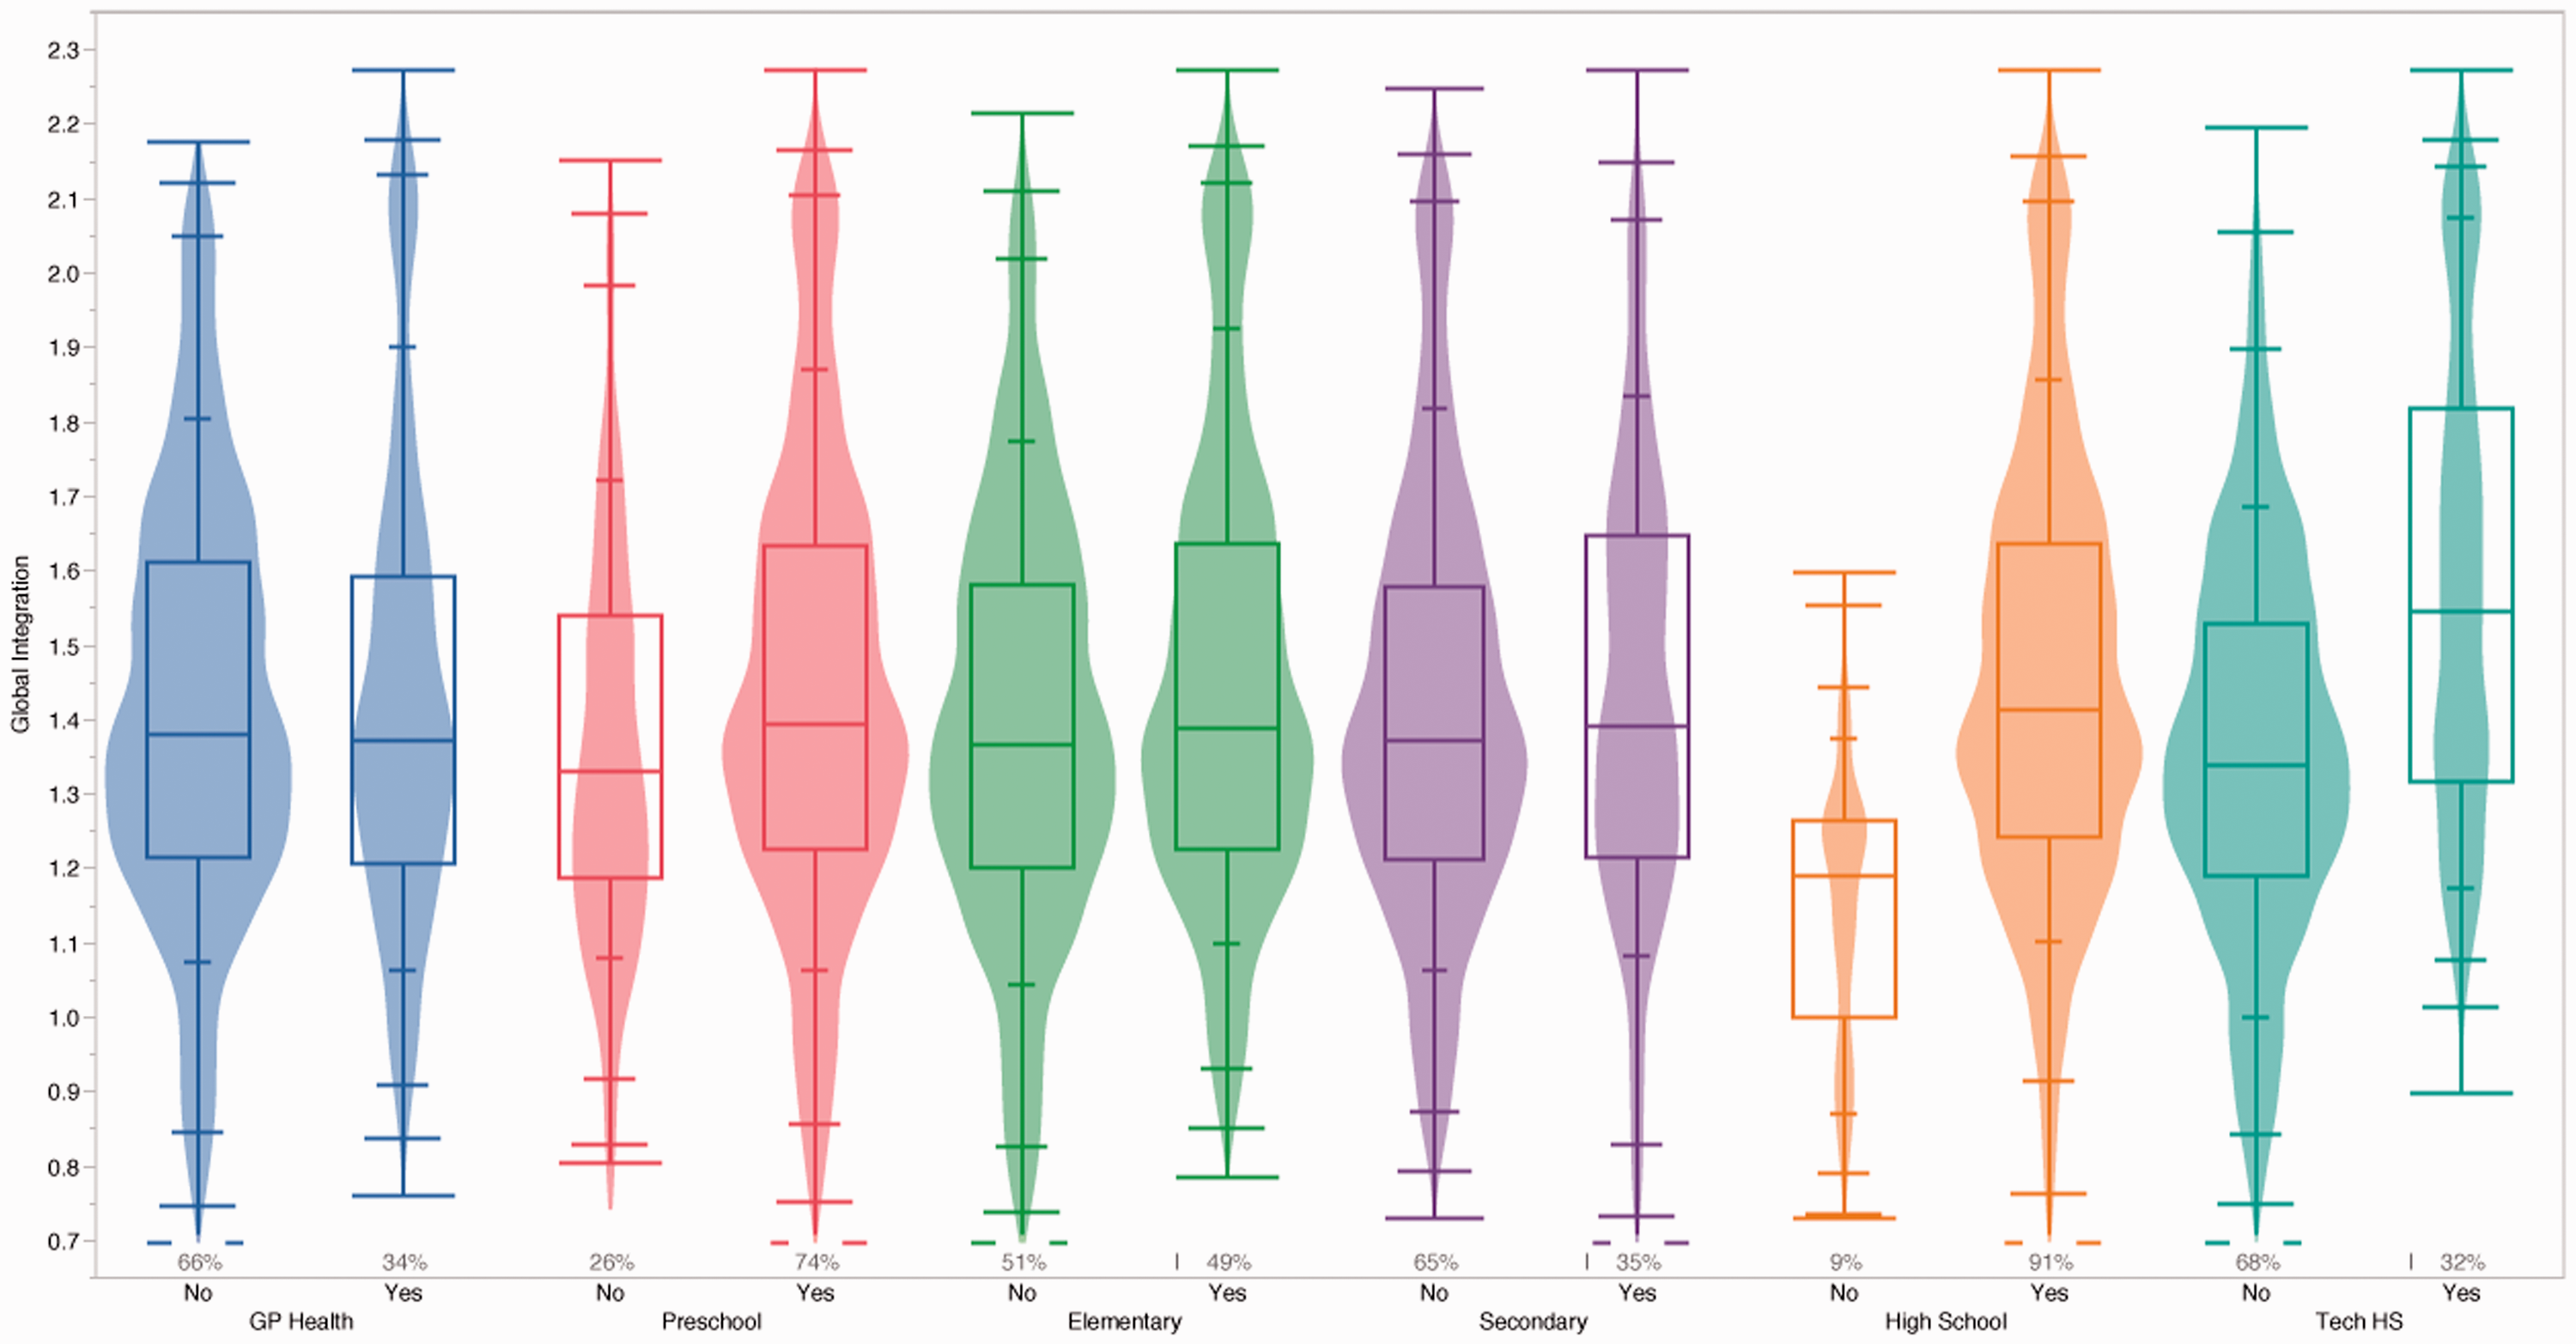
Violin graphs combined with box plots comparing the coverage of six subsystems with global integration for Oaxaca.
The shape of these violin graphs represents the frequencies of the census blocks with a specific integration value. They also provide a means for comparing the distribution of global integration values for the blocks within (Yes) and outside (No) the catchment area, as well as for comparing the different services in relation to their integration distributions. For example, it is evident from Figure 4 that health provision is limited in Oaxaca (more prominent violin graph for No) and the majority of blocks without access to a GP (No) also exhibit lower integration values. Preschool access, on the other hand, has very good coverage (smaller violin graph for No), although the distribution shows again that census blocks without access to preschool education are also experiencing worse integration. The two services with the best coverage are preschool and high school, while the graphs for secondary school reflect that of health. The major difference between high school and technical high school (HS) observed in Figure 4 is discussed later in relation to all the cities. Subsequently, one pair of violin graphs per city was created, so that all the cities could be compared, as shown in Figure 5 for the health system.
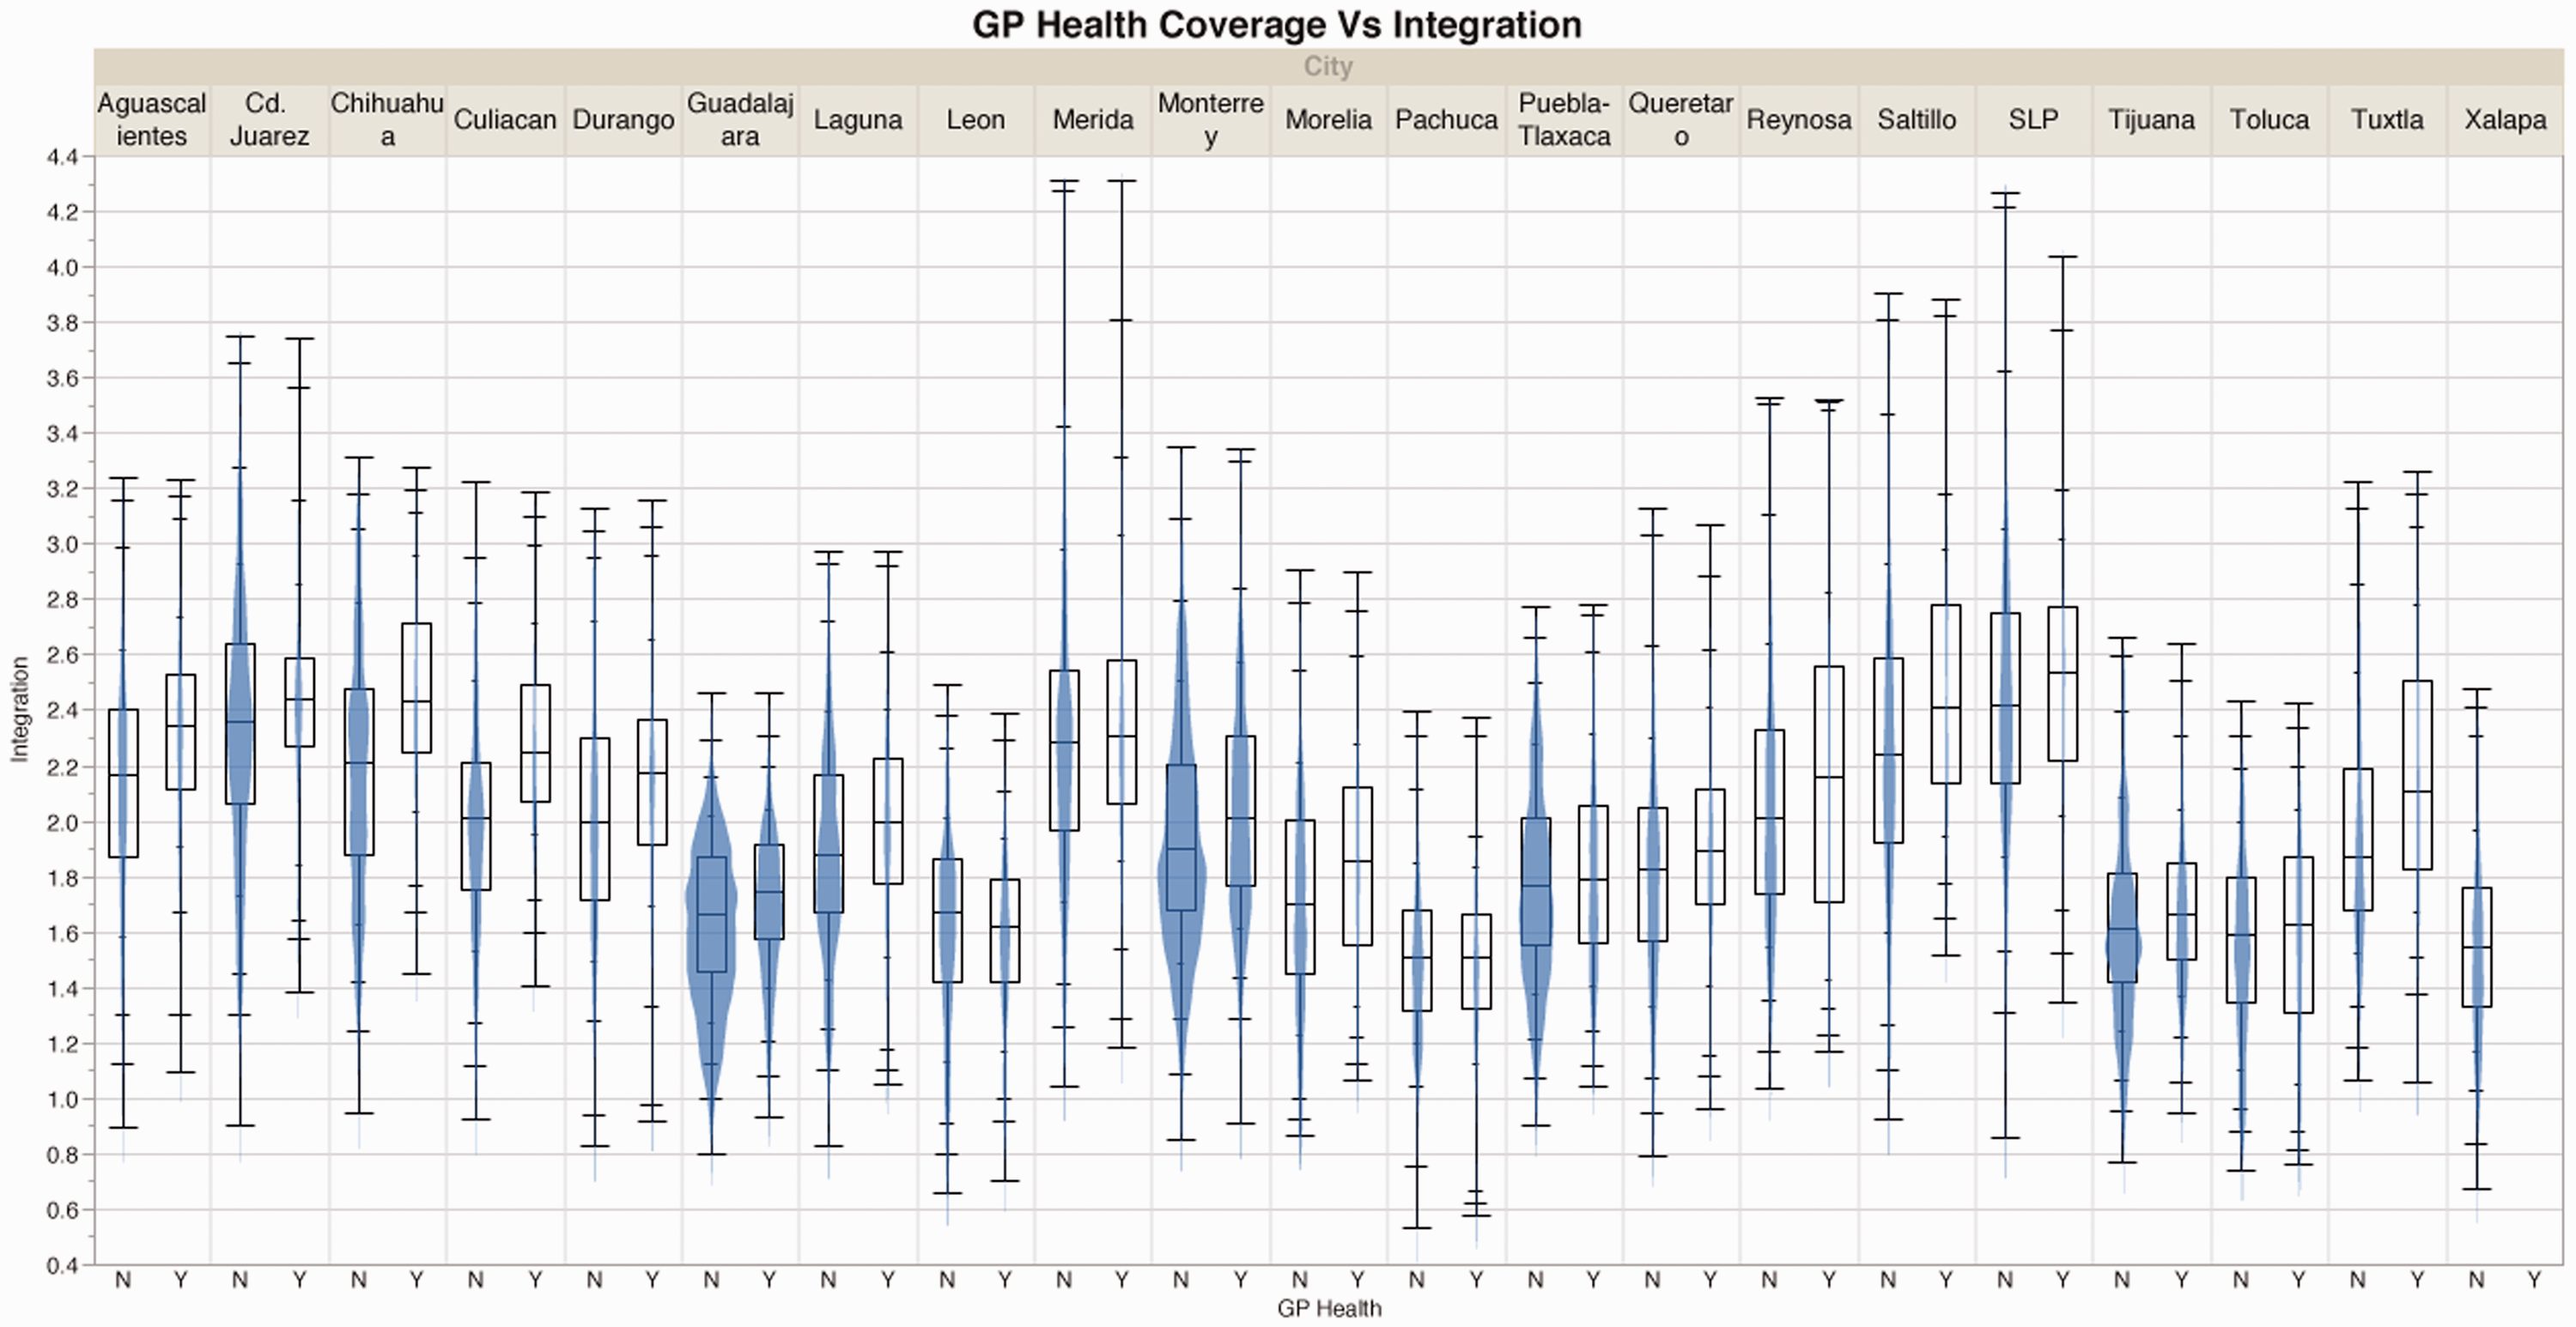
Graph comparing primary healthcare coverage against global integration for all cities.
The first observation is that when comparing integration across all cities, there is some variation but the other cities tend to have similar distributions of integration with the exception of Guadalajara and Toluca (overall low integration). The more interesting comparison, however, is the distribution of census blocks served (Y) or not served (N) by primary healthcare for each city. For all cities in Figure 5, there are more census blocks without health coverage, as shown by the ‘thicker shape’ of the violin graph (N), compared to those with coverage (Y). In addition, there is a tendency within each city for the census blocks with health coverage to be in slightly more integrated areas, as indicated by each (Y) graph having overall higher values than each (N) graph. The same process was repeated for the various aspects of the education system, and we discuss them here in two separate groupings, given their orientation. First, we examine the formative and early years (preschool, elementary and secondary education) and subsequently the upper secondary years together (high and technical school).
The immediate observation from Figure 6 is that there are differences between preschool coverage, which looks significantly different to elementary and secondary school coverage. In addition, preschool coverage between cities varies significantly in terms of integration, although the differences between building blocks with (Y) and without (N) access to preschool do not seem to vary considerably in terms of their integration. The impression is also very different to health coverage (Figure 5) because the integration distributions of census blocks with and without access to preschool cover are not very different: the violin shapes are similar and have almost identical values within each city. This means that although around half the census blocks do not have easy access to preschool facilities, they are not additionally disadvantaged by being concentrated in less integrated areas. Moving to elementary and then secondary schools, the violin graphs are increasingly similar to the health violin graphs (Figure 5). This means that there are increasing numbers of census blocks lacking access to elementary and even more to secondary education, and they also tend to be in the less integrated areas of each city. This has significant implications for children’s education, who not only lack access to schools, but are also in more spatially isolated areas with the potential of limited access to public transport and reliance on private cars for their daily school commute. These two facts can discourage children or families in attending school because their income would be affected when having to pay for any kind of transportation instead of walking to school.
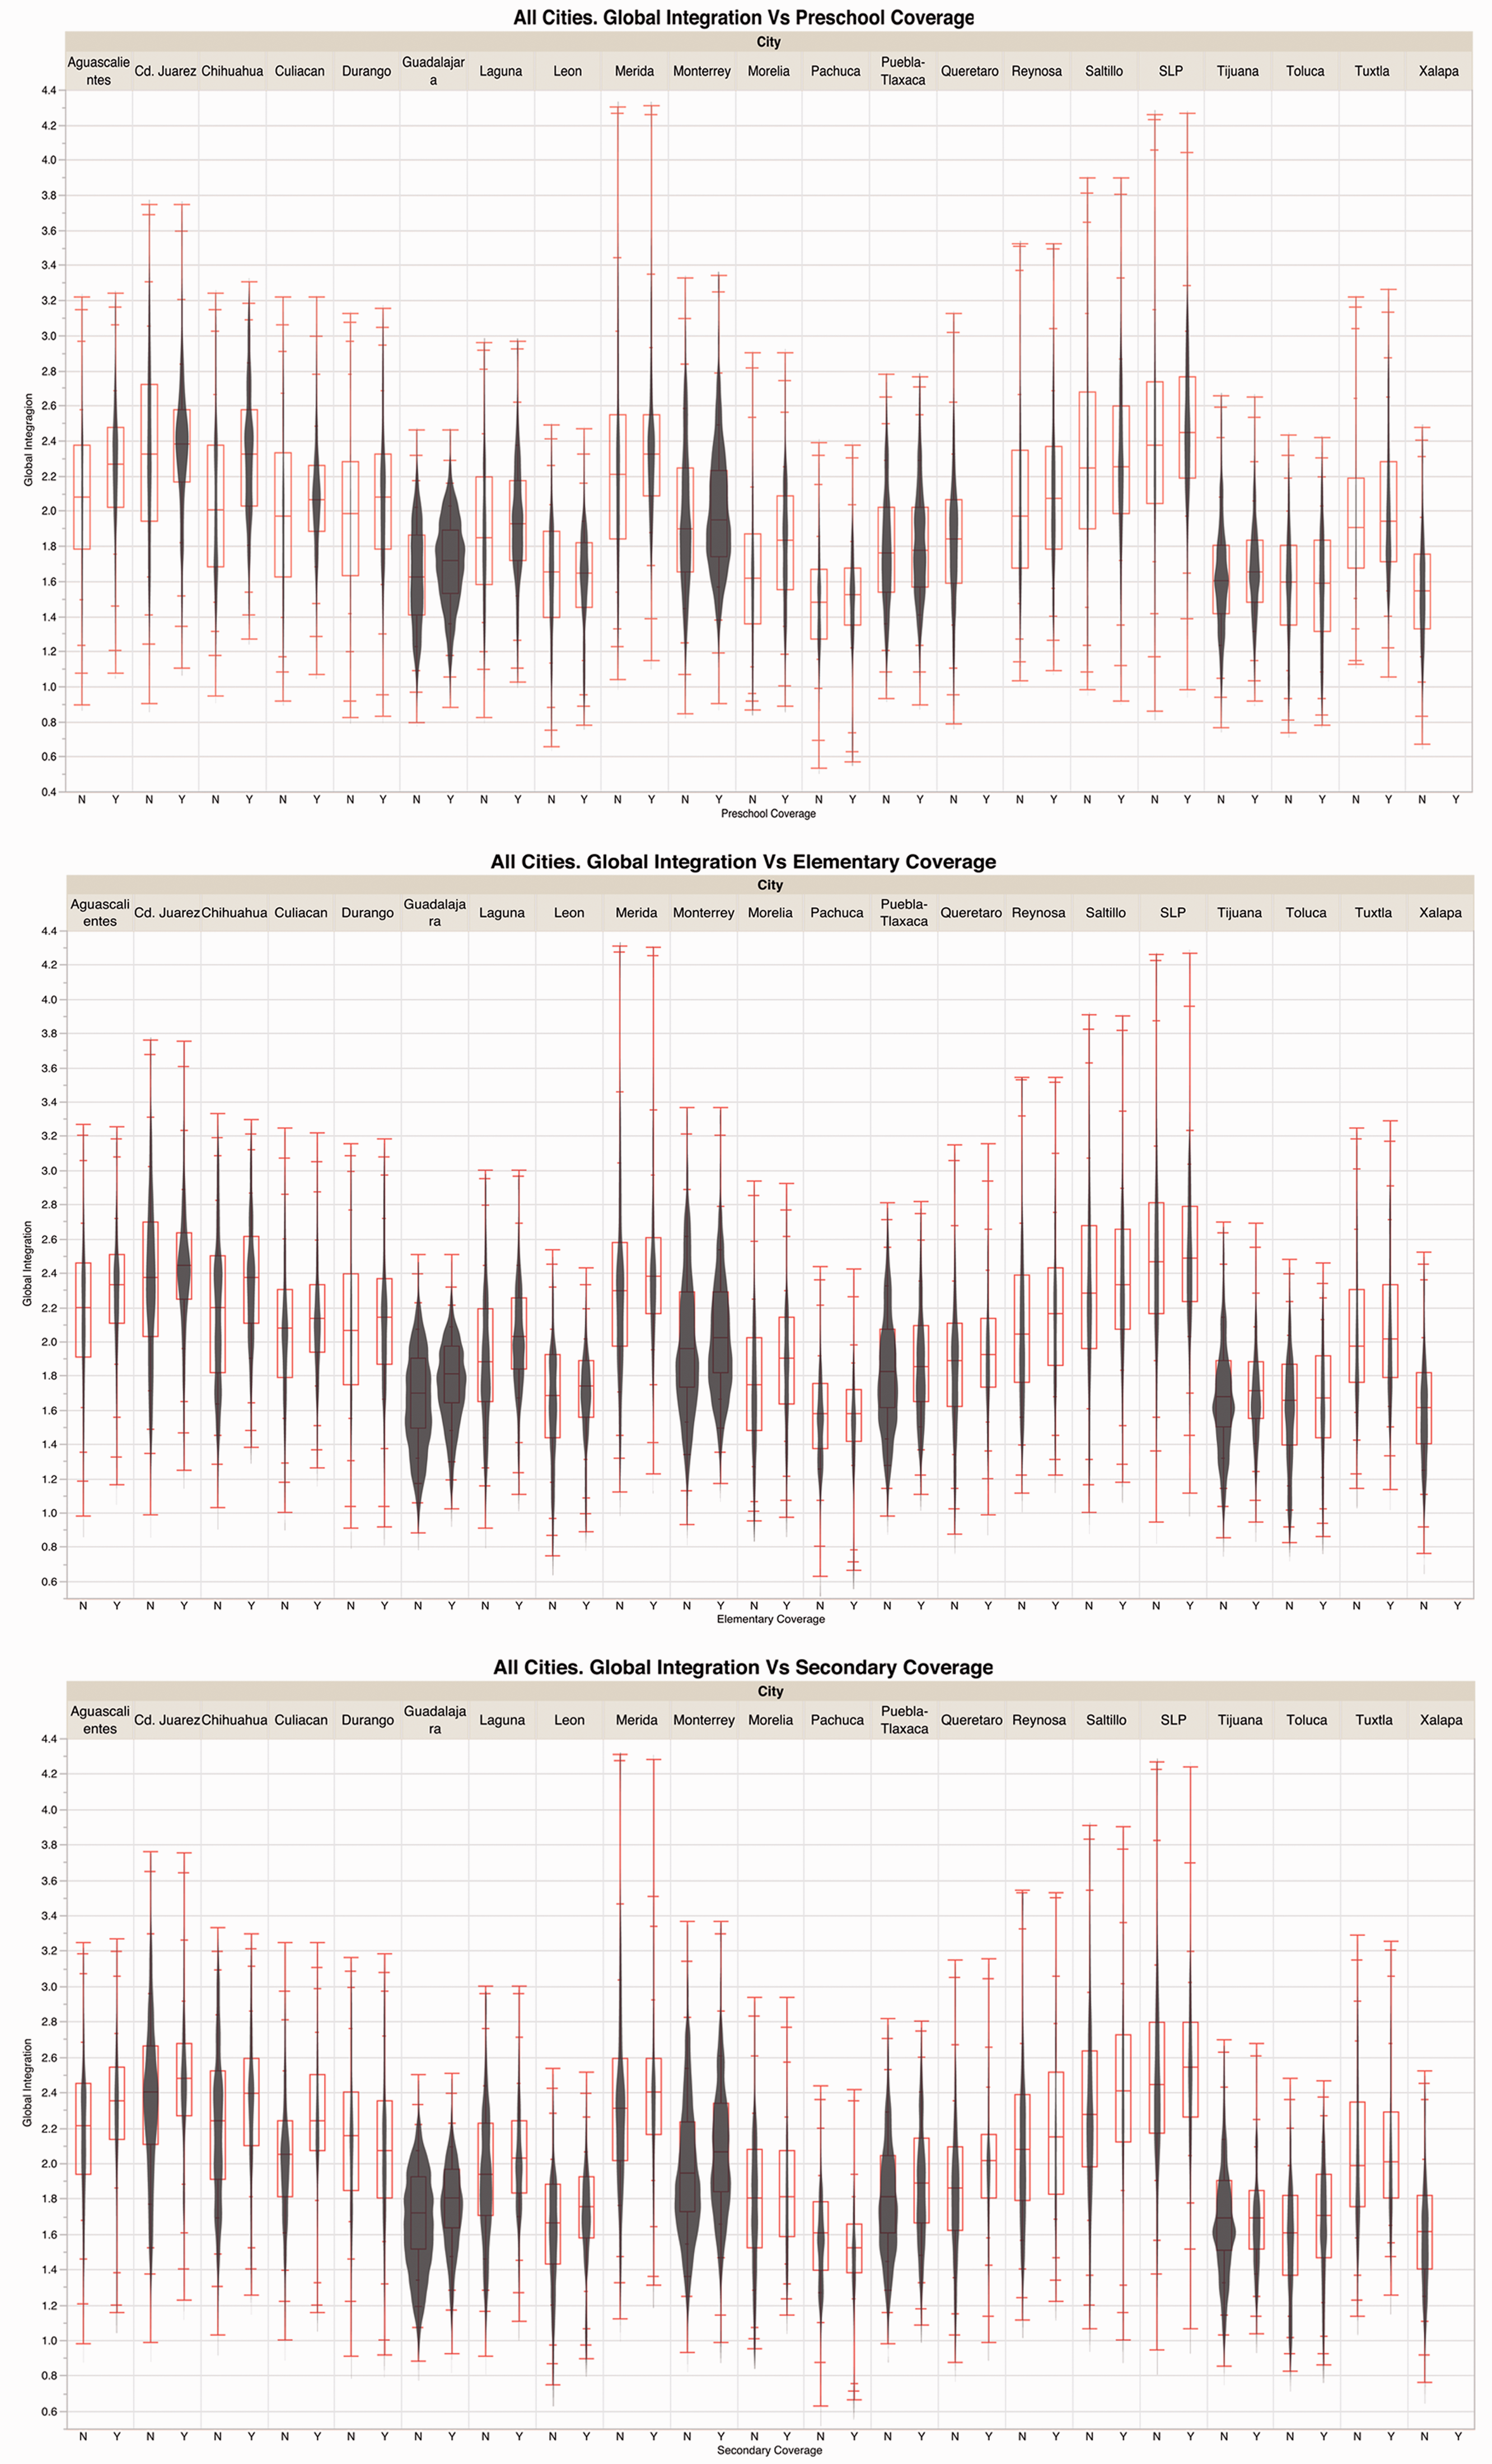
Graphs comparing formative and early years of education provision against global integration for all cities. Y is Yes and N is no.
The final comparison is for the upper secondary education years. As in many other countries, there are two types of upper secondary education: the ‘normal’ high schools for pupils with university aspirations and the technical HSs with a vocational emphasis. Assuming that all young people should have similar opportunities to both types of high school, we should expect to see similar distributions for these in terms of access and integration index. However, as shown in Figure 7, there are significant differences, not only between the various cities, but also when comparing the graphs for each type of high school within the same city. Starting with an overall comparison between the two major graphs, it is clear that there is better provision of high schools, with more prominent graphs for (Y) than for technical HSs, with more prominent graphs for (N), per city. This can be seen as a positive sign, showing aspiration towards University education as opposed to vocational training, or we can be more critical, indicating that more disadvantaged pupils, who do not have the means to continue with a ‘normal’ high school, may also be constrained by limited access to a technical HS. In addition, it is evident from Figure 7 that the census blocks with access to ‘normal’ high schools tend to have higher integration values, which is again a positive aspect, until we consider technical HSs. Focusing on the latter, it is notable that those census blocks lacking access to provision (N) are not only more represented (more prominent violin graphs) but also tend to be in the less integrated areas, as indicated by the lower integration index. This poses similar issues to those for primary healthcare and secondary school provision, with less integrated areas also experiencing lack of access to various services.
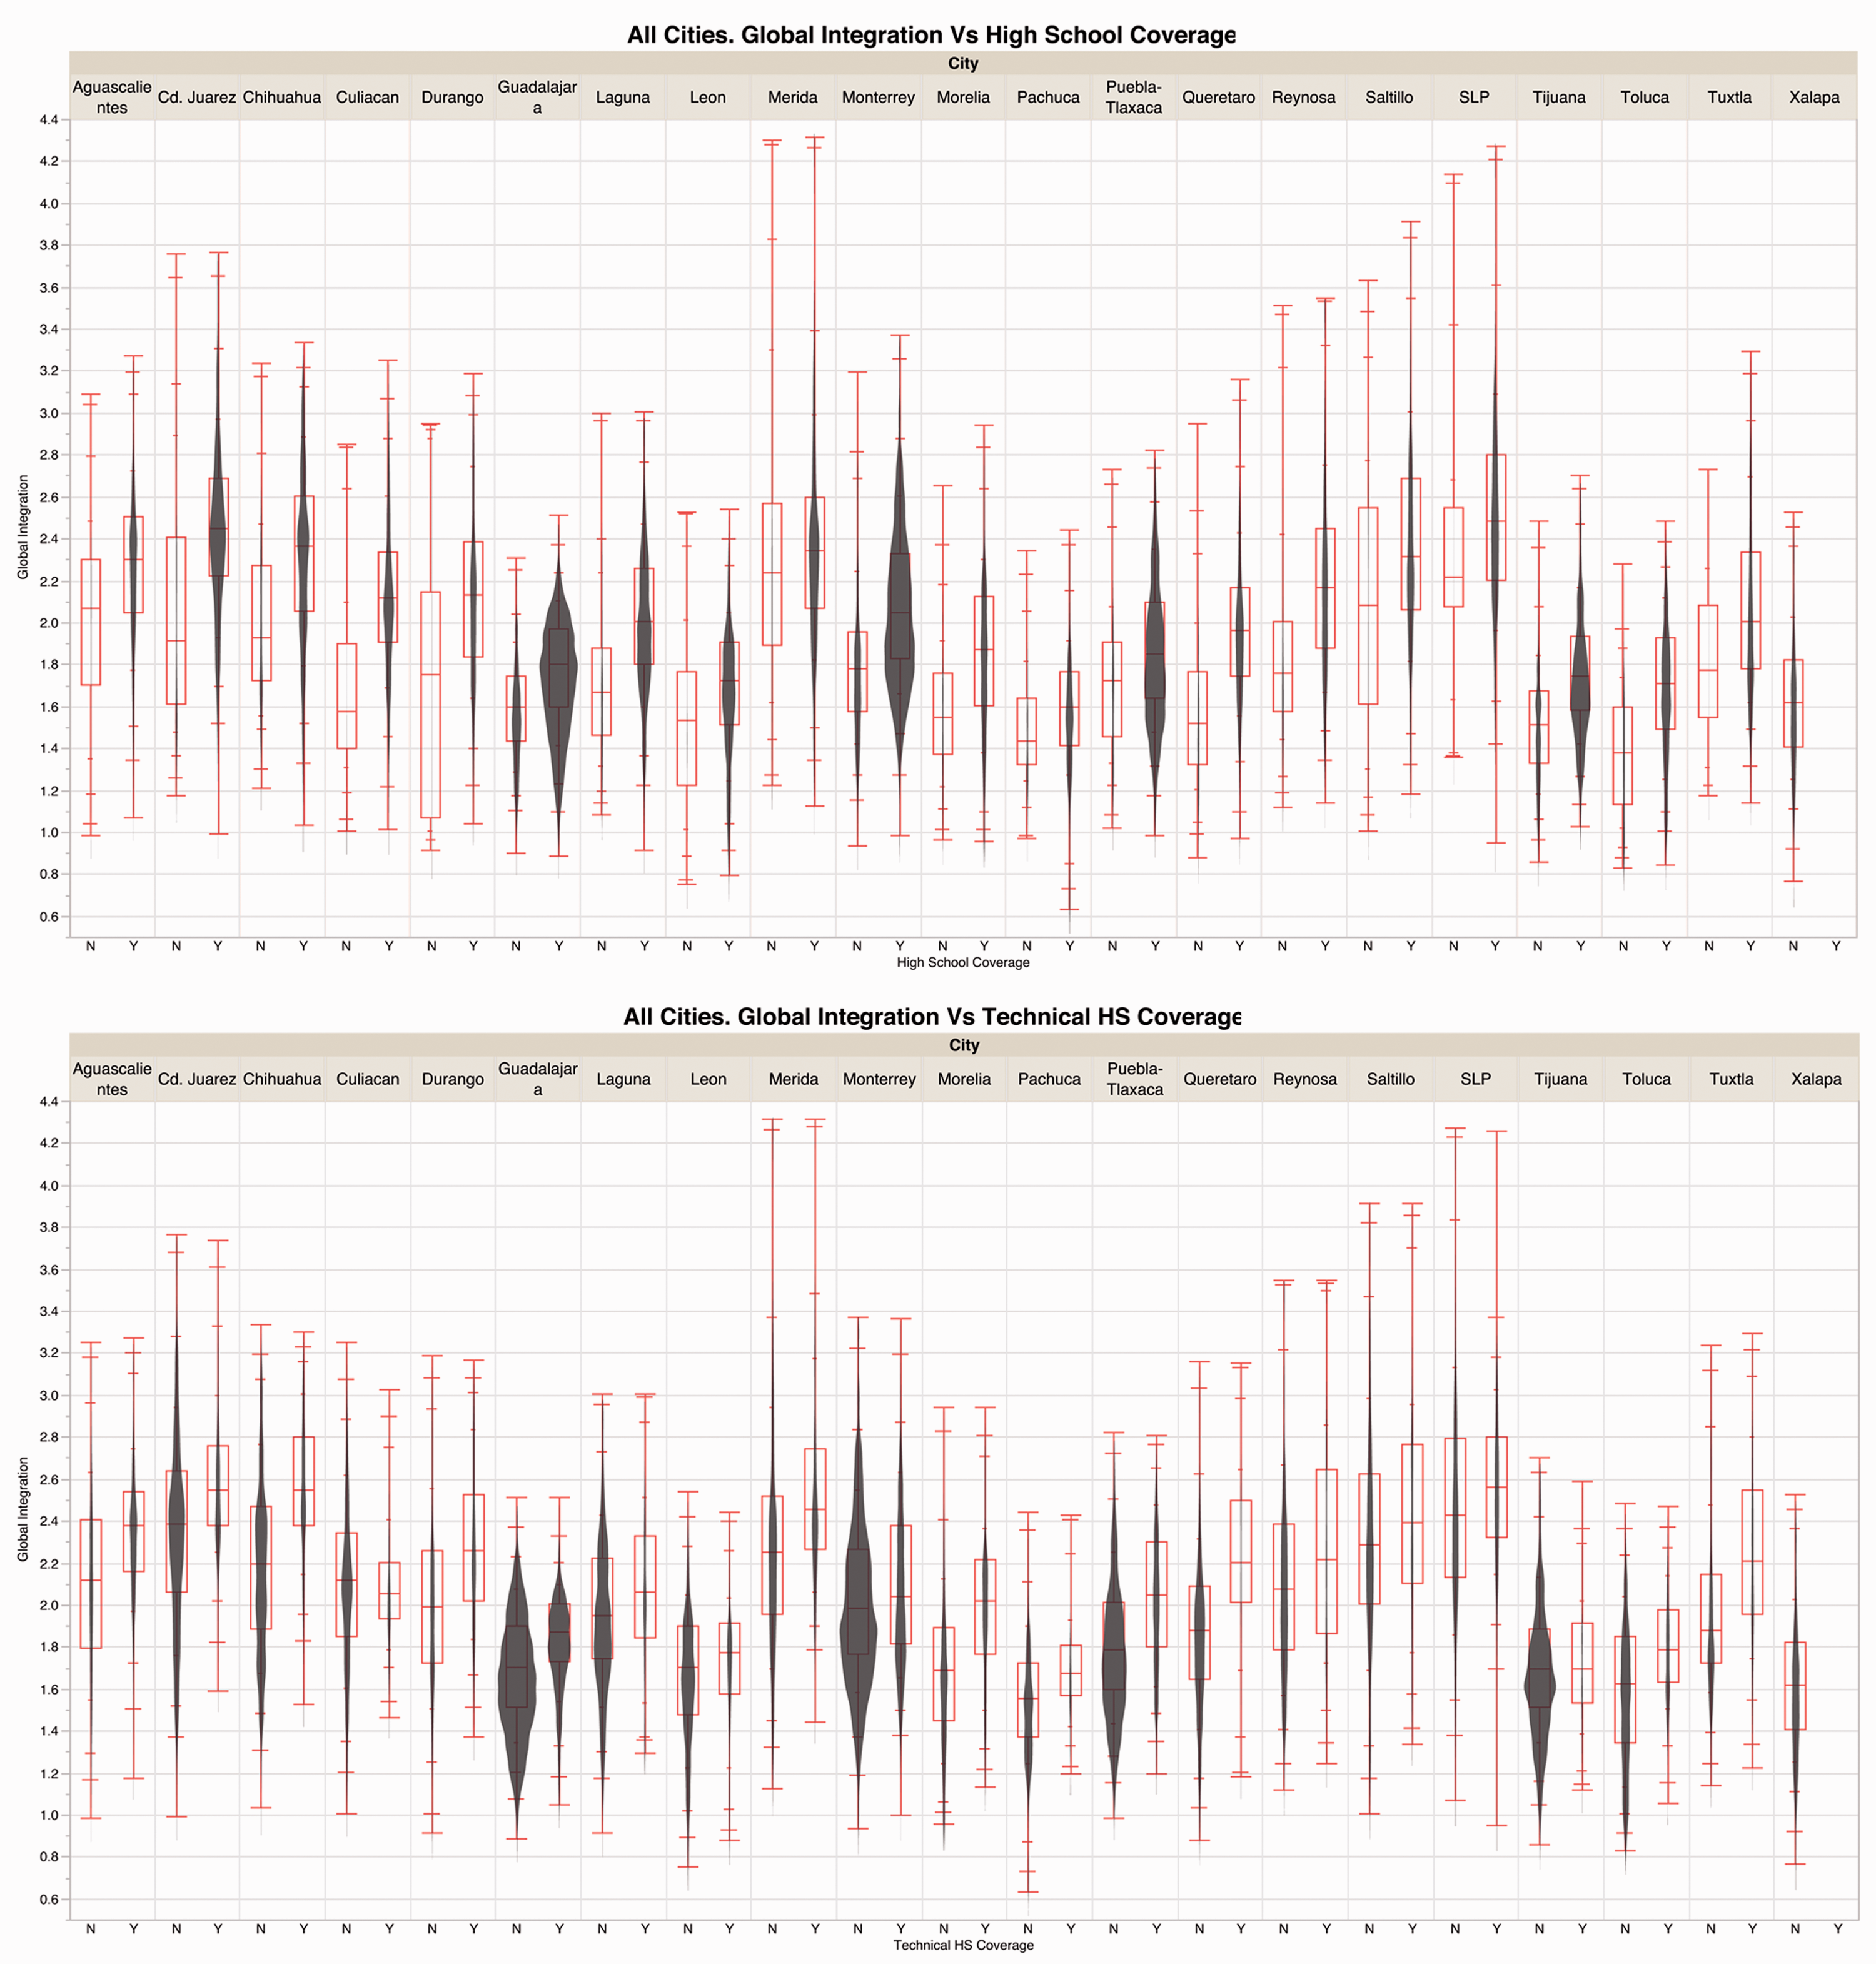
Graphs comparing high school and technical HS educational provision against global integration for all cities. Y is yes and N is no.
Conclusions
In the research reported here, we combined two indices to assess the degree to which the lack of a basic public service could be associated with the spatial segregation of an area. A Cumulative opportunities accessibility index was calculated to understand the spatial coverage of two basic public services: first-contact clinic, or GP, and basic education (preschool, elementary, secondary, high school and technical HS). We should note here that this index was calculated without considering the capacity of each facility and logistic constraints for its users, providing only an estimate of physical access to each facility. In addition, it is important to repeat here that access to services has been estimated by areas of influence at the census block level, thus resulting in spatial inaccuracies for the larger census blocks. Also, the Integration values using Space Syntax were estimated to identify segregated areas for each city. In this respect, our metrics and conclusions concern the ‘ecological level’ of the census blocks, but they give a reasonable indication of differences within and between major Mexican cities. For example, when considering the case of Oaxaca (Figure 4), it is striking that more than 50% of the census blocks do not have the required access to preschools and high schools, while at least one quarter of the blocks have a low integration value (33% in health, 25.5% in elementary, 32.5% in secondary and 34% in technical HS).
In the case of the health system (Figure 5), more than 50% of the census blocks of the 21 cities are not served by ‘First-contact Clinics’ regardless of their integration/segregation value. Of those blocks that do have access to such clinics, most are located in highly integrated areas, which are usually the oldest and most consolidated areas of the city. When looking at the education system, the results are even more interesting. Access to high school presents the most positive results of all the subsystems observed, which means that more than 50% of the blocks have access to this educational level. The second subsystem with most served blocks is preschool, but as mentioned in the previous section, around half of the census blocks do not have access to this type of school. However, as there is an ‘even distribution’ along the integration values, there is no additional disadvantage of access due to the locational factor. The most critical results are for the elementary and secondary coverage, where most of the census blocks are not close enough to a school (according to the regulations) and are, additionally, located in segregated areas within each city. Regarding technical HSs, it seems that the location and served-area criteria are not correct since most of the census blocks are not covered by this service, and those served are located in highly integrated areas (while most of the students attending this type of school usually live in segregated/low-income areas).
The use of GIS has enabled academics and policy makers to look at urban structure, e.g. demographics, land use, mobility and transportation, infrastructure and services, in their spatial contexts, to develop a range of indicators and to design policies ad hoc for the city. Using GIS and other analytic tools, as well as the official databases, i.e. population census, location of services and urban cartography as our sources, we analysed 21 of the largest metropolitan areas in Mexico to provide evidence that using the official global ‘numeric’ index is not the best option, at least for the two public services considered here. In addition, studying the urban form and its configuration using Space Syntax has helped to explore the notion of spatial integration and segregation, and relate them to social phenomena. The results are very comprehensive and have been compared with different types of urban models (movement, land use, crime, and even social segregation), showing strong correlations between the integration values and the phenomena observed (Hillier and Vaughan, 2007). We argue that the results of this study could be helpful to ‘allocate public resources and services to areas where need is greater in an attempt to achieve locational equity’ (Macedo and Haddad, 2016: 1113). At the same time we appreciate that more robust indices should be designed, with accurate demographic and spatial data to estimate the actual population being served by each service as Garrocho and Campos Alanís (2006) demonstrated for Toluca, Mexico.
Following the aims of the UN SDGs, every city should have the capacity to provide basic services for all their inhabitants, which will help to create more inclusive and just cities. The discussion of interest to policy makers is the type of indicator to use for each of the services. On the one hand, there is a norm that stipulates the population each facility should be serving. Usually such indices do not take into account the spatial location of either the facility or the population. On the other hand, the location for the services can be taken into account and determine a service area (usually within a specific radius) considering the demographic profile of the population to be served, but it does not take into account if this population corresponds to the type of service provided. With particular reference to the case of Mexico and Felipe Calderon’s statement, it seems that the first type was the one that the authorities implemented as a global coverage indicator. The problem we see with this option is that to achieve spatial justice, the authorities should be considering the spatial distribution of each service alongside the urban form (or spatial configuration), not merely the number of people that are served. We propose that evidence-based studies like ours should be considered by policy makers to improve the quality of life of the inhabitants by providing basic urban services to the widest population possible while reducing spatial injustices.
Footnotes
Acknowledgements
The authors would also like to thank Jessica Ariadna Román and Alonso González for their technical support with the figures. The data sets for this project were downloaded from The National Institute of Statistics and Geography – Instituto Nacional de Estadística y Geografía (INEGI).
Declaration of conflicting interests
The author(s) declared no potential conflicts of interest with respect to the research, authorship, and/or publication of this article.
Funding
The author(s) disclosed receipt of the following financial support for the research, authorship, and/or publication of this article: This research was supported by the British Academy (BA) through the Newton Mobility Grant NG160052 for the project ‘Spatial Inequalities and Urban Form in Mexican Cities: a geospatial investigation’. Open Access CC-BY licence was co-funded by Tecnologico de Monterrey, Mexico and Northumbria University, UK.