
Abstract
Sanitation is a universal need and thus requires universal access. Despite having the world’s largest sanitation campaign, only 37% of urban India has access to safely managed sanitation systems. Due to the heterogeneity of Indian cities, a mix of different sanitation systems is required to meet the demands of these rapidly urbanising cities. The Manila principles on Citywide Inclusive Sanitation (CWIS) propose a mix of technologies as a key pillar in achieving the Sustainable Development Goals on urban sanitation. However, there is a lack of understanding on the criteria to consider when planning the technological options for CWIS. The mega-city of Chennai is chosen as a case study, and mixed methods including a Faecal Waste Flow diagram (SFD), Social Network Analysis (SNA) and interviews are applied. This study then presents a set of 14 contextually relevant criteria for the implementation of sewered and non-sewered technologies in the city. The SFD shows that 35% of Chennai’s faecal waste remains unsafely managed while using SNA identified that the water and sanitation utility, the municipal corporation and the slum clearance board are the best placed stakeholders in the city to create a change in the sanitation situation. Furthermore, 17 drivers and barriers for the implementation of non-sewered technologies are identified. The criteria catalogue was also theoretically tested for an example ward in Chennai. The findings of the study show that a catalogue of physical, technical, institutional and financial criteria is useful for planning a mix of technologies with the CWIS approach.
Keywords
Introduction
Billions of people around the world will be unable to access safely managed household drinking water, sanitation and hygiene services by 2030. Achieving universal coverage by 2030 will require a quadrupling of current rates of progress in safely managed drinking water services, safely managed sanitation 1 services and basic hygiene services. 3.6 billion people presently lack safely managed sanitation services, including 1.9 billion people with basic services (JMP, 2021) Despite progress in global sanitation coverage in recent years, over half the world’s population, 4.2 billion people, use sanitation services that leave human waste untreated, threatening human and environmental health (UNICEF and WHO, 2020).
The world is experiencing an unprecedented transition from predominantly rural to urban living. Presently, 55% of the world’s population lives in cities and this figure is set to increase to 68% by 2050 – amounting to an increase of 2.5 billion people in urban areas, especially in Asia and Africa (United Nations, 2018). Urbanisation in India is happening at a rapid scale and thus resulting in the formation of informal settlements due to both rapid population growth in poor urban areas and migration from rural to urban areas, which are massive trends in many parts of the world (Niva et al., 2019). Currently, over 35% of the Indian urban population live in informal settlements (Moreno, 2020). These informal settlements are usually characterised by low income, medium to high population density and poor access to sanitation, water, and hygiene.
Planning sanitation in cities in India faces several barriers such as lack of political and financial support, poor capacities, and lack of a planning framework among others (Narayan et al., 2021). Indian mega-cities are inherently heterogeneous entities and exhibit variation across socio-economic, political, environmental and infrastructural dimensions. ‘Heterogeneity’ and ‘variation’ are relatively neutral terms that describe unevenness in the distribution of an attribute in comparison to the terms ‘inequality’ and ‘inequity’, which have varying degrees of normative implications (Balakrishnan, 2016).
Citywide Inclusive Sanitation (CWIS) is a paradigm shift in urban sanitation, which places equity, public and environmental health at its core, aiming to ensure everyone has access to safely managed sanitation by promoting a mix of technology – both non-sewered and sewered – to address the sanitation challenge that our mega-cities presently face (Gambrill et al., 2020; Lüthi and Narayan, 2019). Citywide Inclusive Sanitation focuses on six main principles viz. equity, environment, and public health, a mix of technologies, comprehensive planning, monitoring and accountability, and a mix of business models (Narayan and Lüthi, 2020). A key aspect of the CWIS framework is its advocacy towards contextually appropriate technology (Citywide Inclusive Sanitation (CWIS) Initiative, n.d.; Gambrill et al., 2020).
Sanitation planning often tends to be top-down, technology-driven and focused on implementation of regional master plans (Tilley et al., 2014). Despite the existence of strategic sanitation planning approaches, inappropriate technologies dominate the urban sanitation landscape (Spuhler and Lüthi, 2020). Inappropriate technology choices for varying local physical and social environments result in limited human and financial resources for maintenance and operation (Tilley et al., 2014), thus marking the poor sanitation planning a reality in urban India. The poor maintenance and installation of sanitation works often leads to its breakdown or abandonment, especially in developing urban areas (Barnes and Ashbolt, 2006; Spuhler et al., n.d.), which is indicative of the failure of conventional approaches to sanitation planning and service provision (McConville, 2010).
While CWIS advocates for contextually appropriate technologies, the strategy for the implementation of a mix of both sewered and non-sewered technologies remains absent. This presents a formidable research gap, requiring attention. A mix of technologies 2 means neither that everything must be sewered or that everything be non-sewered, but rather to choose the type of sanitation system according to the condition and situation of the city. It has been highlighted at several city levels (Brazil, Kenya, Zambia) (Citywide Inclusive Sanitation (CWIS) Initiative, n.d.) that it is not possible to go for a one-system-fits-all approach as we have regions within cities where sewers are not possible due to technical, financial (from the user end) limitations. In the last decade, several tools, guidelines and other resources have been developed to help authorities better plan sustainable sanitation: from guidelines for better decision making such as the Sanitation Cityscape (Scott and Cotton, 2020) to the Faecal Waste Flow diagrams (SFD) and City Service Delivery Assessment (Schertenleib et al., 2021).
While the cost characteristics of centralised sewered treatment technology have been studied extensively and are often referred to as a winning argument for their uptake, the economics of decentralised sanitation systems are less understood. The few papers that explore this topic favour decentralised Small-Scale Sanitation (SSS) as a strong option for urbanising cities (Rajan et al., 2021). Under low-population density regions or high-cost problem scenarios, efforts to introduce SSS options should be taken to enable the co-existence of a mix of technologies (Eggimann et al., 2016). The degree of decentralization of treatment systems largely depends on the degree of industrialization of the country where the system is installed (Bernal et al., 2021). This suggests that in Low and Middle Income Countries (LMICs), decentralization is seen as a viable solution for low basic sanitation coverage issues, which usually lack full coverage, or the proper governmental, economic and technical support required to guarantee system durability (Chirisa et al., 2017; Roefs et al., 2017). Faecal Sludge Management (FSM) and Container Based Sanitation (CBS) are other low-cost sanitation systems that function well in many urban contexts in LMICs due to their economic viability, ease of operation, low operating costs and potential to recover resources (Mehta et al., 2019; Russel et al., 2019).
Given the availability of appropriate technologies including sewers, non-sewered technologies such as decentralised sanitation systems viz. Faecal sludge management, CBS etc., in the market, planners would benefit from a clear set of criteria to consider in choosing appropriate technologies to achieve CWIS. Therefore, this paper aims to address this gap through the formulation of a criteria catalogue highlighting the 14 relevant criteria as part of a decision-aiding tool to implement a mix of technologies in a mega-city of India.
Research design and methods
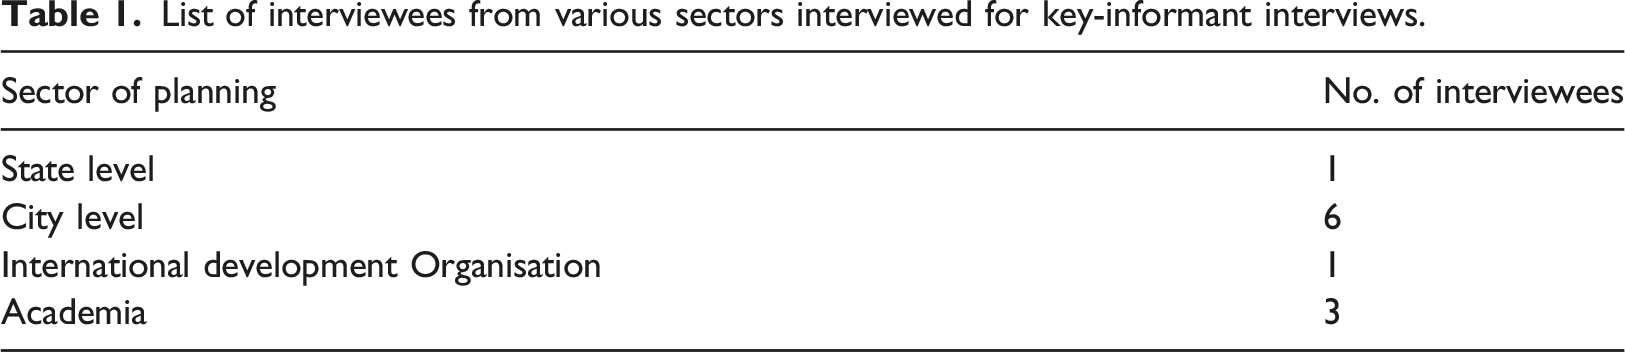
The research used a single case study approach using a variety of tools. Qualitative tools used in the study are Social Network analysis (SNA) and key-informant interviews, while the SFD was used as a quantitative tool. Social Network analysis is a powerful tool for studying social systems that focuses attention on the complex relationships among actors in a system (Harper, 2020). A preliminary list of stakeholders (35) was identified through informal expert contacts and document analysis that focused on the sanitation sector of Chennai. Upon identification of the preliminary list of stakeholders, a qualitative Power (level of authority in the sector) and Interest (level of involvement in the sector) analysis was performed on the preliminary list of stakeholders, where each stakeholder was assigned to Quadrants 1–4 based on their Power (Low/High) and Interest (Low/High) in the sanitation sector of Chennai, represented in Figure S3 and Figure S4. A primary list of stakeholders was created on the basis of selecting stakeholders falling in quadrants 1, 2, 3 and excluding ones falling in Quadrant 4 (due to low relevance in the study) of the Power-Interest Matrix. All stakeholders allocated in Quadrants 1–3 were selected for further analysis in the SNA.
Social Network analysis was conducted in accordance with the method presented in Narayan et al. (2020) and was used to identify key relevant actors within the sanitation sector of Chennai through analysing the stakeholders on a Power-Interest Matrix. The primary list of stakeholders was validated using key-informant interviews and processed using the open-source software Gephi (Bastian et al., 2009) to generate the stakeholder map. Stakeholders were grouped and colour coded based on the organisation category they work in, that is, National, State, City, International Development Organisation, Academia, NGO and Private Players. Each stakeholder is indicated as a circle (Node) and the size of the node is proportional to the number of edges of the respective stakeholder (Centrality). A connection (Edge) between stakeholders in the stakeholder map is drawn based on findings from document analysis (Literature, Tenders, Policy, Government Notices, Ongoing projects, Funding) indicating that two stakeholders are in connection with each other via a project, funding scheme, and administrative purposes in the sector of sanitation in Chennai.
List of interviewees from various sectors interviewed for key-informant interviews.
The study was conducted from 2020 to 2021, over a period of 10 months remotely, owing to the COVID-19 pandemic. Collection of data for demographics, stakeholder mapping, driver and barrier identification, criteria catalogue development and testing the catalogue in Sholinganallur was performed through a review of a broad range of literature (academic publications, project reports, grey literature and practice-oriented publications) and remote key-informant interviews. The SFD tool (Faecal Waste flow diagrams ((SFD) - Sustainable Sanitation Alliance (SuSanA), n.d.) was used in the study to analyse and prepare a graphic showing the current state (in 2021) of Chennai’s excreta flows and the quantity of safely and unsafely managed faecal waste. An update (2021) to the existing SFD (Chennai 2019, 2019) was carried out by means of desk-based research and key-informant interviews. The desk-based research was conducted using publications dated post 2019 till present date, that is, government-published reports, newspaper articles and interviews. All relevant newspaper-based findings were collected from four newspaper sources viz. The Deccan Chronicles, The Hindu, The New Indian Express and The Times of India, which are the most prominent and established news reporting companies in the city.
As part of the operative definition for this study, non-sewered technology is defined as FSM and CBS. In addition to sewered and non-sewered technology, SSS is a separate category and does not fall into either category of sewered and non-sewered technology. Characteristics of a SSS system such as investment costs, space, skills needed are highly dependent on the treatment technology and scale of treatment in terms of the population served. Thus, we excluded SSS from the study, since we cannot arrive at a single case scenario. As CBS does not pertain to Chennai’s sanitation technologies, since its legality is currently debated in India due to the Manual Scavenging Act 2011 (Prasad and Ray, 2019), it was also excluded from this study. While a mix of technology in CWIS refers to CBS, FSM, SSS and sewer systems wherever applicable, in this study we focus only on sewer and non-sewer (FSM) technologies to simplify the criteria catalogue.
An initial set of criteria presented in Table S3 were identified through the literature review presented in Spuhler et al. (2020), i.e., (Ashley et al., 2008; Balkema et al., 2002; Bracken et al., 2007; Buuren, 2010; Dunmade, 2002; Kvarnström et al., 2004, 2011; Lennartsson, 2009; Montgomery et al., 2009; Muga and Mihelcic, 2008; NETSSAF Workpackage 3-Assessment of Sanitation Systems and Technologies Deliverable 22 & 23, 2006; Palme et al., 2005; Sahely et al., 2011; Singhirunnusorn and Stenstrom, 2009; Tilley et al., 2010; Willetts et al., 2013), to form the preliminary set of criteria. As a final step, the preliminary set of criteria were tested for relevance under contextual appropriateness limited to Chennai via key-informant interviews, where experts were asked to validate the list of criteria for the context of Chennai. This validated list of criteria formed the criteria catalogue for selecting sewered/non-sewered technology for implementation in Chennai.
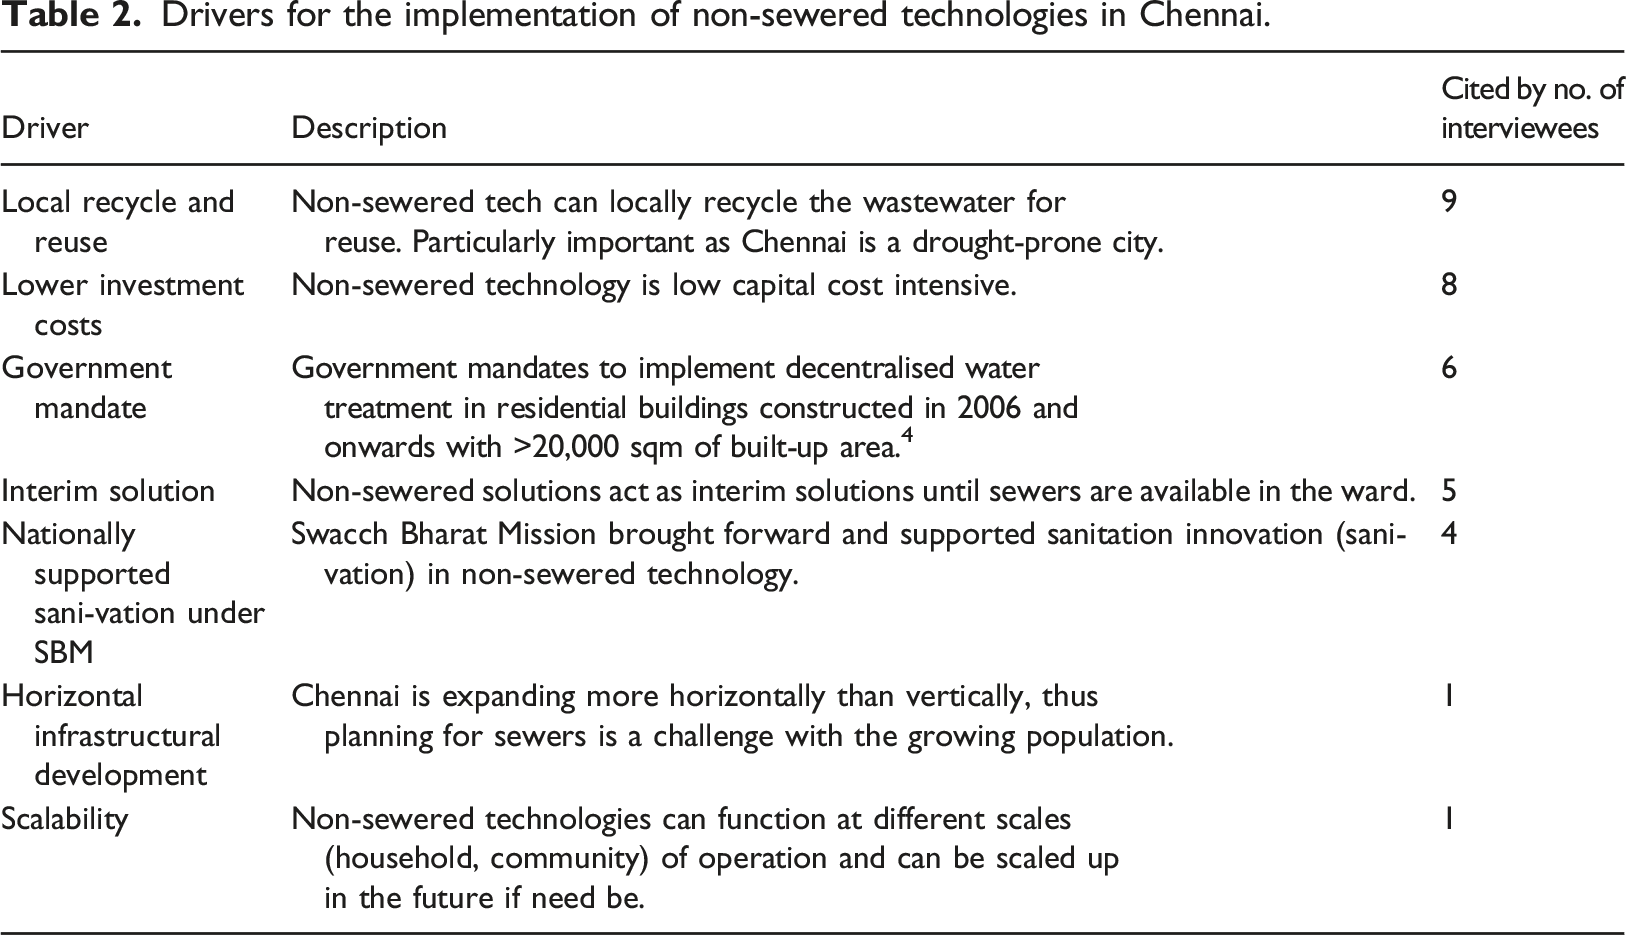
Drivers for the implementation of non-sewered technologies in Chennai.
Results
Updated faecal waste flow diagram
The Chennai Metropolitan Water Supply and Sewerage Board (CMWSSB) intends to move Chennai towards an all-networked city in the next 3 years, according to its senior members interviewed. While this means that they have to more than double their sewer connections and treatment infrastructure to achieve this, some ambitious activities have taken place. Since the publication of the earlier SFD in 2019, from a total treatment capacity of 727 (million litres per day) MLD through 12 sewage treatment plants (STPs), the city has already begun construction of new STPs totalling an additional 550 MLD, and expansion of existing STPs by an additional 110 MLD (CMWSSB, 2014; Natarajan, 2020; Oppili, 2019; Viswanath, 2019).
Similarly, an innovative scheme ‘Azhaithal Inaippu’, that is, ‘Call for Connections’, was started to connect the last mile of residents in areas where sewers exist, and so far, 90,000 connections were made through this scheme. Additionally, the scheme allows the residents to pay the connection fee in 10 instalments in 5 years following the connection, thereby making it affordable.
Despite these ambitious efforts to provide sewered services, the safely managed sanitation in the city rose from 62% in 2019 to 65% in 2021 (see SFD for Chennai 2019, 2019 and 2021 in Figure S1 and Figure S2, respectively, in the Supplementary Materials); meanwhile, more than half (56%) of the population of Chennai continue to use on-site sanitation systems. This too calls for an alternate approach to achieving the urban sanitation and wastewater management goals for the city by 2030. The updated SFD is presented using published Tamil Nadu government documents and verified news reports from leading news reporting outlets. While the data used are reliable, a future additional verification process and publication conducted by an independent body such as the Sustainable Sanitation Alliance (SuSanA) would aid accurate dispersion of the verified SFD provided through this study.
Social network analysis
The validated map (Figure 1) changed considerably from the desk-based map based on inputs from experts. For example, the Tamil Nadu Slum Clearance Board (TNSCB), a government agency responsible for eradicating slums and providing hygienic tenements, was highlighted as playing a more critical role in the sanitation sector than previously assumed; therefore, its node size was manually increased. Furthermore, the strong presence of FSM actors, the Tamil Nadu Urban Sanitation Support Program (TNUSSP), and Gates Foundation, among others, show that there is good scope and capacity to scale up non-sewered sanitation in the city, since these actors have been taking non-sewered systems to scale (Schrecongost et al., 2020; TNUSSP, 2019). Social network diagram of the important stakeholders in the sanitation sector of Chennai.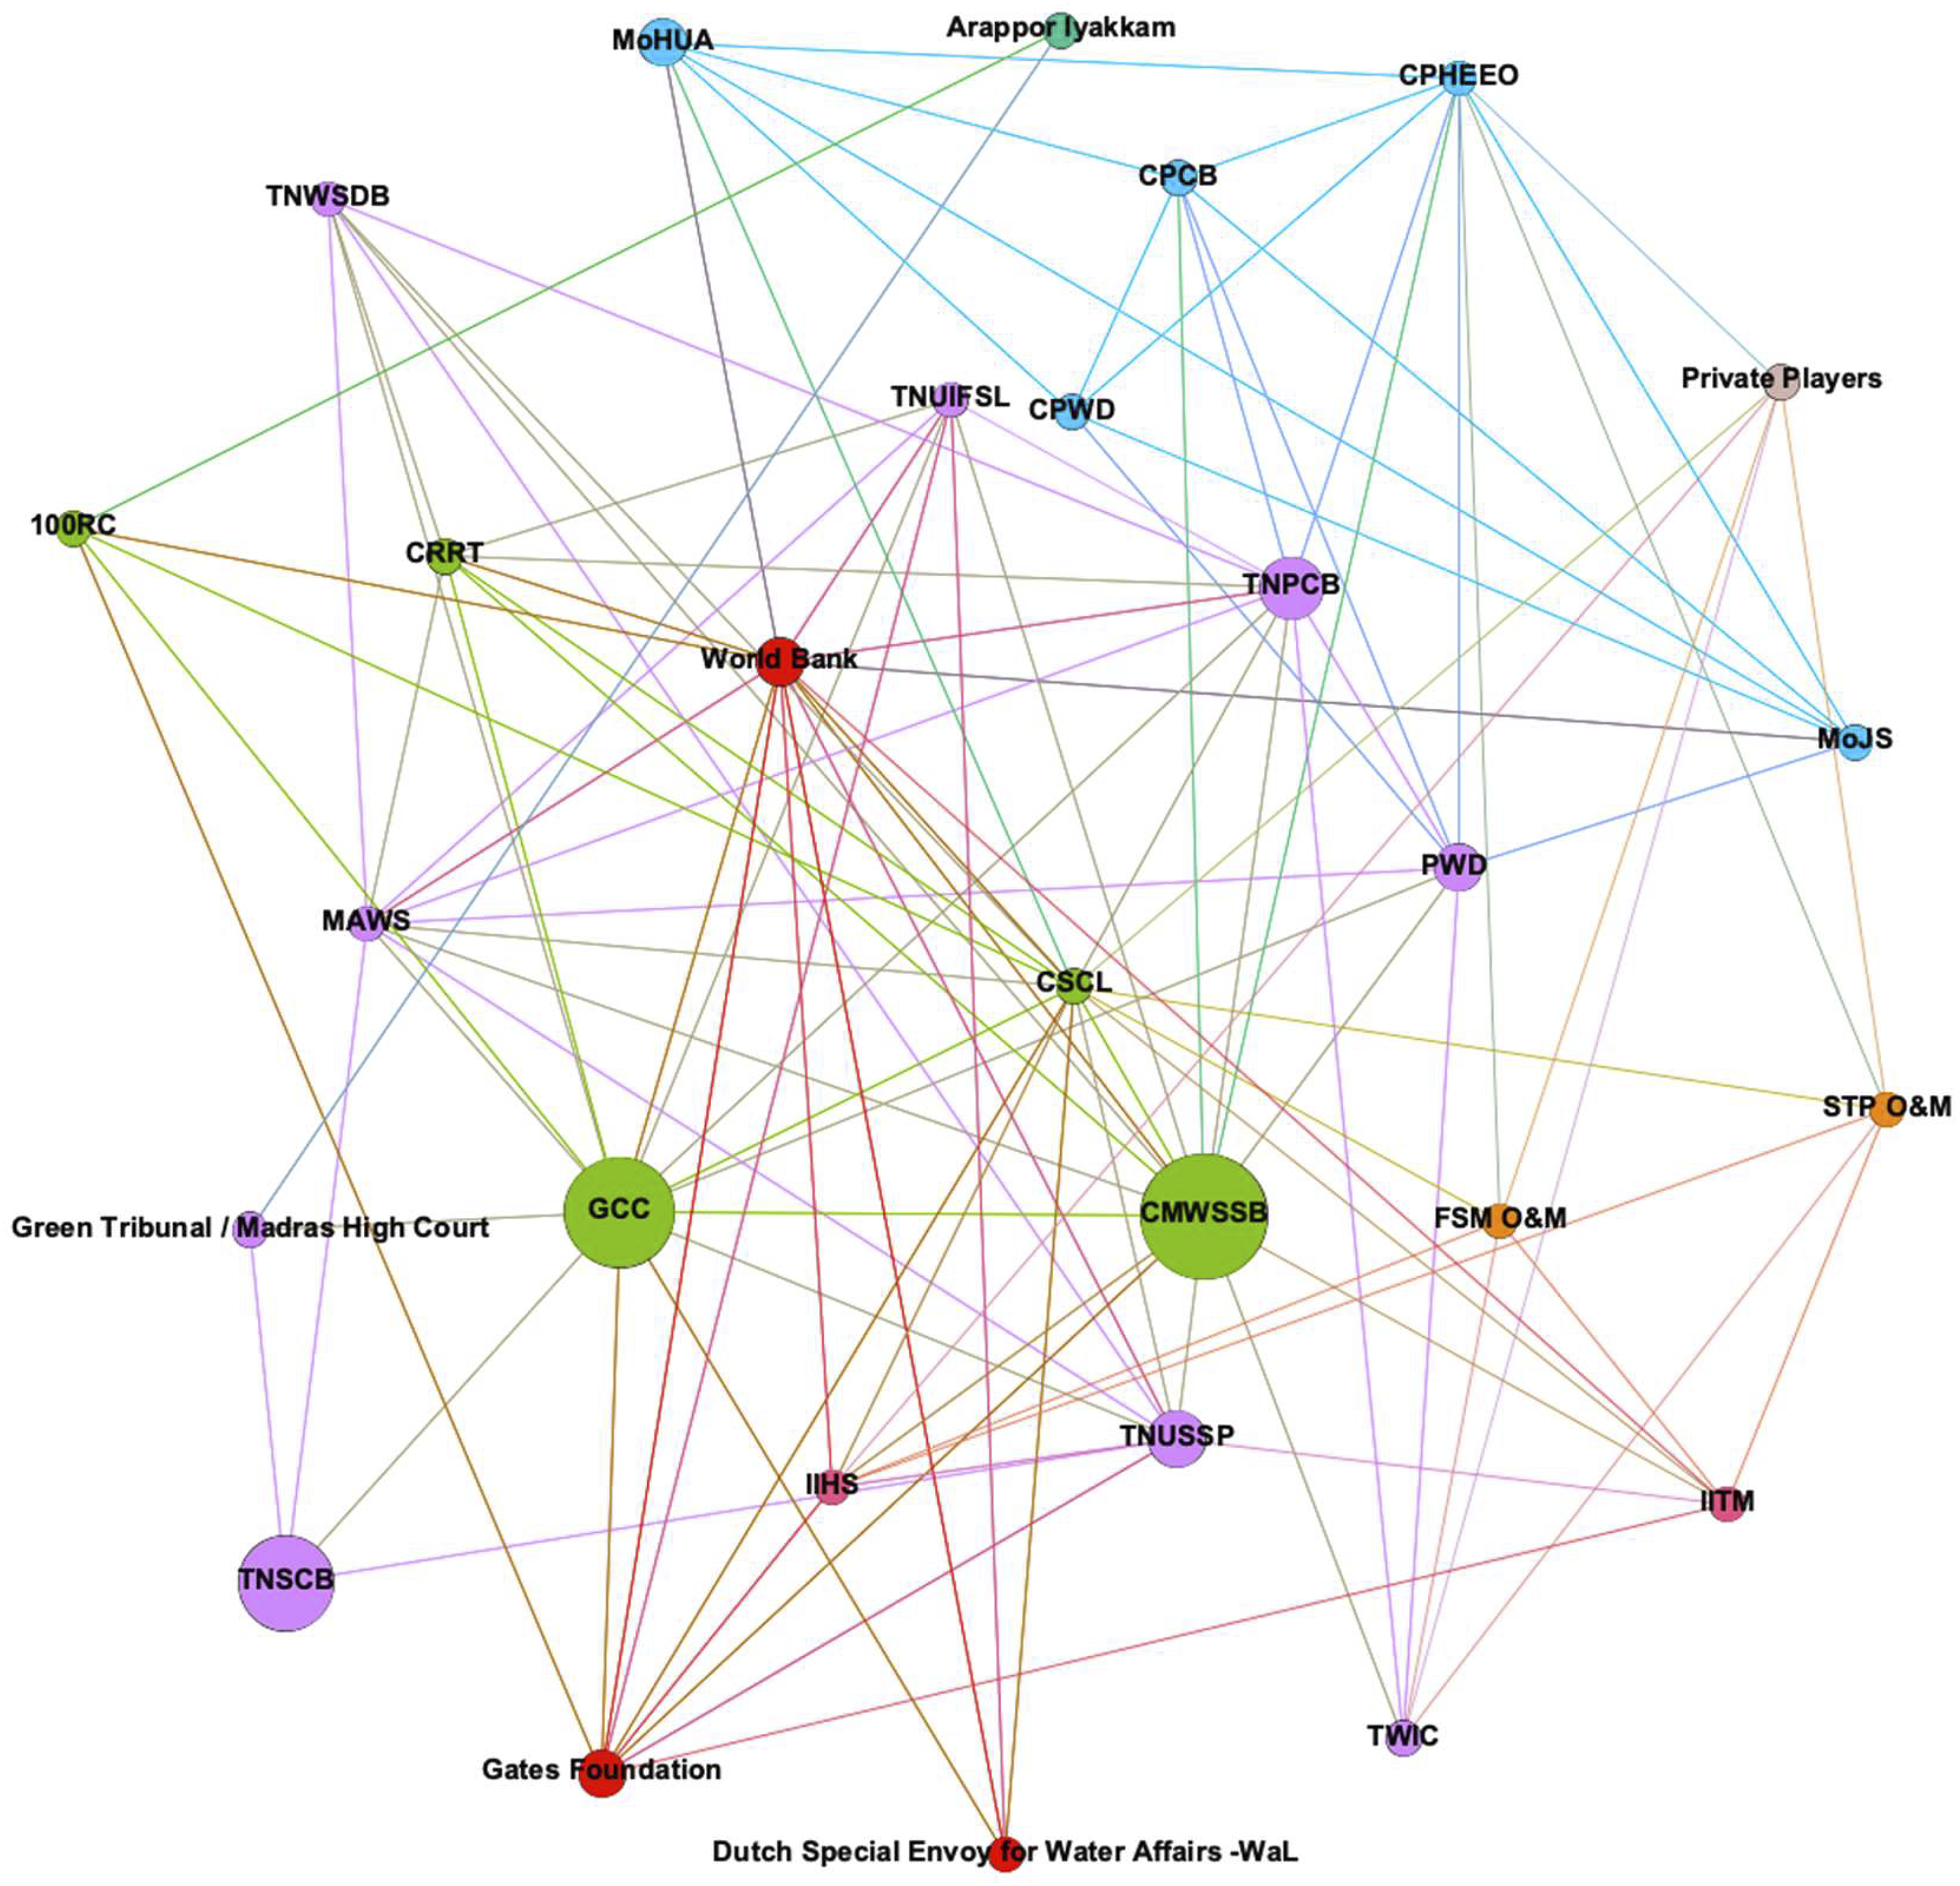
The centrality and the node size 3 of the World Bank suggests that despite being an international development organisation, it plays a significant role in the city’s sanitation sector. It helps in the diffusion of best practices and knowledge from across the world, and partly explains the familiarity of the CWIS concept among other stakeholders, given that the World Bank is one of the proponents of the CWIS approach (Gambrill et al., 2020).
From Figure 1, it can be seen that the most relevant stakeholders in the sanitation sector of Chennai are the GCC (Greater Chennai Corporation), CMWSSB (Chennai Metro Water Supply and Sewage Board) and TNSCB (Tamil Nadu Slum Clearance Board). The stakeholder map accurately captures their relevance as is the case on the ground, as these 3 stakeholders are the central figures for Chennai sanitation. GCC is the civic body responsible for general governance and construction of sanitation infrastructure. Chennai metropolitan water supply and sewerage board is the water board of Chennai and is responsible for supply of water and treatment of wastewater. TNSCB is a state level body in Tamil Nadu as outlined above. Together they form the most relevant decision makers in the sanitation sector of Chennai. The abbreviations used in Figure 1 are presented in Table S1.
Drivers and barriers
There is a clear aspiration among the interviewed governmental stakeholders towards a 100% sewered city and a consensus that while non-sewered solutions are cost-effective and practical, they are only a stop-gap measure. Other non-governmental and international stakeholders opine that non-sewered (FSM) solutions are certainly relevant and necessary in the long-term sanitation plans of the city.
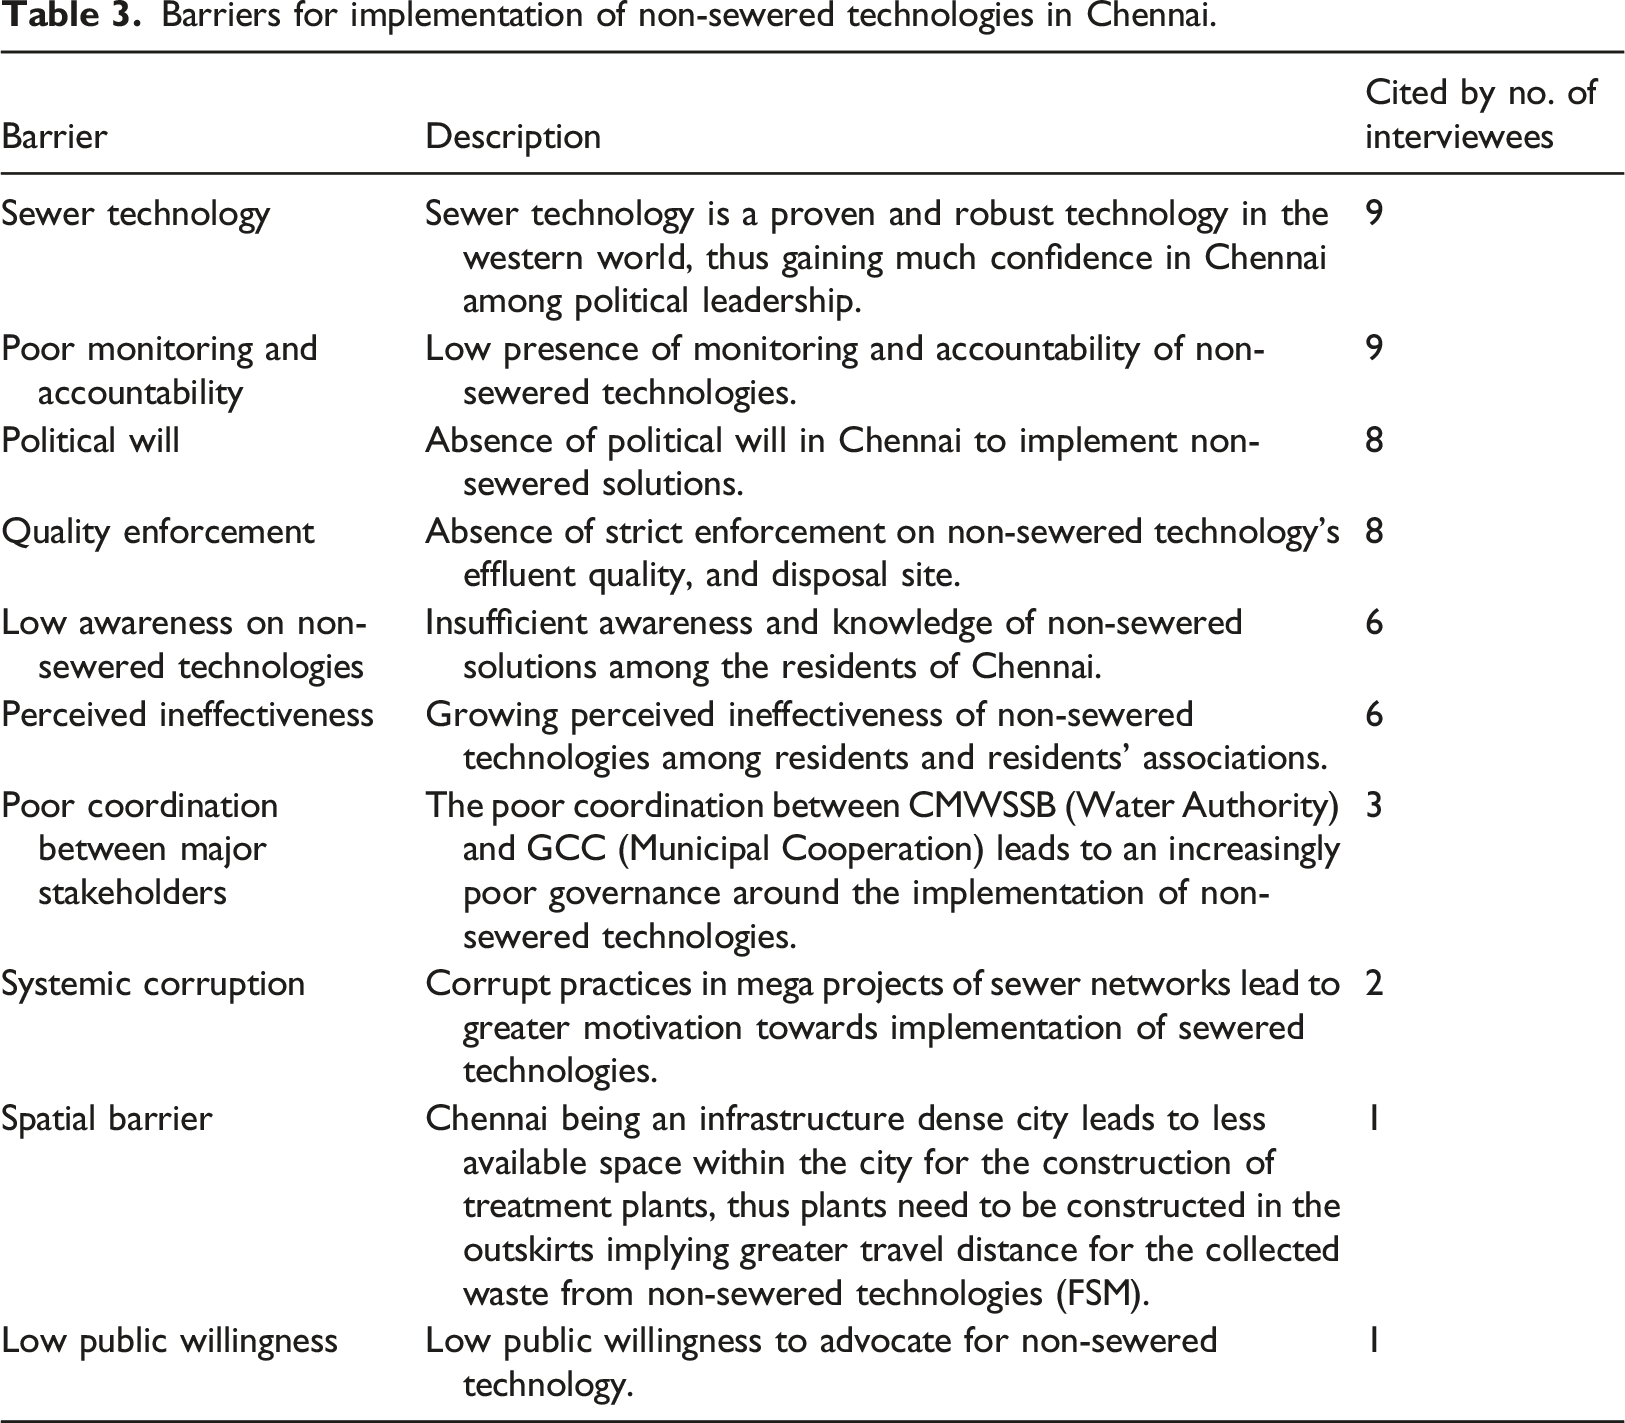
Barriers for implementation of non-sewered technologies in Chennai.
Criteria catalogue contextually formulated for implementation of a mix of sanitation technologies within the context of Chennai at a ward level of planning.
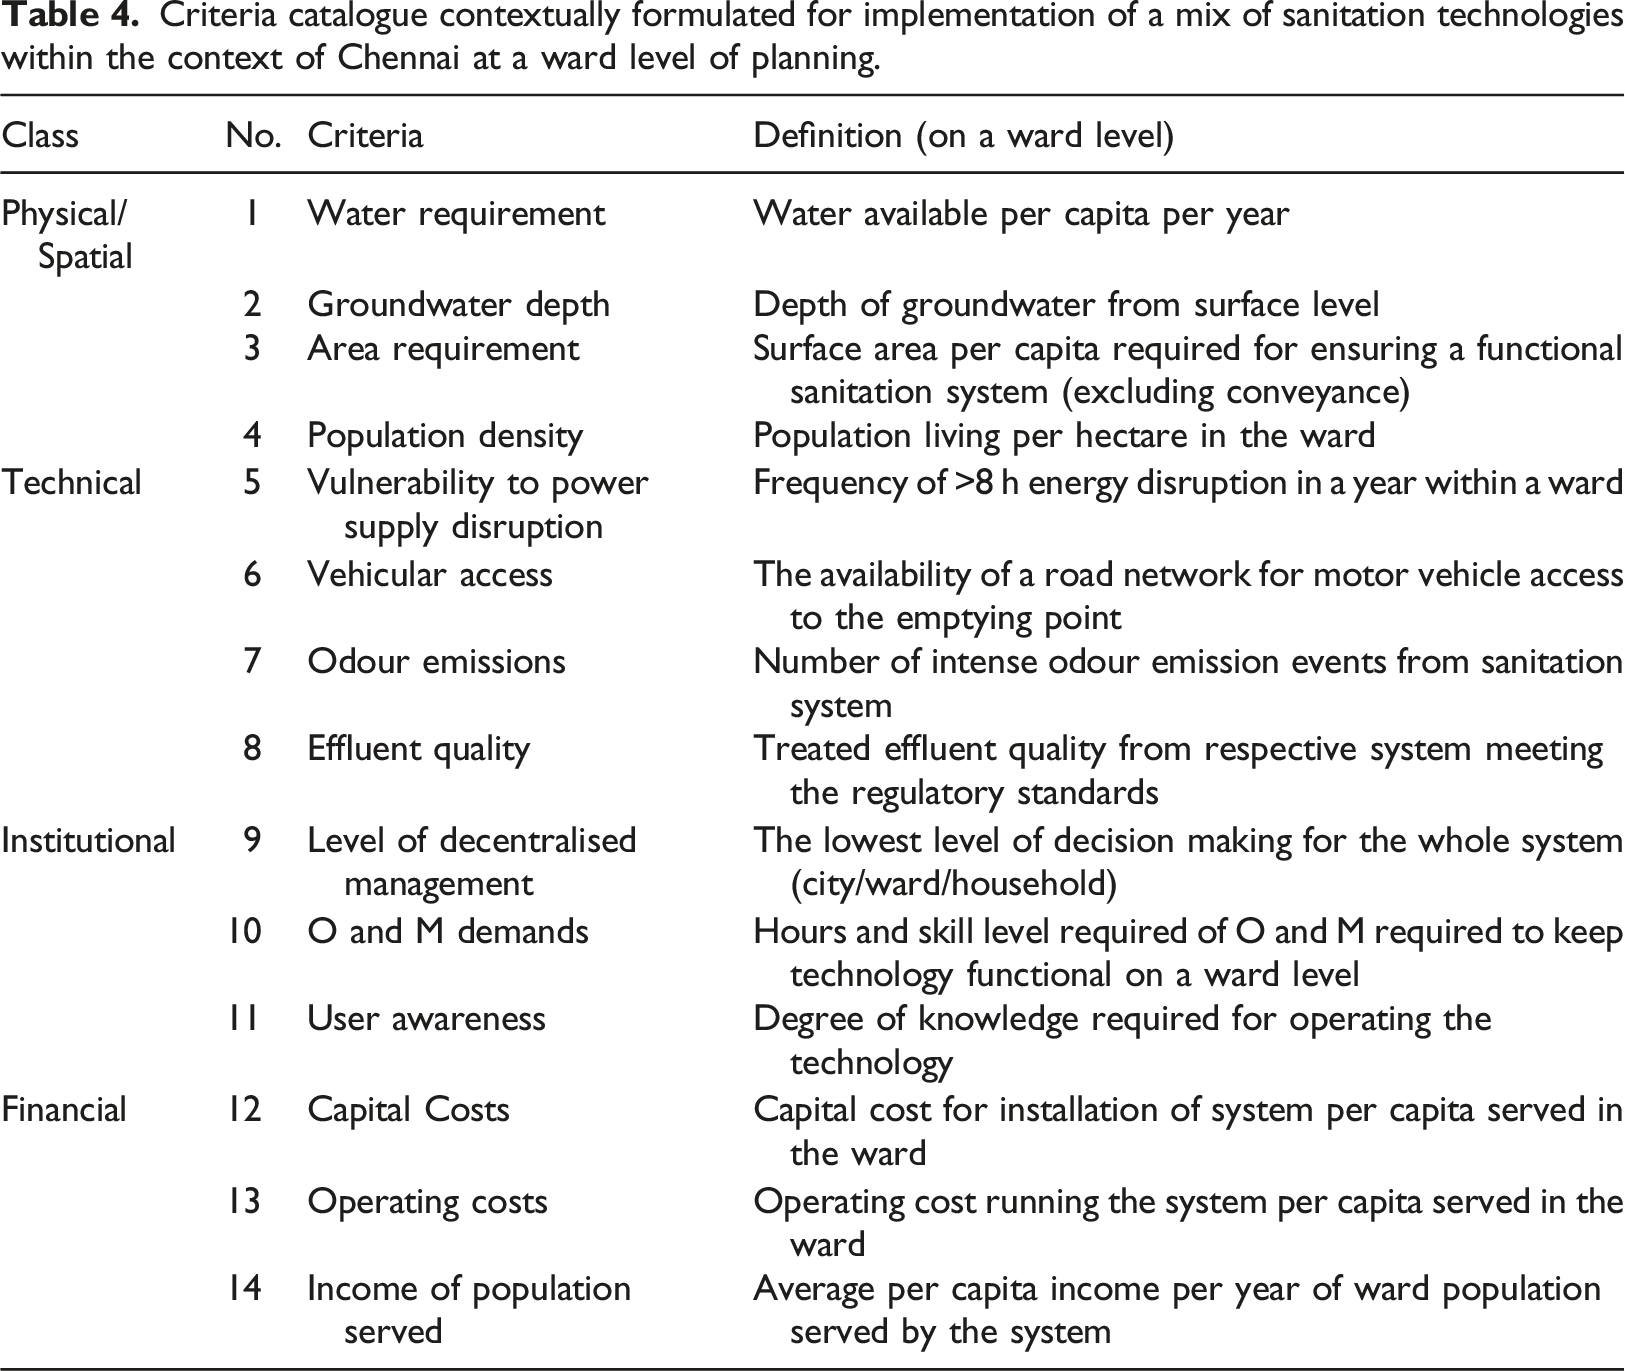
The identified drivers and barriers act as guiding points when planning the non-sewered sanitation systems in the city. These factors were also considered during the design of the criteria catalogue.
Criteria catalogue
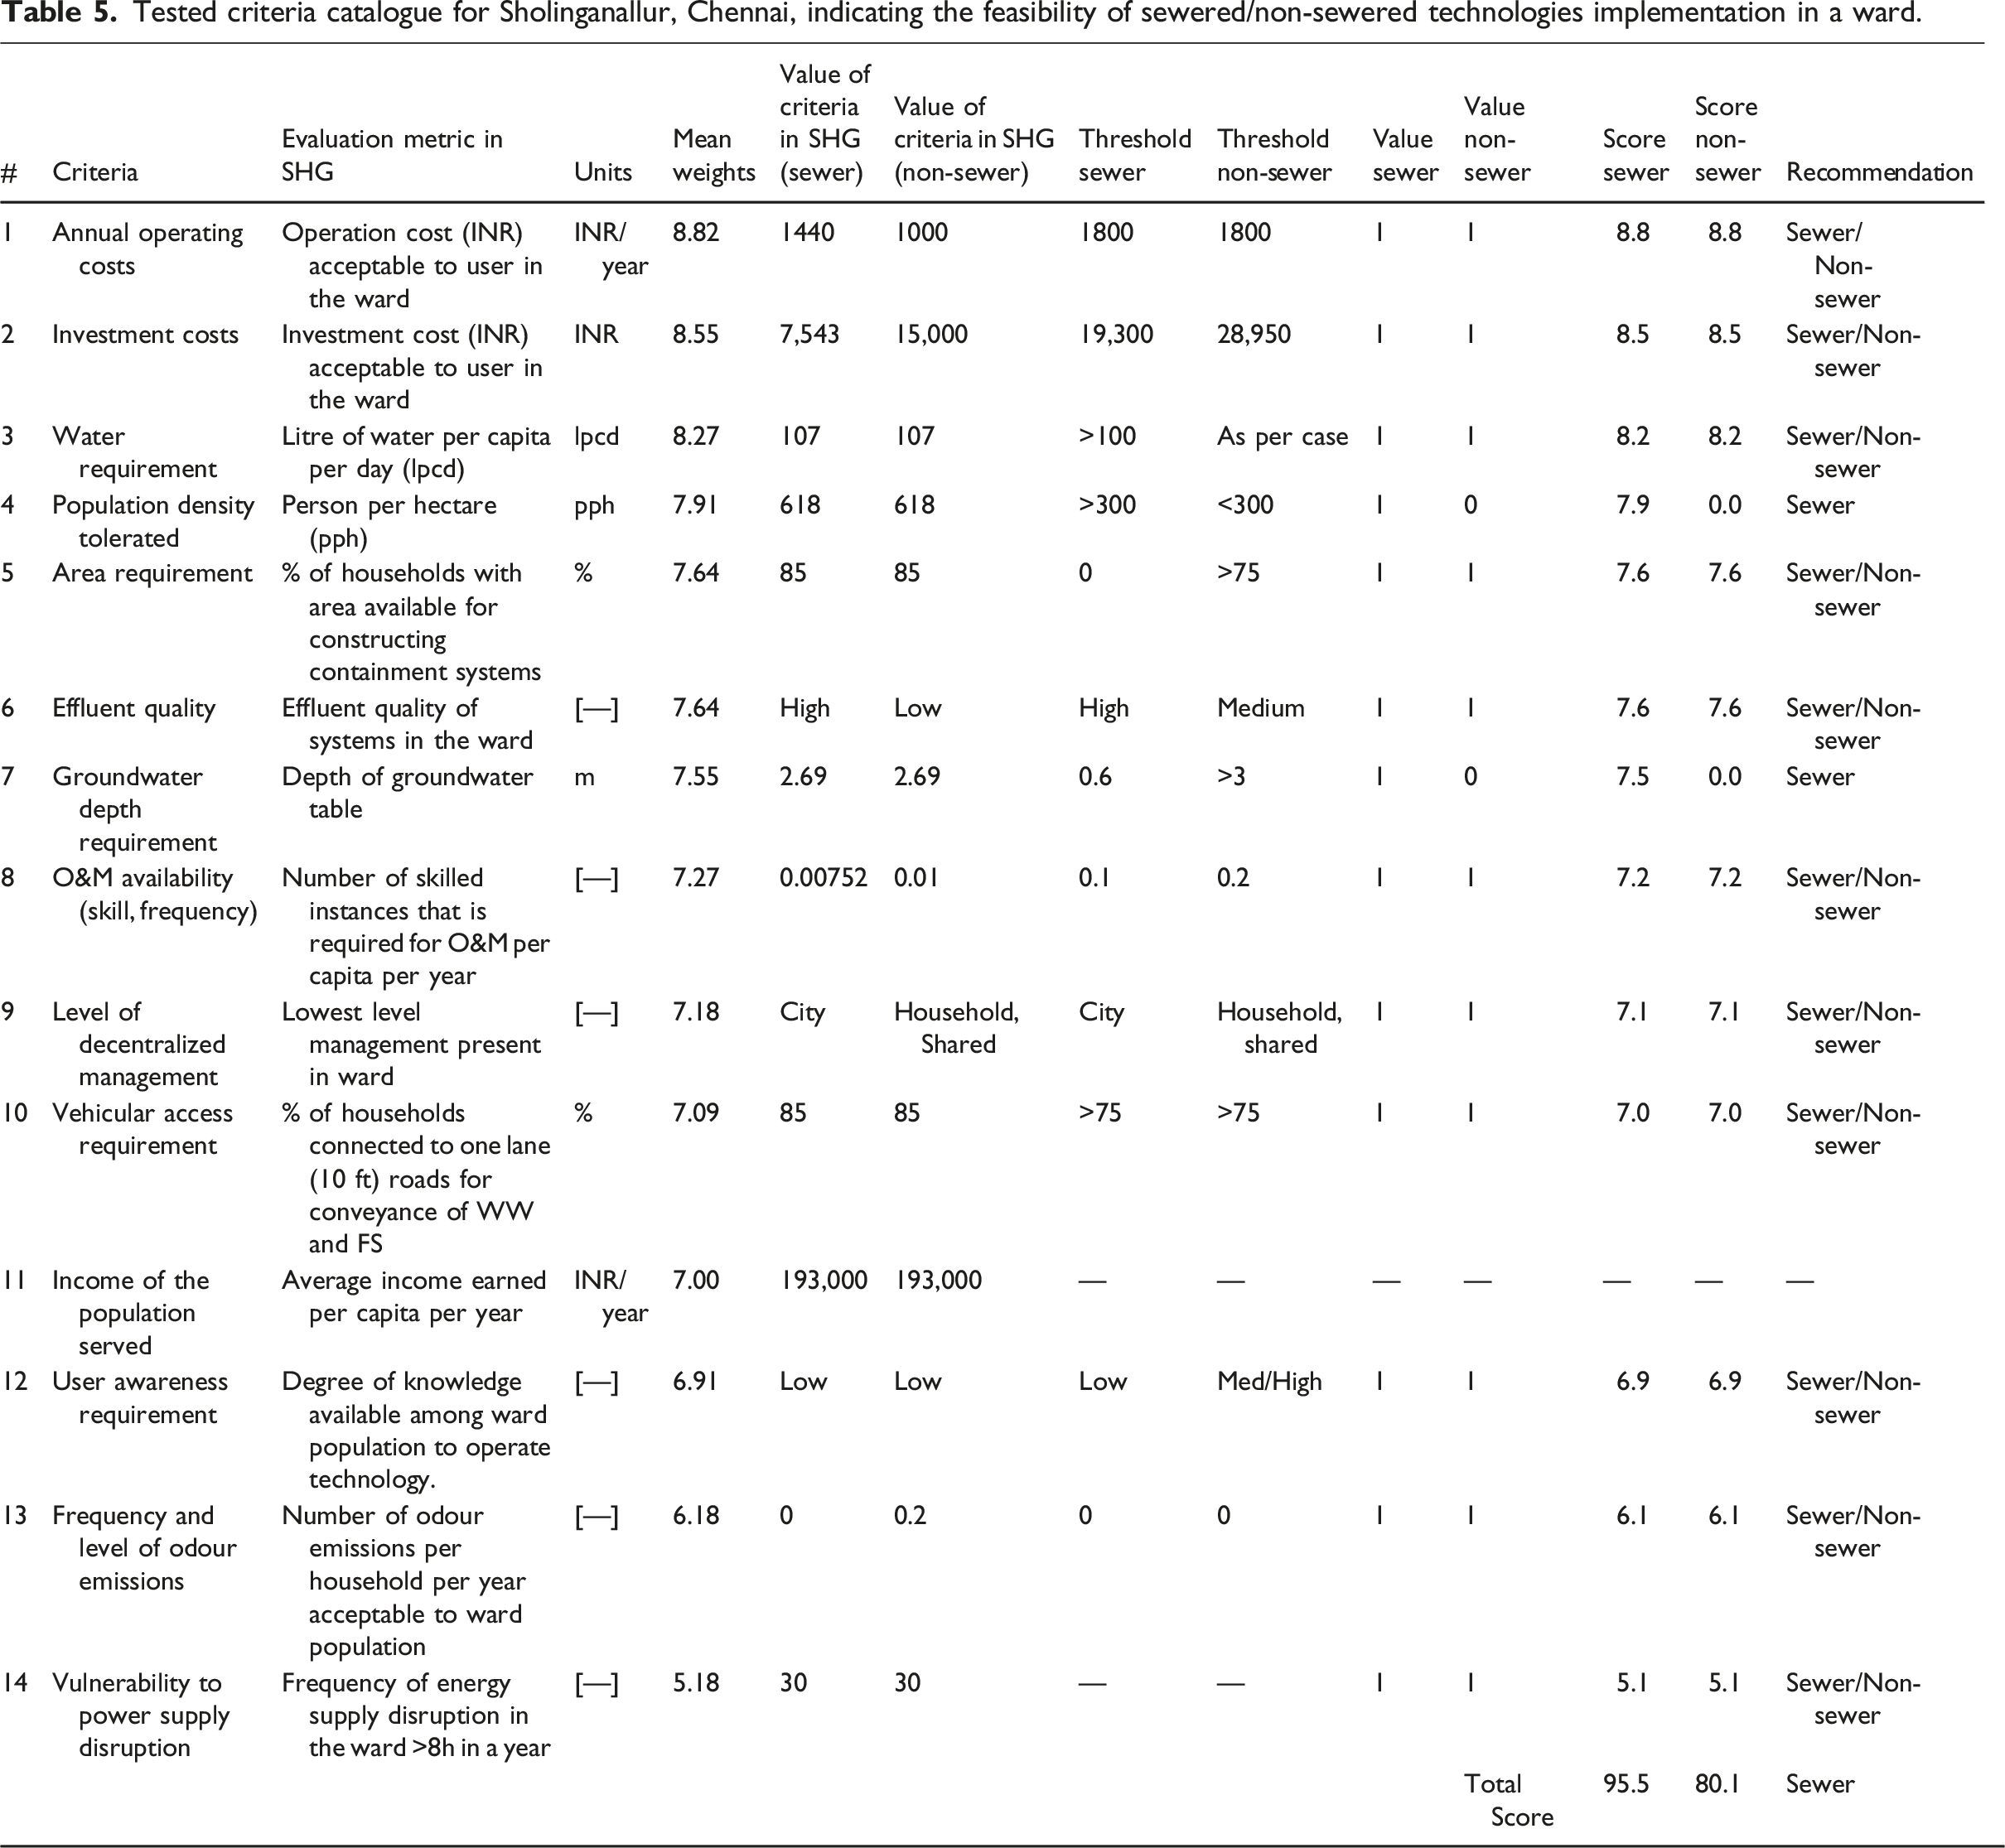
Tested criteria catalogue for Sholinganallur, Chennai, indicating the feasibility of sewered/non-sewered technologies implementation in a ward.
A natural limitation of these criteria is data availability and threshold definitions. Additionally, some of these criteria would be negotiable, and some non-negotiable. For these threshold values, negotiability must be decided based on the context. This catalogue only presents the factors to consider when making the decision on the type of sanitation system for the given area.
As part of the key-informant interviews, each criterion was weighed on a 10-point scale based on its perceived importance in implementation of a non-sewered system in Chennai. The weights received for each criterion in the catalogue are represented using a box and whisker plot in Figure 2. The upper and lower box lines along the x-axis represent the first and last quartile of the assigned weights to a particular criterion. For each criterion, the whiskers represent the variability outside the upper and lower quartiles of weighted scores and the mean is represented using a cross marker. The box plots for each of the 14 criteria are uniquely coloured and arranged in descending order of mean scores for consistent representation of the importance of criterion in the catalogue. Box plot representing each of the weighted criterion in the catalogue by the key-informant interviewees. The criteria are arranged in descending order as per each criterion mean represented with a cross marker in each box. The whiskers for each box indicate the variability outside the upper and lower quartiles of weighted scores.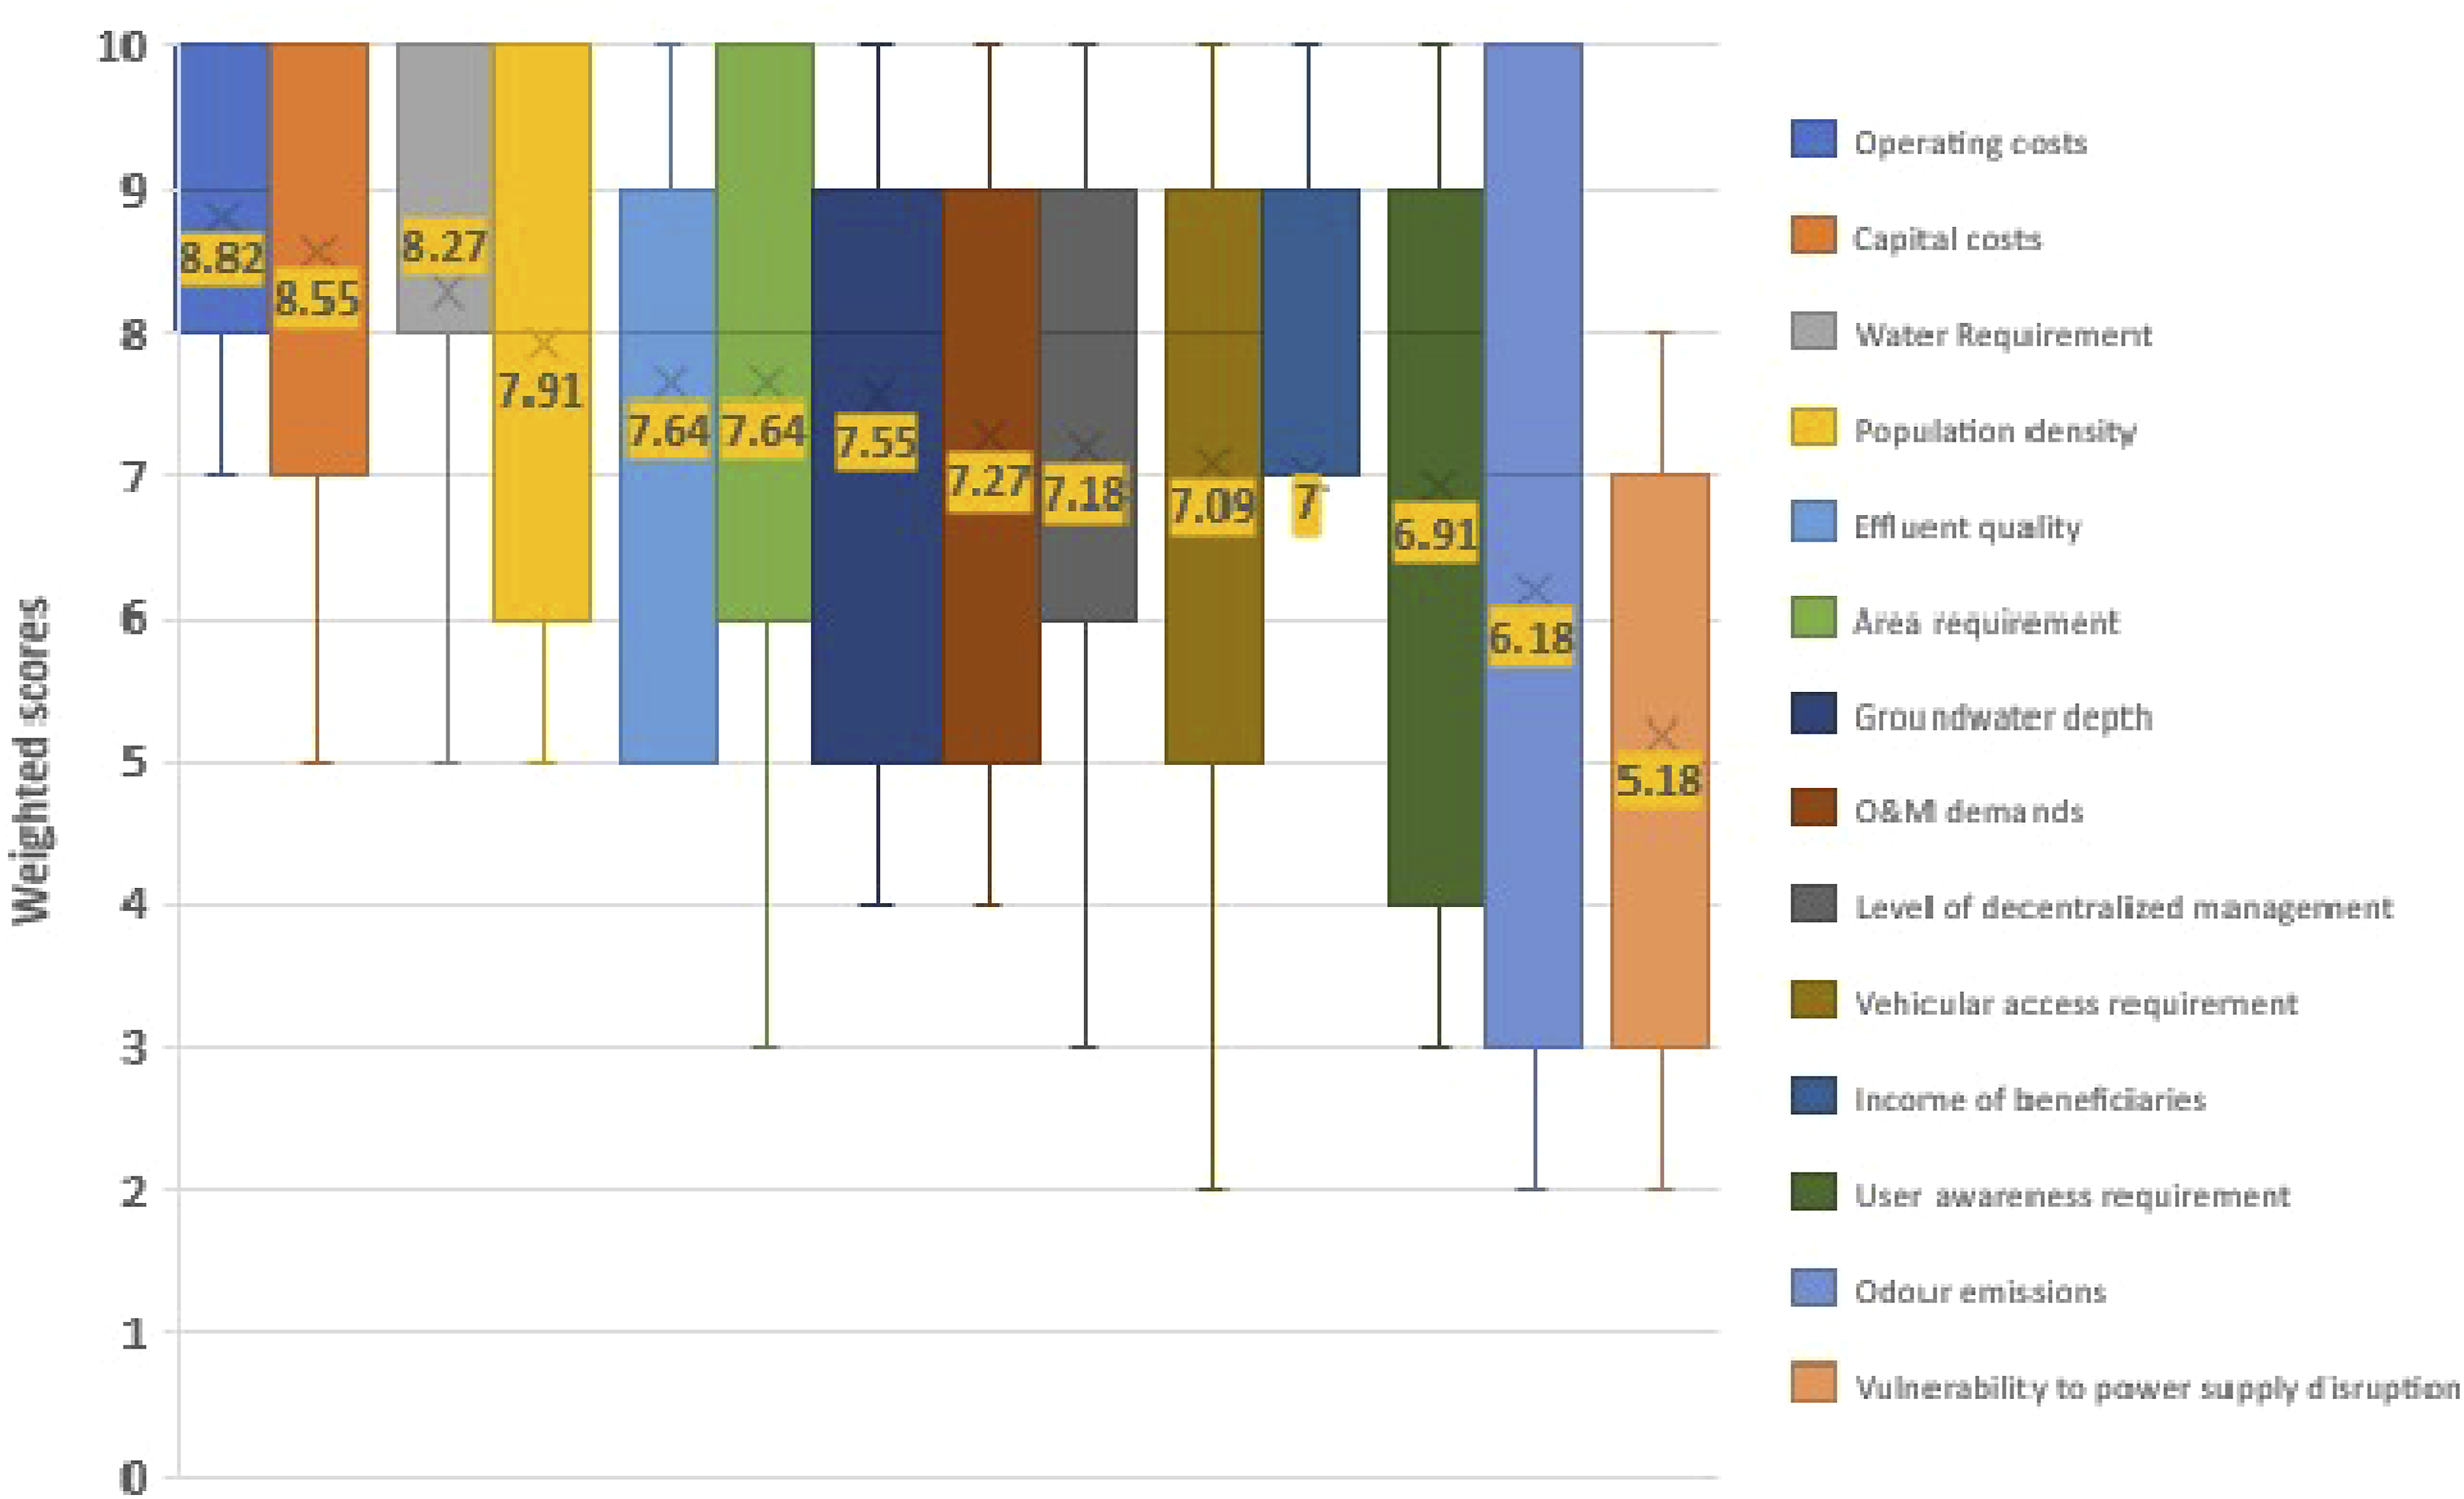
From Figure 2, it can be seen through the mean score that annual operating costs (8.82), investment costs (8.55) and water requirements (8.27) are perceived to be the most important criteria in the catalogue, and therefore weighed accordingly.
Testing the criteria catalogue for a ward in Chennai
A ward is the smallest administrative unit in the city governance structure in India. In a mega-city, each ward typically has a population of 100,000 or above. Considering the 74th Amendment to the Indian Constitution, which decentralises power and finances to the local municipal government, wards are the most local planning and civic engagement level in the country (Sharma, 2020). Therefore, to test the criteria catalogue in Chennai, the smallest administrative unit, the ward of Sholinganallur (SHG) is chosen.
Case study area description
Sholinganallur is a southern suburb of Chennai, India. As of 2021, Sholinganallur houses a population of 698,544 making it one of the most populated wards in the state of Tamil Nadu. The gender ratio of the ward population stands at 51%:49% between males and females, respectively. This shows that the ward of Sholinganallur displays an almost equal split between male and female population. The area of the ward spans across 1100 ha, with a high average density (approx. 618 inhabitants per ha). The topography of the ward is mostly a flat terrain with the presence of a lake within the ward. The average per capita per year income of the ward population is 193,000 INR (Statista, 2021).
The Tamil Nadu government is building a Financial City in Sholinganallur to house global financial corporations. Sholinganallur has become the IT corridor for Chennai city since major IT companies and major workforce (around 200,000 employees) are located in this region. Sholinganallur is home to several BPO and IT/ITES companies. Many major IT companies including Wipro, Infosys, Tata Consultancy Services, Automotive Robotics, Flintobox, 4iapps solutions, PayPal, eBay Inc, HCL Technologies, Cognizant (CTS), Tech Mahindra and Screen Plus have their own facilities in Sholinganallur. Many major IT/ITES companies including Accenture India, eBay, Trident Solutions, American Megatrends and PayPal have their presence here.
Sholinganallur is categorised inside the 15th Zonal division of Chennai and has a STP of 36 MLD capacity dedicated towards serving its population (CMWSSB, 2020). A ward-level SFD or other documentation presenting the sanitation landscape of Sholinganallur is presently unavailable in the literature; thus, the study assumes a fair majority of inhabitants are presently availing sewered technologies to meet their sanitation needs. This assumption is backed by the presence of a dedicated STP and high per capita income, which could be indicative of higher sewer services being availed by the inhabitants. A future study to prepare a ward-level SFD could provide better insights into the landscape of Sholinganallur’s sanitation systems.
The criteria catalogue was tested for Sholinganallur, and the results are presented in Table 5. The evaluation metric corresponding to each criterion was used to identify if the present conditions in Sholinganallur favoured sewered or non-sewered systems. Thresholds for the criteria were identified largely through the literature review and in some cases used proxy values, due to a lack of available data in the literature. Each criterion was assigned the binary numbers 1/0 as favourable or non-favourable conditions for the respective sanitation systems.
Since income of service users act as a threshold for two financial criteria, that is, Annual Operating costs and Investment costs, it is not considered in the assessment as an individual criterion, but is used instead to identify thresholds for all the financial criteria. The threshold for these criteria is taken from the literature, expert interviews and informed assumptions. Table S2 presents the justification of the input values in the criteria catalogue. Population density in Sholinganallur is relatively high at 618 people per hectare (pph), thus making it unfavourable for the implementation of non-sewered systems, since they are suggested for a maximum population density of 300 pph (CSE, 2016).
The study assumed that 85% of the households in Sholinganallur are part of formal settlements since it is an IT hub with modern infrastructure and planned urban layout with 10 feet wide access roads and adequate area for households to construct containment areas. Therefore, both sewered and non-sewered technologies were favourable under the criteria Area requirement and Vehicular access requirement.
Chennai receives 1,400 mm of rain every year, one of the highest rainfalls compared to other cities in India, and this consequently leads to a rise in the groundwater table of 2.69 m. Under these circumstances, non-sewered technologies are not favourable as the high-water table leads to cracking of outer walls of the septic tank and eventual failure of the containment unit if not lined with sufficient backfilling (DTNext, 2020).
Sholinganallur has both sewered and non-sewered systems currently operating, thus suggesting that different levels of management are present, that is, city level for sewered technologies, shared and household level for non-sewered technologies, and a thriving private sector for emptying and transport of faecal sludge. Therefore, both types of systems can exist under the decentralised management criterion.
A significant proportion of the local population is working in the IT sector and assumed to live in formal settlements. Since a majority of these existing buildings are sewered, the user awareness to operate decentralised sanitation systems is considered to be low, since their operation and maintenance is carried out by the water utility. However, non-sewered systems, despite requiring some level of user awareness, is a negotiable criterion, and through simple governance tweaks such as scheduled desludging or sensor-based monitoring, it can easily be attained. Therefore, both sewered and non-sewered systems are possible.
Odour emissions are undesirable in any sanitation system, and due to malfunction of any technology, it requires immediate attention (Pochwat et al., 2019). Sewered systems are not often subject to odour related issues as the wastewater flows through pipes below the ground and leaves little scope for the odour to reach the surface level. However, non-sewered technology such as septic tanks, unless emptied as and when full, could lead to a potential odour release once every 5 years (EPA, 2020). Since the odour emission frequency is significantly low and could be redressed by proper emptying, the study considered it within the acceptable range. Therefore, this criterion also is inconclusive for the selection between sewered and non-sewered systems.
Vulnerability to power supply disruption is a criterion that does not hamper the function of either systems, since sewered system rely on exclusive energy lines for their pumping and treatment, and non-sewered systems such as septic tanks do not require a power supply, and faecal sludge treatment plants do not exist within the ward limits. This criterion could favour both types of systems.
In sum, based on the individual criteria results from the catalogue, it is shown that for the feasibility of implementation of sewered and non-sewered system in Sholinganallur, the technologies received a total score of 95.5 and 80.1, respectively. Therefore, the weighted scores suggest the option of sewered systems over non-sewered systems due to the favourable enabling environment. While the paper does call for a mix of sanitation technologies, this single study tested criteria catalogue is only used to aid the selection of either sewered or non-sewered systems due to the assumption made that the ward is homogenous. A future scope of the study would be to test the criteria catalogue at deeper resolutions, that is, neighbourhood level and individual household levels to take heterogeneity into consideration.
Discussion
Chennai has taken several active steps towards the provision of sewered sanitation to its inhabitants through the expansion of sewerage services, construction of new STPs, expansion of existing STPs, etc. While there is a meagre increase of 3% in the safely managed faecal waste equivalence in the past 3 years, there is still a large percentage (35%) to cover. Considering that a significant part of Chennai’s population still has non-sewered sanitation systems, these could be systematically planned and adopted into the plans of the city. Further, sewered solutions could be considered wherever the feasibility and favourability exist for it along with a mix of appropriate sanitation systems, which includes non-sewered solutions, instead of a silver bullet solution to make the entire city sewered given the limited resources and urgency of the situation. The current situation provides a good scope for planning a mix of sanitation systems in line with the CWIS principles.
The SNA aided in identifying the most relevant stakeholders in the city’s sanitation sector. This, therefore, allows us to identify the stakeholders who are best placed to plan and govern non-sewered sanitation systems, who are currently falling through the cracks in the jurisdiction. It also shows the presence of international agencies such as the World Bank and the Gates Foundation, which can provide technical support in the planning and design of non-sewered sanitation systems in line with their CWIS programmes. The existence of state level support programmes such as the TNUSSP are also well placed to provide support to scale up their non-sewered sanitation expertise. The most relevant stakeholders, that is, CMWSSB, GCC and TNSCB, could be the priority actors who are centrally placed to coordinate and consider the implementation and governance of a mix of sanitation systems.
However, to mainstream such a mix of systems, it is pertinent to understand that the drivers and barriers are useful to see where more efforts are required and where synergies are needed. Interviewees highlighted that non-sewered technologies have a high resource recovery potential, lower capital costs and are easy to scale. The low political will towards mainstreaming non-sewered solutions because of the loss of multimillion-dollar sewer project opportunities was highlighted. This is also closely linked with the higher complexity of project implementation and governance, and the lower margin for corruption (Gambrill et al., 2020; Martel, 2017).
Apart from the challenge of initial acceptance from implementers and planners, non-sewered technologies generate a perceived ineffectiveness as compared to its sewer counterpart among the population due to its poor-quality enforcement, monitoring and accountability in India. This barrier must be overcome through strong governance components that include monitoring and accountability mechanisms.
It is evident from the findings that financial and physical criteria, that is, operational costs, capital costs and water requirements, top the list, while institutional and technical criteria are weighted lower since they are seen to be more negotiable. Interviewees suggested that communities would prefer a cheaper alternative over sewers if given an option. The importance of cost to a user surpasses all other criteria. Furthermore, the operational costs are weighed as more important than the capital costs, since after the installation, the user is seen to pay for the operations, whereas the capital could often be subsidized by the real estate developer, the government or shared by the community. However, these factors have to be considered according to the local contexts and the weights could also greatly alter.
While the treated water quality is seen to have a moderately high value (7.64), it depends on the end use of the treated water, that is, non-potable use such as flushing and landscaping, versus ecological use for recharging lakes and groundwater. There was some debate between experts on whether reuse of wastewater would be possible in the city, due to the religious and cultural norms. Vulnerability to power supply was weighed the least (5.18) since there were ways around such as generators, which are widely used as a back-up power supply. Other factors that did not feature in the list but were discussed with the experts include socio-cultural barriers and topography. Although relevant in such a criteria catalogue, they were deemed not so in the case of Chennai.
The tested criteria catalogue for Sholinganallur showed a split in cumulative scores for sewered and non-sewered technology for Sholinganallur of 95.5 and 80.1 points, respectively; thus, the implementation of sewered technologies in Sholinganallur is recommended as per this study. While sewered is recommended, the consideration of SSS technologies as an alternate could be further explored. Due to the hybrid setup of SSS, that is, decentralised and sewered, it could be considered as a cost alternate to sewer technology considering its contextual appropriateness and fulfilling all the criteria requirements.
The study was limited by the availability and accessibility of technocratic data since physical inspection and ground level data collection was not possible due to the COVID-19 pandemic. Therefore, in the ward-level testing of the catalogue, a few values were filled through informed assumptions. Future research could use these criteria as a base to develop multi-criteria-based decision analysis and test this approach in various other contexts in India and beyond. The study considered a homogenous population for the ward; however, it may not be homogenous, especially on a neighbourhood level, which is already the size of cities in other parts of the world and where inequalities are quite high. Therefore, in future research, we could use GIS based layers to arrive at more precise resolutions and incorporate heterogeneity in the analysis. Additionally, a sensitivity analysis on the critical input variables such as the criteria used in the catalogue, ranking of the criteria and the selection of interviewees is strongly recommended as a future step. This analysis will provide a deeper insight into how the input variables interact with each other when testing the catalogue. CBS and SSS systems were not considered, for which there needs to be further studies to make sure we consider these technologies and the scale. Despite these limitations this paper presents a first step in drawing up the criteria that need to be considered while making decisions on sanitation investments. This criteria catalogue is not a tool but rather a first attempt at a concept of decision aiding between sewer/non-sewer technology, which could further be developed as a decision-making tool.
Conclusion
While India faces the challenge of safely managed sanitation post the Clean India Mission, which only looked at latrine access, the mix of sanitation systems could be a pragmatic way forward, in line with the CWIS approach. However, the criteria to plan and design such a mix of sanitation systems remain complex. This research makes a first attempt at exploring the various factors that need to be considered in order to decide between sewered and non-sewered systems.
The city of Chennai is an excellent example where, despite many ambitious initiatives from the city’s water and sanitation utility in expanding the sewer network, a meagre increase of 3% of the population towards safely managed sanitation has happened according to the SFD. It shows the need for efforts in taking alternative sanitation systems to scale despite the sewer aspirational mind. The SNA shows us a way forward in the institutional cooperation to scale up non-sewered sanitation.
The driver-barrier analysis shows that the major barriers for non-sewered sanitation are political will, perception, and poor monitoring mechanisms, while the drivers include costs and potential resource recovery opportunities. The systematic uptake, therefore, needs to be supported by strong policies and accountability mechanisms along with the creation of additional revenue streams for reuse.
The criteria catalogue presented in the study was weighted according to the local context of the city and tested in the ward of Sholinganallur. This theoretical testing shows that sewered solutions are still preferred due to the local conditions. It also shows that the criteria catalogue is not biased towards only non-sewered systems, but rather encourages planners to consider a mix of sanitation systems to co-exist wherever appropriate. Sewer technology has also shown, as per SFD 2021 presented in Figure S2, to be leaking and polluting the groundwater during conveyance; therefore, the city administrative body needs to pay closer attention to see whether these sewers can indeed be monitored well to prevent leakages. The criteria catalogue has played a deciding role in the case of Sholinganallur in Chennai. However, considering the vast variance between cities due to their various typologies, determining factors might change the results of the criteria catalogue drastically in addition to having different context specific criteria added to the catalogue. A future scope of this work would be to test the criteria catalogue against a larger sample, for at least 4 wards in different typologies of the city - to justify the indicators and conclusions derived from this study, as having a larger validity. At a larger scale, while the criteria gathered for this study are contextually specific for Chennai, a similar methodology could be carried out for preparing and testing a criteria catalogue contextually specific for a few other mega-cities. The criteria catalogue is not presented as a decision-making tool but rather it presents a list of criteria that have to be considered during the decision-making process. However, we do want to present this now so that in the future with more developments in the field, this could then help build a tool that can incorporate decision-making as well. While sanitation in cities of the global south in the future may look like a potpourri, there is method in this madness for reaching targets of sanitation planning and implementation.
Supplemental Material
Supplemental Material - Sanitation potpourri: Criteria for planning mix of sanitation systems for citywide inclusive sanitation
Supplemental Material for Sanitation potpourri: Criteria for planning mix of sanitation systems for citywide inclusive sanitation by Anant Mitra, Abishek S Narayan, Christoph Lüthi in Environment and Planning B: Urban Analytics and City Science.
Footnotes
Acknowledgements
We sincerely thank Prof. Dr. Max Maurer for his constant support and guidance as head supervisor during the MSc. Thesis which is the inspiration of this study. We thank each interviewee who participated in the research and helped this study with their valuable contributions. Furthermore, we thank Neetika Thapan for her valuable comments and feedback on the research design and study. Finally, we would like to thank Dr. Dorothee Spuhler for her valued guidance towards the preparation of the criteria list used in the catalogue.
Declaration of conflicting interests
The author(s) declared no potential conflicts of interest with respect to the research, authorship, and/or publication of this article.
Funding
The author(s) disclosed receipt of the following financial support for the research, authorship, and/or publication of this article: This work was supported by the Swiss Agency for Development and Cooperation.
Supplemental Material
Supplemental material for this article is available online.
Notes
References
Supplementary Material
Please find the following supplemental material available below.
For Open Access articles published under a Creative Commons License, all supplemental material carries the same license as the article it is associated with.
For non-Open Access articles published, all supplemental material carries a non-exclusive license, and permission requests for re-use of supplemental material or any part of supplemental material shall be sent directly to the copyright owner as specified in the copyright notice associated with the article.