
Abstract
In recent years we have witnessed explosive growth in the shared, free-floating, electric scooter industry. While still controversial in many North American cities, a number of large e-scooter operators have managed to carve out a piece of the urban transportation landscape. As these vehicles shift from novelty services to increasingly reliable modes of short personal travel, the discussion has turned to investigating who exactly benefits from these micromobility services and who are being left behind. Though population surveys have been administered to identify the socio-demographic characteristics of e-scooter riders in the past, little work has linked these characteristics through trips, or investigated the regional variation in these demographic factors. In this work we explore the variability and similarities in e-scooter rider characteristics across three major U.S. cities. To accomplish this, we apply a Moran’s Eigenvector Spatial Filtering linear regression model and compare our results to more commonly used spatial regression approaches. Our results indicate that the spatial filtering approach outperforms other methods in identifying socio-demographic characteristics of e-scooter users, across multiple regions. We find that many socio-demographics associated with e-scooter usage are regionally variant, despite younger users making up the core user base in all cities. There are variations in usage based on gender, income, and race across cities with Black and Hispanic populations remaining underserved. The implications of these findings are discussed.
Introduction
The introduction of free-floating electric scooters (e-scooters) as a commercial mode of personal travel substantially disrupted transportation ecosystems in many cities around the world. By the end of 2018, dozens of e-scooter companies were operating large fleets of vehicles in hundreds of cities around the world. Initially presented as a solution to the last mile problem, these e-scooters are a relatively inexpensive option for short trips within a city, compared to personal automobile ownership. A user can rent an e-scooter simply by downloading a mobile application, adding payment details, and unlocking/locking any available vehicle through their mobile device. The dockless aspect of these systems means that, in most cities, vehicles can be parked on any public property and are not restricted to docking stations such as those installed by traditional municipal bike-sharing systems. While adoption of this new mobility technology was initially met with resistance from both the public and municipal regulators, many cities have now committed to the expansion of free-floating e-scooter systems.1, 2 Despite the COVID-19 pandemic, there has been considerable growth in e-scooter adoption in a short amount of time. In 2022, the U.S. Department of Transportation (2022) estimated that there are over 300 e-scooter systems serving 158 cities across the United States. A recent study by Polaris Market Research (2022) estimates that the global e-scooter market size will reach almost US dollar$51 Billion by 2030.
Despite this growth, there is still a dearth of knowledge related to who these e-scooters are benefiting. Mobility patterns are largely influenced by regional variations in historical development and urban planning decisions (Gössling et al., 2016). Every city’s unique socio-economic and geo-demographic characteristics shape its mobility, apparent in e-scooter usage patterns between and within cities (Caspi et al., 2020). While cities differ in their mobility needs and challenges, it is important to understand how these varying patterns emerge across urban regions to develop effective strategies for managing these systems. In this study, we compare regional variation in e-scooter usage across three e-scooter systems in Washington DC, Portland, and Atlanta. Of these cities, Washington DC has the highest population density, followed by Portland and then Atlanta. 3 Average walkability scores also exhibit a similar trend, with Washington DC maintaining the lowest car ownership per household. The downtown areas of Washington DC and Portland are the primary centers for jobs and businesses, whereas in Atlanta, they are split between multiple business districts throughout the city. Space-use in core urban areas, where most micromobility services prefer to operate, is distinct from surrounding areas as core business districts are largely concentrated within this region (Gong et al., 2016). As a result, core parts of the city facilitate unique trips due to employment opportunities, centralized resources (e.g., retail, hospitals, universities, and ports) and existing mobility alternatives (metro, rail, buses, streetcars, or other).
In many city governments, ensuring access to affordable transportation is a top priority. To address inequities that people face in getting around a neighborhood or city, municipalities regulate where these services are operated (Riggs et al., 2021). Since the introduction of e-scooters in 2017, regulators in Washington DC have been working to make micromobility services more accessible outside the city center. In 2020, the city enforced a limit of 1000 vehicles per operator in core business areas and defined equity zones to improve vehicle deployment in low-income and disadvantaged racial groups. 4 To ensure accessibility, municipal governments in Portland and Atlanta require e-scooter operators to offer affordable pricing options for lower income individuals.5, 6 It is essential that we better understand who are using these services, who are not being served, and how this new mode of transportation may be contributing to inequities within our cities.
Millions of US dollars are invested in public transit, active transportation, and urban infrastructure every year. There is, however, limited public space on which to travel and while the addition of e-scooters to this ecosystem has increased the variety of modes of transport, it has been shown to replace trips that would have been taken by other means (e.g., walking and driving). While we have some knowledge of the population that walk and drive, far less is known about those that use e-scooters. In order to develop policy to address inequities in access to e-scooter systems, we must first understand who are taking e-scooter trips and how these populations differ between cities.
While a number of studies have investigated the socio-demographics of e-scooter usage in cities, few of them have taken a geostatistical approach to look at trip origins and to our knowledge, none have conducted socio-demographic spatial analysis of these systems across urban regions. In this work we take a new approach to analyzing this type of data by controlling for spatial autocorrelation in the data through a Moran’s eigenvector spatial filtering (MESF) model. We test this approach using a range of spatial weight matrices and compare this method to more commonly used spatial regression models such as spatial lag and spatial error. In analyzing the spatial patterns of our independent variables across regions, we are able to better understand the similarities and differences in e-scooter users. Such exploratory analysis is necessary in order to identify how cities differ in their usage behavior and to what extent some communities are being underserved. With these objectives in mind, our work aims to address the following three research questions (RQ). RQ1 Are the associations between socio-demographics and shared e-scooter users regionally variant? More specifically, is there regional variation between the cities of Washington DC, Portland OR, and Atlanta GA in the United States? RQ2 Can the MESF technique effectively account for underlying spatial patterns? How well does this technique capture correlations between e-scooter trips and socio-demographic patterns across three different regions? RQ3 How does MESF perform in comparison to more traditional geospatial analysis techniques such as spatial lag or error models? Does the inclusion of spatial eigenvectors improve model performance?
Background
While e-scooter usage varies by city, it tends to be highest in central business districts, areas of high employment, and around university campuses (Bai and Jiao, 2020). In general, population density appears to have a strong positive correlation with e-scooter usage (Reck et al., 2021; Zuniga-Garcia and Machemehl, 2020). These services have been shown to primarily substitute trips that would have been made on foot, followed by trips on public transit (Sanders et al., 2020; Speak et al., 2023). This confirms previous findings that report a positive association between walkability and the availability of other public transport services (Caspi et al., 2020; Hosseinzadeh et al., 2021). Thus, e-scooter services may fulfill the first and last-mile transportation gap in some cities (Liu et al., 2019; Reck et al., 2021). Previous work has shown that e-scooter users prefer to ride in areas with designated bike lanes or lower speed limits (Nikiforiadis et al., 2021; PBOT, 2018). These findings are consistent with existing research that suggests a strong positive correlation between the availability of bike infrastructure and e-scooter usage (Caspi et al., 2020; Reck et al., 2021). Related, e-scooter users exhibit a willingness to travel longer distances to access bike lanes (Zhang et al., 2021). Additionally, the presence of a sidewalk and limited automobile traffic is important for e-scooter riders (Tokey et al., 2022; Zhang et al., 2021). Furthermore, a positive correlation between e-scooter usage, areas with high commercial land use, higher diversity in land-use types, and intersection density has been observed (Bai and Jiao, 2020; Caspi et al., 2020). Parks and commercial areas are positively associated with higher usage, whereas higher industrial land use is negatively correlated in some cities (Bai and Jiao, 2020; Hosseinzadeh et al., 2021).
Differences in how e-scooter services are utilized can lead to variations in the socio-demographic characteristics of users across cities. According to a survey from Portland’s e-scooter pilot program, the majority of residents viewed e-scooters favorably, particularly younger populations, people of color, and those from lower income groups (PBOT, 2018). These findings are consistent with Baltimore’s pilot study, which reports e-scooters to be popular among younger populations and among African American and Hispanic groups (Baltimore City Department of Transportation, 2019). However, studies also report limited access to e-scooter services among minority populations, especially Hispanic and African American groups (Bai and Jiao, 2021; Sanders et al., 2020). For example, in Baltimore, 75% of e-scooter users were white despite only making up 30% of the population. Additionally, ridership surveys show males appear to favor e-scooters more than females (Denver Public Works, 2019; PBOT, 2018). In some cities, where e-scooters are available on university campuses, students constitute a large portion of e-scooter users (Bai and Jiao, 2020; Caspi et al., 2020; Liu et al., 2019). In contrast, in Washington DC and Baltimore, where leisure trips are reported to be the most popular type of trips, e-scooters tend to be used by a larger population (Baltimore City Department of Transportation, 2019; McKenzie, 2020).
Various modeling techniques, both non-spatial and spatial, have been used to explore the association between socio-demographics and built environment with e-scooter usage. Only a few studies have explored the variability in this relationship across cities. Huo et al. (2021) and Younes and Baiocchi (2022) used a Negative Binomial Model approach to understand determinants of e-scooter usage across multiple cities. They report that built environment factors including intersection density, road network, and employment are positively correlated with e-scooter usage across cities. Younes and Baiocchi (2022) also report that the proportion of minorities (Black or Hispanic) and low wage-employment within a census block group are negatively correlated with usage in all cities. Bai and Jiao (2020) compared e-scooter trip usage in Austin and Minneapolis using a similar approach and report that lower income and higher education were positively correlated with e-scooter trips in both cities, largely due to a high number of university students using these services. However, Zuniga-Garcia and Machemehl (2020) used a Spatial Error model to explore this relationship in Austin and report that household income, racial backgrounds, or age were not significant in determining e-scooter trip origin or destination.
Considerations for space in statistical models are often addressed using hot-spot analysis to implicitly consider spatial dependence. Younes and Baiocchi (2022) use hot-spot analysis and an individual Negative Binomial model for each city to model the relationship between e-scooters, socio-demographics, and the built environment. Bai and Jiao (2020)’s multi-city approach used hot-spot analysis to understand the relationship between e-scooters, socio-demographics, and built environment factors but exclusively focused on regions that were identified as hot-spots. Huo et al. (2021) use a hierarchical linear model to consider nested structures, enabling accommodations for spatial dependence by explicitly considering scalar effects. Additional work by Reck et al. (2021) applied a spatially explicit Generalized Linear Mixed Model approach to explore the association between the built environment and e-scooter usage in Louisville. This work used spatial aggregations at the census block level and observed spatial autocorrelation. Reck et al. (2021) demonstrate that correcting for spatial patterns improves model fit. Ultimately, these models are limited by their capacity for accommodating spatial dependence.
While the MESF technique is novel for socio-demographic e-scooter analysis, a number of studies have employed this technique in other domains. Brown et al. (2022) used MESF with bike-share data to correct for spatial autocorrelation in the regression residuals of the non-spatial model. Similarly, Hochmair et al. (2019) applied this technique with Strava bike data to account for spatial autocorrelation observed in residuals of the non-spatial model. Beyond micromobility systems research, MESF has been used effectively to consider spatial dependence in geographic applications. Xiao et al. (2017) applied MESF in an OLS model to explore factors that influence housing prices in Beijing.
Methodology
Data
Trip counts, operators, and time frame by city.
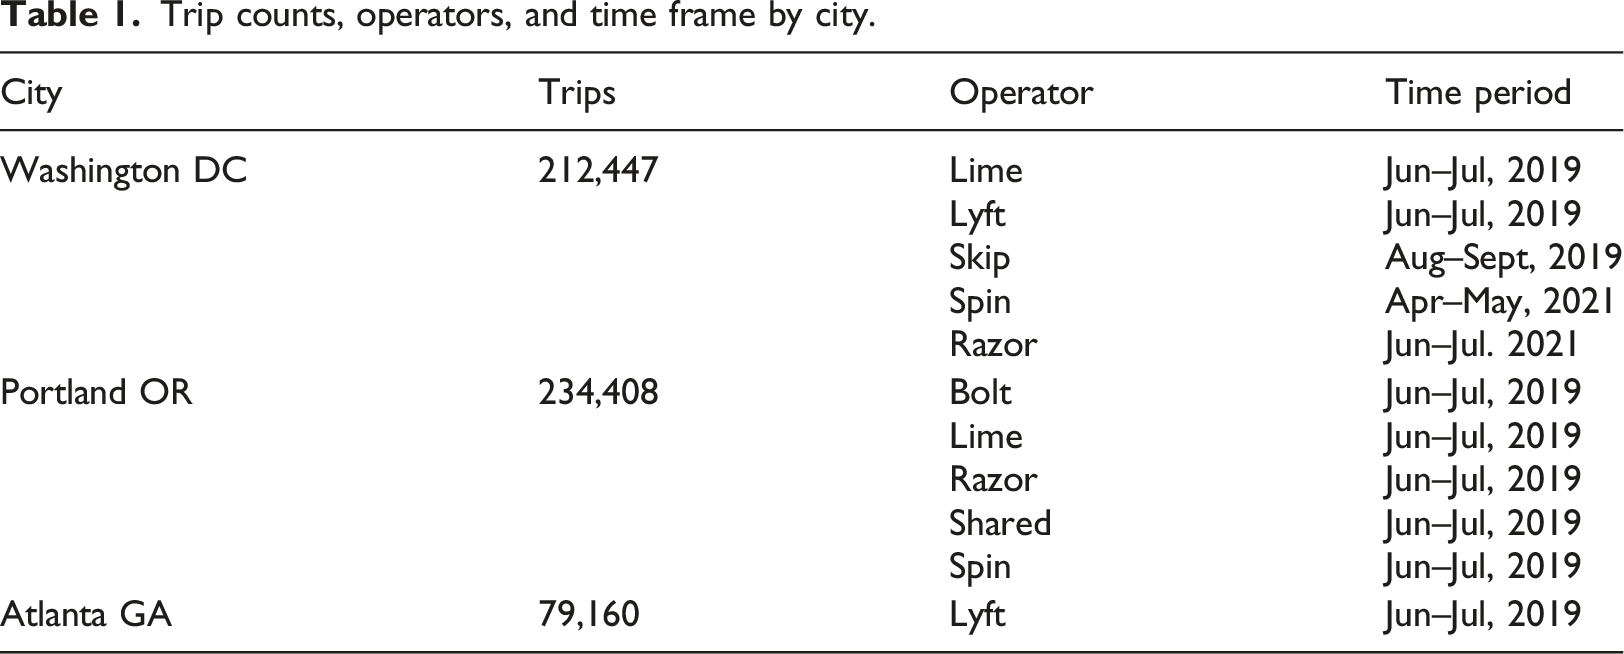
We filtered the trip data to focus on the warmer months when e-scooter usage is higher due to more favorable weather conditions. Table 1 presents a summary of the total number of trips, operators, and time periods from which the data were acquired. Data from 2020 is omitted from the analysis as mobility was restricted during that year due to the COVID-19 pandemic. In this study, we restrict our analysis to trip origins. Given the free-floating nature of micromobility services, the majority of trip destinations become trip origins for another trip meaning there is little difference between analysis using trip origins and analysis using trip destinations. Provided our set of trip origins, we spatially intersected them with census block groups (CBG) from the U.S. Census Bureau (2019), allowing us to calculate the total number of trips originating in each CBG. We observed outliers in trip counts across all cities, causing the response variable to deviate from a normal distribution. To address the underlying assumption of normality within a linear regression model, we applied a logarithmic transformation to trip counts in each city. 7
We acquired census socio-demographic data from the 2019 American Community Survey 5-Year estimates, from the U.S Census Bureau. We used the finest spatial resolution available for this time period, which was the CBG. The socio-demographic variables for our analyses were grouped by age, gender, race, and income. This information was obtained for 449 CBGs in Washington DC, 441 in Portland, and 313 for Atlanta. We normalized demographic variables by the total population of the CBG and applied a mean standardization for meaningful interpretation of model results. As urban infrastructure and design may considerably impact e-scooter accessibility and usage, we integrated the National Walkability Index dataset from the U.S. Environmental Protection Agency (2021) to control for built environment factors in the model. Variables informing the index include street intersection density, proximity to public transportation, number of workers, and entropy measures for various employment types (i.e., retail, office, or industrial). We use the index as well as the number of workers and the listed entropy measures to consider the built environment in our models.
Analysis
Model specification: Exploratory analysis of our independent variables showed a strong correlation among socio-demographic groups as well as built environment characteristics. These findings align with previous research that report a high correlation between population and employment density or age and income (Caspi et al., 2020). We used the variance inflation factor (VIF) metric, which measures the correlation between independent variables in a given model. A VIF closer to 1 indicates a weak correlation, whereas a value above 5 indicates a strong correlation. We found a high degree of multicollinearity in our model, particularly with certain race and income variables, which can lead to inflated coefficient estimates (Shrestha, 2020). To address this issue, we set a VIF threshold of 5, a commonly accepted value, supported by the literature, to correct for multicollinearity in independent variables. We removed any socio-demographic variables exceeding this threshold from our final models.
Next, we used Moran’s Index, I (Moran, 1950) to examine the presence of spatial autocorrelation in trip origins and residuals of the exploratory linear model. The analysis is presented in detail in the supplemental material. Results reveal significant spatial autocorrelation in both the dependent variable and model residuals.
Modeling approach: MESF was then employed to correct for the observed spatial autocorrelation. This technique is an extension of a linear regression model that eliminates spatial autocorrelation from the residuals using eigenvectors that are derived from Moran’s I measures of a spatial weights matrix (SWM). This results in residuals appearing independent and uncorrelated (Griffith et al., 2019). Specifically, the MESF model is defined as:
where X is a matrix of explanatory variables and β is a vector of its coefficients, and E is a matrix of selected eigenvectors and γ is a vector of its coefficients. y is the response variable and ϵ is a vector of the error term. Eigenvectors present a spectrum of possible map patterns that may exist in a spatial arrangement of observations (Thayn, 2017). Eigenvectors can have a positive or negative value, with large positive values indicating greater positive autocorrelation between observations. These describe global or local spatial patterns in the study area (Murakami, 2017) and resulting eigenvectors are definitively orthogonal. A parsimonious subset of eigenvectors was iteratively selected to be included as covariates in a linear MESF model. This iterative selection process was executed until the Moran’s I test no longer rejected the null hypothesis (Tiefelsdorf and Griffith, 2007). In this process, eigenvectors with small absolute values are excluded, as they capture little spatial structure in the data and do not improve model fit (Dray et al., 2006).
Spatial weights matrices: Spatial weights matrices are used to define spatial relationships between observations in a study area, making it a crucial step in most analyses. Different matrices produce different eigenvectors and have been observed to produce varied results (Bauman et al., 2018; Dray et al., 2006). We explored three distinct graph-based methods to represent the spatial structure, each aimed at capturing local spatial effects in unique ways. These included queen contiguity, k-nearest neighbor, and Gabriel graph. In graph-based representations CBGs serve as nodes and edges are created between neighboring nodes. Edges of a node represent its first-order neighbors. The queen contiguity matrix creates an edge between a CBG polygon and other CBGs that share a common boundary or vertices. It prioritizes CBGs that are directly adjacent, irrespective of their size or shape (Anselin, 2002; Getis, 2009). In contrast, the k-nearest neighbor graph considers a specified k-number of closest CBG centroids based on Euclidean distances as neighbors. This approach inherently accounts for both shape and size, while ensuring an equal number of neighbors across all nodes. In this study, we consider the four closest CBGs (k = 4) as neighbors for each node. The Gabriel graph also factors in shape and size but goes a step further by considering the relative location of other points in the study area. It creates an edge between two points when no other node falls within a circle that is constructed with the line segment that connects them as the diameter (Matula and Sokal, 1980). Thus, this approach is more restrictive than other SWMs. We determine the optimal SWM by testing these graph-based representations of spatial connectivity. 8
Running the models: Built on the above components, we next constructed three distinct regression models for each of our three cities. Each of these models used the MESF approach with different SWMs. In addition, we ran Spatial Lag and Spatial Error models for each city. These are two commonly used techniques for correcting for spatial autocorrelation and were included to evaluate the effectiveness of MESF techniques. Finally, we employed a linear model as our baseline for comparing the performance of spatial and non-spatial regression models. Through this combination of models, we were able to identify the most suitable spatial model for investigating the relationship between socio-demographics and e-scooter trips while controlling for underlying spatial structure and built environment factors.
Results
In this section we present the results of the various models, assess their accuracy, and report on variations in the significance values.
Model performance
Linear model, MESF, Spatial Lag, and Spatial Error models compared.
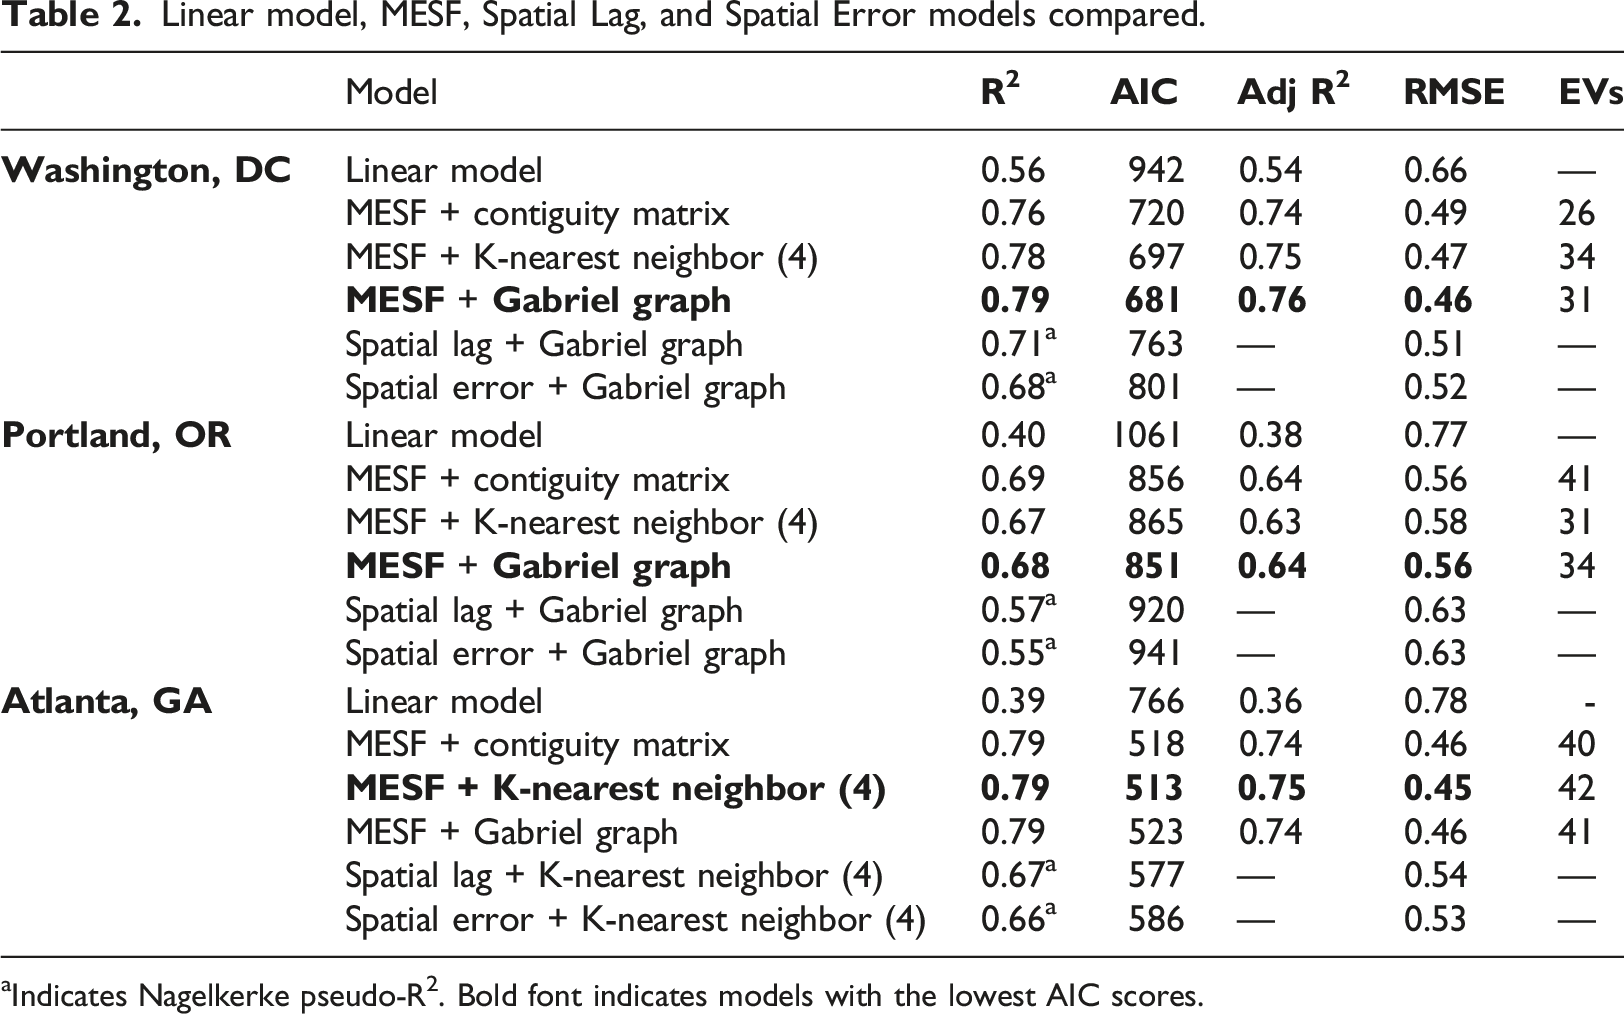
aIndicates Nagelkerke pseudo-R2. Bold font indicates models with the lowest AIC scores.
We conducted a Moran’s I test on model residuals and found no statistical significance across all networks, suggesting that the MESF technique can effectively correct for underlying spatial patterns in the data. Simulation studies demonstrate that AIC is effective in identifying the most appropriate SWM (Seya et al., 2013). In our study, MESF with a Gabriel graph matrix outperforms other SWMs in Washington DC and Portland, whereas MESF with a k-nearest neighbor graph performs best in Atlanta (Table 2). We use these matrices in our MESF models for further analysis of all three cities.
Spatial regression models compared: Various statistical techniques exist to address the issue of spatial autocorrelation. Among these, Geographically Weighted Regression (GWR), Spatial Lag, and Spatial Error are most widely used (Anselin, 2009). The GWR approach employs local regression models to account for spatial autocorrelation across the study area. However, issues with multicollinearity have been reported with coefficients of the local regression model, even when variables in the global model are not correlated (Wheeler and Tiefelsdorf, 2005). Since results from such models are not suitable for our type of analysis, we instead chose to focus on the Spatial Lag and Spatial Error models. Like MESF, these methods are extensions of standard linear regression models and utilize a SWM to consider spatial patterns. In the Spatial Lag model, a lagged term is introduced as an explanatory variable to capture spatial effects, which is a weighted average of the values of the dependent variable of neighboring observations. In contrast, the Spatial Error model accounts for spatial autocorrelation using a varying coefficient for the error term. In general, both Spatial Lag and Spatial Error models are recognized as effective techniques to address spatial autocorrelation (Anselin, 2009).
In order to evaluate the performance of the MESF technique to other spatial regression techniques, we ran a Spatial Lag and Spatial Error model using the same parameters as the MESF models. The results indicate that the MESF models outperform the Spatial Lag and Spatial Error models based on various model performance metrics, including AIC, RMSE, and R2. The AIC values of the MESF model are lower than those of the Spatial Lag or Spatial Error model across all three cities, indicating a better model fit. 9 Despite the addition of eigenvectors, the inclusion of these parameters leads to an improvement in model fit without a corresponding increase in model complexity. Our analysis also indicates that the MESF model produces the lowest RMSE scores across all three cities.
Findings: Coefficients for the MESF model and their significance, for Washington DC, Portland, and Atlanta are presented in Figure 1. Consistent with previous research, our findings highlight the importance of built environment factors on e-scooter trip usage. Specifically, we observe a strong positive association between walkability and trips across all three cities. We also observe a significant association between trips and the number of workers, as well as diversity in employment and household types. While these variables are significant across all three cities, we observe a positive association in Washington DC and Portland, and a negative association in Atlanta—the city with the least amount of data. Socio-demographic and built environment variable coefficient estimates for 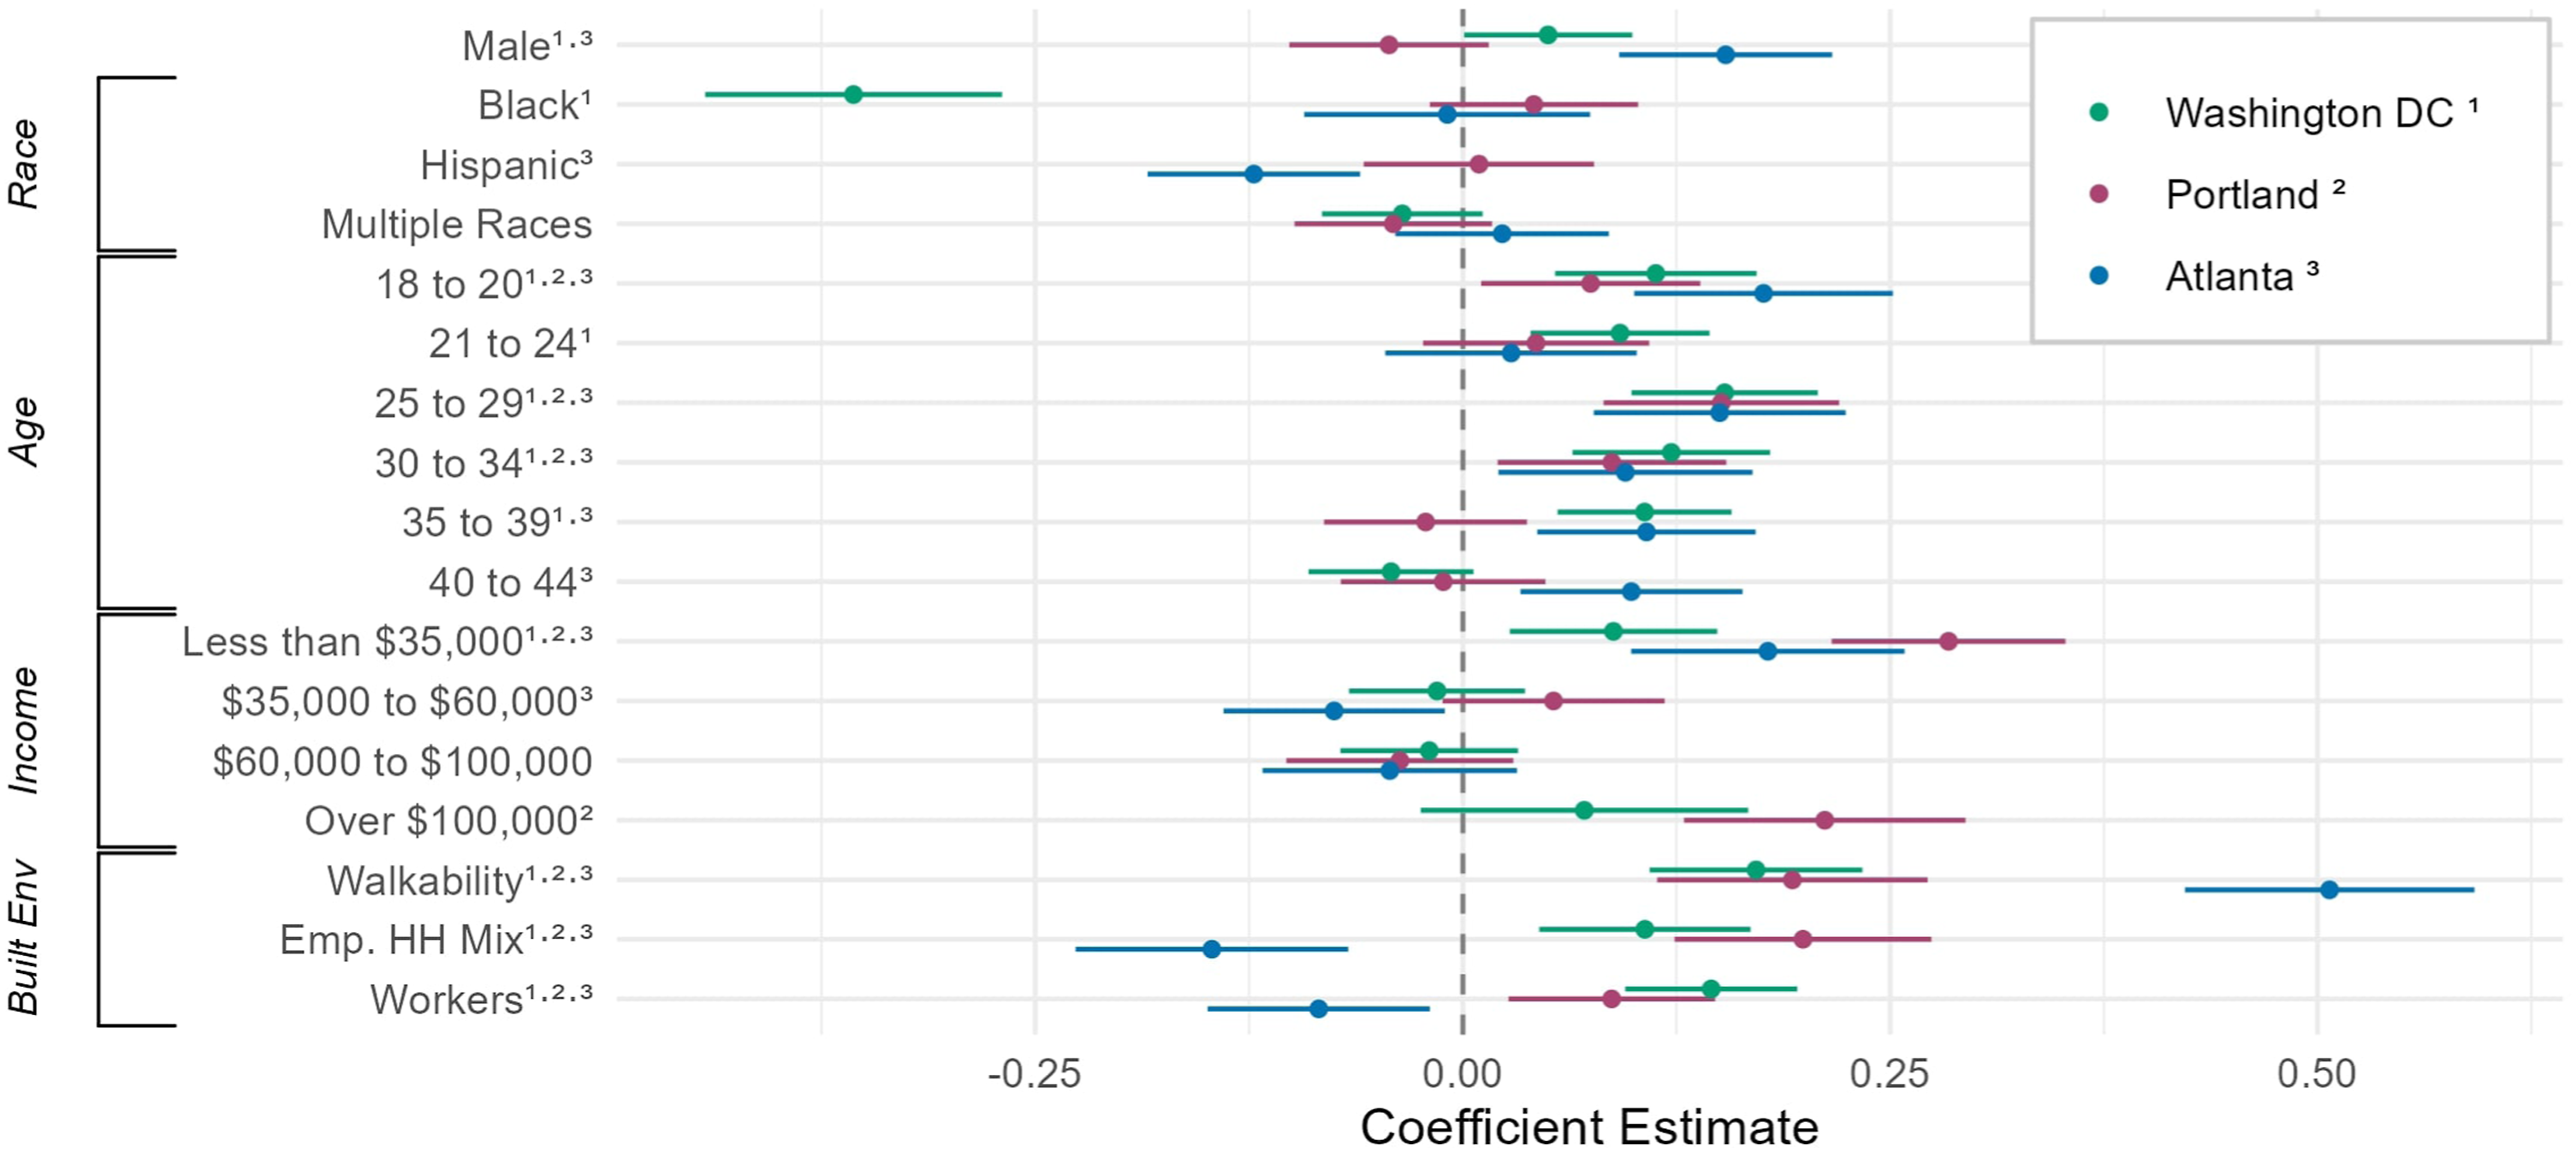
In Washington DC, e-scooter trips are positively associated with CBGs with a higher proportion of males, as well as population aged 18 to 39, with ages 25 to 29 exhibiting the strongest association. Additionally, trips are positively associated with an income of less than US$35,000 and negatively associated with a higher proportion of Black population. In Portland, CBGs with a higher proportion of the population aged 18 to 20 and 25 to 34 are positively associated with e-scooter trips, with ages 25 to 29 exhibiting the strongest association. Additionally, trips are positively associated with both lower and higher income groups, with a stronger association with income of less than US$35,000 compared to income over US$100,000. In Atlanta, higher proportions of males and population aged 18 to 20, 25 to 34, and 40 to 44 are positively associated, with ages 18 to 20 exhibiting the strongest association. We also observe a positive association between trips and income less than US$35,000 and a negative relationship with CBGs with income between US$35,000 and US$60,000.
One of the issues with using population characteristics from regions in which trips originate, is that it assumes that the characteristics of an e-scooter user reflects the population characteristics of the CBG in which they start the trip. In reality, we know this is not the case as many trips originate from commercial regions, etc. To address this issue, we next restricted our analysis to e-scooter trips taken between 6 a.m. and 9 a.m. on weekdays. The assumption here is that the origin of these trips are CBGs where users reside and are likely the start of commuting trips. We use the morning commute trip origins over destinations from evening commute trips as the evening rush hour offers greater flexibility for non-essential activities, such as grocery shopping, recreation, socializing, or picking up children from school (Ta et al., 2016). Coefficient estimates from the MESF model for trips between 6 a.m. and 9 a.m. are presented in Figure 2. In Washington DC, for commuting hours, the association between trips and age remains consistent, with a positive association between age groups ranging from 18 to 39 years and ages 25 to 29 exhibiting the strongest association. Income over US$100,000 is positively associated while higher proportions of males are not. In Portland, only age groups 18 to 20, and 21 to 29 remain positively associated while ages 40 to 44 are negatively associated. Income less than US$35,000 and over US$100,000 continue to show a positive association. Additionally, walkability is not a significant factor in understanding e-scooter commuting trips in Portland. The model for Atlanta reveals that a higher proportion of Black and Hispanic populations are negatively associated with e-scooter commuting trips. Males and age groups between 18 to 29 and 35 to 39 are positively associated, however, ages 25 to 29 exhibit the strongest association during morning commuting hours. We also observe that employment household mix and workers are not significant factors in understanding e-scooter morning commute trip patterns. Socio-demographic and built environment variable coefficient estimates for trips taken 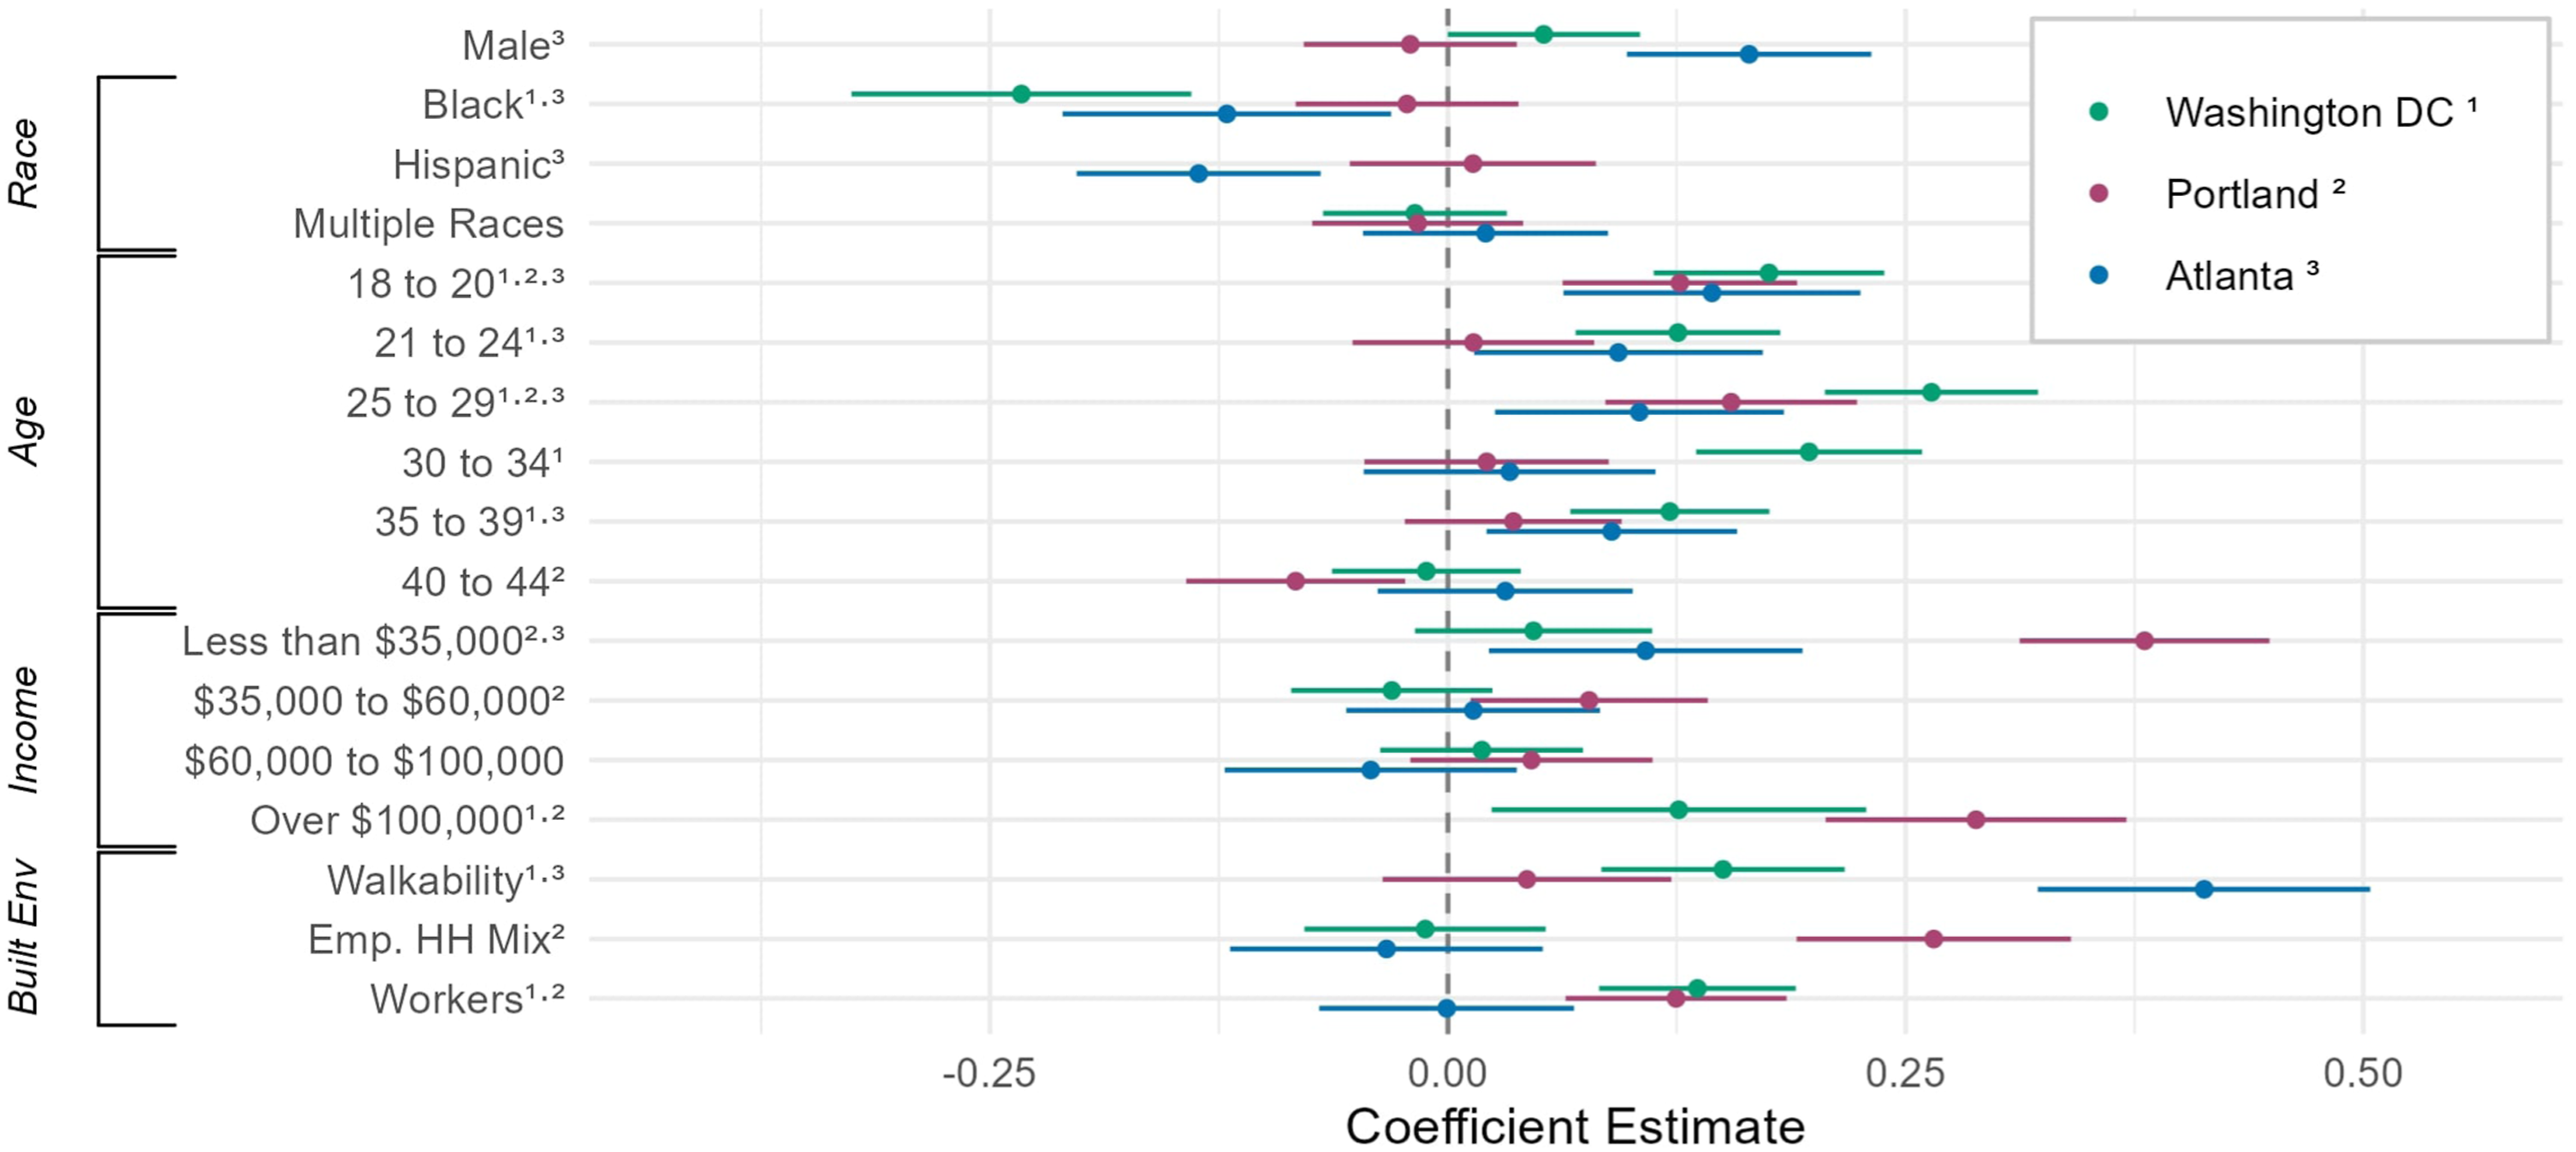
Discussion
In this study, we evaluated the variability in e-scooter usage and socio-demographic factors across three major U.S. cities, namely, Washington DC, Portland OR, and Atlanta GA, while controlling for built environment factors and spatial structure. We observe significant positive spatial autocorrelation in the response variable (trip origins), and the residuals of the linear model. In answering RQ2, we employed an MESF approach which successfully addressed the issue of spatial autocorrelation in the data. Our results show that this technique corrects for spatial autocorrelation in linear model residuals more effectively than other commonly used techniques such as Spatial Lag and Spatial Error (RQ3). We also explore three distinct spatial neighbor definitions in all cities to measure and correct for spatial patterns. These include a queen contiguity matrix, k-nearest neighbors (k = 4), and a Gabriel graph. We observe that the selection of a spatial weights matrix can have a considerable impact on model results.
In investigating the relationship between e-scooter trips and our independent variables (RQ1), we observed that walkability has a strong positive influence on trip activity across all cities. This finding is consistent with previous studies that show that e-scooters are often used as a faster alternative to walking for short-distance trips (Sanders et al., 2022). However, we also observe that walkability is not a significant predictor of e-scooter trips in Portland for commuting trips taken between 6 a.m. and 9 a.m. This suggests that users that utilize e-scooters for commuting purposes in Portland may reside outside the downtown core, in areas that are typically less walkable. This also indicates that e-scooters in Portland may be fulfilling the transportation needs of a more diverse population group as compared to Washington DC and Atlanta. Similarly, the model reveals distinct relationships between e-scooters and the number of workers and a mix of employment and household types across cities. In Washington DC and Portland, which have one central business district located in the downtown area, a higher number of workers and more diversity in employment and household types are associated with more e-scooter trips. In contrast, in Atlanta, where there are multiple central business districts located throughout the city, we observe a negative association between e-scooter trips and the number of workers and higher employment and household mix. Although this association is less pronounced in Atlanta during the 6 a.m. to 9 a.m. commuting hours. Our models indicate that e-scooters may not be a popular mode of transport across all central business districts in Atlanta. This is in contrast to Washington DC and Portland where most commuting trips appear to be more concentrated in the central business districts.
During morning commuting hours in Washington DC and Portland, higher proportions of the population with an income over US$100,000 show a positive association with e-scooter trips. This suggests that e-scooters may serve as a convenient alternative for working professionals with higher incomes, in commuting to work, particularly in the central business district where there is higher e-scooter usage. Additionally, we observe a positive association between e-scooter trips and income less than US$35,000 across all three cities, with the strongest association observed in Portland. This finding is in line with the results from Portland’s 2018 E-Scooter Pilot Program Survey, which reports that roughly 23% of e-scooter users surveyed had an income of less the US$30,000 (PBOT, 2018). In comparison, only 3% of respondents had an income less than US$30,000 in Atlanta, despite this income group showing the highest support for e-scooters (Atlanta Department of Transportation, 2019). This suggests that the City of Atlanta’s efforts to deploy e-scooters in equitable service areas may not be enough to promote accessibility to e-scooters in this income group. In contrast, we observe positive associations between e-scooter trips and both higher and lower income groups in Portland. Increased usage in Portland can be linked to low-income pricing plan options required from operators as part of the permit application to operate in the city (PBOT, 2018). Specifically, higher proportions of the population with an income over US$100,000 show a positive association, and income less than US$35,000 and between US$35,000 and US$60,000 show a positive association during morning commuting hours. This indicates that e-scooter services in Portland cater to the mobility needs of all income groups, and particularly provide transportation options for lower income groups during commuting hours.
E-scooter services in Washington DC cater to a broader range of age groups, with a positive association observed between e-scooter trips and all age groups between 18 and 39 years. Although Portland and Atlanta serve similar age groups between 18 to 29 and 35 to 39, the population aged 21 to 24 is not associated with e-scooter trips in either city. In Atlanta, however, ages 21 to 24 are positively associated during commuting hours. While further research is needed to determine why this group is less likely to generate e-scooter trips, it could be attributed to a lack of disposable income or a preference for other modes of transportation. In addition, ages 40 to 44 exhibit positive association in Atlanta, which is consistent with findings from user surveys that show that 58% of users between 36 and 45 years old had previously utilized e-scooter services (Atlanta Department of Transportation, 2019). Higher usage by this age group may be attributed to the availability of bike infrastructure in areas where e-scooters are available in Atlanta. However, in Portland, the same age group is negatively associated with e-scooter trips during commuting hours, suggesting a preference for other modes of transportation such as personal cars amongst this age group.
There are similarities in e-scooter usage patterns in Washington DC and Atlanta. We observe a weaker association between e-scooter trips and income less than US$35,000 in both cities, as well as a negative association with income between US$35,000 to US$60,000 in Atlanta. Additionally, we observe a negative association between e-scooter trips and higher proportions of Black populations during all hours of the day in Washington DC, and during commuting hours in Atlanta. Similarly, we find a negative association between e-scooter trips and higher proportions of Hispanics in Atlanta across all trips. These results suggest a need for promoting more equitable access to e-scooter services in these cities. Similar initiatives such as the mandatory low-income pricing options in Portland can be implemented to address this issue and increase accessibility to e-scooter services, while also prioritizing the deployment of e-scooters in these areas. Furthermore, a positive association is seen between e-scooter usage and a higher proportion of males in both cities. Previous research shows that males are more likely to use e-scooters as they are less concerned about safety issues associated with using these services (Nikiforiadis et al., 2021). However, the significant gender gap in e-scooter usage in Washington DC and Atlanta highlights the need for safer transportation infrastructure that encourages more women to utilize these services.
The success of e-scooters as a viable mode of transportation in the larger urban transportation ecosystem relies heavily on their ability to fulfill a diverse range of transportation needs. Despite their potential, there are several challenges users currently face in utilizing these services, including limited access to vehicles, lack of affordability, and inadequate infrastructure. E-scooter services have a similar core age group across Washington DC, Portland, and Atlanta, primarily consisting of younger to middle-aged users. However, there are differences in usage patterns, with both the highest and lowest income groups exhibiting higher activity as compared to middle-income groups across all cities. Furthermore, we find disparities in trip activity in predominantly Black and Hispanic neighborhoods of Washington DC and Atlanta, as well as higher usage by males. Addressing these issues will require city governments to implement more budget-friendly payment options, in addition to their current initiatives such as deploying vehicles in underserved areas. Investment in safer infrastructure such as dedicated bike lanes for e-scooters may help increase ridership by females, and thereby promote more equitable access to e-scooters.
There are some limitations to our study. We combine data from different time periods in Washington DC, specifically June–July 2019 and 2021. Despite data being sourced from the same months of the year, changes in e-scooter demand and usage patterns pre and post COVID-19 may impact model results. We also compute SWMs using Euclidean distances instead of navigable road networks—which would more accurately reflect geographic connectivity between CBGs. Since e-scooter data does not include user information, we are unable to determine if a user resides in the CBG where they begin a trip. To address this limitation, we assume that the user resides in the CBG where the trip originates. Although this allows us to analyze the relationship between e-scooter usage patterns and socio-demographics, we acknowledge that this may not accurately reflect the socio-demographics of e-scooter users. This issue was partially addressed by running a separate analysis on trips taken during morning commute times and comparing the results to our all trips models.
Conclusion
Our study provides insight into current e-scooter usage patterns in three major U.S. cities, revealing who uses these services and who remains underserved. We demonstrate that the Moran’s Eigenvector Spatial Filtering approach is an effective method for correcting for spatial autocorrelation in linear model residuals, leading to a better model fit compared to other spatial correction techniques commonly used. We are able to draw meaningful conclusions about the relationship between e-scooter usage and socio-demographic factors including age, income, gender, and race by examining different spatial weights matrices of neighbors for each city. We highlight similarities and differences in these socio-demographic factors across cities and identify gaps in accessibility to e-scooter services amongst socio-demographic groups. These findings may aid in informing how cities can adopt effective strategies and best practices to make evidence-based planning decisions regarding e-scooter operations. Cities can promote ridership among underserved income and race groups by improving access to e-scooters, implementing more budget-friendly options for access, and developing safer infrastructure. It is critical for e-scooter operators and city governments to work together to make e-scooter a more reliable form of urban transportation for all socio-demographic groups. Increased usage of e-scooters in urban areas can expand transportation access while offering a more sustainable alternative for urban mobility.
Supplemental Material
Supplemental Material - Regional comparison of socio-demographic variation in urban E-scooter usage
Supplemental Material for Regional comparison of socio-demographic variation in urban E-scooter usage by Priyanka Verma and Grant McKenzie in Environment and Planning B: Urban Analytics and City Science
Footnotes
Declaration of conflicting interests
The author(s) declared no potential conflicts of interest with respect to the research, authorship, and/or publication of this article.
Funding
The author(s) received no financial support for the research, authorship, and/or publication of this article.
Data Availability Statement
The data that support the findings of this study are available on request from the corresponding author.
Supplemental Material
Supplemental material for this article is available online.
Notes
References
Supplementary Material
Please find the following supplemental material available below.
For Open Access articles published under a Creative Commons License, all supplemental material carries the same license as the article it is associated with.
For non-Open Access articles published, all supplemental material carries a non-exclusive license, and permission requests for re-use of supplemental material or any part of supplemental material shall be sent directly to the copyright owner as specified in the copyright notice associated with the article.