
Abstract
Self-organisation in territories leads to the emergence of patterns in urban systems that shape the interactions and dependencies between cities, resulting in a hierarchical organisation. Governance follows a hierarchical structure as well, breaking the territory into smaller units for its management. The possible mismatch between these two organisations may lead to a range of problems, ranging from inefficiencies to insufficient and uneven distribution of resources. This paper seeks to develop a methodology to explore and quantify the correspondence between the hierarchical organisation given by the structure of governance and that given by the structure of the urban systems being governed, where Chile is used as a case study. The urban hierarchical structure is defined according to the connectivity of the system given by the road network. This is extracted through a clustering algorithm defined as a percolation process on the Chilean street network, giving rise to urban clusters at different scales. These are then compared to the spatial scales of the politico-administrative system. This is achieved by using measures of pair-wise distance similarity on the dendrograms, such as the cophenetic distance, by looking at the different clustering membership using Jaccard similarity and by analysing the topological diversity defined as the structural entropy. The results show that the urban sub-national structures present high heterogeneity, while the administrative system is highly homogeneous, replicating the same structure of organisation across the national territory. Such contrasting organisational structures present administrative challenges that can give rise to poor decision-making processes and mismanagement, in addition to impairing the efficient functioning of the systems themselves. Our results can help address these challenges, informing how to rebalance such mismatches through planning and political strategies that consider the complex interdependencies of territories across scales.
Introduction
Politics are inherently geographical and scalar (Agnew, 1997). Space is an important element of governance because governmental activities are territorially demarcated and have well-defined scales of operation (Hudson, 2007). These scales are spatially defined, so the territory over which governance is exercised is delimited by clear geographical boundaries such as communes, provinces and regions. In some cases, these boundaries are based on traditional and historical identities, while in others, they are imposed for utilitarian purposes and have little relation to existing territorial dynamics (Terlouw, 2012). The spatial extension of different levels of governance is often defined by the central state to accommodate administrative functions. State institutions play a crucial role in creating, modifying or removing boundaries and defining scalar organisations. In centralised governments, decision-making processes tend to occur distant to regional and local spaces of governance, leading to the implementation of standardised policies that do not account for the local particularities. In contrast, polycentric structures of governance operate at multiple scales, allowing for policies that better match territorial diversity (Cumming et al., 2013; Lebel et al., 2006). Developing effective regional policy requires relevant regional scalar data and a thorough understanding of regional structures. This information is key for decision-makers to identify the unique needs and challenges of different regions, allowing them to tailor their policies and plans accordingly (Rozenblat, 2009).
Scales of management and the scales of processes
The scalar thinking permeates different layers of organisation: the political, the geographical, the economical, the sociological and the infrastructural. The ubiquitous use of the concept has raised concern among scholars who stress the tension between different notions and conflated conceptions of scale (Brenner, 2001; Jonas, 1994; MacKinnon, 2011; Marston, 2000; Marston et al., 2016; Moore, 2008; Smith, 1992). Jonas (1994) and Moore (2008) have underlined the distinction between ‘operational’ and ‘discursive’ approaches to the scalar thinking. The operational scale is considered the real scale of processes where the sociospatial interactions occur. Discursive scales on the other hand, are a frame or set of abstractions used to understand and study the real processes (Jonas, 1994; Lukas and Flitner, 2019; Moore, 2008). In this context, discursive scales are the outcome of imposed boundaries (Lukas and Flitner, 2019), which are used to identify phenomena within a system of interest by setting ‘research scales’, or to implement policies relevant to the phenomena through ‘management scales’. Discursive scales have long been a subject of controversy, as they can be influenced by embedded assumptions, political implications and practicality considerations (Rangan and Kull, 2009). Some scalar narratives have been widely accepted without adequate scientific support, leading to the production of knowledge that is inconsistent with real processes (Lukas and Flitner, 2019). Geographical data, for example, is often provided aggregated into spatial jurisdictions and not necessarily on the basis of ‘scientifically derived’ scales (Jonas, 1994). Administrative boundaries have been used for a long time to address urban issues either by governance, research, planning or design approaches. These pre-given limits, provide all-purpose and durable in time urban definitions that can be easily implemented. Despite how convenient the straightforward use of these definitions may be, they are not always capable of reflecting the extent of the urban processes in question. Along with this, the speed of urban growth, the fuzzy urban-rural transition and the multiple extent of economic, ecological, social and political processes and their different scales, are challenging this fixed and ‘one-size-fits-all’ approach (Rozenfeld et al., 2008). According to Moore (2008), the attempt to fit complex processes into reduced pre-given scales ends up overlooking the diversity of processes, ignoring the granularity and variability of sociospatial systems (Moore, 2008).
Scalar mismatch
According to Cumming (2006), scalar mismatches take place when the scale of management and the scale of processes are aligned in such a way that inefficiencies occur either affecting the functioning of the systems being managed or the functioning of the institutions responsible for their management (Cumming et al., 2013). Governance in these cases is less sensitive to the variety of local structures, lacking the appropriate information and oversimplifying the knowledge about processes. Deficient monitoring frameworks, together with the lack of clear responsibilities necessary to achieve the required scale of management, results in the formulation of misleading policies (Cumming et al., 2006). Under these circumstances, self-maintenance and self-organisation are undermined, affecting not only daily operations, but leading to a potential decrease of the urban resilience capacity (Cumming et al., 2006; Folke et al., 2005). Redressing scalar mismatches is therefore a crucial requirement to redefine the relationship between governance, planning and sociospatial processes. Alternative geographies of governance more responsive to scalar processes as Bulkeley (2005) suggests, need to be articulated. Managing scalar mismatches requires that scale is not taken for granted. Therefore, the organisational structure of systems needs to be identified beyond pre-given administrative definitions (Bulkeley, 2005). In order ‘to govern, it is necessary to render visible the space over which government is to be exercised’ (Rose, 1999: p. 36). The diversity of the territory needs to be decoded, so that political and planning strategies are not blind to the scalar particularities of the urban organisation. This challenges the understanding of sub-national scales such as communes, provinces or regions, as self-enclosed homogeneous entities and coherent bounded territories (Brenner, 2001; Hudson, 2007). Rather, it puts forward its conceptualisation as relational entities made up of intricate systems of cities.
Decoding and comparing hierarchical structures
Urban systems are inherently relational (Pumain, 2006b); therefore, the identification of different intensities of connectivity patterns is a key criterion for their definition (Bretagnolle et al., 2006; Pumain, 2006a). As objects of study, systems of cities could be defined by the nature of relationships holding them together (Batty, 2018; Rozenblat, 2022). Sub-national scales are then, the result of constituent elements and the way in which they are progressively connected to all others (Batty and Longley, 1994). By ordering connections at successive scales according to their orders of magnitude, a hierarchical structure can be discerned. As Simon (1977) observed ‘everything is connected, but somethings are more connected than others’. And it is from this process of heterogeneous interactions that the hierarchical structure of the urban territory emerges from the most local scale to the largest.
Hierarchical structures can be represented through dendrograms, which are branching graphical representations (Fowlkes and Mallows, 1983). To compare different dendrograms, certain structural similarities and differences can be visualised and quantified. The first methods were developed in biology for phenetic studies to evaluate results obtained from numerical taxonomic analysis. Distances on the basis of similarity between dendrogram elements, are widely used methods ever since Sokal and Rohlf (1962) introduced the use of cophenetic distance. Although its use is still more prominent in disciplines such as biology and ecology, it has been extended to other fields to assess the efficiency of different clustering methods and the consistency between outputs (Fischer, 1980; Rohlf, 1982; Saracli et al., 2013).
While theoretical discussions in various fields, such as ecology, politics and urban planning, have contributed to the understanding of scalar mismatches, a significant gap still exists in effectively quantifying them. To the best of our knowledge, there are no analytical papers in the current literature that specifically address this topic in such depth, particularly in the context of multi-scalar analysis. Our primary focus is to advance the study of urban mismatches from an analytical perspective by employing a multi-scalar and quantitative approach. In this paper, we compare hierarchical structures or dendrograms to explore scalar mismatches. Specifically, we examine the dendrogram of management scales resulting from the hierarchical structure of the administrative system, and the dendrogram of operational scales, resulting from the percolation analysis given the connectivity of the urban layout. Using Chile as a case study, we compare both dendrograms via three methods. First, we conduct a pair-wise comparison of the hierarchical distance of each city to all other cities in the system using the cophenetic distance. This provides information on the variation in relationship intensity between systems of cities in both structures. Then we compare the clusters in terms of their membership using Jaccard similarity to quantify how closely the city systems are grouped together in accordance with administrative boundary definitions. Finally, we examine the topological structure of the dendrograms by measuring the diversity of the furcations using structural entropy. The results of these analyses reveal the centralised organisation of the national system, the heterogeneous intra-regional structures and the relationships between systems of cities that go beyond administrative definitions.
Case study
Chilean decentralisation, a challenge for regional governance
The current politico-administrative division of Chile dates back to 1974, when it was established during the early years of the military dictatorship. The regionalisation process carried out at that time was seen as a political control strategy managed by the central government to strengthen national security and exercise administration (Arenas et al., 2007). The division of the territory into thirteen ‘homogeneous and equivalent’ regions (CONARA, 1974), was more about distributing power across the country than about empowering self-governing regions (OECD, 2017). As a result, the spatial structure of the governance system in Chile was primarily based on utilitarian purposes, ignoring territorial identities and the intrinsic local organisation. The regional administrative structure is homogeneously repeated throughout the country and does not necessarily align with the scalar logic of urban processes. Each region is organised mono-centrally around a capital city, which serves as the hub of development and main source of services. This political organisation has reinforced intra-urban regional disparities. In response to increasing demands for local identity and representation, three regions were re-delimited to better match the logic of local scales (Tarapaca and Los Lagos in 2007, and Biobio in 2017), while the rest of the territorial jurisdictions remained largely unchanged. The current Chilean politico-administrative system is organised into a simple 4-tier structure consisting of communes (346), provinces (56), regions (16) and the national level. The structure is equivalent at any jurisdictional level, with non-intersecting memberships, and does not consider intermediate scales or temporary jurisdictions for specific policy purposes.
Chile’s regional level is the core of decentralisation reforms, and is considered a crucial link between the national and local levels. Despite various attempts by democratic governments to promote regional reforms, Chile remains one of the most centralised countries in the OECD (OECD, 2017). The urgent need for a governance perspective that achieves the definitive decentralisation of the country has positioned regional governance as a top priority. To this end, the paper will focus more closely on the multi-scalar organisation of the regions.
Methods
The methodology of the paper is divided into two main sections. The first section outlines how to extract the hierarchical organisation of the system through percolation analysis, and then how to represent it in terms of a dendrogram. The second section describes the various methods used to compare the different dendrograms and evaluate the potential mismatches between them. These are the cophenetic distance, the Jaccard similarity and the structural entropy.
Hierarchical organisation
We use percolation analysis to retrieve the scalar structure of Chile based on the connectivity of the street network. Socio-historical processes have left traces in the way local entities organise. As explained in Arcaute et al. (2016), these footprints are contained in the street network, representing the main proxy for communication and exchange between settlements. The street network plays a crucial role in the organisation of urban areas, serving as the setting for urban life and the location for many social and economic interactions (Marshall et al., 2018). Streets form the underlying network for the functioning of urban systems, enabling the reachability of services and facilities and the flow of people and goods (Strano et al., 2012). The efficiency of these interactions is closely tied to the topological properties of the street pattern given by its connectivity (Cavallaro et al., 2014). Junctions, or intersections, play a key role in ensuring connectivity and providing access to a range of alternative routes. The more junctions there are, the greater the permeability of the network, the denser the urban activities and the greater potential there is for urban interaction.
Percolation analysis
Percolation theory can be applied to identify substructures in a system describing phase transitions of connected clusters that characterise the potential flow of information within the structure (Gallos et al., 2011). It provides information on the global scale structure of connectivity of a system from the bottom-up. The process starts with disconnected elements that merge together based on a distance threshold parameter until the largest cluster covers the entire system. Percolation-like processes have been applied to different fields of research like functional brain networks (Gallos et al., 2011), the spread of diseases (Gallos et al., 2012; Newman et al., 2002) and indeed, they have been used to study the structure of urban systems (Behnisch et al., 2019; Fluschnik et al., 2016; Piovani et al., 2017; Rozenfeld et al., 2008, 2011). In Arcaute et al. (2016), percolation was used to uncover the urban hierarchical organisation of Britain through multiple percolation transitions based on the distance between street intersections.
This research employs percolation processes as a hierarchical clustering algorithm to unveil its hierarchical structure and identify the pertinent scales of analysis. This decision is based on the method’s demonstrated effectiveness in various fields, revealing scalar organisational patterns in networks while also providing computational efficiency. We follow the procedure used in Arcaute et al. (2016); Piovani et al. (2017). The street network is obtained from OpenStreetMap (OSM) as the primary source of our spatial data. The OSM data contains detailed information on the street network, including attributes such as speed limits. The network is represented by nodes (intersections) and links (street segments between intersections) that are embedded in space and weighted by the time required to travel by car along each link. Using time as the weighting attribute provides a more comprehensive representation of the movement between spatial nodes. Its use also allow us to include ferries’ routes (considering associated travel and wait times), which are the only means of transportation in the southern archipelagos. In this way, we are able to capture the main structure of connectivity throughout the territory (see Supplemental Material). The process consists in extracting the sub-graphs of connected links whose weight
Dendrogram visualisation
The hierarchical structure of the urban system is reconstructed by ordering the different clusters obtained through the above-mentioned thresholding procedure. This is done using a dendrogram that is organised vertically into different scales, each representing a selected threshold with the highest at the top and the lowest at the bottom. This is possible because clusters generated using a lower threshold
Hierarchical comparison
To investigate the potential for scalar mismatch, we use three methods (Figure 1) to compare the dendrograms (represented by Methods for hierarchical comparison in dendrogram toy models. (a) The hierarchical distance of clusters in dendrograms by computing the cophenetic distance 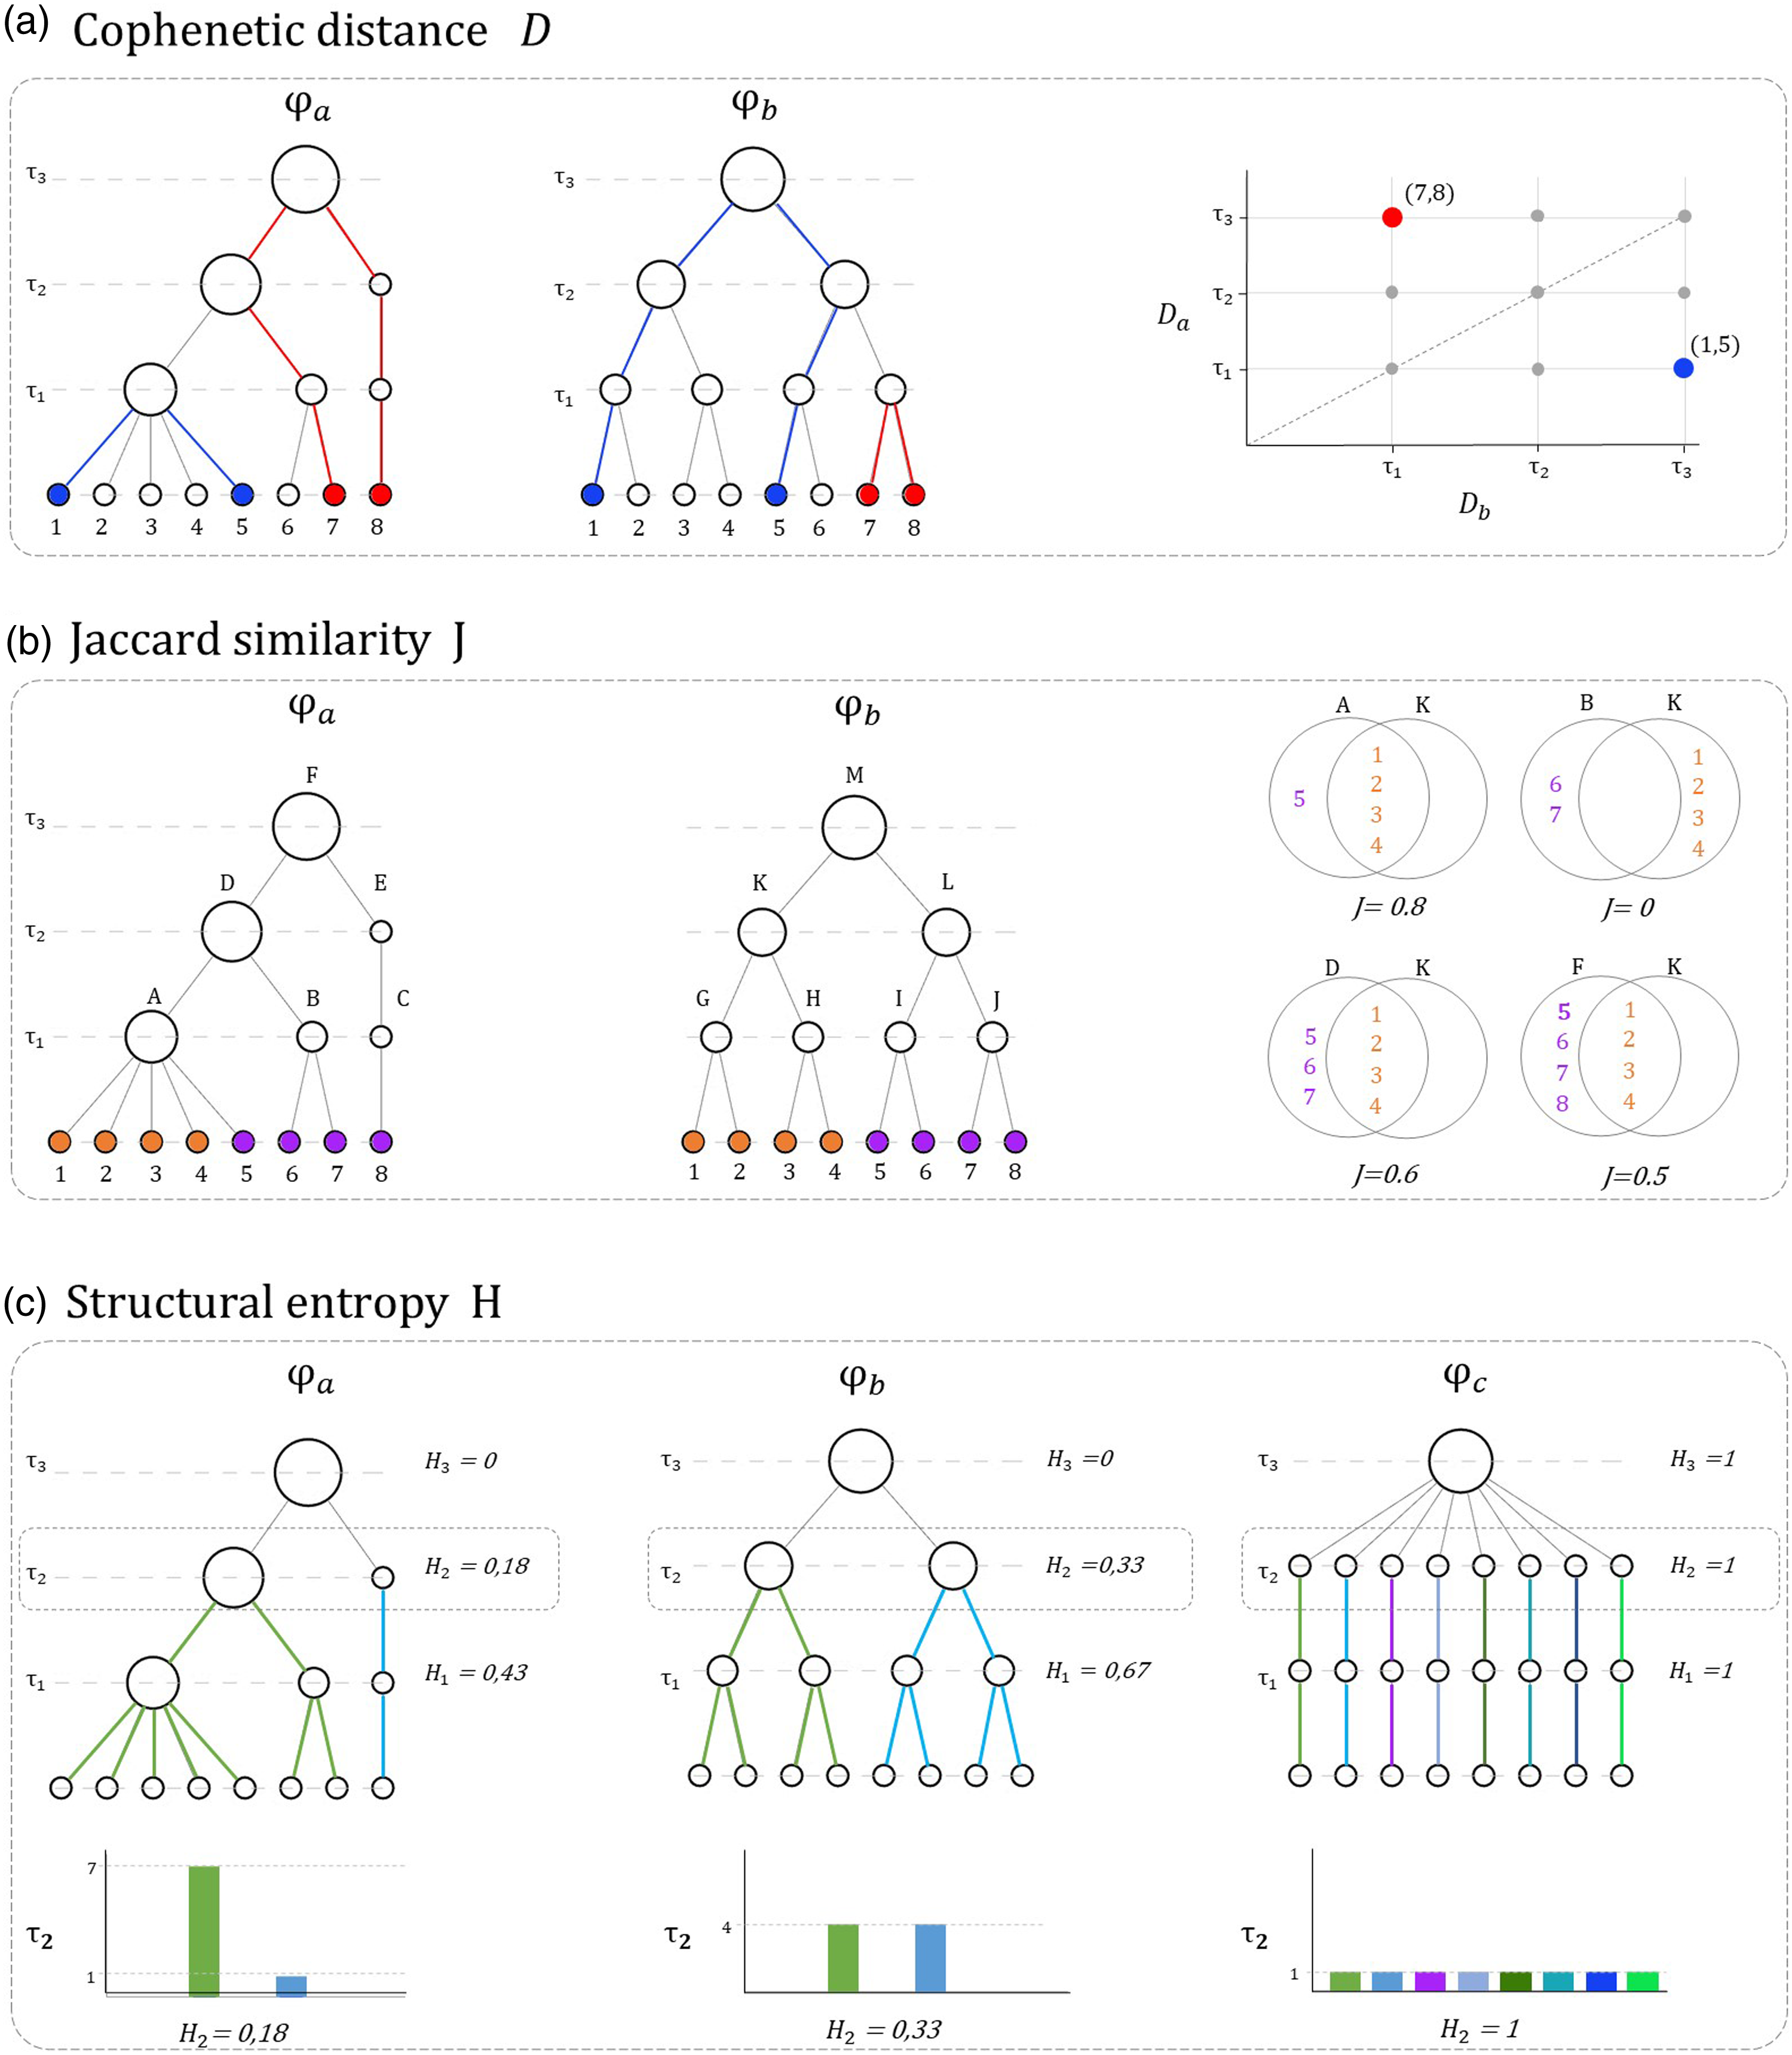
Cophenetic distance
The Cophenetic distance (
Jaccard similarity
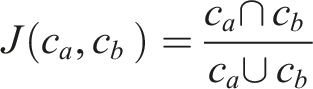
To compare the dendrograms, we use the Jaccard similarity index (
Structural entropy
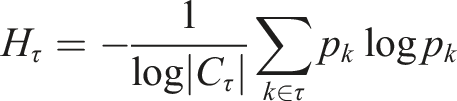
This measure allows us to explore the agglomeration preferences between urban centres and to identify monocentric, polycentric or disperse clustering processes across scales. To compute it, we look at the topology of the dendrogram, which is defined as the branching pattern relationship among its elements (Phipps, 1971). We are interested in exploring the organisational heterogeneity of the topology given by the diversity of the furcation patterns in the tree. We achieve this, by computing at each threshold
Results and discussion
In this section, we apply the methodology to Chile. This is an interesting case study, because it lies along an elongated territory, favouring longitudinal relations between cities, but possessing a contradicting centralised structure in terms of its administrative governance. The analysis highlights the mismatches between the imposed administrative structure and the natural organisation of the country emerging from the proxies for interactions.
Scales of organisation
Percolation outputs allow us to visualise the formation of different systems of cities and regions along the thresholding process (Figure 2(b)). Going from lower to higher time thresholds, that is from clusters with stronger to weaker ties, we observe that one of the first transitions generated at Chilean administrative and urban connectivity organisation. (a) Limits of the administrative jurisdictions, where the colours show the different regions, and the lines display the province limits. (b) Sample of clusters at relevant percolation thresholds, from the most local scale, corresponding to cities and towns, to more regional scales, until reaching the entire national cluster. To get a clearer sense of what these time thresholds represent in terms of distance, at 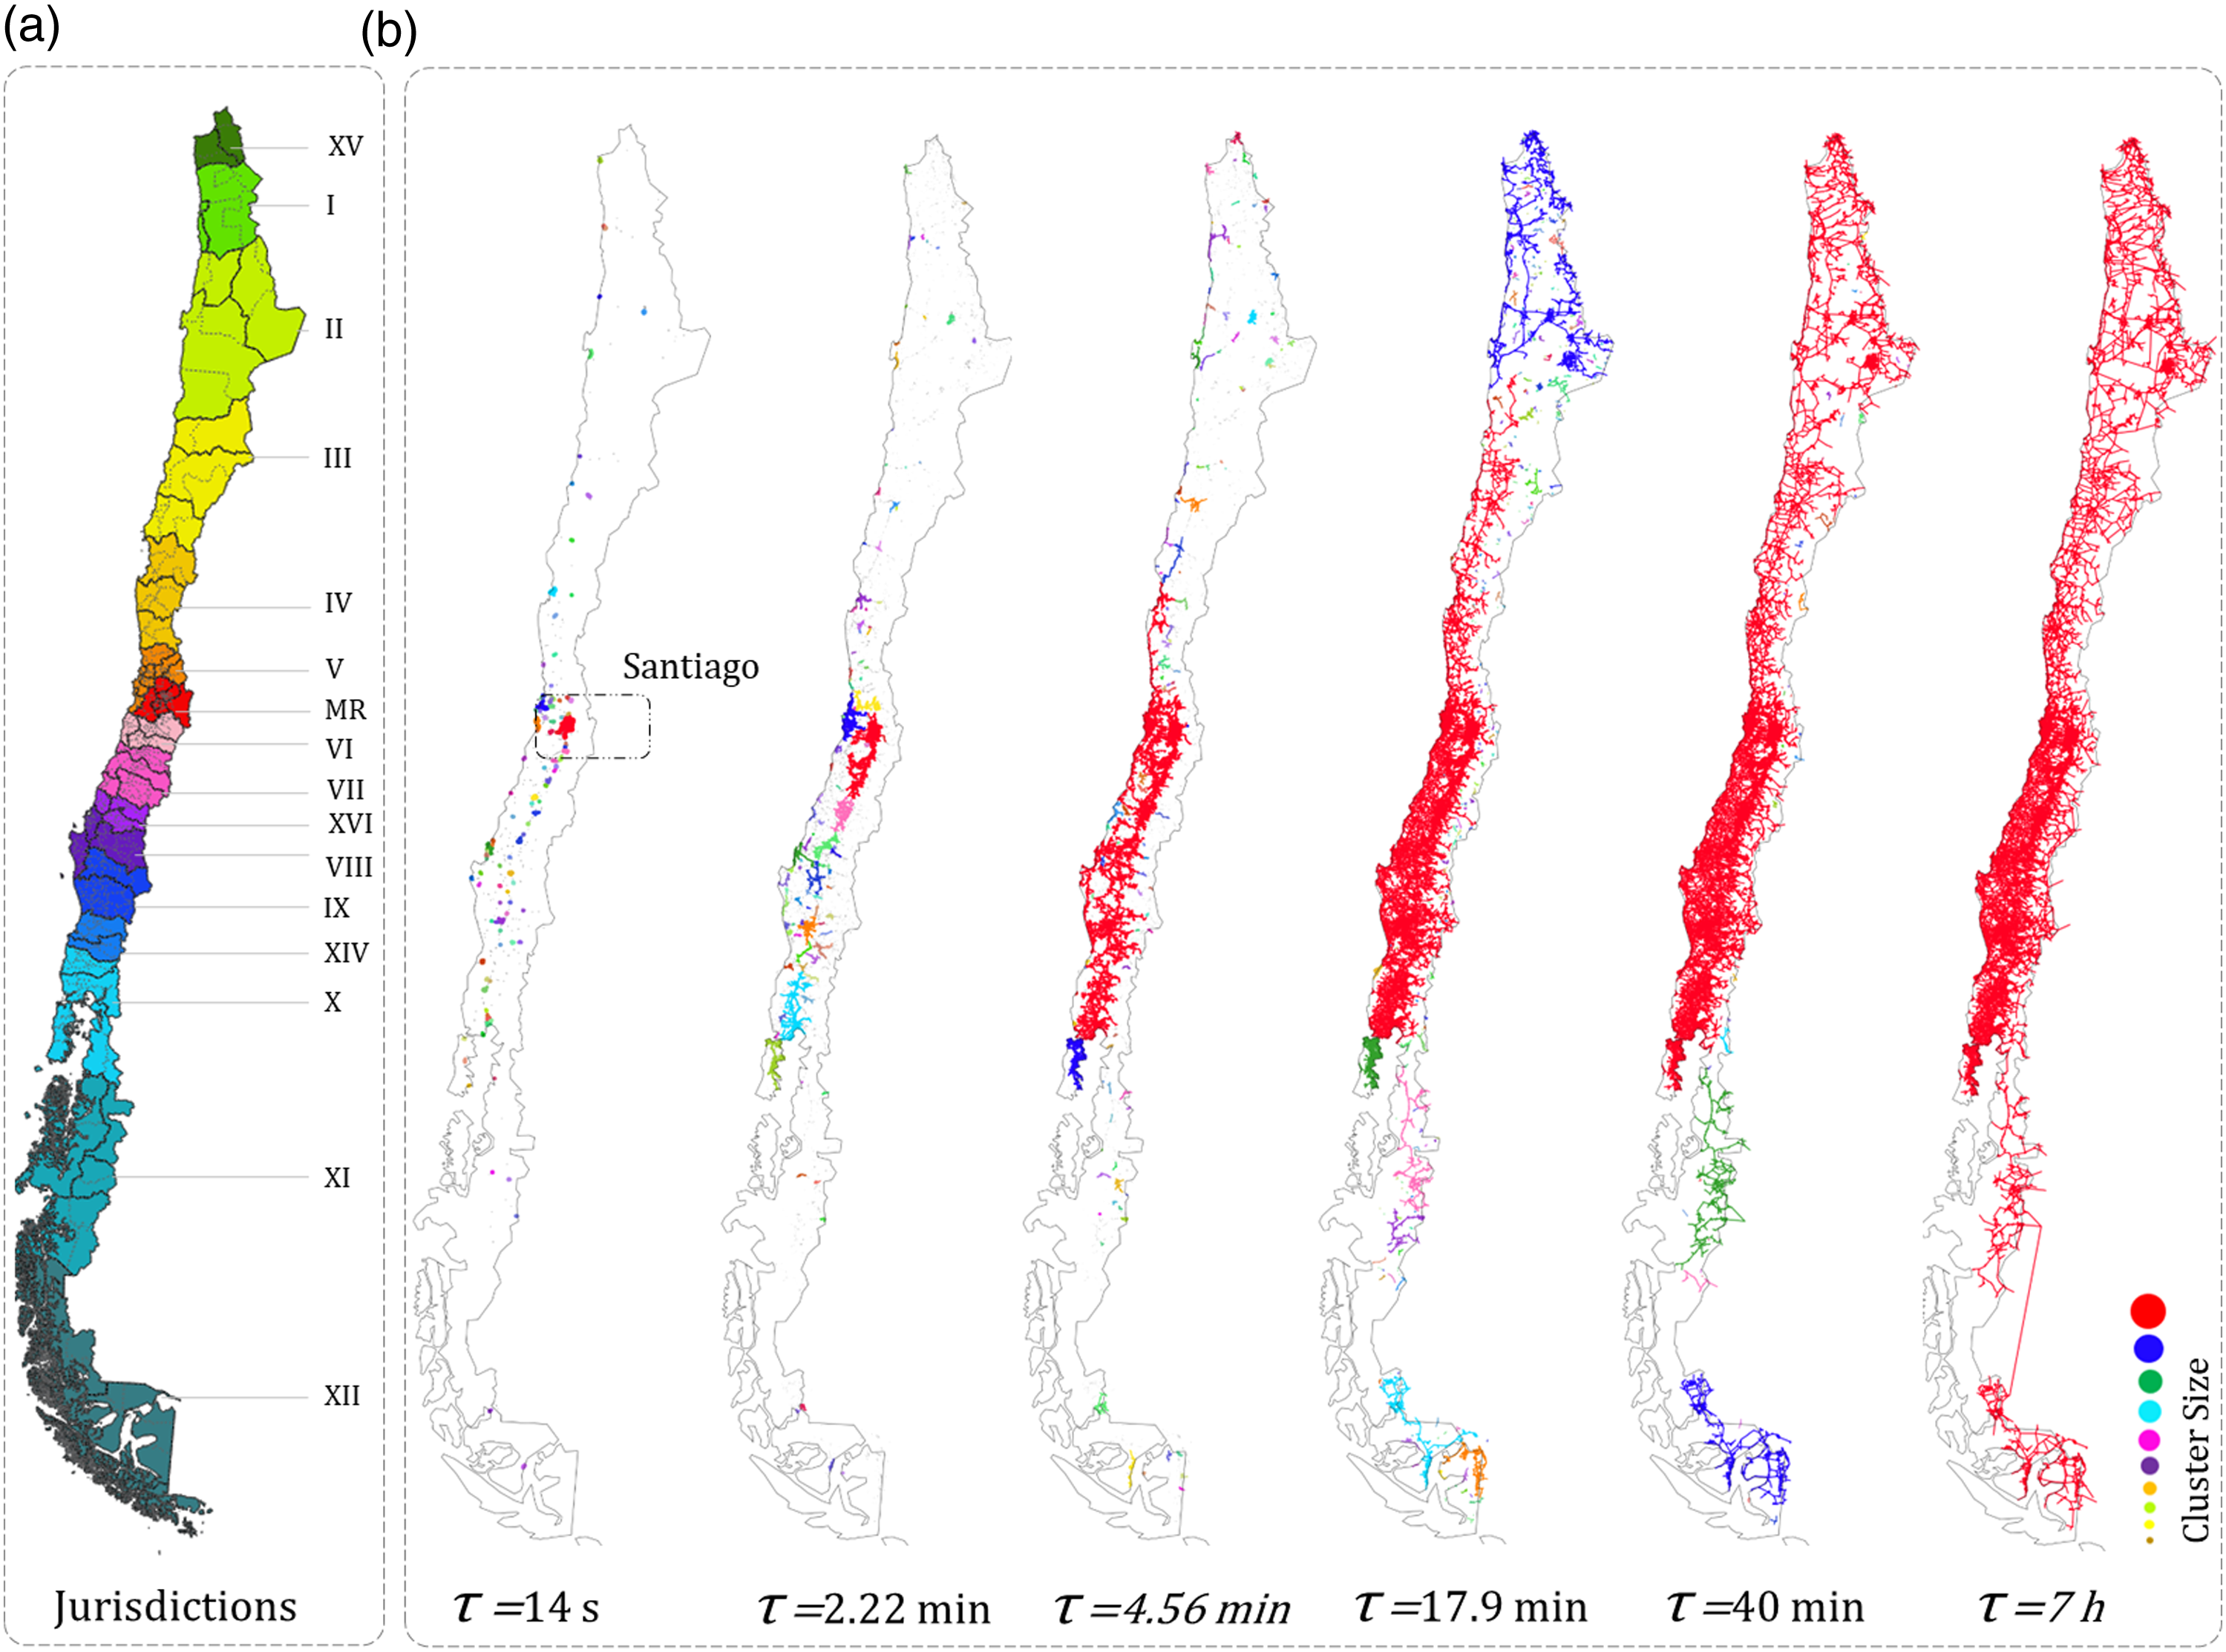
The process of percolation unveils an accentuated centralised tendency of cluster formation, with the pervasiveness of the capital city in the evolution of the clusters accompanied by a less prominent conformation of other sub-national structures. As evidenced by the different phase transitions, the system grows radially, from the centre where the capital is located, to the peripheral regions of the country. The predominance of the capital city in the spatial organisation of the national system is in good agreement with its administrative hegemony. Santiago not only accommodates almost half of the population, concentrates big part of the labour productivity and is responsible for 69% of the GDP growth of the country (OECD, 2017), but it also concentrates most of the administrative power.
Regional formation
Regions are made up of elements that are connected with varying levels of intensity and are distributed unevenly in space. While some regions are spatially cohesive as expected given their administrative boundaries, others are composed of isolated and more dispersed city systems. In this section, we compute the hierarchical distance between cities, to illustrate the diversity of intra-regional relationships.
First, we can identify different patterns of formation of city systems by looking at the dendrograms in Figure 3. The urban connectivity patterns in Dendrograms representing the administrative and the urban hierarchical organisation of Chile. (a) 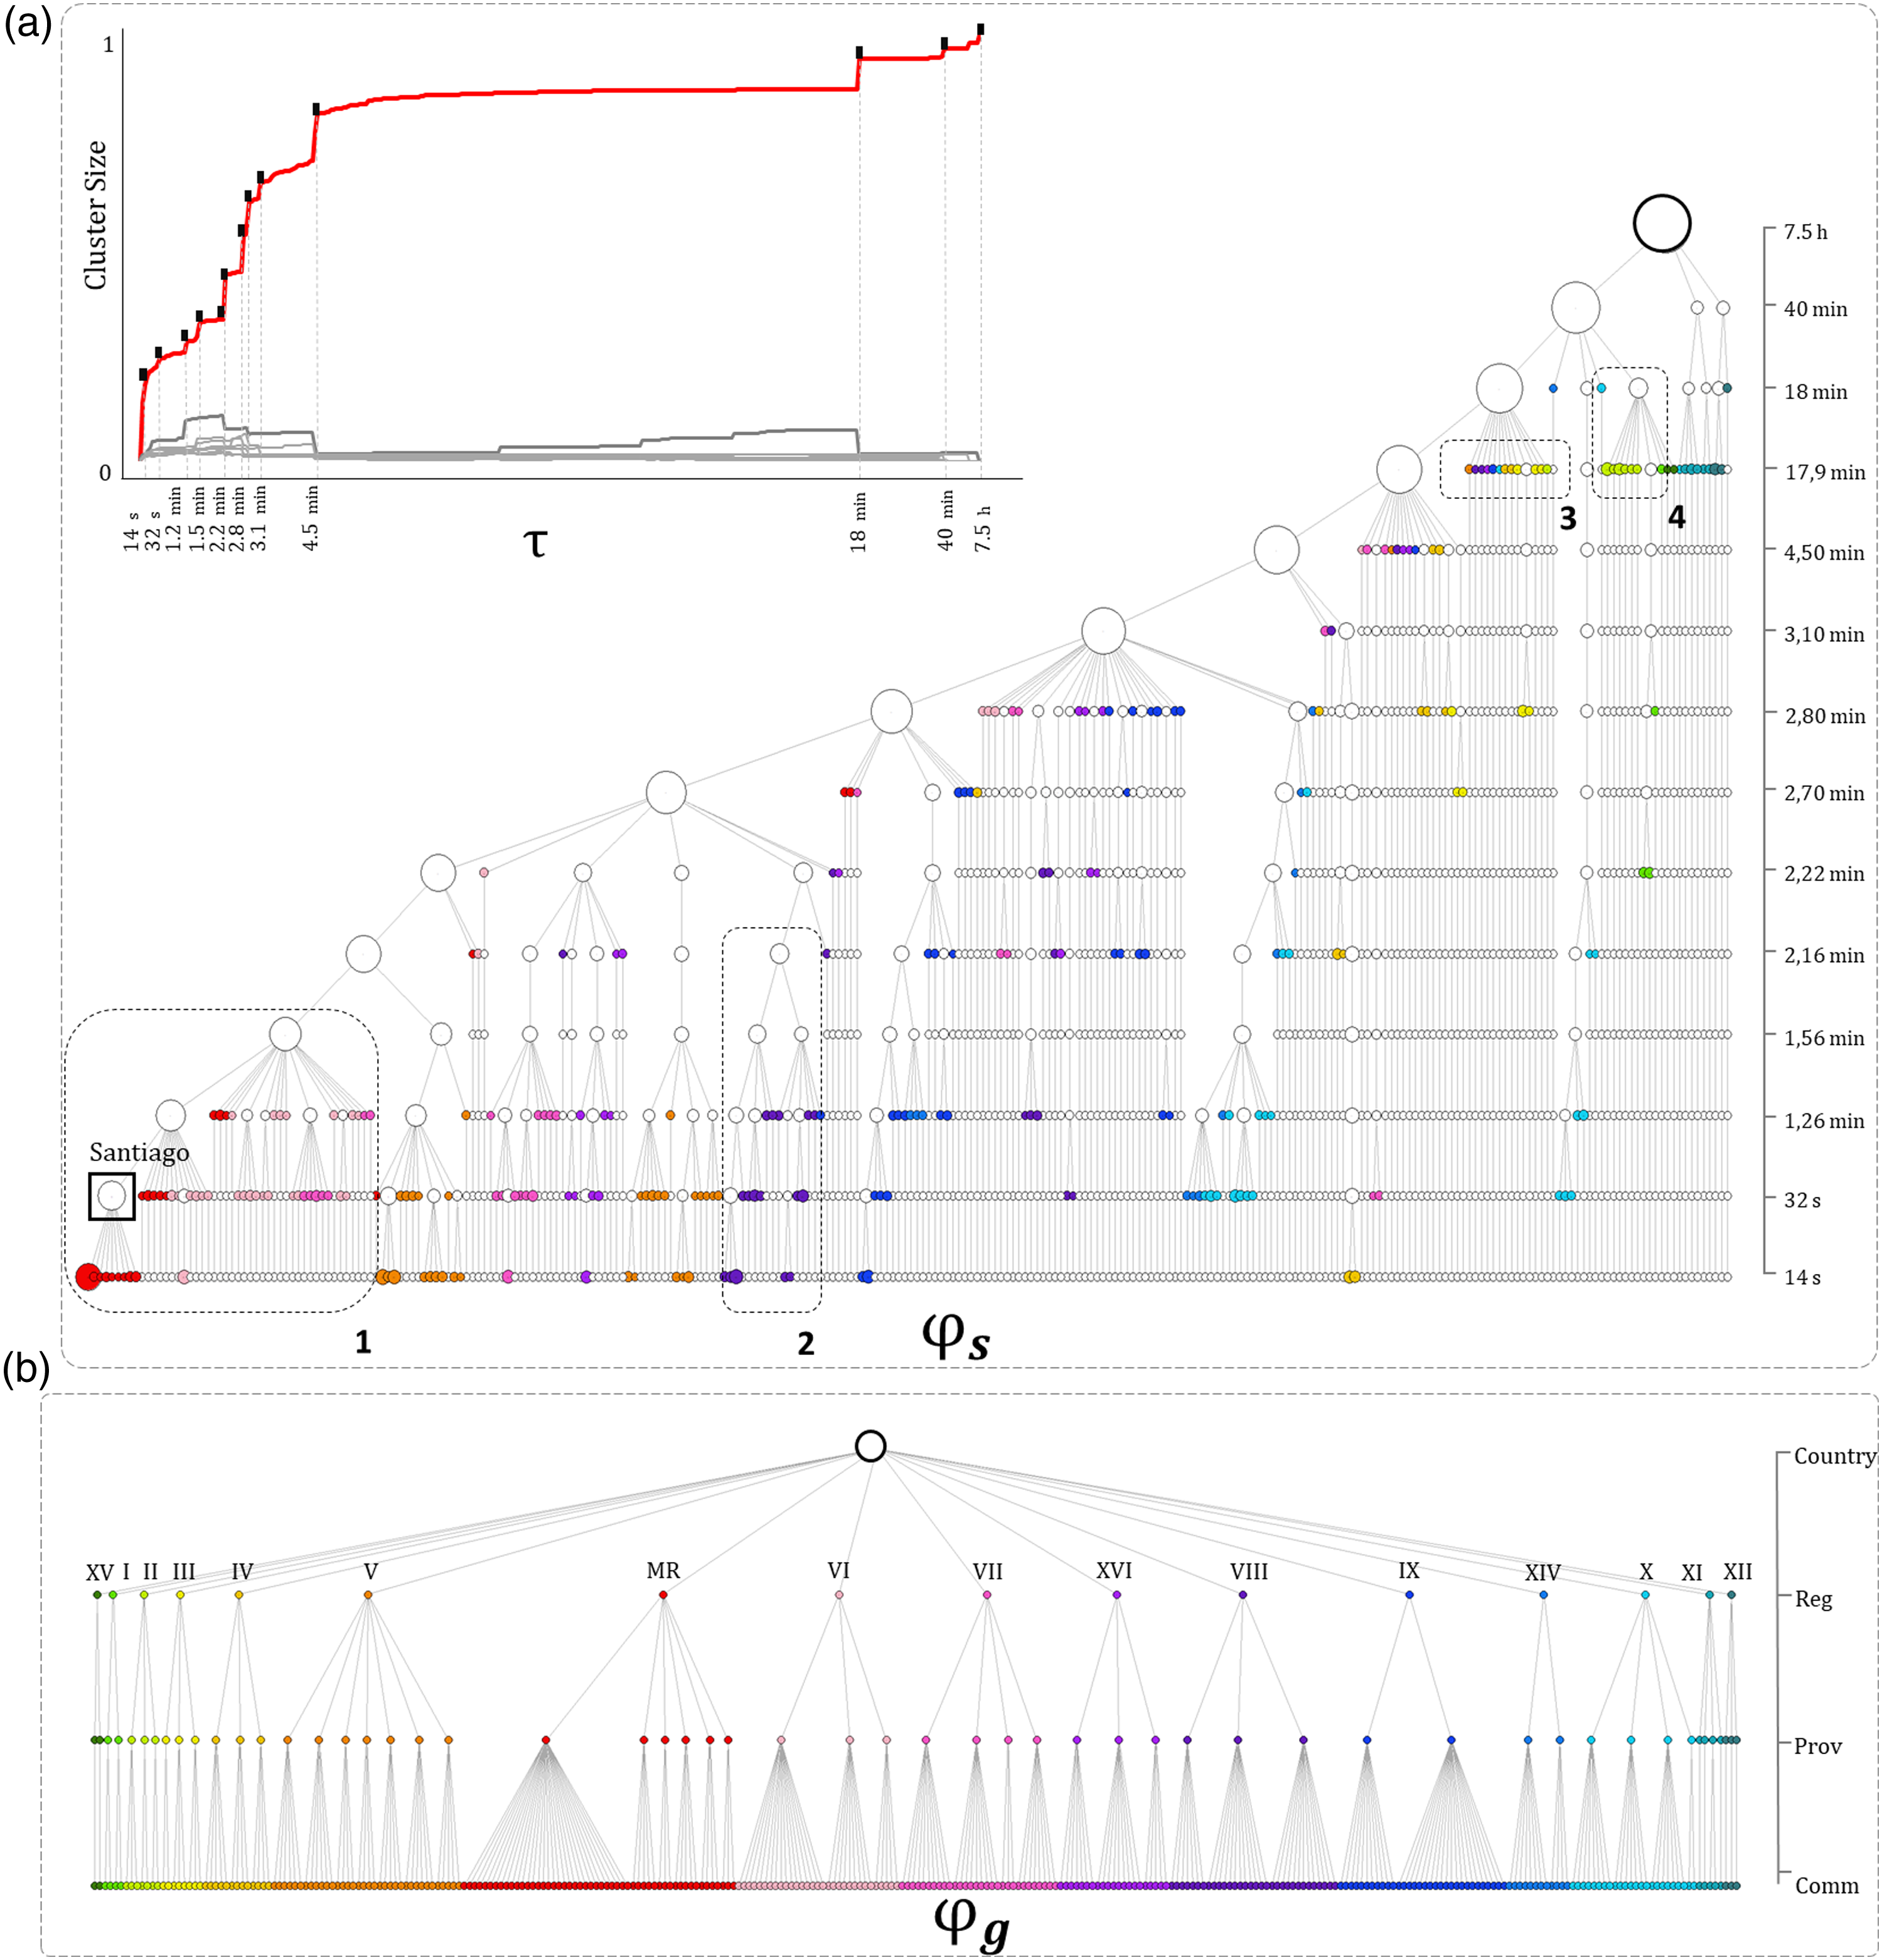
These significant disparities in regional clustering patterns, can also be examined by looking at the percentage of clustered entities per region at each percolation threshold in Regional clustering process and hierarchical distance D. In (a) the percentage of clustered urban entities along the percolation process per region. In (b) the mean regional cophenetic distances for the governance dendrogram 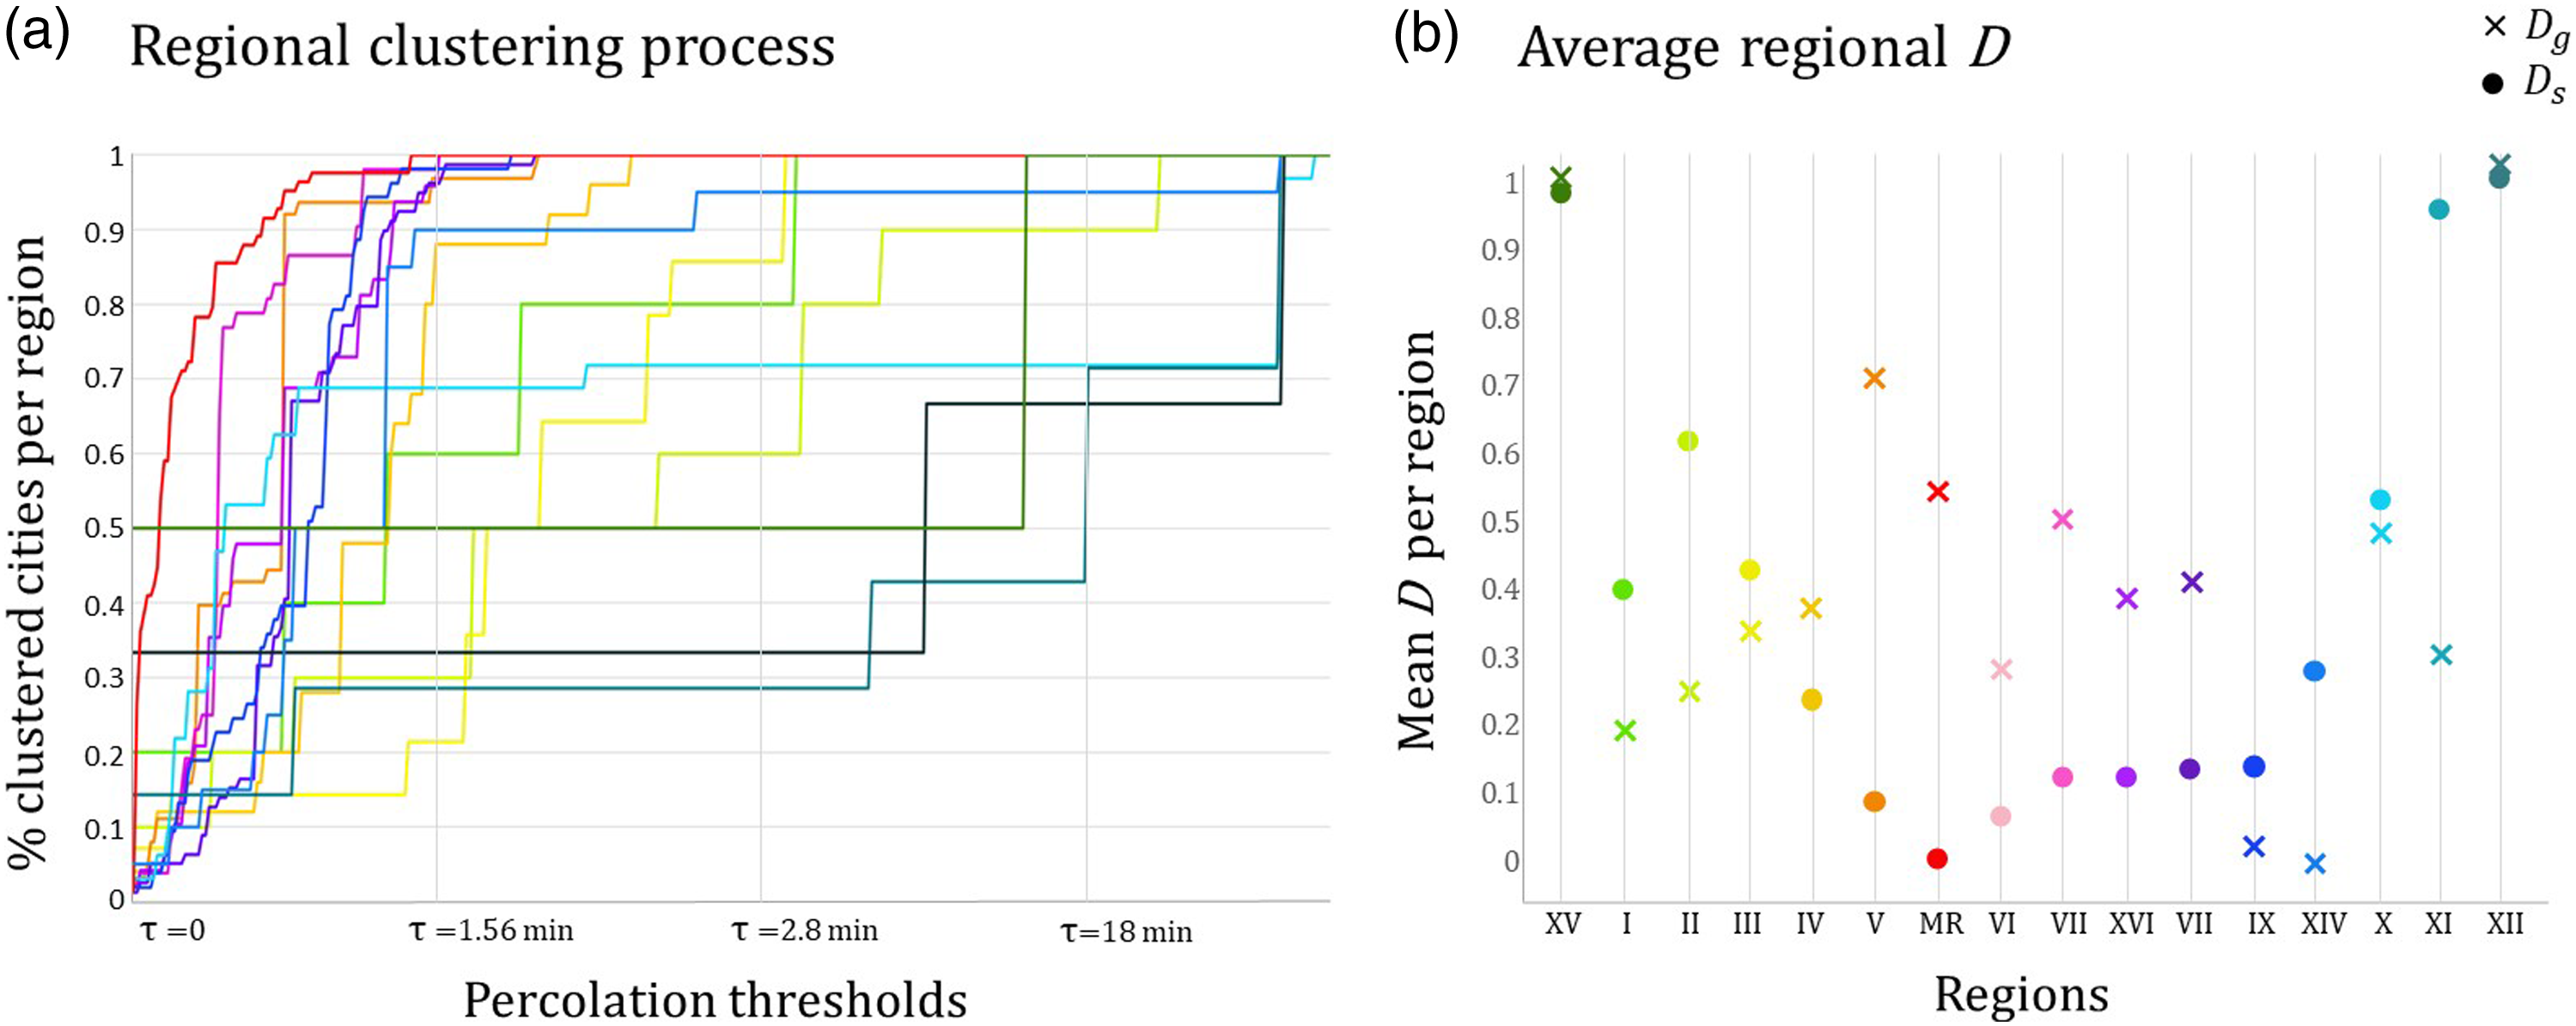
We measure the hierarchical distances between cities within each region using the cophenetic distance
In Figure 5, we plot the cophenetic distances between elements in the urban connectivity dendrogram Regional cophenetic distances (D) between dendrograms 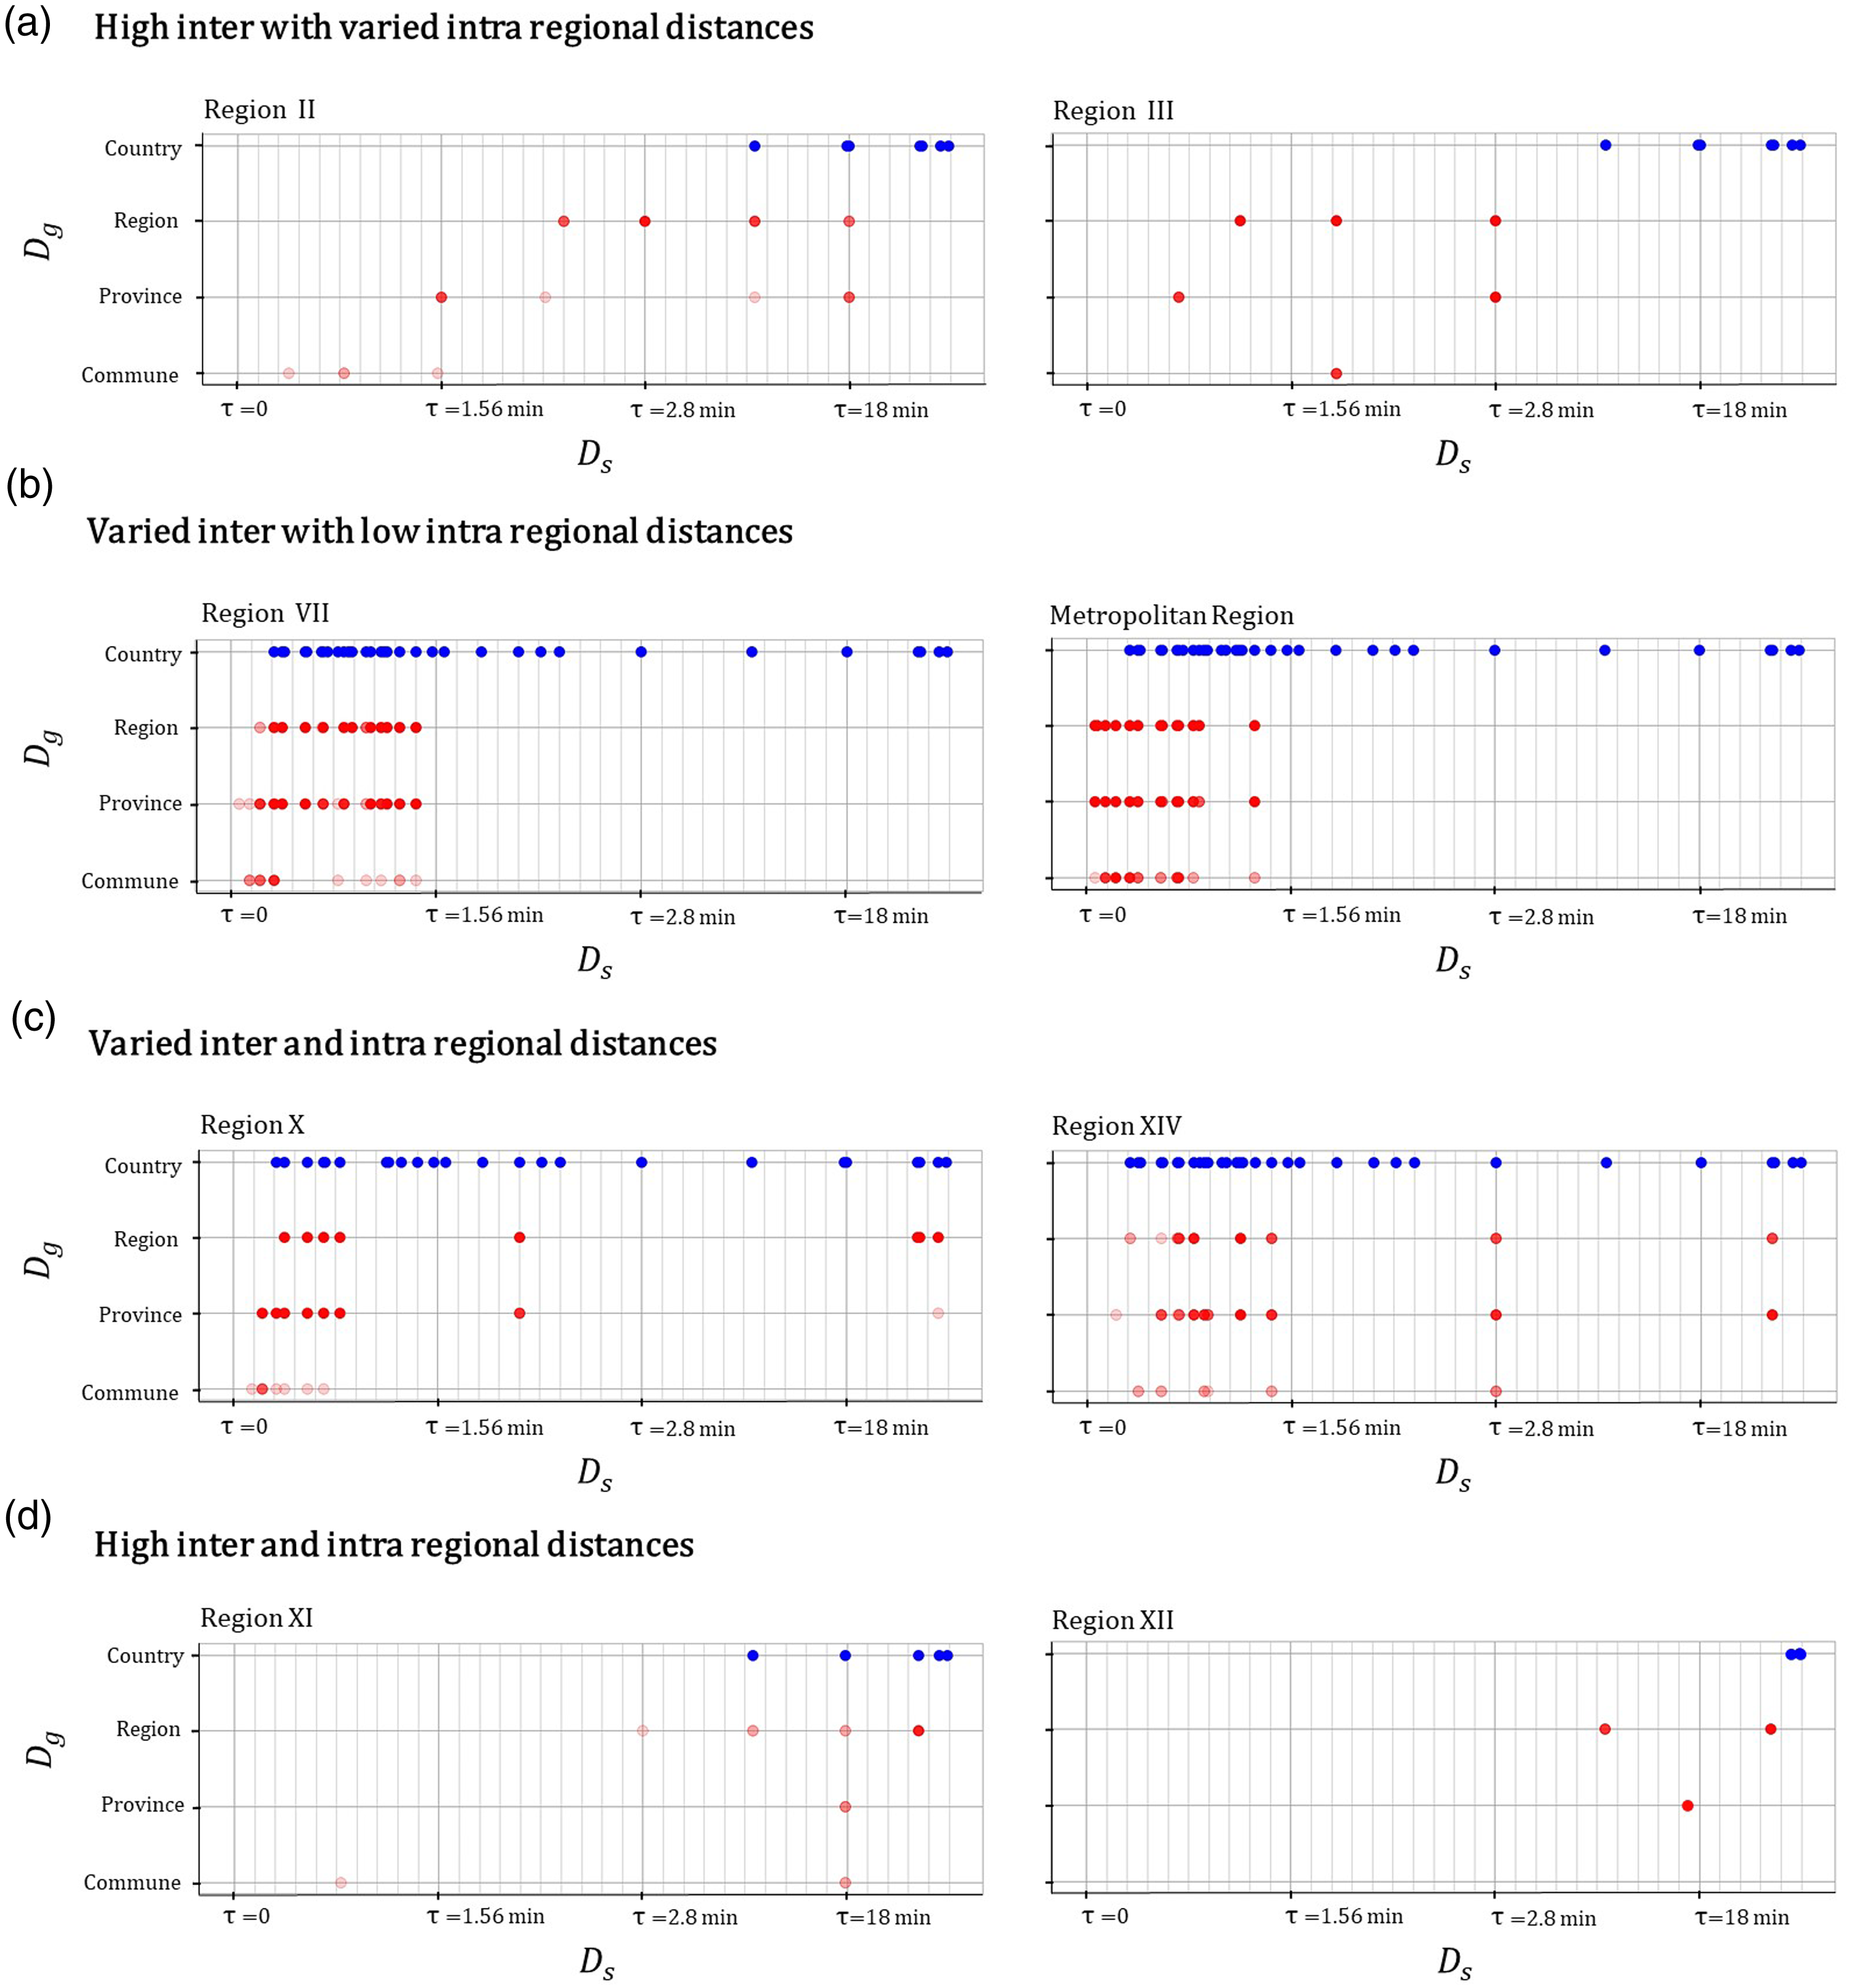
Based on the patterns of inter-regional relationships (in blue) and intra-regional relationships (in red) as provided by
Regional membership
The output of this section reveals that potential strong relationships between urban systems are not always determined by politico-administrative definitions and are rather driven by the dynamics of the urban systems themselves. The multiplicity of regional membership within clusters is measured using the Jaccard similarity
By examining the dendrograms displayed in Figure 3, we can see that in Regional Jaccard Similarity between all clusters from dendrograms 
The results in Figure 6 also show that most of the regional clusters have their highest
As shown in Figure 6, the metropolitan region MR, where the country’s capital is located, has a high Jaccard similarity value at a very low threshold, indicating a good correspondence between the administrative organisation and the urban organisation resulting from the local interactions. On the other hand, regions XI and XII only reach high
The results indicate varying degrees of mismatch between the organisation of regional memberships. This information allows us to better understand how decisions made at one level of governance can align with the relationships of urban systems beyond jurisdictional boundaries. This can improve our understanding of the effects of policies on targeted urban systems and potential impacts on larger scales. When the scales of governance and the systems being governed match, it is more likely that measures can be effectively implemented. Otherwise, there may be a need for greater coordination between regional and lower levels of administration.
Regional structure
‘In the new regions a new homogeneous and equivalent institutionality will be established’ – National Commission for Administrative Reform (CONARA) 1974
From the national dendrogram we extracted a sub-dendrogram for each administrative region, keeping the same thresholds (Figure 7). In this case, the hierarchical comparison is made between all the regional dendrograms in order to visualise and quantify the heterogeneity of their topological organisation. This allows us to contrast the logic of intra-regional structures that emerge from the urban connectivity patterns with the monocentric administrative approach, that is replicated uniformly across regions in the country. Results show that although there are some regions that follow the mono-hierarchical organisation based on a regional capital, there are other poly-hierarchical as well as dispersed regional organisations. Regional hierarchical organisations and structural entropy H. In (a) the sub-dendrograms from the different regions. The first column identifies mono-hierarchical regional structures, in the second column the poly-hierarchical regions and in the last column the dispersed hierarchical organisations. The 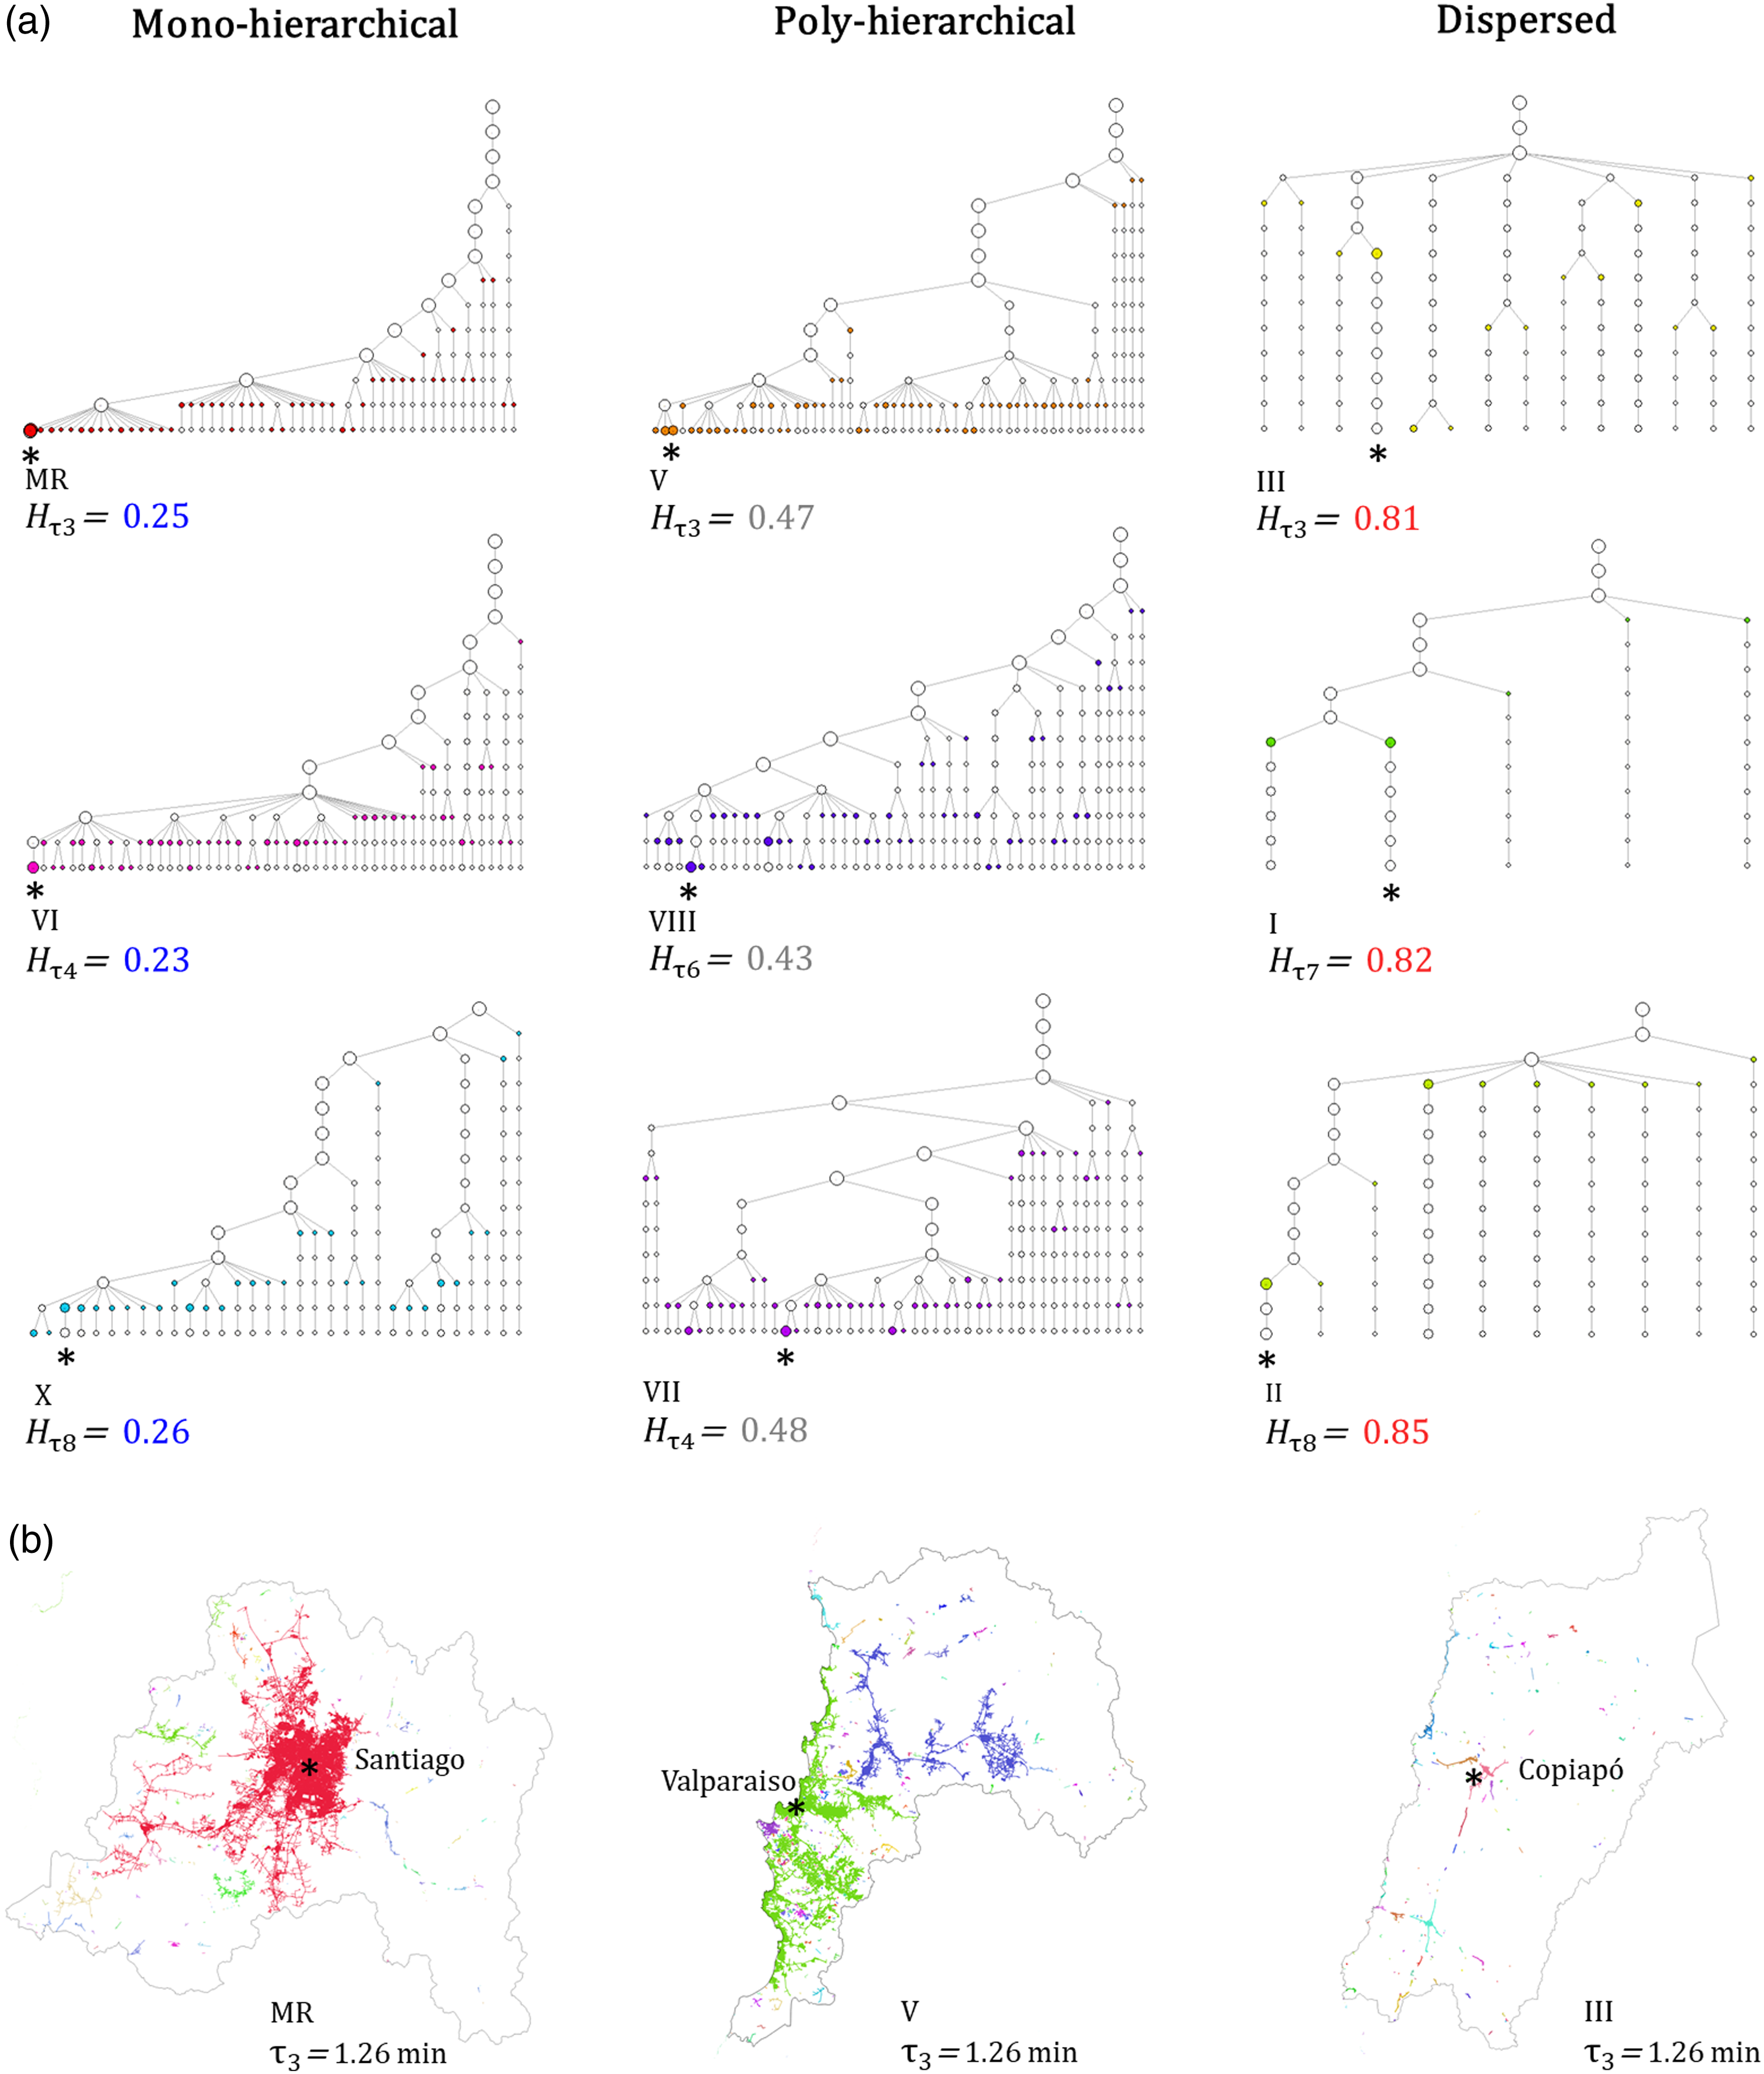
Figure 7 shows the hierarchical dendrograms constructed for every region, where clusters of cities and towns
The values in Figure 7 correspond to the
For example, in Figure 7(a), first column, we can see that in the dendrogram of the Metropolitan Region (MR) the system evolves in relation to the cluster that is initially defined by Santiago, the regional capital, which is also the country’s capital city. As the clustering process progresses, clusters of cities and towns are attached to this main cluster. At different phase transitions, the dominance of the largest cluster and the absence of other significant clustering formations reflect the monocentric structure, which is consistent with the regional governance structure. The predominance of the cluster that contains the regional capital, reduces the uncertainty of the system, and therefore
This polycentric structure is a result of the low connectivity between coastal and valley cities, which is hindered by the Coastal Mountain Chain that tends to isolate both sides. The regional capital also named Valparaiso, is part of the cluster formed in the coastal side. In this case, there is more uncertainty about how cities are grouped, as there is no clear dominant cluster. Instead, different systems of cities are forming. The entropy of poly-hierarchical dendrograms is higher than that of mono-hierarchical structures, with
The variety of regional hierarchical structures could suggest the need for a more diverse system of governance that can take into account local particularities. The current regional administrative approach centred around a well-defined regional development hub or capital city, may not always align with the spatial organisation of regions, leading to a mismatch that can have negative effects on planning. The outputs of the analysis show some regions with a mono-hierarchical organisation which aligns well with the administrative logic, while others do not. Regions with more diverse and dispersed hierarchical structures may benefit from a more flexible, multi-scalar governance approach that takes into account the varying capacities of different cities to collaborate and influence development. This could help promote positive spill over effects and support the overall growth of the region.
Conclusions
In this paper, we employ several quantitative methods, including cophenetic distance, Jaccard similarity and structural entropy, to compare dendrograms from different regions. This enables us to investigate the mismatches between the physical urban connectivity and the geographical administrative structures. We begin by examining the hierarchical distance between elements, calculating the cophenetic distance. When there are mismatches, we observe regions where cities are widely distant in terms of their relational intensity, which can hinder their ability to function as a unified entity. In such cases, governance faces greater challenges in establishing common development goals and promoting equitable growth. Next, we examine the membership of the dendrograms by computing the Jaccard similarity. When mismatches are present, we may find cases where the administrative boundaries of regions do not align with the clustering of cities. This can lead to cities from different regions being grouped together with higher levels of connectivity rather than forming strong regional clusters first. This is important for governance, in order to understand the impact of regional policies at different levels. Finally, we analyse the regional organisational structure by measuring the structural entropy of the dendrograms. In cases where mismatches exist, the clustering process may not align with the administrative logic based on a single centre of regional development, resulting in polycentric rather than monocentric regional structures. This presents a major challenge for governance, as it highlights the need to include different regional development strategies, including polycentric structures.
In this work, we focused on the scalar composition of regions in Chile, so that territorial disparities can be addressed. We found that current regional management approaches often overlook local dynamics and the heterogeneities within city systems. Our analysis provides valuable insights into the hierarchical structure of urban systems and emphasises the importance of considering the scalar composition of regions in decision-making. We found that scalar mismatches suggest that a ‘one-size-fits-all’ approach to regional governance may not be effective, and that decision-makers should take into account the specific organisation of each region in order to promote the development of the region as a whole.
It is worth noting that the definition of clusters is influenced by aggregation criteria and the nature of the network, particularly time and street networks in our case. Therefore, conducting hierarchical clustering analysis with different chosen criteria and networks could capture different organisational structures of the system. While the hierarchical clusters resulting through percolation on street networks may not capture the overall system patterns, they undoubtedly serve as valuable proxies to enhance our understanding of urban dynamics and the potential interactions between urban settlements. In future work, we plan to expand our analysis to include functional networks, bringing together structure and flows. Exploring alternative measures for examining and comparing dendrogram structures, along with different hierarchical clustering approaches used in this paper, could offer valuable paths for future research.
Overall, this work contributes to advancing our understanding of the complexity of the spatial regional morphology from a scalar approach. The different methods for comparing dendrograms are crucial for a comprehensive understanding of scalar mismatch, providing a framework for studying the interplay between the administrative organisation and the structure that emerges from the spatial connectivity of the urban system.
Supplemental Material
Supplemental Material - The scalar mismatch of regional governance: A comparative analysis of hierarchical structures
Supplemental Material for The scalar mismatch of regional governance: A comparative analysis of hierarchical structures by Valentina Marin, Carlos Molinero and Elsa Arcaute in Environment and Planning B: Urban Analytics and City Science
Footnotes
Acknowledgements
VM thanks The National Research and Development Agency (ANID) for the financial support provided as a PhD scholarship Becas Chile.
Author contributions
VM developed the theoretical framework, designed the experiments and conducted the analysis. CM and EA contributed to the theoretical framework. VM wrote the paper, and all authors contributed to the structure and fine tuning of the manuscript.
Declaration of conflicting interests
The author(s) declared no potential conflicts of interest with respect to the research, authorship, and/or publication of this article.
Funding
The author(s) disclosed receipt of the following financial support for the research, authorship, and/or publication of this article: The work was supported by The National Research and Development Agency of Chile (ANID).
Data Availability Statement
Supplemental Material
Supplemental material for this article is available online.
References
Supplementary Material
Please find the following supplemental material available below.
For Open Access articles published under a Creative Commons License, all supplemental material carries the same license as the article it is associated with.
For non-Open Access articles published, all supplemental material carries a non-exclusive license, and permission requests for re-use of supplemental material or any part of supplemental material shall be sent directly to the copyright owner as specified in the copyright notice associated with the article.