
Abstract
One of the central predictions of the new economic geography (NEG) is that the removal of trade barriers and other such frictions should lead to the geographical concentration and specialisation of economic activity, both between and within nations. This prediction has been used to argue that as the European Union becomes more integrated, economic activity would become more regionally concentrated and specialised. Using relative entropy measures applied to a new regional data set for the period of 1985–2019, this paper finds that between 1985 and 2000 localisation and specialisation between European countries increased to some extent but with a widespread fall in specialisation and concentration within countries. After 2000, and particularly after 2007 and the Global financial Crisis, the spatial distribution of economic activities in Europe appears to have become more complex, with some degree of concentration, agglomeration and specialisation both across and within countries. Overall, however, we find little long-run support for the NEG prediction.
Introduction
A key focus of the so-called New Economic Geography (NEG) that has developed over the past three decades has been to devise models of the spatial distribution of economic activity by combining ideas from ‘New Trade Theory’, Marshallian location theory, and the New Urban Economics (e.g., Baldwin et al., 2003; Brakman et al., 2009; Fujita et al., 1999; Fujita and Thisse, 2002; Krugman, 1991). One issue such models have been used to explore is what happens to the geographical distribution of economic activity as the level and nature of economic integration increases. Another is whether agglomeration increases national economic growth (see Gardiner et al., 2011).
Economic integration between countries can be viewed as lowering the transaction costs between the countries and the regions within them. Transaction costs can take the form of transportation costs, tariffs, differences in regulatory arrangements, quality standards, restrictions on the movement of labour and capital, exchange rate controls, or other such barriers and frictions. According to NEG theory, what happens to the spatial distribution of the industry if there is a move towards economic integration of the countries in question depends on three key issues: the extent and pattern of cost differences in the industry between regions across the countries, the pre-existing pattern of regional specialisation in the industry, and the extent to which the industry in question is subject to location-specific external economies.
NEG models typically assume a prior geographical distribution to be an equilibrium one. Now assume that the process of economic integration lowers the transaction costs between countries and hence between regions across those countries. If there were no cost differences amongst regions for a given industry in question, then a geographically dispersed pattern of that industry will be a stable (assumed to be ‘equilibrium’) state. If some regions enjoy cost or related advantages, then the reduction of transaction costs, such as removal of tariffs, will encourage a shift in the geography of the industry towards those regions with a pre-existing advantage and away from those with a disadvantage. So, according to this theory, increasing economic integration should ordinarily lead to a divergence in economic structure (i.e., increased specialisation) between regions in terms of their industrial structure, and to an increasing geographical concentration of the industry in particular regions, which then becomes a new stable (‘equilibrium’) pattern.
Krugman (1993) famously used this line of argument to suggest that as the countries belonging to the European Union become progressively integrated economically, so – other things being equal – they should become increasingly specialised in particular industries, with those industries concentrated in those regions in which the external economies benefits of localisation were greatest. His argument was based not only on theoretical reasoning, but also on appeal to the United States. The fact that the United States had a higher degree of internal spatial economic differentiation and regional specialisation than the European Union at that time indicated, in his view, what to expect in the European Union as it moved closer towards the sort of unified integrated economy exemplified by the United States, and especially as the EU moved towards monetary union.
Since Krugman’s suggestive contribution, various NEG-type studies have sought, both theoretically and empirically, to explore the implication of increasing international integration for the internal economic geography of countries, particularly in the case of Europe. Some have argued that when transaction costs fall below a certain threshold, international openness should lead to the agglomeration of industries within countries (e.g., Crozet and Koenig-Soubeyran, 2004; Monfort and Nicolini, 2000; Monfort and van Ypersele, 2003). Other, competing models, however, based on different assumptions on labour mobility and congestion-related costs, have suggested that trade liberalisation would favour the internal dispersion of economic activities, thus reducing the level of spatial concentration (Alonso-Villar, 2001; Behrens et al., 2007; Krugman and Livas, 1996; Puga, 1999). More recent work suggests that predictions need to take into account other trends in the spatial organisation of economic activity that are both an outcome and a source of increasing integration, particularly the rise of complex, geographically dispersed production networks and supply chains (see Baldwin, 2016). Such spatial webs or networks of supply and functional specialisation are now an important feature of the European economy.
One of the most recent, and detailed, studies of regional trends in specialisation and concentration of economic activity across the European Union is that by Cutrini (2010) who used a new version of the Theil Index to examine trends in both specialisation and concentration of manufacturing employment across some 145 NUTS2 regions for 10 European countries at three points in time, 1985, 1993 and 2001. Her analyses suggested that a process of regional de-agglomeration and de-specialisation of manufacturing activity had taken place over this period, a finding in contrast to the cross-national findings found in other studies, and not consistent with the basic economic integration thesis. That analysis is now somewhat out of date. One of the novel contributions of this paper is that it conducts an analysis of the changing geography of economic activity over the longer period of 1985–2019, a period of nearly four decades. This not only gives a more extensive time frame over which the process of European economic integration has been evolving, and hence better to detect any trends and changes in regional specialisation and concentration that may have occurred over this time, the extended period also includes some major events, most especially the Global Financial Crisis of 2007–2008 and the deep recessionary shock this generated, which may have disrupted both the integration process and the geographical organisation of economic activity. The Financial Crisis and associated Great Recession, represented the worst economic downturn and credit squeeze since the Great Depression of the early-1930s, and sent a shock wave of historic proportions across European economies. A second novel feature of the paper, therefore, is that our longer span of data allows an analysis of the possible impact of that Crisis on the geographical distribution of economic activity. A third novel feature is that for the period of 2003–2019, our analysis includes a range of private sector service activities in addition to manufacturing. The inclusion of services is important for a number of reasons. Not only is the European Union economy now dominated by services of various kinds, the locational dynamics of services, especially in response to increasing economic integration, may be different from those of manufacturing activities, and thus services deserve their own analysis. A fourth advance of this paper over Cutrini’s earlier analysis is that the number of countries analysed increased from 10 to 13, and from 2003 the number of regions from 133 to 215.
Our main findings can be summarised as follows. Briefly, as regards the period of 1985–2007, our analysis based on employment data shows that the overall convergence in regional economic structures and the spatial spreading of industries found up to 2001 in Cutrini’s earlier work, continued up until 2007, just prior to the global financial crisis. The same analysis, when replicated for the more recent period, 2003–2019, suggests that in the post-global financial crisis period, 2007–2019 the process of overall spatial dispersion not only moderated, but that there is some evidence of an increase in the agglomeration (or co-location) of economic activities accompanied by the geographical concentration of individual manufacturing industries and services. For knowledge-intensive services, however, the trend is towards greater spatial dispersion and co-location with the rest of the economic activities. Interestingly, we found that concentration and agglomeration do not coincide with specialisation. Summarising, therefore, our detailed empirical work suggests an overall trend towards less regional specialisation and geographical concentration as the countries and regions of the EU have become increasingly integrated – the reverse of standard NEG theory – and more in line with what Krugman (2009) himself has more recently has argued is happening. Of course, the impact of the COVID-19 pandemic and the war in Ukraine may well have additional and complex implications for the geographical distribution of economic activities across the EU, and suggested that further research on this issue will continue to be needed in the future.
Previous empirical research: a brief survey
Much of the empirical work on the spatial agglomeration of economic activities and specialisation patterns in the European Union refers to the 1980s and 1990s. In the first wave of empirical studies, specialisation and concentration in Europe were analysed mainly using countries as the basic unit of analysis. As for specialisation, earlier studies employed export data to assess country specialisation patterns (see, among others, e.g., Aquino, 1978; Sapir, 1996), while other studies analysed country specialisation using production data, such as employment, value-added, or output (see Combes and Overman, 2004 for a comprehensive survey). While Amiti (1999) reports a general increase in relative specialisation in EU countries from 1968 to 1990, Midelfart-Knarvik et al. (2004) tend to suggest that the process of relative specialisation is more complex at least from the early-1980s until the end of the 1990s. Recent studies, focussed on EU-27 countries, suggest increasing specialisation of the new member states (see e.g., Bagoulla and Péridy, 2011 and Vechiu and Makhlouf, 2014). Specialisation patterns at the sub-national level have been less analysed empirically. Results from the few studies available indicate that there is no evidence of increasing regional specialisation over the pre-EMU period (e.g., Cutrini, 2010; Paluzie et al., 2001).
A number of scholars find a pattern of increasing geographical concentration of manufacturing across European countries during the 1980s (Amiti, 1999; Brülhart, 1998; Midelfart-Knarvik et al., 2004), followed by a process of dispersion (deconcentration) during the following decade (Aiginger and Pfaffermayr, 2004; Midelfart-Knarvik et al., 2004). Using production data for Belgium, France, Italy, Germany and the United Kingdom, Amiti (1999) reported a significant increase in relative concentration for a majority of manufacturing industries between 1976 to 1989. Moreover, Brülhart (1998) found out that, during the 1980s, localisation increased in 14 of the 18 European industries considered, especially labour-intensive industries and increasing returns to scale industries. In contrast, analysing the period 1970–1997; Midelfart-Knarvik et al., 2004 suggested that the upward trend of the 1980s was a brief interlude before returning to decreasing localisation across European countries. Focusing on the spatial concentration of manufacturing value added between 1985 and 1998, Aiginger and Pfaffermayr (2004) suggested that an upward trend occurred in the pre-Single Market period while dispersion dominated afterwards, and the changes are significant for each period.
More recently, the growing availability of disaggregated data has allowed analysis of the concentration of manufacturing industries across EU subnational regions (Aiginger and Leitner, 2002; Brülhart and Traeger, 2005; Cutrini, 2010; Ezcurra et al., 2006; Hallet, 2000). However, the findings from these studies, all covering the period before European Monetary Union, have varied. Some have found a declining regional concentration of manufacturing employment across NUTS1 regions (Aiginger and Leitner, 2002), while others find evidence of an increasing concentration of value added during the 1990s (Aiginger and Davies, 2004; Aiginger and Pfaffermayr, 2004). On the basis of regional gross value added, Hallet (2000) found inconclusive results, while Brülhart and Traeger (2005) found mixed evidence for the interregional concentration of value added in manufacturing industries. While Ezcurra et al. (2006) find empirical support for the “Krugman hypothesis” with regional data, other studies report decreasing localisation across Spanish provinces during the 1980s (Paluzie et al., 2001), across Italian regions from the early-1970s to the late-1990s (De Dominicis et al., 2013; De Robertis, 2001; Rombaldoni and Zazzaro, 1997) and within Germany after 2000 (Dauth et al., 2016). Overall, while results from the early regional studies are in favour of a downward trend in specialisation and dispersion of manufacturing activities before the implementation of the single currency, polarisation may have emerged in the post-EMU period before the global financial crisis, at least for some industries. For example, Schweizog and Collins (2015), focussing on four key manufacturing industries, provide some evidence of an increase in geographical concentration between 1999 and 2007.
Empirical research on industry location and agglomeration in Europe has focussed nearly exclusively on manufacturing. Since services are an important part of the European economy, it is important to consider them in any recent analysis of the EU geography of economic activities. Recent studies, including services in the analysis, indicate heterogeneous evolutions across sectors in Italy and dispersion of industry and services in Germany (e.g., De Dominicis et al., 2013 for Italy, and Dauth et al., 2016 for Germany). Moreover, given the European institutional architecture, it is essential to characterise the spatial distribution of economic activities both across and within countries.
Geographical specialisation and concentration
Four major dimensions, or aspects, of the distribution of economic activity across geographic space, can be identified from the vast literature that now exits on the subject: regional specialisation, regional concentration, regional agglomeration and local clustering. Although both concentration and agglomeration deal with the location of economic activity, their focus is somewhat different. According to Brülhart, typically concentration analyses the location across space of an individual sector of activity, whereas agglomeration analyses the co-location across space of several sectors, for example, several different manufacturing industries, or several different types of services, or the co-location of manufacturing industries and services. In the view of Brakman et al. (2009), studies of agglomeration show how far a number of industries are co-distributed across geographic space; whereas, the analysis of concentration does the same only for a particular type of economic activity, says the production of motor vehicles.
Concentration and agglomeration can in turn be distinguished from specialisation (see Brakman et al., 2009; Gorter, 2002; Hallet, 2000), even though they may be related in certain circumstances. At this point, it is important to draw a distinction between relative specialisation and absolute specialisation, in parallel with the distinction between absolute and relative concentration that is well-established in the literature (e.g., Bickenbach and Bode, 2008; Brülhart and Traeger, 2005). Absolute specialisation deals with the question of whether or not a location’s (nation, region, city, etc.) economic structure (in terms of shares of employment or output) is dominated by one or just a few related sectors, for example, motor vehicles or textiles. It is usually measured by comparing the location’s economic structure (composed by N industries) against the uniform distribution, that is an economic structure with equally sized industries. Relative specialisation deals with the question of whether and to what extent a location’s economic structure is dissimilar compared to a relevant benchmark, for example, in the case of, say, a member state of the European Union, with the aggregate EU’s economic structure, or in the case of a region or city, with the economic structure of the nation of which the region or city is a part.
The issue of specialisation has long been a key notion in trade theory, where it is argued that nations, cities and regions will tend to specialise in those activities in which they have a comparative advantage. Thus, the degree of relative specialisation in a city or region is typically taken to be an indication of that city’s or region’s ‘revealed’ comparative advantage in the sector(s) concerned. In certain circumstances, however, specialisation and concentration can be the two sides of the same coin (Aiginger and Davies, 2004; Cutrini, 2009a), since a very high level of concentration of an industry in a particular region may well mean that the region is in fact specialised in that sector, in as much that it dominates the region’s employment structure.
Thus, as Brakman et al. (2009) point out, concentration, specialisation and agglomeration may or may not coincide, depending on contingent circumstances. Further, when considering the regional effects of the economic integration within the European Union, it is possible to have specialisation between nations (that make up the EU), but not necessarily between regions within those nations. Also, it is possible to have concentration of an industry between nations, but no industry concentration within nations. Some examples are illustrated stylistically in Figure 1, in which there are two industries and two countries each with four regions.
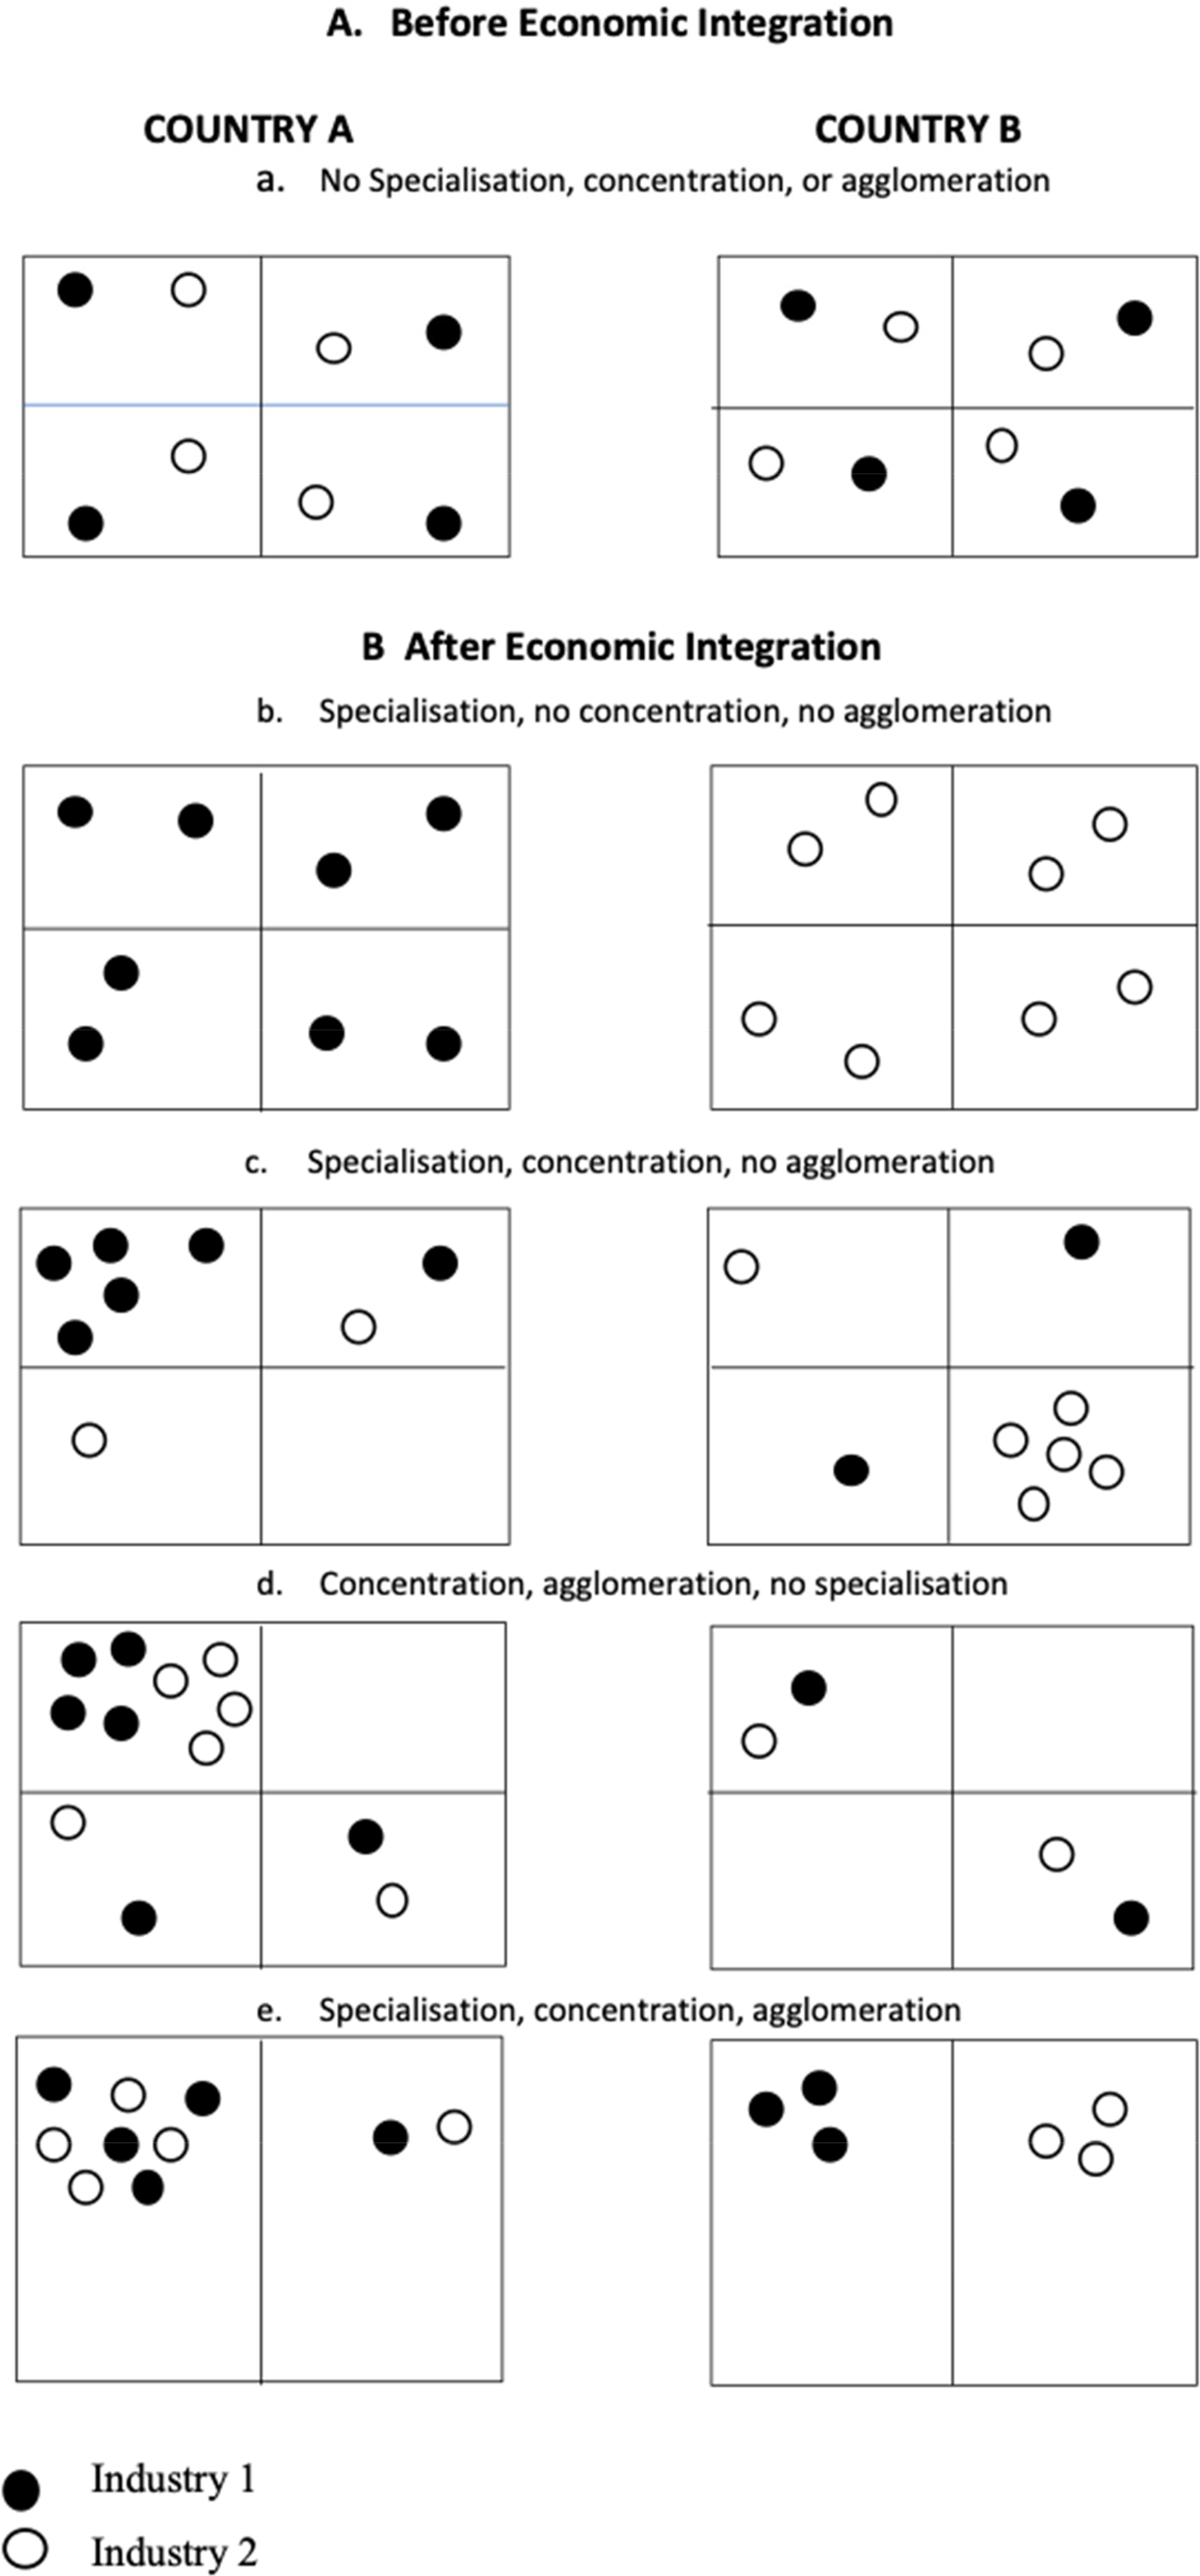
Some stylised geographical outcomes of economic integration: two countries, each with four regions, two industries.
For simplicity, assume a pre-integration pattern in which both industries are equally distributed across the four regions in each country (Figure 1(a)).
1
Following integration of the two countries, and assuming this reduces transport costs, removes barriers to trade and factor movements, and so on, then a variety of outcomes are possible, depending on the specifics of the industries, regions and countries. In one case (Figure 1(b)), integration leads to a shift in both industries such that industry 1 becomes concentrated in country A, which is thus specialised in that industry, while industry 2 shifts to Country B, which thus becomes specialised in that industry. But note there need be no regional concentration or specialisation in either country. In fact, this case corresponds to a scenario of complete localisation between countries (
Other possible outcomes are illustrated in Figure 1(c–e). In Figure 1(c), country A becomes specialised in industry 1, which is also concentrated in one of its regions (which thereby specialises in that industry), while country B becomes specialised in industry 2, which is also concentrated in one of its regions. This is a case in which localisation is particularly high, due to both cross-country divergence and also within-country specialisation associated with a spatial concentration of industries in different regions. In Figure 1(d) there is a concentration of both industries 1 and 2 in country 1, and an agglomeration of the two industries in one particular region of that country. Both countries have no relative specialisation since their economic structures are the same as the benchmark (the sum of the two) (
Notice that with the agglomeration of the two industries in one region in country A (as in Figure 1(d and e)), overall localisation – a weighted sum of relative concentrations of each industry in the methodology of the present analysis – will be lower compared to the case in which the industries are mostly localised in different regions as in the case illustrated in Figure 2(c).
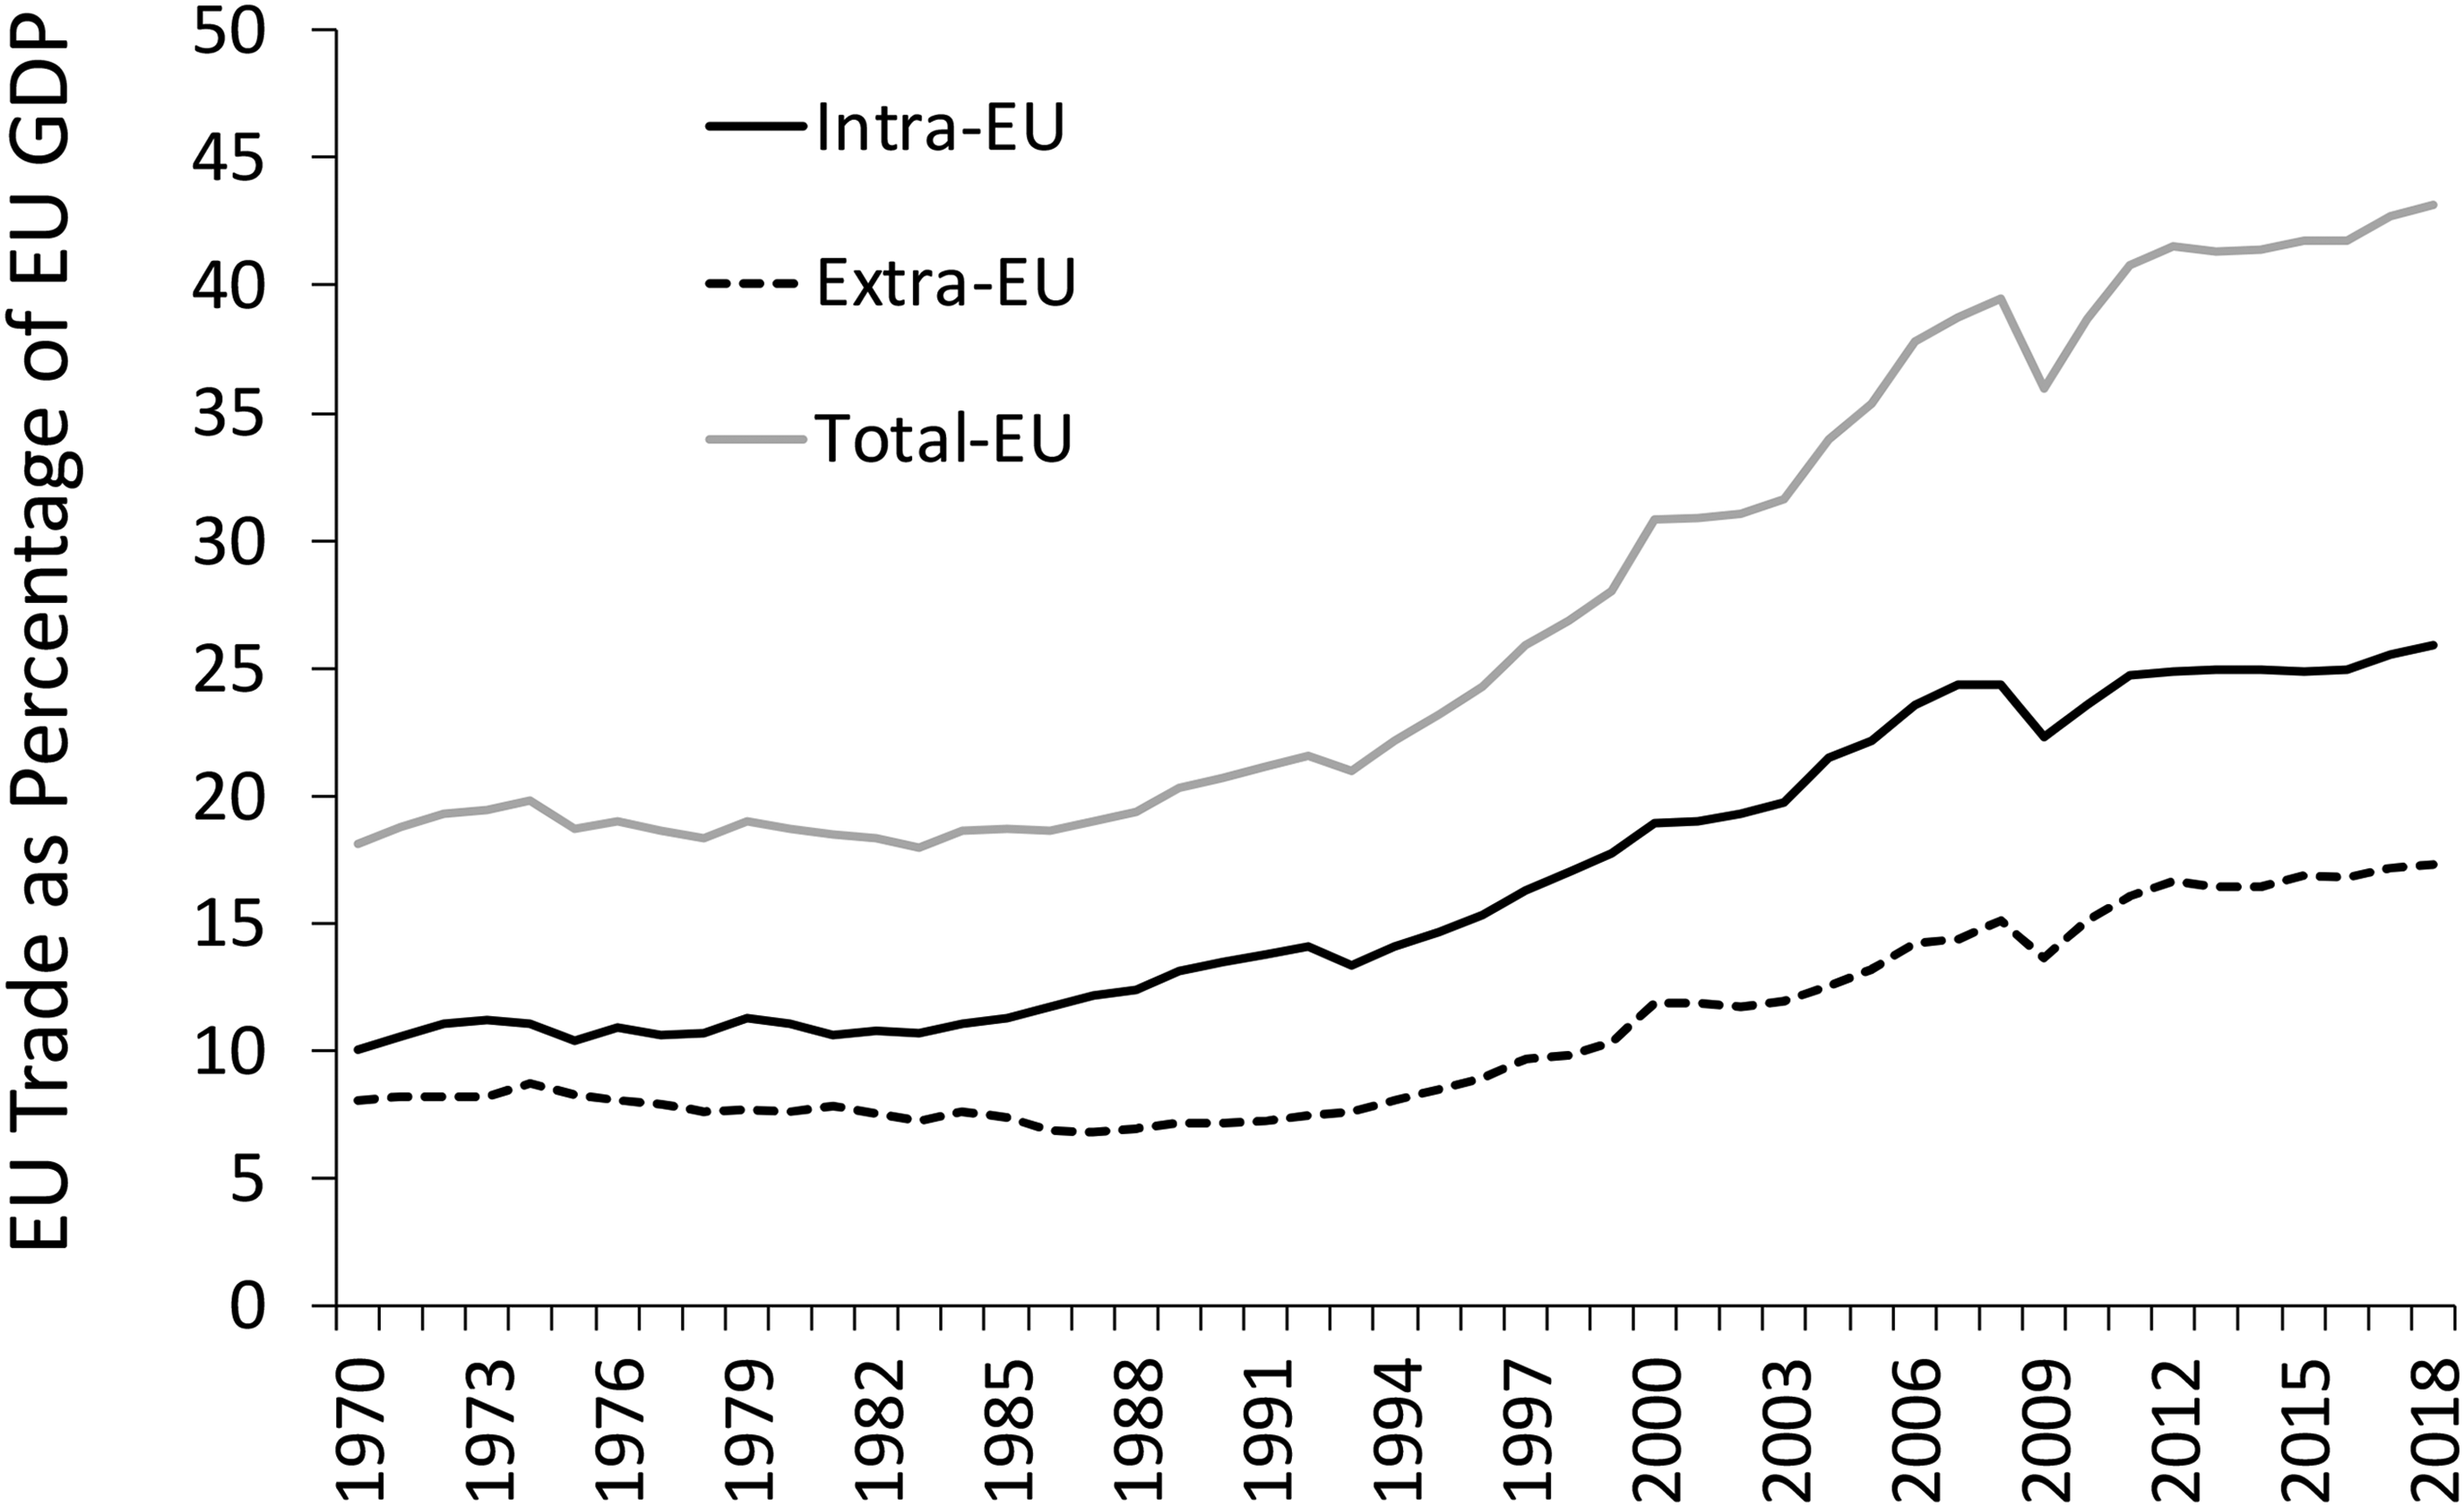
The growth of EU trade, 1970–2018. Source of data: Cambridge Econometrics, based on Eurostat Data.
These examples merely illustrate the complex range of outcomes that are possible and which might follow integration, and the different geographical levels at which such outcomes can be analysed. They also suggest that decomposability would be a desirable feature of any measure used to assess the geographical distribution of economic activity in an integrated multi-country, multi-region system such as the European Union.
Data and methodology
To evaluate agglomeration, specialisation and concentration and their changes over time, we used employment as the main variable of interest (output data, such as Gross Value Added, are less detailed and more restricted in coverage; further, output can change simply by changes in product prices, which may have nothing to do with employment). We collected employment data from two sources available in the Eurostat Region-SBS database to obtain an adequately long period of time. An immediate challenge is that relevant data are available in discontinuous time series due to different sectoral classifications for different time periods, from NACE Rev 1.1 to NACE Rev 2. To first extend the initial analysis based on the NACE Rev 1.1 classification to 2007 some data manipulations were required in order to conduct the analysis with the same sample of regions and thus avoid inconsistencies that would lead to possible aggregation bias. To this end, some regions were dropped and others were aggregated so to build a final and consistent set of 133 NUTS1-NUTS2 regions belonging to EU-15. For the following period 2003–2019 employment data are based on the NACE Rev 2 classification, and collected for 215 NUTS1-NUTS2 regions belonging to EU-28. The Data Appendix contains a detailed description of data sources.
We acknowledge that, ideally, agglomeration and concentration should be assessed in continuous space to avoid the checkerboard problem related to arbitrary geographical boundaries, and the inherent aggregation and scale problems (See Arbia, 1989). However, distance-based measures require micro-geographical data, which are not available. In any case, geographical boundaries are expressions of economic institutions responsible for planning and economic policies. Thus, it may be important to know the spatial scale at which agglomeration, concentration and specialisation occur to inform policy makers. To this end, some authors propose the use of relative entropy indices (Bickenbach and Bode, 2008; Brülhart and Traeger, 2005; Cutrini, 2009a, 2010), which have distinct advantages over the standard measures constructed over the discrete space. The most relevant is decomposability. This feature permits the decomposition of localisation across different spatial and sectoral scales in order to identify the contributions of individual regions (sectors) to the overall localisation of economic activity.
Entropy-based approaches are appropriate since they allow for the nested geographical perspective (region-country) typical of the European economy and are incorporated in New Economic Geography models. For this reason, relative entropy measures are becoming frequently used in such analyses (e.g., Bagoulla and Péridy, 2011; Gokan, 2010; Stierle-von Schultz and Stierle, 2013; Vechiu and Makhlouf, 2014; among many others). Further, by bootstrapping the measures, and their components, we are able to assess whether geographical concentration, specialisation and localisation changed significantly over time. The resampling process is repeated 10,000 times. Given the bootstrap estimate of the sampling distribution, it is possible to derive standard errors, compute confidence intervals, and conduct the following hypothesis testing:
H0: ΔTk = 0
H1: ΔTk ≠ 0
Where ΔTk is the change in the relevant Theil entropy index.
In a period of deindustrialization, when employment and value-added formation has shifted from manufacturing to service sectors, it is important to evaluate how the spatial distribution of sectors and the economic structures of countries and regions have evolved. For these reasons, we use both absolute and relative measures to analyse the evolution of concentration, specialisation and agglomeration in Europe during the past three decades characterised by deepening European integration, especially following the implementation of the monetary union. In the Methodology Appendix, we have included a detailed description of the set of complementary indicators we have used.
Results on concentration, agglomeration and specialisation: from an old to a new pattern
Recent trends in EU integration
EU Single Market Integration can be measured in various ways, typically centred around the four fundamental freedoms of movement which underpin it: goods, people, services and capital. Since much of NEG theory on the effects of economic integration on the geographical distribution of industry emphasises the increased trade that integration is alleged to promote, it is useful, by way of context to look briefly at trends in trade within the EU.
Figure 2 plots EU trade, as a proportion of total GDP, since 1970. In terms of overall importance, and with the exception of the Great Recession of 2008–2010, trade has increased steadily as a proportion of GDP since the early-1980s. A marked acceleration can be seen in the 1990s and 2000s due to trends in both globalisation and increasing EU integration, with many new members joining the EU in this period, including the Mediterranean enlargement of Spain and Portugal in the mid-1980s, Austria, Finland and Sweden in mid-1990s, and many countries from the former eastern European block countries from 2004 onwards; the EU12 of the mid-1980s had become the EU28 by the end of the period in Figure 2. By this time, the process of monetary union that began in 1990, and accelerated after 1999, had brought 19 EU member states into a common currency area (Eurozone), further integrating their economies.
What is also evident from Figure 2 is that at least up to the Great Recession of 2008–2010, triggered by Global Financial Crisis of 2007–2008, intra-EU trade grew slightly faster than extra-EU trade (as a share of GDP), so that by 2007, on the eve of the financial crisis, intra-EU trade accounted for 63% of total EU trade. It then more or less stabilised thereafter. As measured by trade, the economies of the European Union had become significantly more integrated over our study period of 1985–2019.
Overall trends in economic localisation
From a systematic analysis of location patterns, we identified major long-run trends in localisation, concentration and specialisation in the European Union. In a nutshell, as regards the period 1985–2007 we basically confirmed the previous evidence that pointed to an overall convergence in regional economic structures and a spatial spreading of industries. The same analysis, when replicated for the more recent period, 2003–2019, suggests that moderation of the process of spatial dispersion and of convergence occurred, starting from the beginning of the new millennium.
In fact, over the 2003–2019 period, there is some evidence to suggest that economic activities have become slightly more geographically concentrated. Figure 3 plots the within-country and between-country contribution of overall localisation in the entire period of our analysis. Overall localisation of manufacturing and its component have increased marginally from 2003 onwards, perhaps starting to delineate a ‘U-shaped’ pattern whereby individual industries are diverging from the spatial distribution of total manufacturing employment.
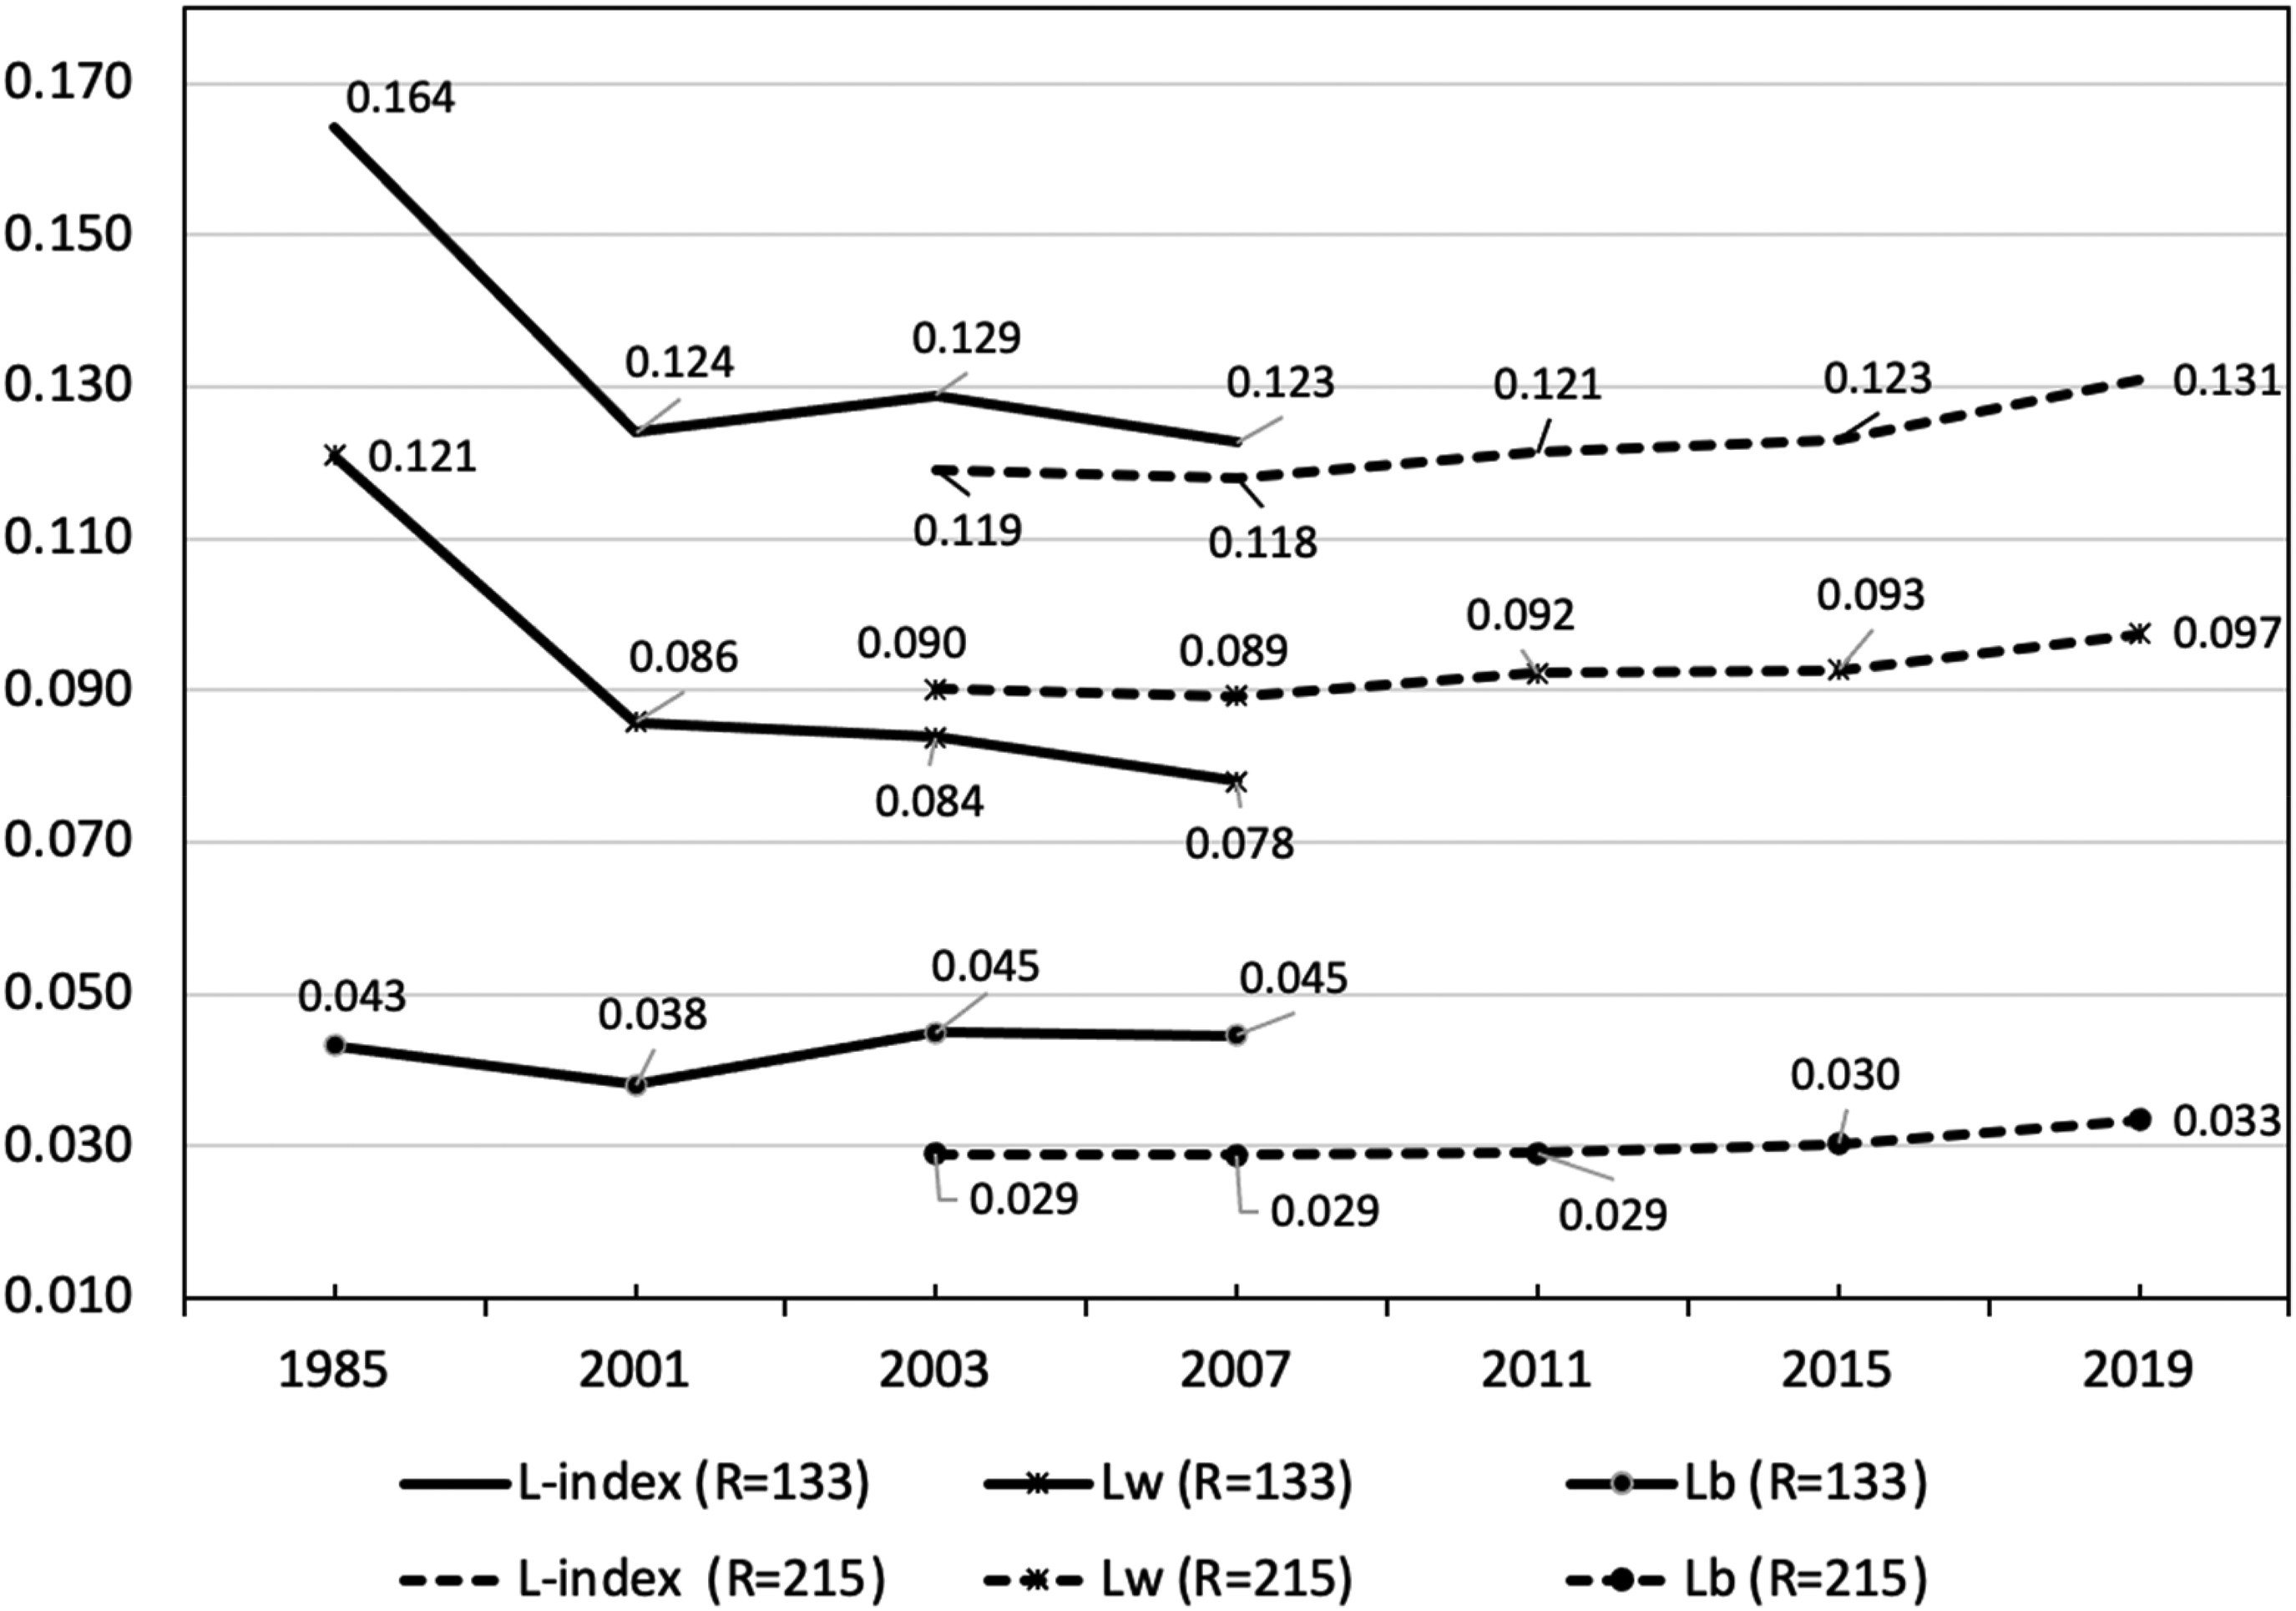
Evolution of the entropy index of overall localisation (L-index) and its components, 1985–2007; 2003–2019: manufacturing employment. Notes. The lines in the graph refer to the entropy index of overall localisation (L-index), and the respective components (Lb, L-index between country; Lw, L-index within country). The plain line refers to the analysis over the period 1985–2007 and is based on the sample of 133 regions and the NACE Rev 1.1 classification of sectors. The dashed lines refer to the analysis over the period 2003–2019 and are based on the sample of 215 regions and the NACE Rev 1.1 classification of sectors.
This first evidence is further investigated with the next stage of analysis, which focuses on changes in patterns of geographical concentration and agglomeration, where we complement relative entropy measures with absolute measures of concentration for a more comprehensive analysis of both manufacturing industries and services.
We found that low-tech industries are diverging from manufacturing as a whole over the period 2003–2019 and in some cases – Food and beverages, Rubber and plastic products, and Basic metals – the changes are significant (Table 1, column 2). This result is robust to the change in the benchmark distribution (manufacturing employment or total employment in manufacturing and services) 2 (Table 1, column 3). In other words, the same industries are also deviating from the spatial distribution of total employment in manufacturing and services. Interestingly, these manufacturing industries are also clustering in space as the results on absolute concentration suggest (Table 1, column 1). Moreover, a significant geographical concentration of industries arises more often across countries rather than within countries as the results of the testing procedure performed by spatial scales suggest (Tables A3 and A4).
Evolution of spatial concentration across 215 EU regions, 2003–2019.
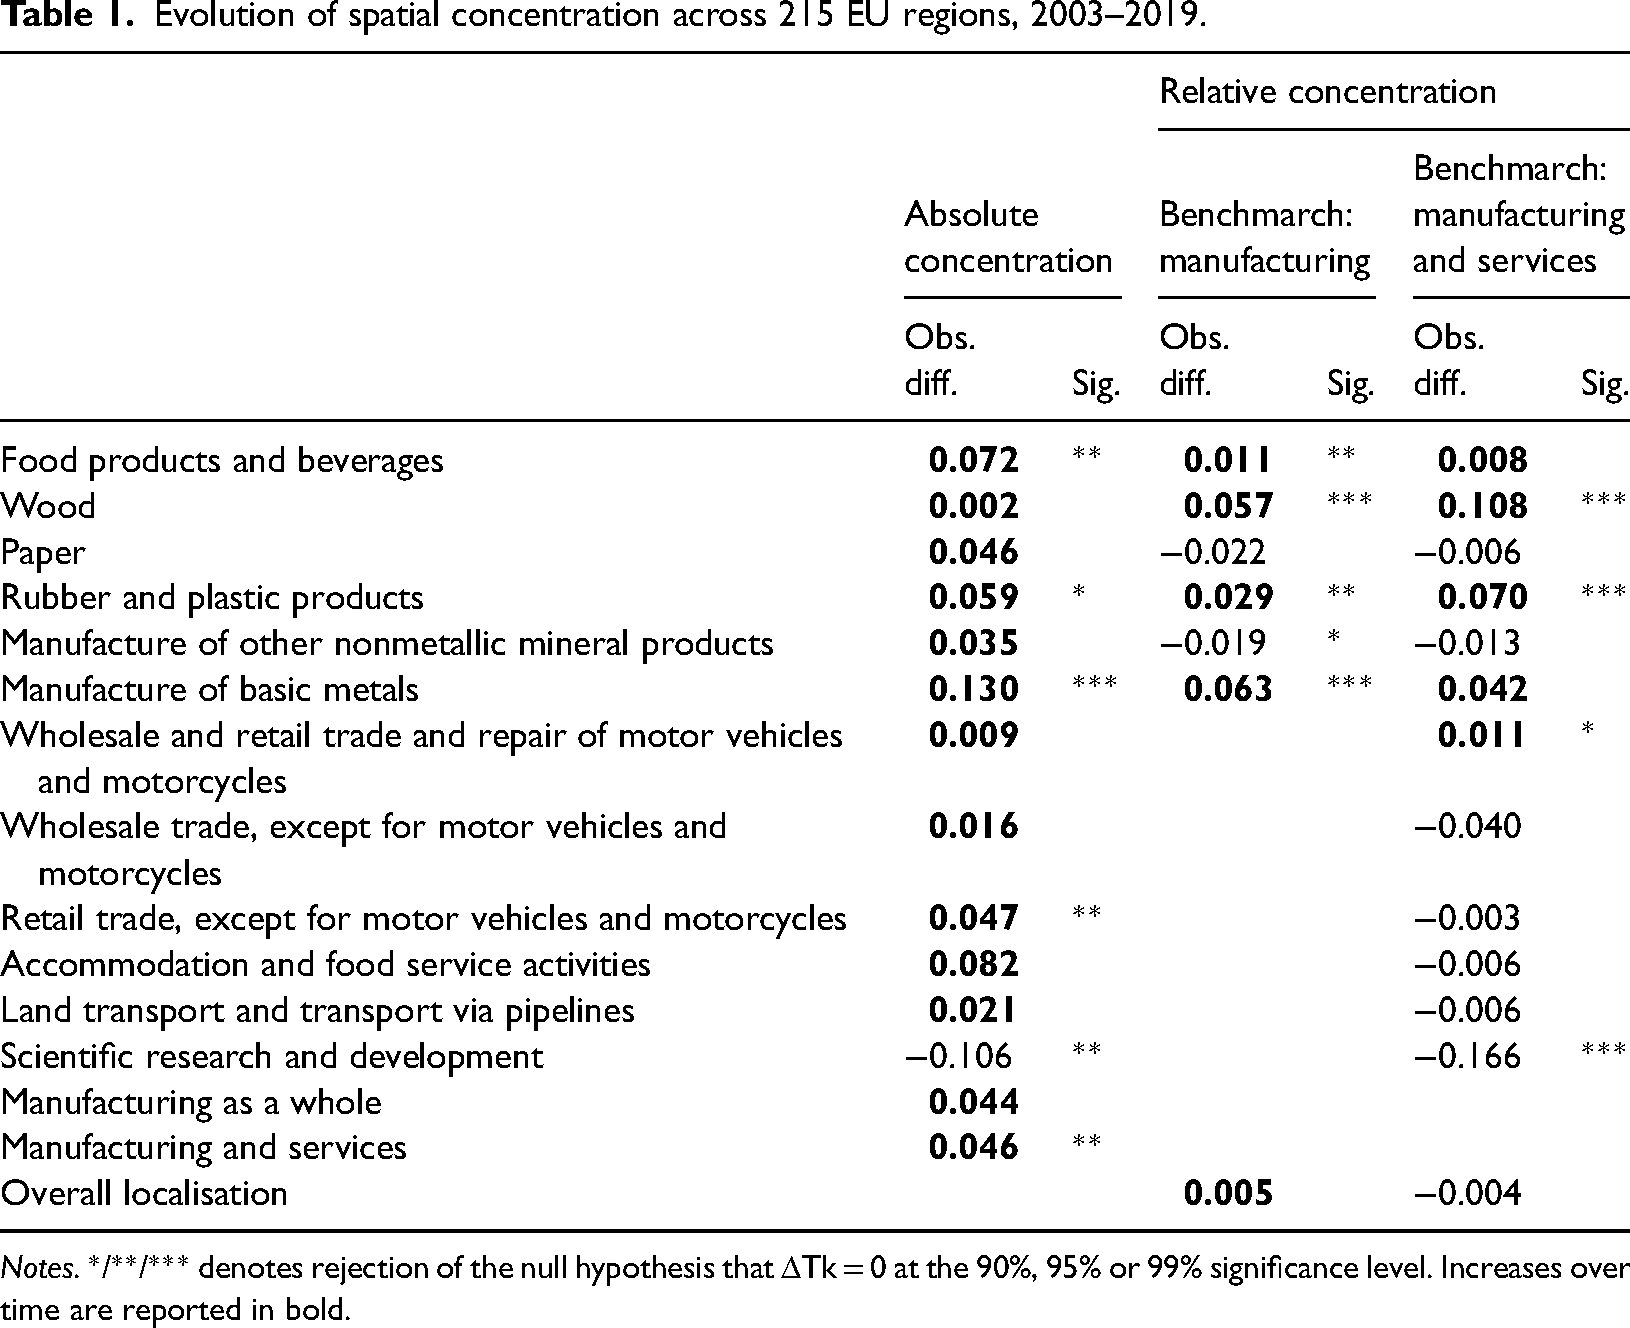
Notes. */**/*** denotes rejection of the null hypothesis that ΔTk = 0 at the 90%, 95% or 99% significance level. Increases over time are reported in bold.
Service sectors are becoming more geographically concentrated too, except for scientific research and development which is becoming more evenly distributed across Europe. The spatial concentration of knowledge-intensive services has decreased significantly resulting in increasing co-location with the rest of economic activities, that is, relative to total employment. The remaining services – wholesale and retail trade, accommodation and food services, transport – are clustering in some regions while converging to the spatial distribution of total employment (Table 1, columns 2 and 4). Finally, it is worth noting that both our benchmark distributions in the present study (manufacturing and total employment), are also becoming slightly more geographically concentrated, as reported at the bottom of Table 1.
Taken together, the results of Table 1 suggest that industries and services are clustering in different places/regions. In fact, in this period, urban areas or capital regions have increasingly attracted services while manufacturing employment has remained or clustered in extra-urban regions. Based on this evidence, we suggest that, after 2000, the actual spatial distribution of industries and services exhibits some degree of concentration, agglomeration, in some cases combined, with specialisation thus suggesting that the European economic geography has been changing towards a more complex pattern that resembles panels (d) and (e) of Figure 1, depending on the country.
Table 2 reports the changes in relative specialisation, and its components, with their significant level. Despite the general clustering of industries and services accompanied by their agglomeration for the period 2003–2019 (Table 1), our results do not provide the support that, as EU integration has progressed, all Members States and their regions are becoming more economically specialised in recent years. Our analysis of recent data confirms a significantly increasing regional specialisation only in Greece, France and within some other Member States – such as Belgium and Germany while the increase in cross-country specialisation is positive and significant only in Sweden and Poland.
Evolution of specialisation patterns across 215 EU regions, 2003–2019.
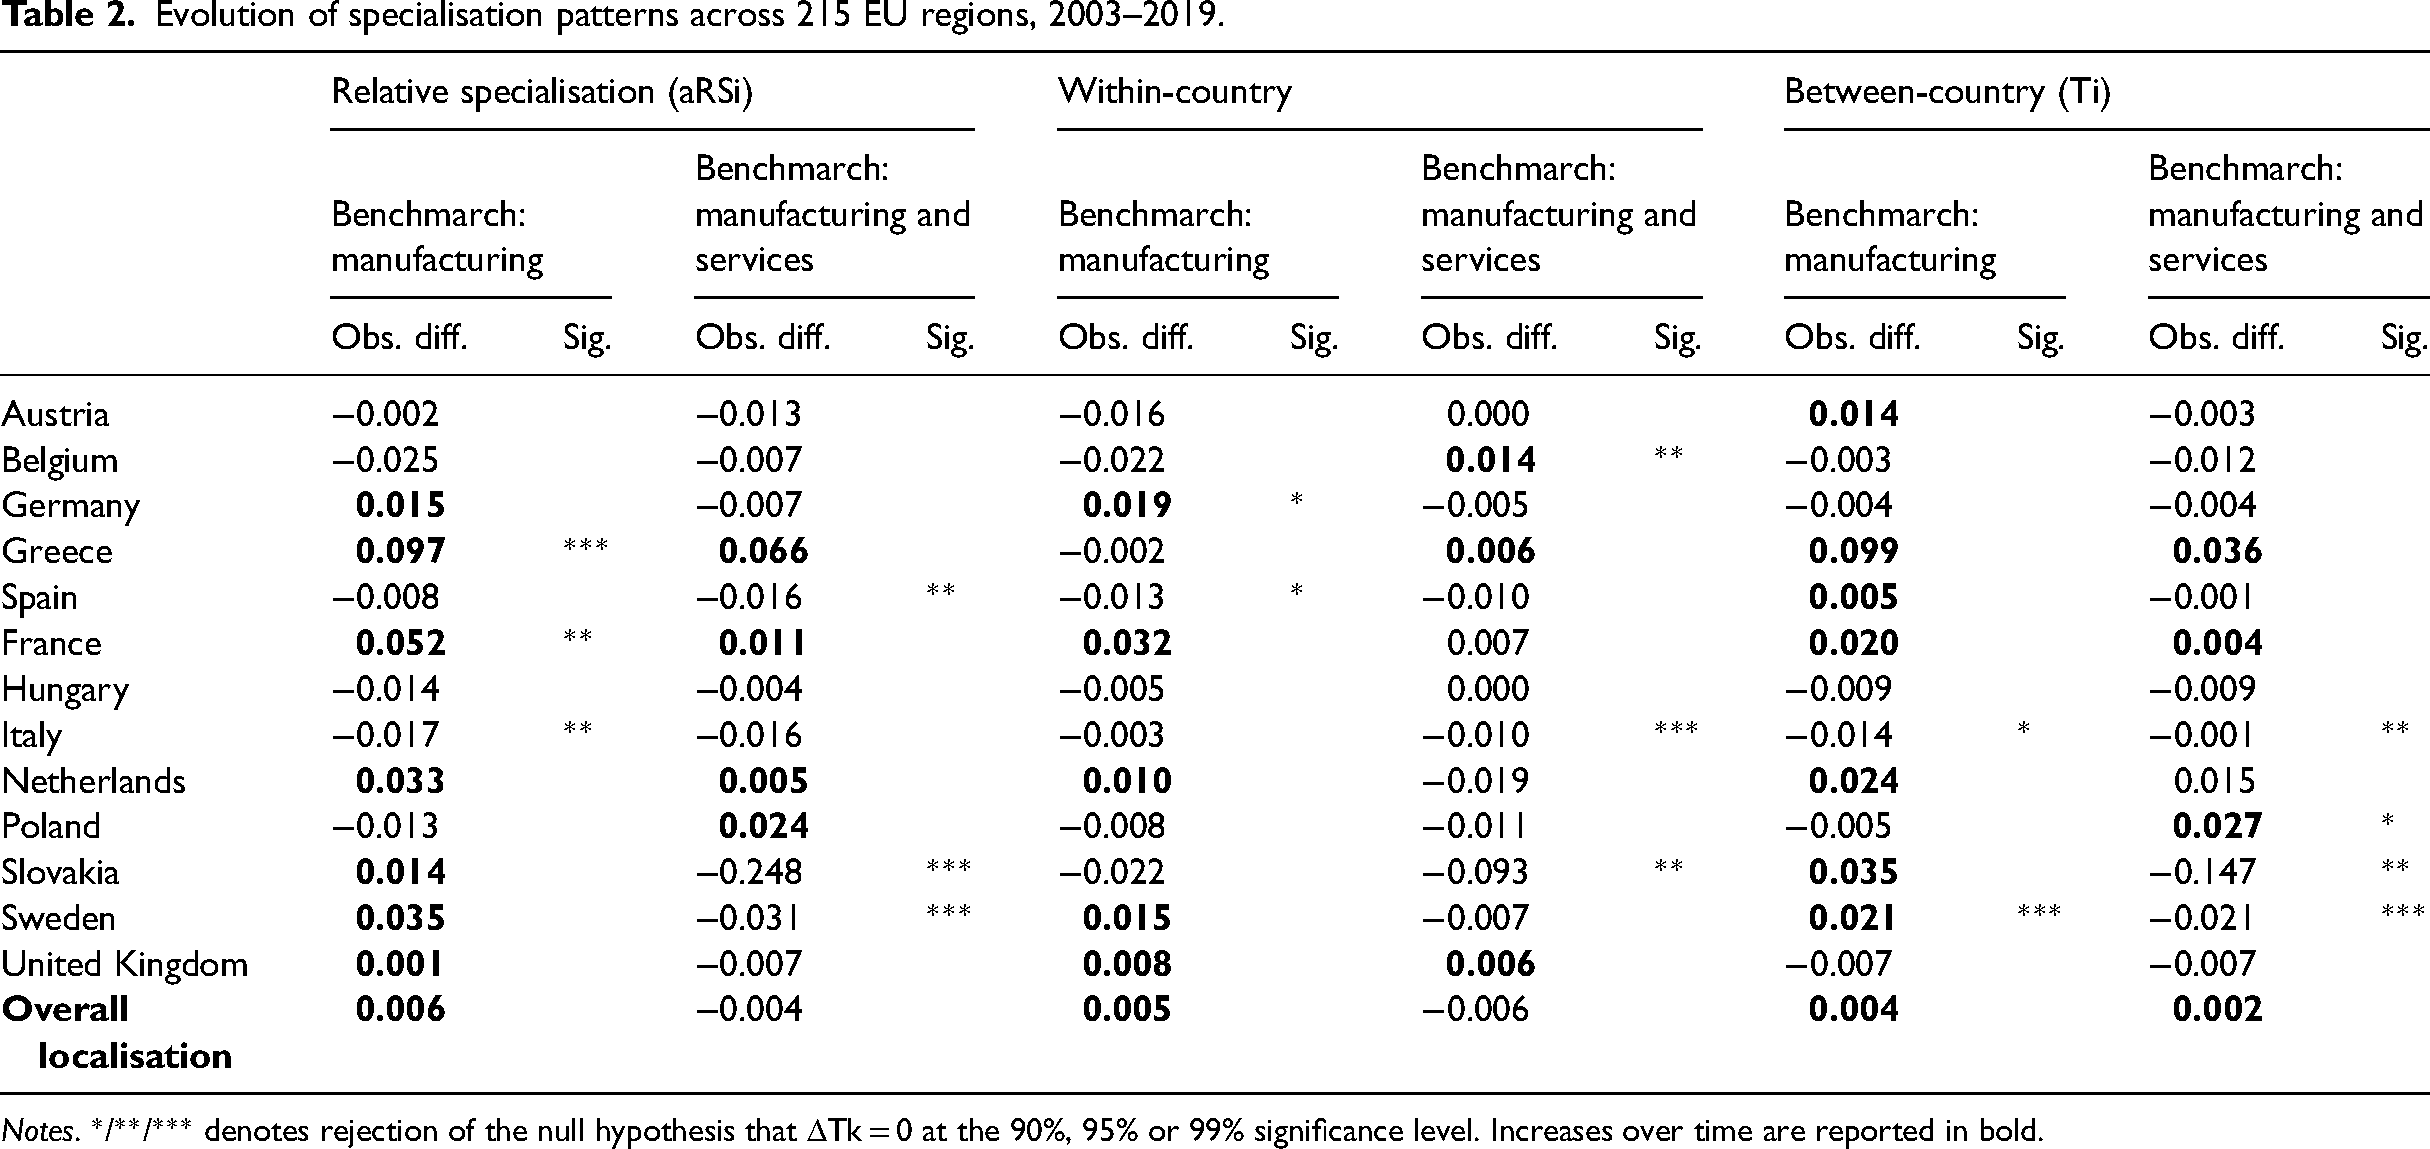
Notes. */**/*** denotes rejection of the null hypothesis that ΔTk = 0 at the 90%, 95% or 99% significance level. Increases over time are reported in bold.
Hence, we find that in the European Union, the evolution of concentration and agglomeration does not coincide with specialisation trends after the introduction of the Euro. Our results confirm that concentration and agglomeration should be distinguished from specialisation, as suggested by Brakman et al. (2009). Moreover, our results should also be interpreted in light of the growing evidence of the fragmentation of production processes across borders with countries and regions trading tasks and functions rather than products. That is, regional sectoral (‘horizontal’) specialisation may be giving way to regional functional (‘vertical’) specialisation (Timmer et al., 2019; see also, e.g., French, 2017; Yi, 2003). With cross-border production sharing, countries and regions can specialise in particular stages of the production process – such as R&D, fabrication, marketing, and management. Data classified by sector will not necessarily reveal this type of specialisation: different types of data are required. Such forces are also linked to the globalisation of production processes, which has been progressing at a rapid rate during the period under analysis and has encouraged geographically dispersed production networks. It is quite possible, therefore, that the economic forces caused by EU integration are relatively smaller on the latter than on the former. It is possible that some degree of regional specialisation of tasks or functions is replacing regional sectoral specialisation, but the detailed data required to investigate this are not available on a consistent basis.
We acknowledge that those recent results should be treated as provisional not only because, due to data availability, they encompass a limited number of manufacturing industries – typically low-tech industry – and services. In the next section, we focus on manufacturing and describe the detailed results for the period prior to the global financial crisis.
Relative concentration and specialisation before the Global Financial Crisis: another look
Our results suggest that during the early phases of EU economic integration, corresponding to the construction of the single market and the implementation of the single currency, national comparative advantages, dispersion of industries and de-specialisation within countries have driven the early adjustments in location patterns.
In other words, the economic geography of Europe tended to move toward a scenario described in Figure 1(b) that is specialisation across countries without clustering of individual industries.
Table 3 shows the results for the relative concentration of manufacturing industries with their average values, observed difference and significant levels over the periods 1985–2001 and 1985–2007, the latter computed on the basis of the 133 NUTS2 regions and the NACE rev 1.1 classifications of industries.
Relative concentration of manufacturing industries across 133 EU regions.
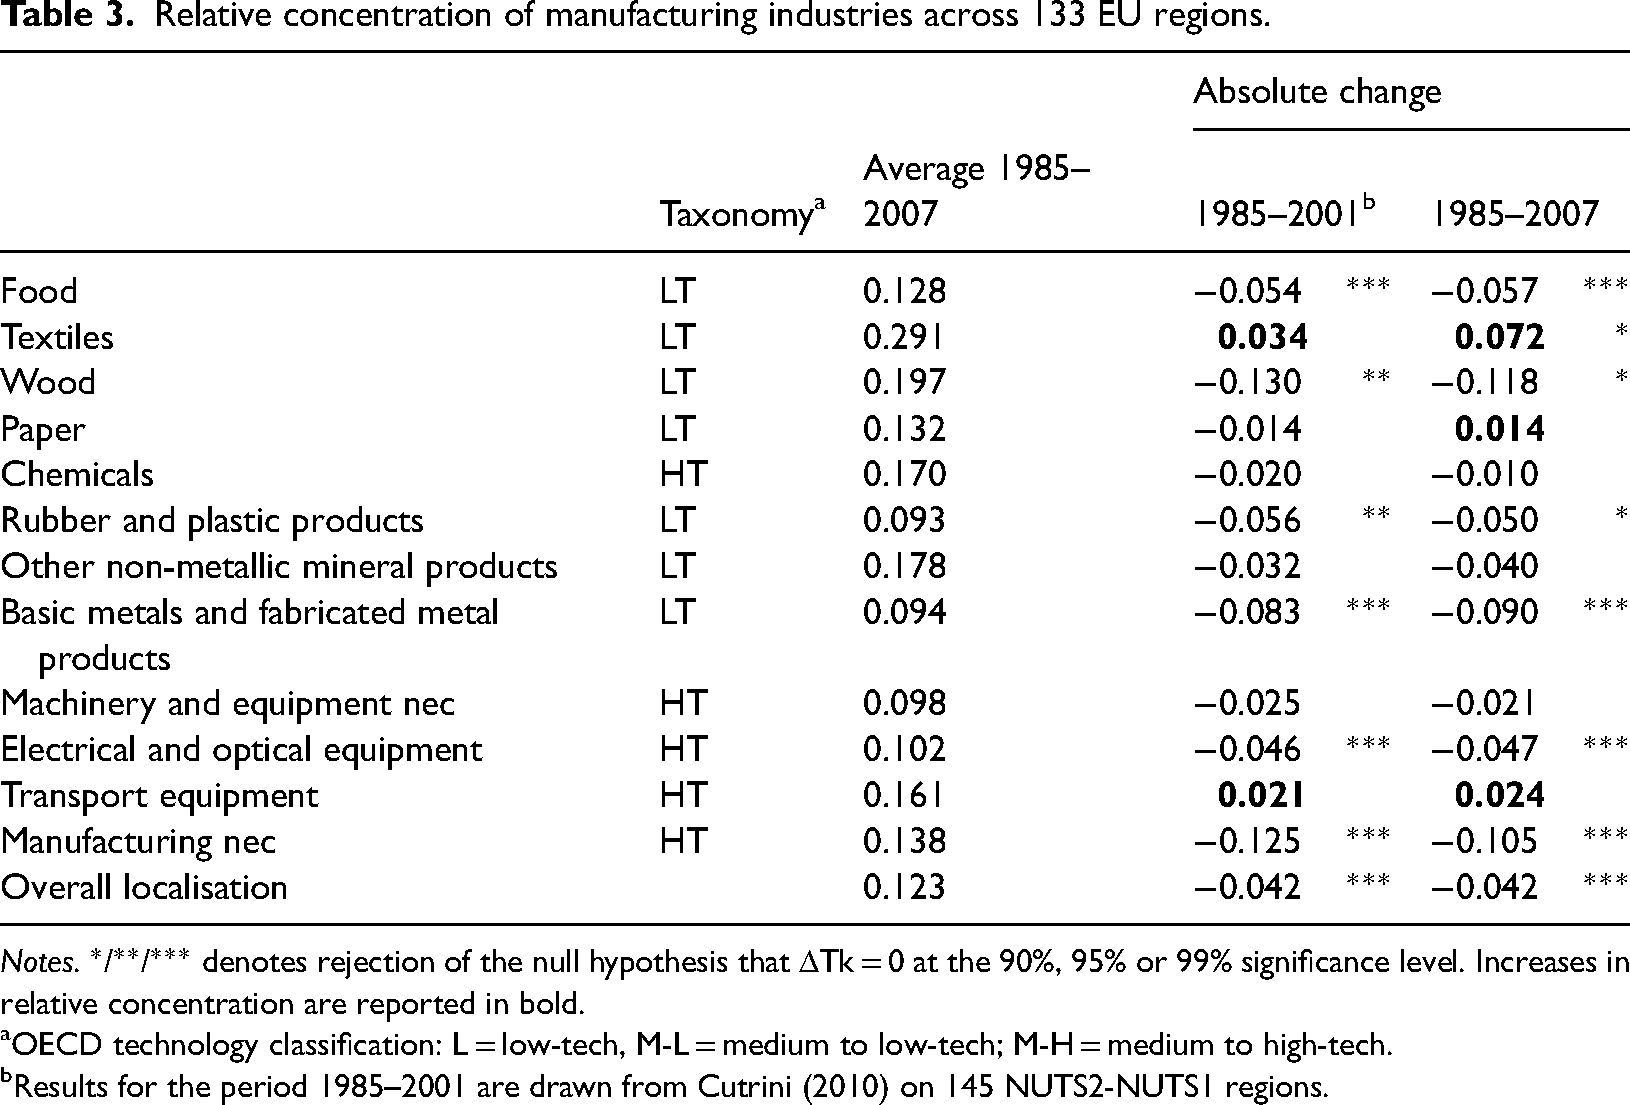
Notes. */**/*** denotes rejection of the null hypothesis that ΔTk = 0 at the 90%, 95% or 99% significance level. Increases in relative concentration are reported in bold.
aOECD technology classification: L = low-tech, M-L = medium to low-tech; M-H = medium to high-tech.
bResults for the period 1985–2001 are drawn from Cutrini (2010) on 145 NUTS2-NUTS1 regions.
The comparison of the results with the sample used in Cutrini (2010) lends further support to the general convergence in location patterns of manufacturing industries, also supported by decreasing levels of clustering of most of the sectors (Cutrini, 2009b). The observed differences in relative concentration measures and their significance level are reported in Table 1 while detailed results of the bootstrap tests for significance are provided in Table A2 (Results Appendix).
Changes over time are usually negative irrespective of the database used and they are also comparable in terms of significant level. There are two notable exceptions as having a tendency towards spatial concentration, textile and transport equipment. The industry producing paper and paper products also experienced increasing concentration.
Figure 4 provides an overview of the decomposition of entropy indices that has allowed a distinction between inner-country and cross-country localisation. For illustration, the dashed lines in Figure 4 represent the evolution of localisation within and between countries, respectively. These reference lines are weighted indices that allow identifying those sectors persistently above the average, such as textiles and transport equipment, in both components. Additional industries exhibit diverging location patterns relative to total manufacturing from 2001 onwards, namely chemicals, machinery and equipment and other no-metallic mineral products, but changes over time are significant only for the latter (Table A2).
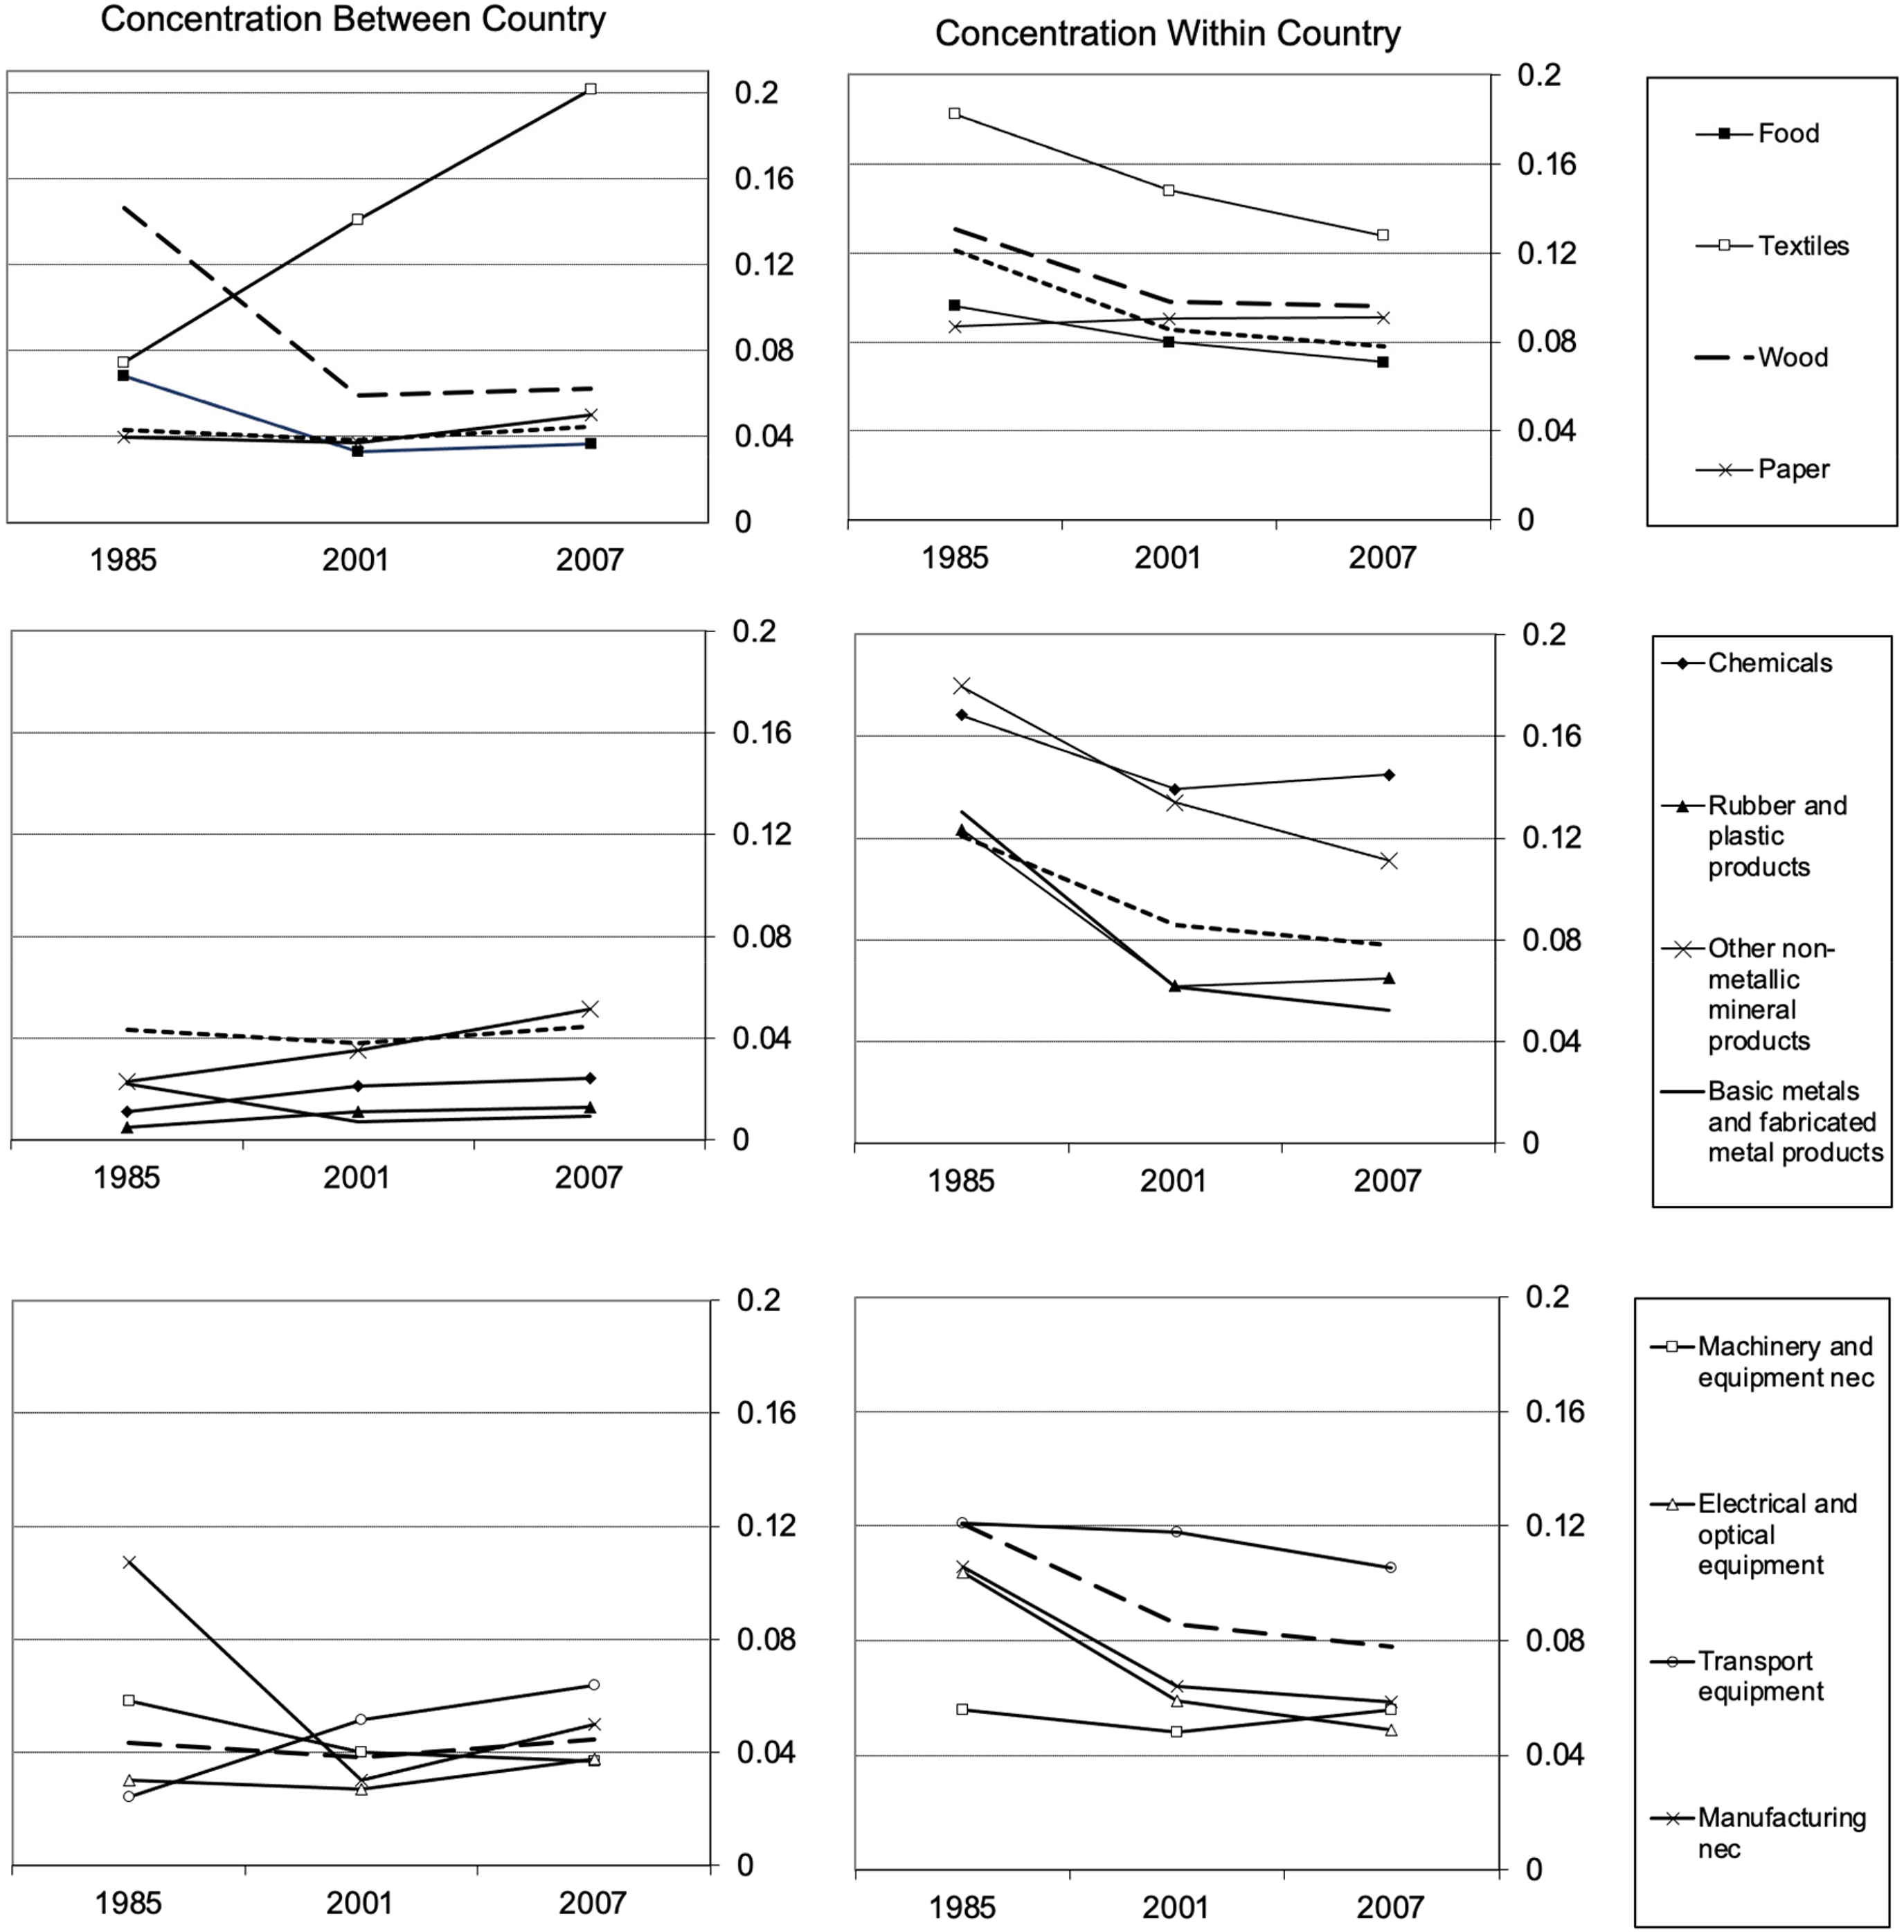
Evolution of the two components of relative concentration, 1985–2007. Notes. The dashed lines in the left panels of the graph refer to the between-country component of the localisation index. The dashed lines in the right panels of the graph refer to the within-country component of the localisation index.
If we turn to specialisation we also confirm the prevailing convergence of regional industrial structures, especially within countries, with the Greek internal geography being the only exception to the rule. The general convergence in countrys’ structures to the EU-15 average is also confirmed with more recently available data, with only Germany and Italy still arise as the countries becoming more specialised over time (Table 4).
Specialisation indices and components, absolute change, 1985–2001 and 1985–2007
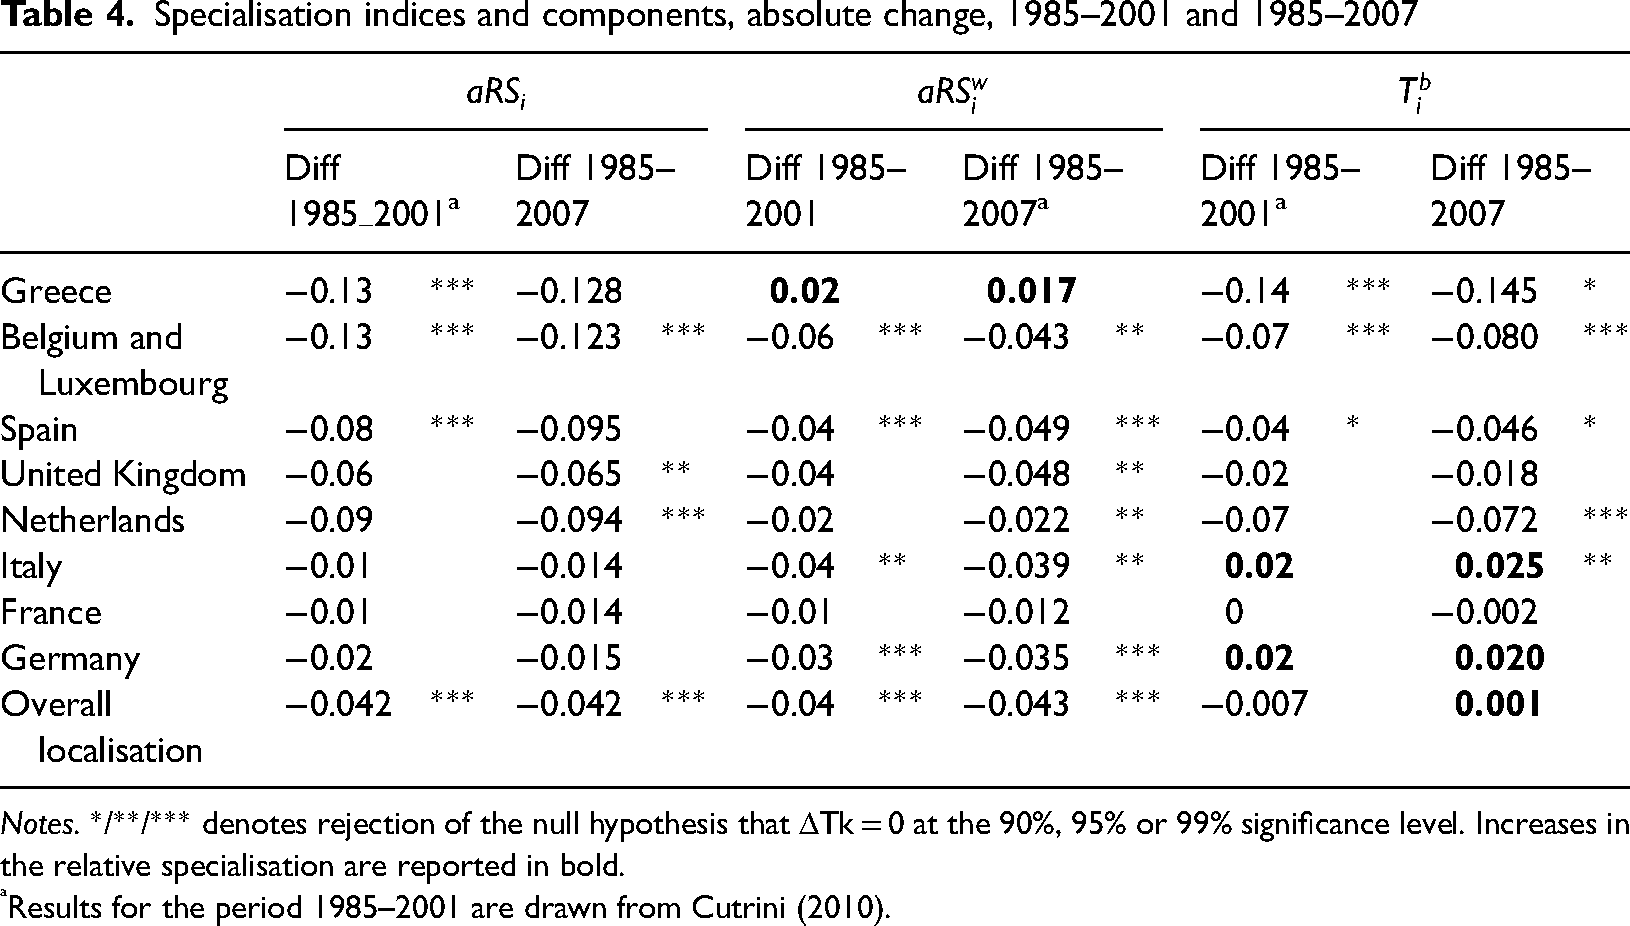
Notes. */**/*** denotes rejection of the null hypothesis that ΔTk = 0 at the 90%, 95% or 99% significance level. Increases in the relative specialisation are reported in bold.
Results for the period 1985–2001 are drawn from Cutrini (2010).
While the limitations of data have to be borne in mind, it does not appear to be the case that agglomeration forces have been sufficient to produce any significant increase in the geographical concentration of employment within industries, at least at the spatial scale for which analysis has been possible.
Discussion of results, possible explanations and some concluding remarks
The results of the relative concentration and specialisation before the Global Financial Crisis: another look section present some evidence to suggest that, as EU integration has progressed, dispersion and de-specialisation of the early stages have been followed by an increase in concentration and agglomeration, sometimes coupled by an increase in specialisation after 2000. Since 1985 and until the Global Financial Crisis, localisation and specialisation between countries increased to some extent but with a widespread fall in specialisation and concentration within countries. After 2000, the actual spatial distribution of economic activities in Europe appears to have changed towards a more complex economic geography, with some degree of concentration and agglomeration, but only sometimes coupled with regional and country specialisation.
From the systematic analysis presented above, it is possible to identify some major trends. First, extending the period of analysis to 2007 with a sample of consistent NUTS2 regions (NACE rev. 1.1 classification), it would be difficult to argue that increasing integration has led to increasing specialisation and concentration before the global financial crisis. Our results for the post-EMU period and post-Crisis years (2003–2019) point to a slight increase in the geographical concentration of industries and agglomeration among economic activities. Nevertheless, overall, our results still do not lend support to the line of argument put forward by Krugman (1993) for the European Union. In fact, after 2000 we observe mixed evidence in terms of the evolution of economic structures, with decreasing regional and country specialisation (Tables 2, A6 and A7).
It is likely that the historical shock associated with the Covid-19 pandemic, and the recession this caused, will also have an impact. Indeed, the dramatic changes in the global economy, in global trade patterns, and the reconfiguration of supply chains including their reshoring, caused by the pandemic all render the relationship between national and regional ‘openness’ and connectivity, on the one hand, and the locational dynamics of economic activity, on the other, much more complex than in the past. At the time of writing, the lockdowns in China are causing major blockages in supply chains, as is the war in Ukraine. In addition, future developments – such as the gathering pace of artificial intelligence and its impact on employment and production, the mounting pressure for shifting to a low-carbon or carbon-neutral economy, and the uncertainty of trade arrangements, and agreements between Europe and the United States and China – will all leave some imprint on the economic geography of the European Union.
Finally, what, then, are the potential implications of our empirical findings for regional policy? The overall trend towards less geographical concentration of economic activity and less regional sectoral specialisation within the EU countries studied here would seem to raise questions for those policy approaches that advocate regional specialisation and spatial agglomeration (both claimed to raise regional productivity). At the very least, it is possible that such policies may well be running counter to what are the long-run evolutionary trends underway in the economic geographies of these countries. To add to this ambiguity, Paul Krugman himself has more recently voiced some doubt as to whether the effects of increasing returns he and other spatial economists claimed for spatial agglomeration are as important as they once were: There’s good reason to believe that the world economy has, over time, actually become less characterized by the kinds of increasing returns effects emphasised by new trade theory and new economic geography. In the case of geography, in fact, the peak of increasing returns occurred long before the theorists arrived on the scene. (Krugman, 2009: 569)
Our analysis of the regions of the EU suggests that he is right.
Footnotes
Declaration of conflicting interests
The author(s) declared no potential conflicts of interest with respect to the research, authorship, and/or publication of this article.
Funding
The author(s) received no financial support for the research, authorship, and/or publication of this article.