
Abstract
Addressing housing deficits and inequalities remains a key challenge for cities in promoting more sustainable urban development. In response to these challenges, governments around the world, particularly in the Global South, have made substantial investments in housing policies for middle- and low-income individuals. Nevertheless, while these initiatives increase housing provision, they often face criticism for not adequately considering the location of new residences. This oversight has far-reaching effects on the accessibility to essential facilities, which play a pivotal role in determining spatial advantages and disadvantages, and consequently, in the degree of inclusion of individuals in both the city and society. Addressing this critical role of accessibility, this paper introduces a methodology for assessing the potential impact of housing policies on the lives of their beneficiaries, by quantifying changes in cumulative accessibility levels between individuals' former house locations and the location of the housing projects into which they moved. Accessibility is calculated for three distinct transport modes: walking, cycling, and public transport, using unimodal and multimodal urban network models. A case study was conducted in Natal, northeastern Brazil, on the implementation of the Minha Casa, Minha Vida (My House, My Life, MCMV) housing policy, initiated in 2009 and still active today. The results of the study revealed a significant decrease in accessibility across all transportation modes when individuals moved to the new housing estates. The decline was particularly pronounced among individuals with lower incomes, potentially raising their regular expenses after relocation and, ultimately, leading to spatial isolation and social exclusion. These findings demonstrate the contribution of the methodology to capturing the impacts of housing policies on the everyday accessibility of their beneficiaries, while emphasizing the importance of re-evaluating these policies with a particular focus on fostering the social and urban inclusion of beneficiaries.
Keywords
Introduction
The global housing deficit, particularly for middle- and low-income households, is a major challenge to achieving sustainable social and urban development in cities. Between the 1980s and the early 2000s, the issue of social housing, also referred to as affordable or public housing, took a back seat in the global discourse, in part due to a series of global economic crises (Angel, 2000; Rolnik, 2019). However, since then there has been a renewed focus and substantial investment in addressing this issue. This trend had been prominent in developing and emerging economies across the Global South, where ambitious housing subsidy policies, frequently reaching billions of dollars, were set in motion (Buckley et al., 2016).
While these subsidies have facilitated extensive housing production throughout the Global South, they have faced criticism for their one-dimensional focus, particularly for prioritizing quantitative aspects over qualitative ones (Malpezzi, 2014). The issue with the quantitative approach is that it often places a significant emphasis on the economic benefits for both government and private construction companies. Consequently, this economic focus comes at the cost of other critical considerations, such as the urban location of new housing units, frequently leading to their construction on the fringes of the city where large, low-priced plots are available (Chen et al., 2015; Dang et al., 2014; Libertun De Duren, 2018; Rolnik, 2019).
Building housing projects on the fringes of cities can result in additional location-related costs for housing policy beneficiaries, primarily because these peripheral areas are often recently developed and lack the same level of infrastructure, amenities, and population density as long-established city areas. Therefore, when residents move into new housing projects on the city's fringes, they may encounter reduced access to facilities essential for their daily lives. One of the primary problems is that when location costs increase, individuals are forced to allocate a larger portion of their resources. This burden can disproportionately affect the lower-income population (Herszenhut et al., 2022). Since this group heavily depends on their neighborhood, public services, and facilities to establish social connections and access economic opportunities, the increase in these costs can hinder their ability to engage in the social and economic life of the city (Kenyon, 2003; Lucas et al., 2016; Marques, 2019).
In this context, accessibility, defined as the extent to which land-use and transportation systems enable individuals to reach activities or destinations using one or a combination of transport modes (Geurs and Van Wee, 2004), should play a pivotal role in housing policies. Recognizing the significance of this issue, research studies investigating the accessibility of housing projects implemented under these policies have revealed that projects designed for lower-income individuals are frequently located in peripheral areas. These findings underscore the systemic contribution of social housing policies to the exacerbation of socio-spatial inequalities (Krause et al., 2023; Leite et al., 2022; Park and Choi, 2021; Radzimski, 2023; Zeng et al., 2019).
Nevertheless, despite the consistency of these studies, a notable gap remains in understanding the direct implications of these housing policies in the lives of their beneficiaries. The crucial questions of the present study revolve around whether these policies are effectively reducing location costs or potentially exacerbating them. Do the beneficiaries gain or lose accessibility when they move into housing projects funded by these policies? And are these gains or losses similar for all beneficiaries?
To address these questions, this paper introduces a novel methodology to assess changes in accessibility when individuals relocate in the city, applying it to investigate the impact of social housing policies on their beneficiaries. The methodology employs a comparative approach that evaluates differences in accessibility levels between the locations of housing units built under the purview of housing policies and the locations of the former residences of the policy beneficiaries. The comparison also includes changes in accessibility for different groups, based on their household income level.
Furthermore, the proposed methodology calculates cumulative accessibility metrics across three different scales, each associated with distinct modes of transport, encompassing walking, cycling, and public transport. These measurements of accessibility were obtained using both unimodal and multimodal urban network models developed to support the methodology, which integrate residential buildings data, land use information, individual transport networks (walking and cycling), and the public transport network.
The comparative uni- and multi-modal analysis presented here contributes insights into changes in accessibility and highlights the potential effects of social housing policies on the lives of their beneficiaries, as well as potential inequalities in those effects. Additionally, this methodology can serve as a tool to improve integrated urban, housing, and transport planning and to enhance decision-making regarding new policies.
The case study focuses on the social housing buildings financed by the Minha Casa, Minha Vida (My House, My Life, MCMV) social housing program in Natal, Brazil. The program is an integral component of a national housing policy initiated in 2009 and remains in operation to this day. It is estimated that it has delivered approximately 4 million housing units since its inception.
To present this study, the paper is structured as follows: literature review, methodology, results, discussion, and conclusion. The literature review provides insights into how this study fits within the context of existing research, specifically focusing on the analysis of the relationship between social housing and accessibility. Additionally, it offers an overview of the case study. The third section outlines the methodology, elucidating step-by-step the proposed methodology. Section four unveils the results, followed by a comprehensive discussion in section five. The final section presents conclusions of this study.
Literature review
This literature review has two parts: section 2.1. provides a global overview of the relationship between social housing policies and accessibility; section 2.2. offers insights into how the MCMV housing policy, the case study, addressed accessibility issues.
Social housing policies and accessibility
Designing and implementing effective social housing policies and their derived programs remains a complex undertaking. Given the multifaceted nature of housing and the long-term impact they can have on urban areas, housing policies must be intricately linked with other public infrastructure policies. Without this interconnected approach, a housing policy, even allocating high investments, can potentially yield detrimental effects on the lives of beneficiaries and the overall sustainability of the city (Angel, 2012; Buckley et al., 2016).
Hence, researchers have been actively engaged in advancing spatial analysis to improve decision-making across various domains, including resource allocation for urban planning and housing policy investments. These endeavors have gained significant impetus in past decades, driven by substantial changes in the spatial planning process and the methodologies employed. The rapid evolution of Information and Communication Technologies (ICT), encompassing artificial intelligence, geospatial technology, big data utilization, and the emergence of smart cities, changed spatial analysis (Geertman and Stillwell, 2020). In a context where digital technologies have emerged as tools to empower the community, researchers and practitioners seek to enhance scenario-based planning by enabling the analysis, monitoring, and simulation of intricate human systems, such as cities (Geertman and Stillwell, 2020; Miller and Goodchild, 2015).
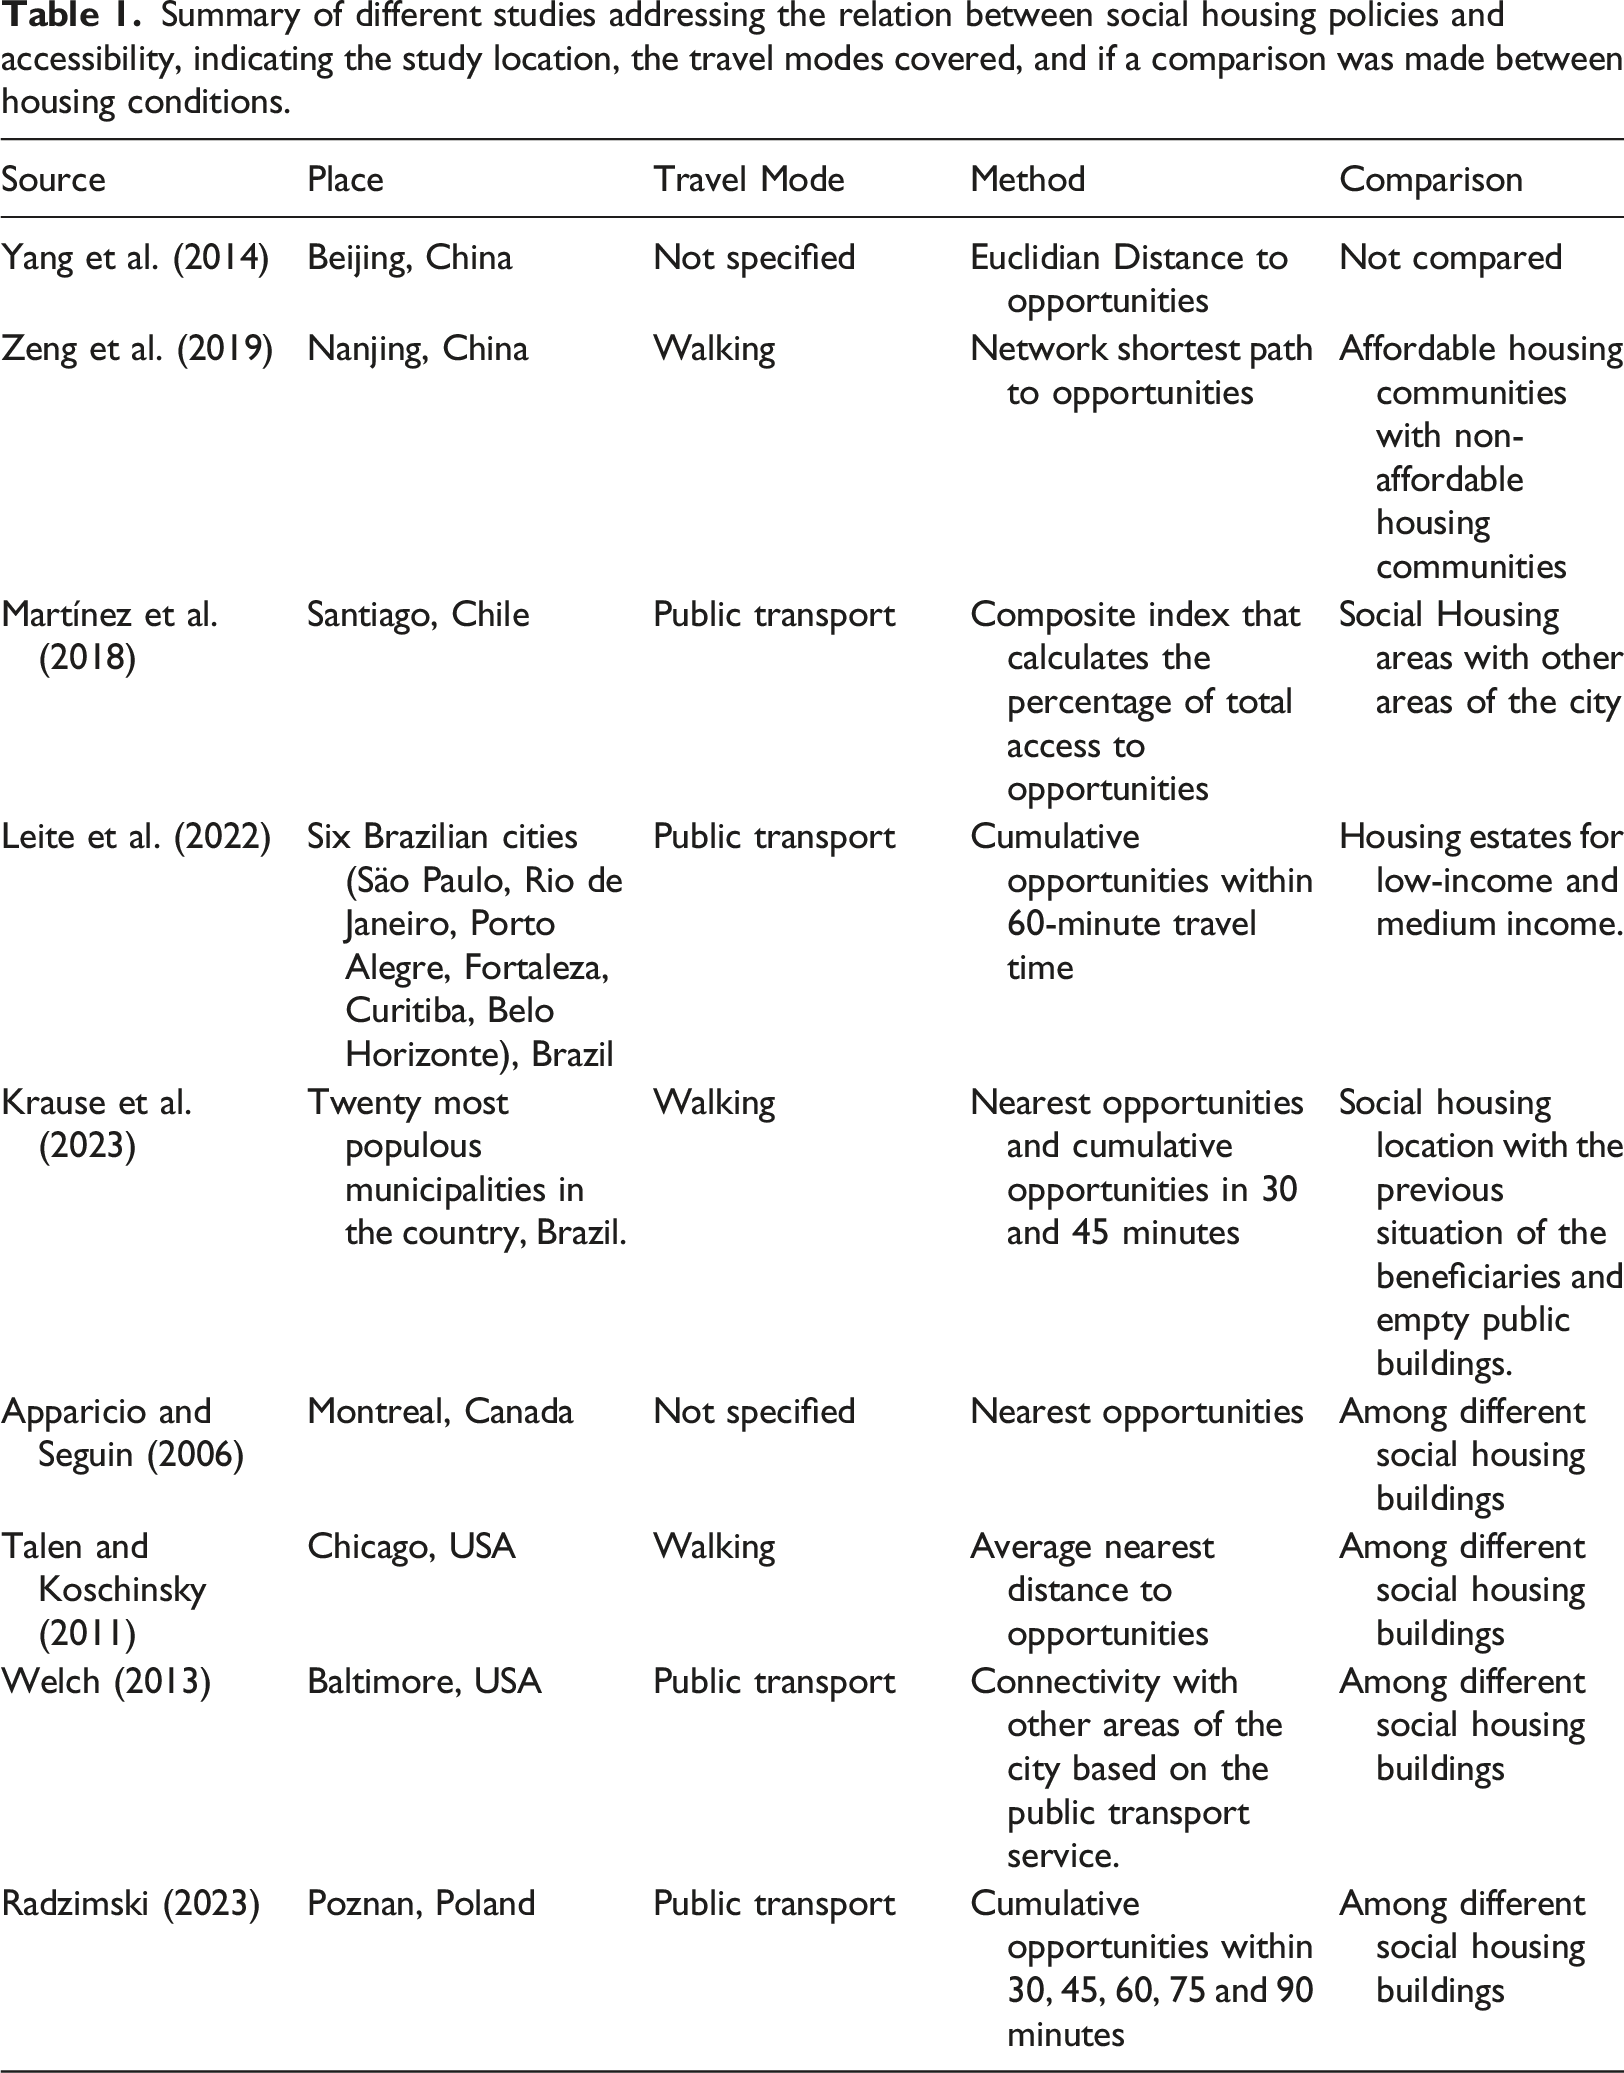
Summary of different studies addressing the relation between social housing policies and accessibility, indicating the study location, the travel modes covered, and if a comparison was made between housing conditions.
In this context, there is a growing emphasis on analyzing the interplay between social housing policies and accessibility (Krause et al., 2023; Leite et al., 2022; Yang et al., 2014; Zeng et al., 2019). This increased attention is supported by the array of dimensions in the concept of accessibility, ranging from the individual to spatial perspectives. By incorporating various components, including land use, transportation, temporal factors, and individual characteristics, these dimensions offer a critical perspective on how easily individuals can access urban facilities, taking into consideration their location, temporal restrictions, and/or individual constraints (Geurs and Van Wee, 2004; Horner, 2021; Smith and Barros, 2021; Wee and Geurs, 2011).
By quantifying the ease of access, it is possible to measure the extent to which the urban spatial structure meets individuals and vice versa (Horner, 2021). Accessibility, whether viewed from a spatial or individual perspective, provides valuable insights into the engagement of individuals in the city's social and economic life. This, in turn, enables the quantification of social inequalities and instances of social exclusion and segregation within the city (Geurs and Van Wee, 2004; Casas, 2007; Preston and Rajé, 2007; Lucas et al., 2016; Oviedo, 2021).
Both the place-based and individual-based perspectives have proven to be effective in comprehending citizens' participation in society (Fransen and Farber, 2019; Geurs and Van Wee, 2004; Horner, 2021; Kwan and Weber, 2003; Wee and Geurs, 2011). However, the place-based perspective, particularly due to its lower data requirements, has been more frequently employed to highlight social inequalities. Several studies substantiate the efficiency of this approach, stressing how the lack of accessibility can promote social disadvantages among vulnerable population (Bocarejo S. and Oviedo H., 2012; Bittencourt et al., 2021; Boisjoly et al., 2020; Pereira et al., 2019, 2022; Pereira et al., 2017; Slovic et al., 2019).
Regarding the relationship between social housing policies and accessibility, place-based measures have been effective in explaining how the resulting developments from these policies are connected to opportunities within the city. The overall findings show that social housing policies have either partially or totally failed in establishing an efficient connection between the buildings resulting from these policies and opportunities like workplaces, schools, hospitals, and other essential facilities. This pattern appears to be recurrent in various regions such as China (Yang et al., 2014; Zeng et al., 2019), Latin America (Krause et al., 2023; Leite et al., 2022, Martínez et al., 2018), North America (Apparicio and Seguin, 2006; Talen and Koschinsky, 2011; Welch, 2013), and Europe (Radzimski, 2023).
However, despite the significance of these analyses and the growing recognition that social housing policies worldwide could potentially exacerbate social inequalities, there are still some gaps in our understanding of how these policies impact the lives of those they aim to assist. Firstly, only a limited number of studies consider the prior urban living conditions of the beneficiaries. In other words, they don't explore whether these individuals would have had better or worse access to opportunities and social integration if they had remained in their previous residences. Secondly, very few studies simultaneously investigate various urban scales and modes of transportation, resulting in an incomplete understanding of the issue (see Table 1).
As shown in Table 1, among the listed works, only one study—conducted by Krause et al. (2023) compared the accessibility of social housing buildings with the previous residence location of the policy beneficiaries. However, their study solely focused on walking accessibility. Moreover, among the studies in Table 1, the most comprehensive analyses utilize General Transit Feed Specification (GTFS) data for conducting public transport accessibility assessments. Nevertheless, this type of data is rarely available for smaller and mid-sized cities in the Global South. Hence, there is a critical need to develop tools and methodologies that allow detailed and holistic accessibility analyses, encompassing various modes of transportation, in these regions (Benevenuto and Caulfield, 2019; Boisjoly et al., 2020). In the following sections, this paper will elucidate how these gaps are addressed in the present study.
MCMV and the location of new housing projects
Established in Brazil in 2009, the MCMV policy and program aimed to provide housing units for families with middle to low incomes, ranging from 0 to 10 minimum wages. Since its beginning, the program is estimated to have financed approximately 4 million housing units nationwide. However, despite its scale, the policy and the program has faced criticism due to the lack of a clear commitment to establishing better guidelines regarding the location of housing projects (Ferreira, 2012; Rolnik, 2019).
While the policy has made efforts to evolve over time, aiming to incorporate improvements in the placement of housing complexes within its framework, the tangible results of these initiatives are yet to be seen in the cityscape. A compilation of studies indicates that social housing complexes funded by the program throughout the country have frequently been erected on the fringes of cities, distanced from essential services and urban centers, situated in areas marked by low facility density and sparse population (Bentes Sobrinha et al., 2015; Pequeno et al., 2015; Nascimento et al., 2015; Cardoso et al., 2017; Leite et al., 2022; Krause et al., 2023; Lopes, 2022). This situation may have direct repercussions on the beneficiaries' access to opportunities and, consequently, their capacity to engage in the social and economic life of the city (Ferreira, 2012; Santo Amore et al., 2015).
Nonetheless, despite concerns about the location of housing projects, there is a lack of clarity regarding the impact of MCMV on its beneficiaries. It remains uncertain how individuals residing on the outskirts, far from city centers, have experienced changes in their accessibility to essential services. Have they encountered reduced accessibility, or was their situation regarding accessibility similar in their previous residences? Answering this question is essential for gaining a deeper understanding of whether public housing policies, designed to reduce housing deficits and support the population, are fulfilling their intended role or potentially exacerbating the deficit, along with issues of social and economic exclusion and segregation within cities.
Methodology
This section outlines the methodology used for conducting a comprehensive comparative analysis of unimodal and multimodal accessibility to essential daily services. The analysis comprises two key levels of comparison. Initially, it juxtaposes the former residences of MCMV beneficiaries with the houses provided by the program as their new homes. Furthermore, this comparative analysis extends to elucidate the geographic distribution of housing estates for the distinct income groups benefiting from the program. To present this methodology, this section is divided into four parts, following the methodological steps. The first part delves into the intricacies of data extraction, the second part provides an overview of the construction process for unimodal and multimodal urban network models, the third part furnishes details regarding the measurement of accessibility, and the fourth part highlights the analytical procedures involved (Figure 1). Methodology developed for the comparative study of multimodal accessibility of residents of new social housing developments.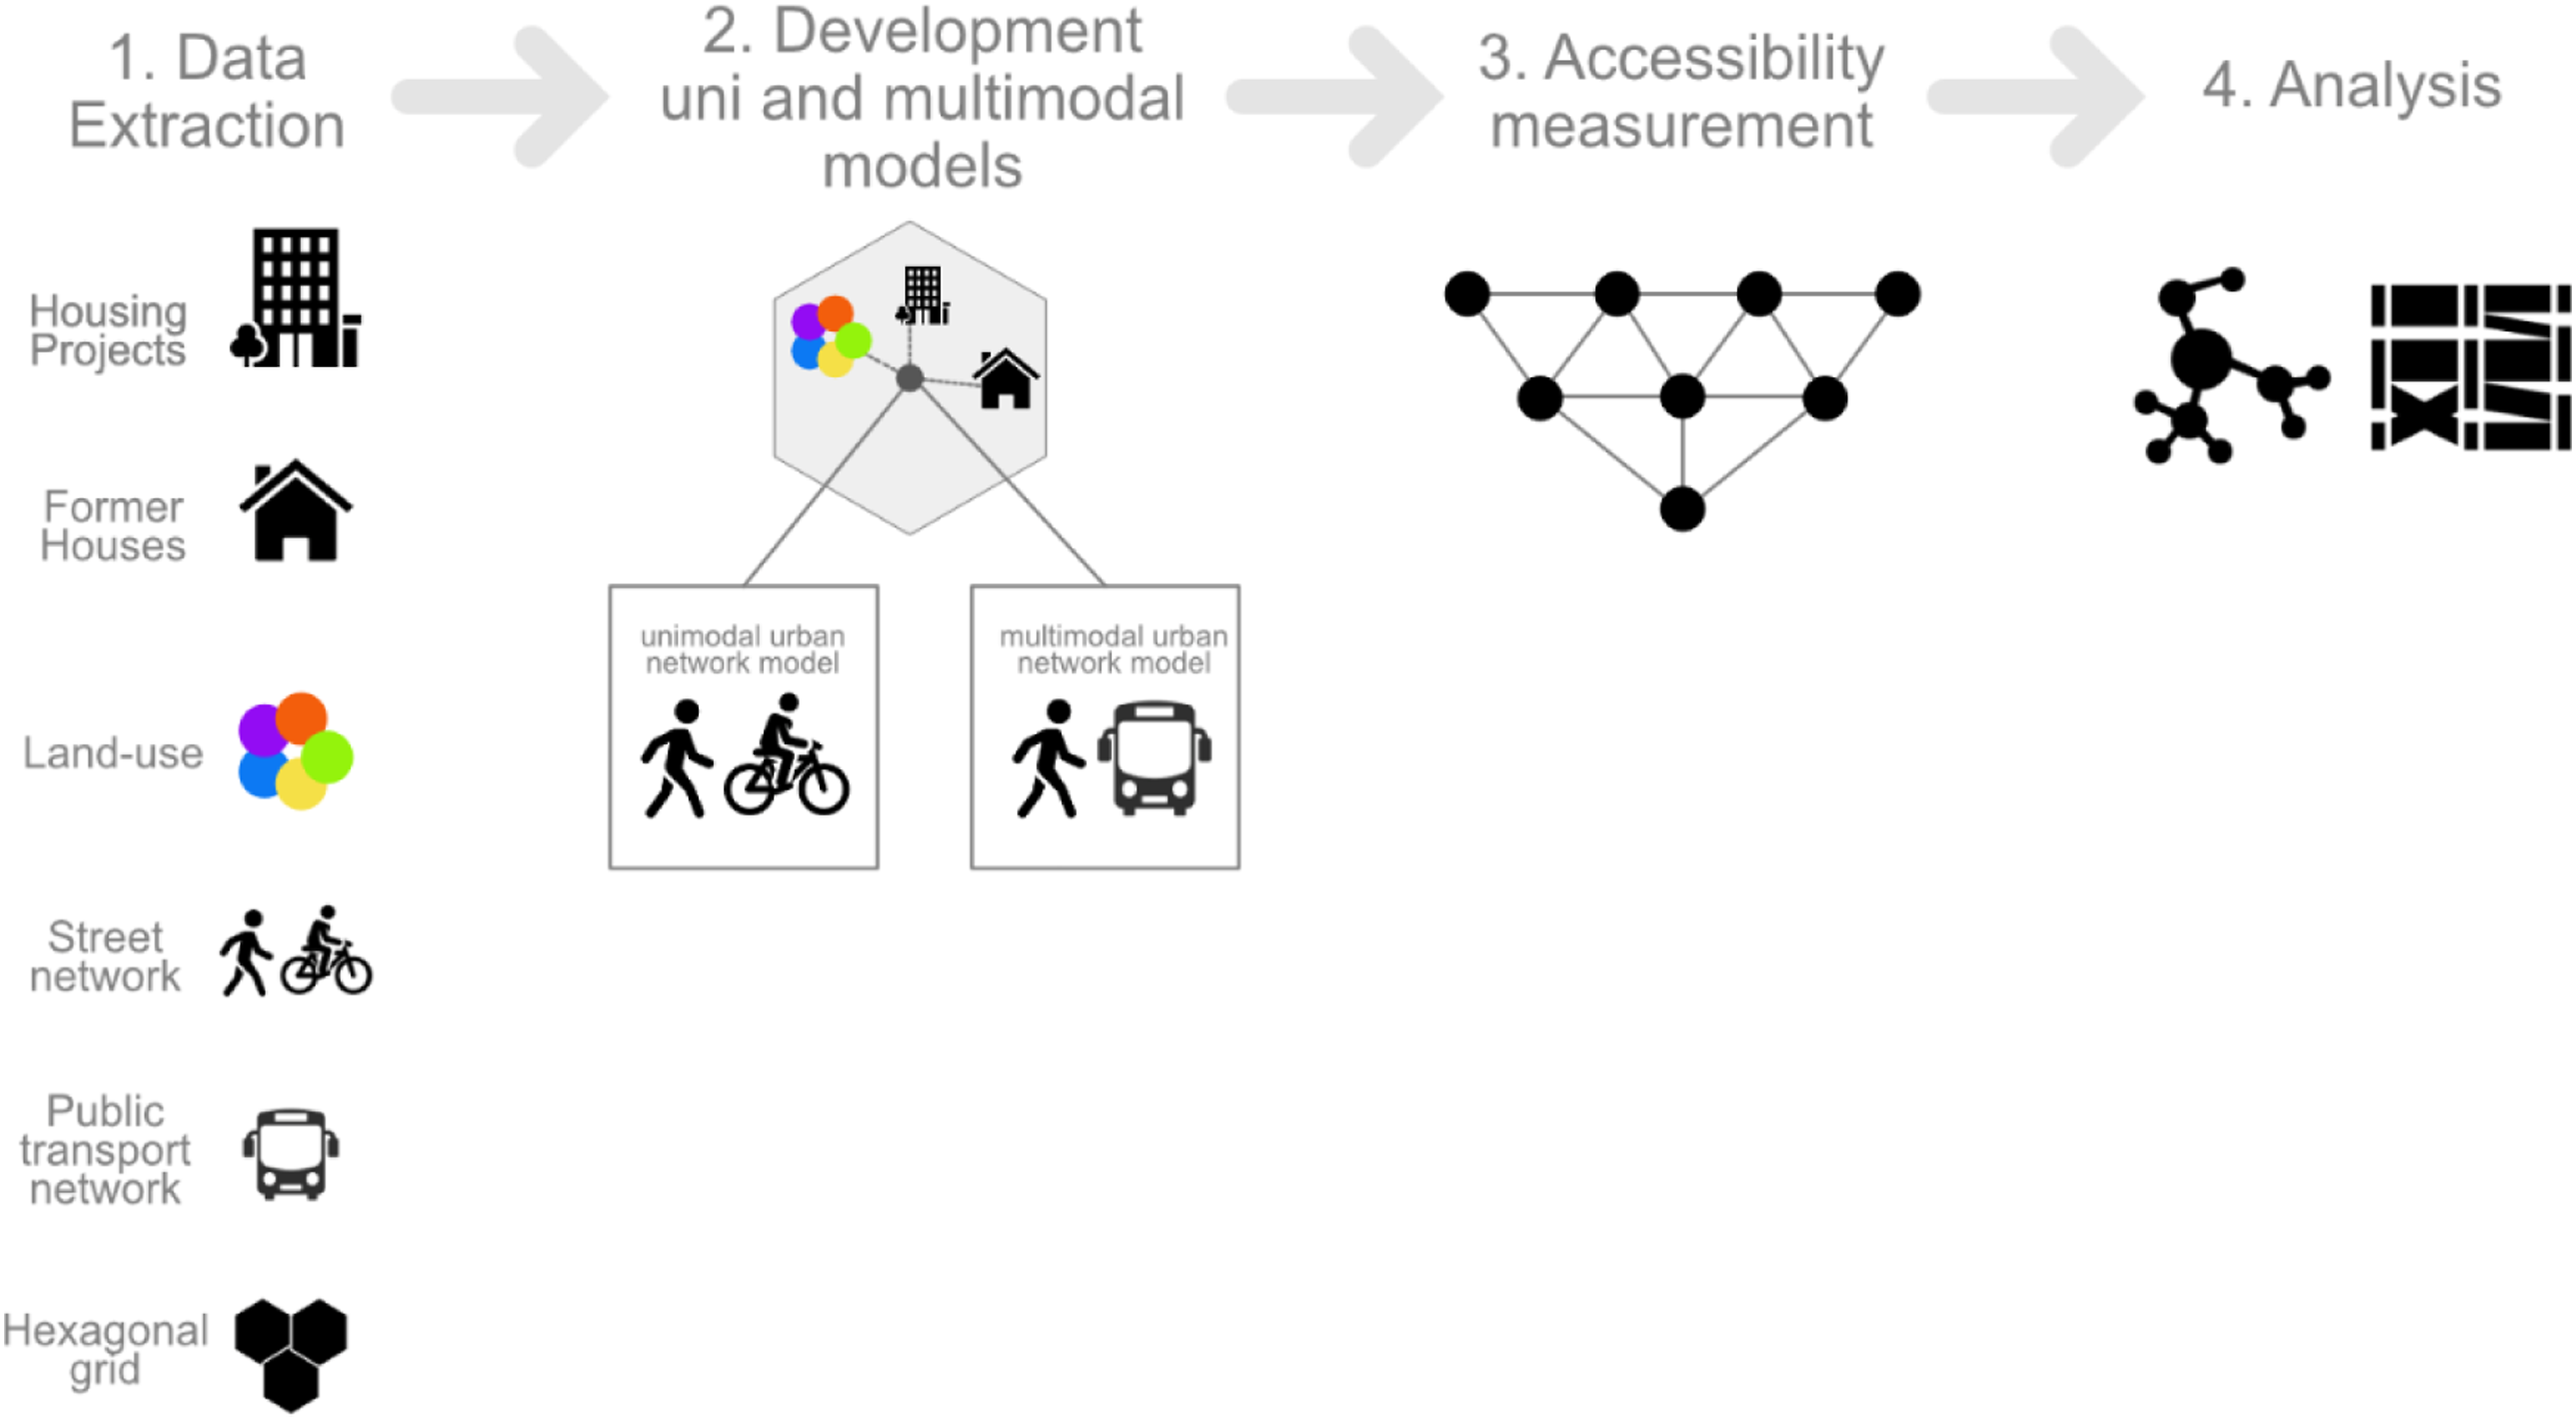
Data extraction
To measure uni- and multi-modal accessibility, the models were developed by integrating various datasets, including the locations of MCMV housing projects, the addresses of former beneficiaries’ residences, land-use information related to facilities, a hexagonal grid utilized to aggregate land use and housing data, and data concerning both private and public urban transport networks (Figures 1 and 2). The following sections explain how the data extraction process worked for each one. Diagrams illustrating the schema of the connections between the hexagons, the street network, and the public transportation network system in both the unimodal and multimodal urban network models.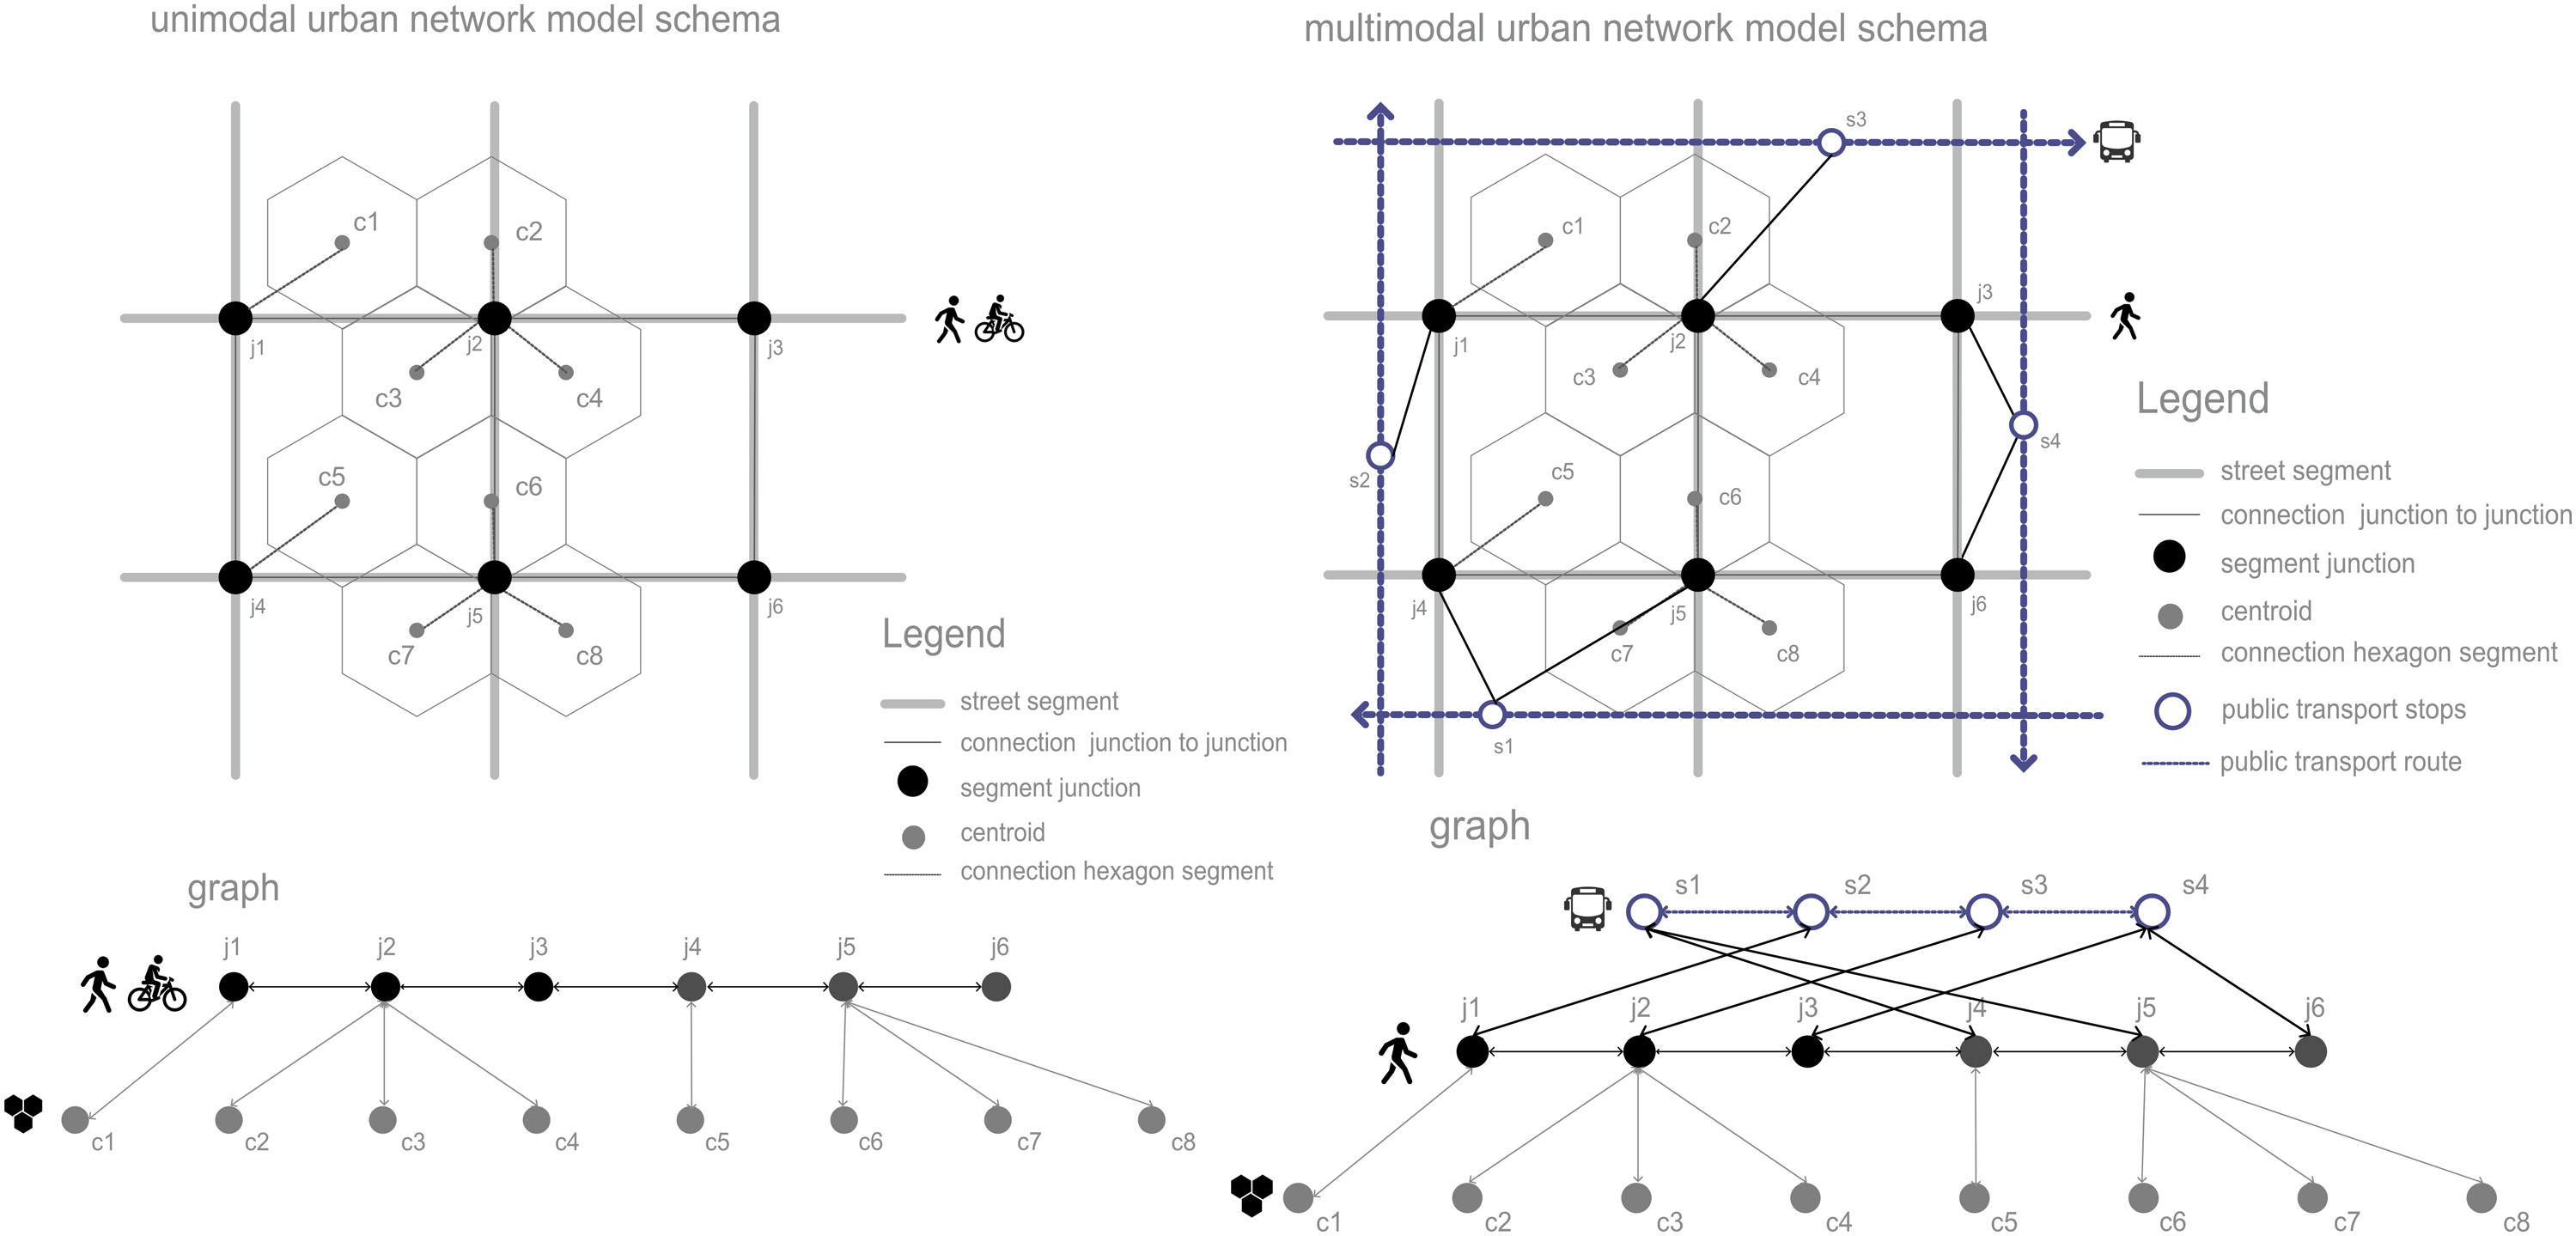
Data extraction: Social housing projects and former residences
The study analyzed MCMV housing projects constructed between 2009 and 2017, categorized by income levels: level-01 (0–3 minimum wages), level-02 (3–6 minimum wages), and level-03 (6–10 minimum wages). Data on level-01 housing projects were available for 100% of cases, while that for level-02 and level-03 projects were limited (34.6% and 23.9%) due to private funding, making the data inaccessible.
Given the substantial volume of data pertaining to the residents' previous homes, an initial data sampling was performed using the Yamane (1967) formula, n = N/(1 + Ne2), where n represents the sample size, N is the population size, and e signifies the margin of error. Using this calculated sample size, apartment numbers in the MCMV housing complexes were randomly selected through a Python-based lottery, facilitated by the NumPy library (version 1.23.1). Following the selection process, information regarding residents' previous homes was obtained from public records for level-01 beneficiaries and from the notary's office database for level-02 and level-03 beneficiaries. However, data collection for level-02 was limited to 47.05%, and no data was accessible for level-03, primarily due to a recent regulation mandating paid access to specific information in the local notary's office.
Data extraction: Land-use
Five categories of land use were considered: educational, healthcare, retail, recreational, and administrative services. The educational category encompasses different levels of public schools, from kindergarten to universities. The data were extracted from information in the educational census data provided by the National Institute of Educational Research Anísio Teixeira (INEP), available on the Brazilian Ministry of Education website.
The healthcare facilities data were extracted from the National Register of Healthcare Places (CNES) via the Brazilian Ministry of Health website. The extracted data includes information about the location of public healthcare facilities, ranging from those considered to provide low-complexity services to those offering higher-complexity healthcare.
The retail uses, the administrative services, as well as the leisure places, were extracted through a combination of sources. Part of the location of these facilities were extracted from the municipality database (not available online), the information was complemented by the Google Earth/Maps database using the Google Earth software. Facilities such as mini- and super-markets, convenience stores, bakeries, fish markets, butcheries, and drugstores were considered as retail. Post offices, municipal departments, police offices, and banks were considered as administrative services. Parks, squares, beaches, and shopping centers were considered leisure places.
Data extraction: Street and public transport network
The private transport network utilized in this study was based on a street network database created by the MUsA (Morphology and Uses of Architecture) research group (not available online). The public transport network was established using timetable data provided by the local department of transit (STTU). This data contained the different routes, the stops with name and geographic coordinates, and the hourly frequency of the services departing on those routes.
Data extraction: Hexagonal grid
Hexagonal units were obtained from Uber’s H3 geospatial index system. Resolution 8 was used in this study, featuring hexagons measuring 0.74 km2, roughly equivalent to the size of an urban block. Hexagon centroids served as both origins and destinations in the model.
Development of uni- and multimodal urban network models
Two distinct urban network models, one unimodal and the other multimodal, were developed to measure accessibility originating from the former and new residences of beneficiaries of the MCMV housing program.
The unimodal urban network model was developed to allow accessibility analysis for walking and cycling. To construct this model, data on land use, former residences, and new housing projects were aggregated on the centroids of the hexagonal grid. These centroids were then linked to the private transportation network system, that is, the street network (see Figure 2).
The construction of the multimodal urban network model, designed to measure cumulative accessibility using public transport, followed a similar approach. However, instead of connecting the centroids of the hexagonal grid solely to the street network, they were linked to a network that encompassed both private (street network) and public (buses, trains, etc.) transportation systems, as depicted in Figure 2. The public transportation network was established based on public transportation timetables, considering the connections between stops and potential transfers between services.
Both uni- and multi-modal networks were built using a combination of QGIS processing tools and Pandas (version 1.4.3), a Python library.
Accessibility measurement
Cumulative accessibility was measured across three different scales, each corresponding to a mode of transport and varying travel times. The first scale focused on cumulative accessibility within a 10-minute walking distance, the second scale considered a 10-minute cycling distance, and the third scale encompassed a 24-minute journey involving walking and public transport (i.e., buses and trains). These reference travel times were derived from the average daily travel behavior of citizens in medium-sized Brazilian cities, as reported by the National Association of Public Transport (ANTP, 2020) (see Figure 3). Schema illustrating cumulative accessibility calculations.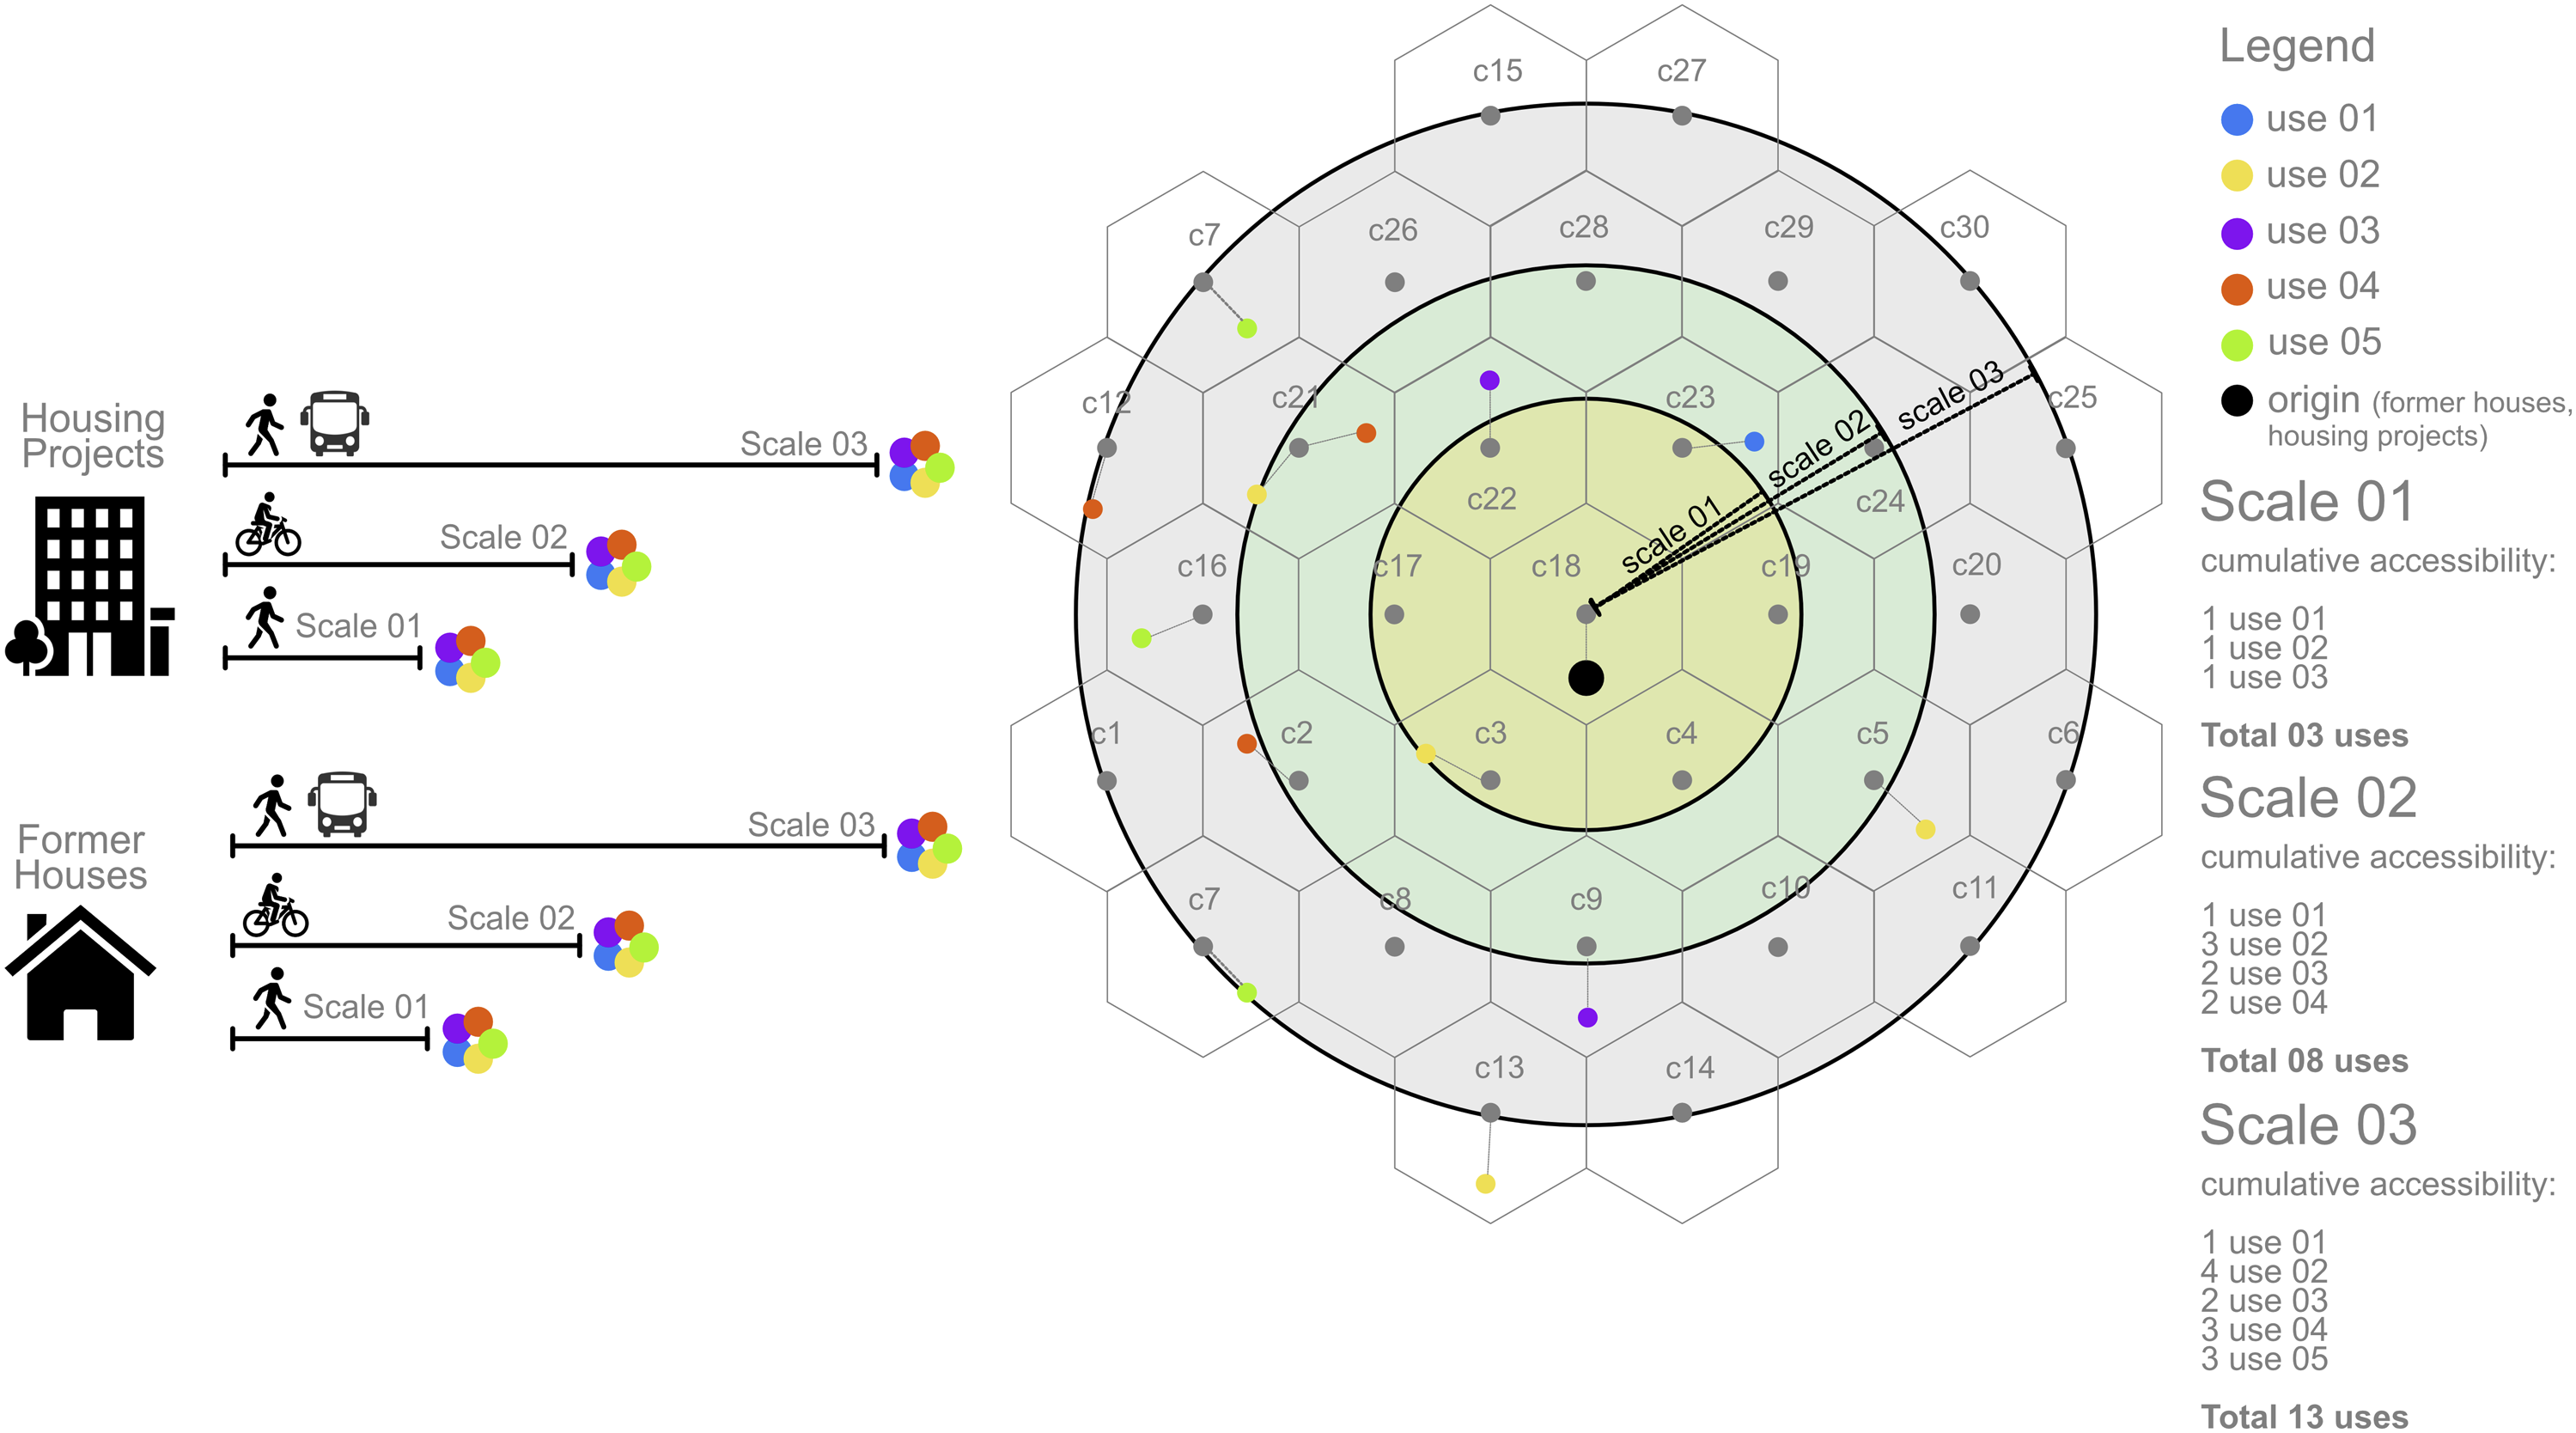
The uni- and multi-modal network models were converted into graphs, and the Dijkstra algorithm was employed to compute the shortest path distances between vertices in the graph. The algorithm was applied through NetworkX (version 2.8.5), a python library specialized in network analysis.
The impedance of each edge was defined as the travel time between vertices, calculated by dividing the edge’s length by the speed of the chosen transport mode (T = D/S). The definition of walking and cycling speeds was based on information from the ANTP report, with a speed of 1.2 m/s for pedestrians and 3.3 m/s for cyclists. The speed of public transportation was derived from data provided by the local department of transit and varied according to the type and route of the service.
After calculating the travel times matrix between all origin and destination vertices (hexagon centroids) for each scale, it was possible to identify the destinations reached from each origin, including the different facilities, since this information was aggregated at the hexagon centroids (Figure 3).
Comparative analysis
To facilitate the understanding of accessibility changes across the different scales of analysis, the accessibility results were categorized into quartiles. Quartile 0 represents the lower range of accessibility, while Quartile 3 identifies the higher range. The accessibility results are visualized using thematic maps of the hexagonal grids. Finally, results about the accessibility changes from former to new residences, were visualized using Sankey diagrams representing the gains and losses in accessibility (quartile change), for the level-01 and level-02 income groups of the MCMV program. The maps were created using the QGIS interface, while the Sankey diagrams were generated using Plotly, a Python library specializing in data visualization (version 5.18.0).
Results
The results are presented in the following sections, organized by the scale of analysis. Section 4.1 presents results related to cumulative accessibility for walking journeys, section 4.2 pertains to cycling, and section 4.3 focuses on multimodal accessibility.
Scale 01—walking accessibility
In the analysis of scale 01, which considers cumulative accessibility within a 10-minute walk, the results demonstrate a significant difference in accessibility between the MCMV housing projects of different income levels. Specifically, the results indicate that housing projects of level-01 consistently have less cumulative accessibility than those of levels-02 and level-03. Moreover, when compared to the average throughout the city, only part of those in level-03 are in locations with higher accessibility, meaning that in most cases the access to essential facilities was higher in their previous residences (Figure 4). Cumulative accessibility results—Scale 01—walking.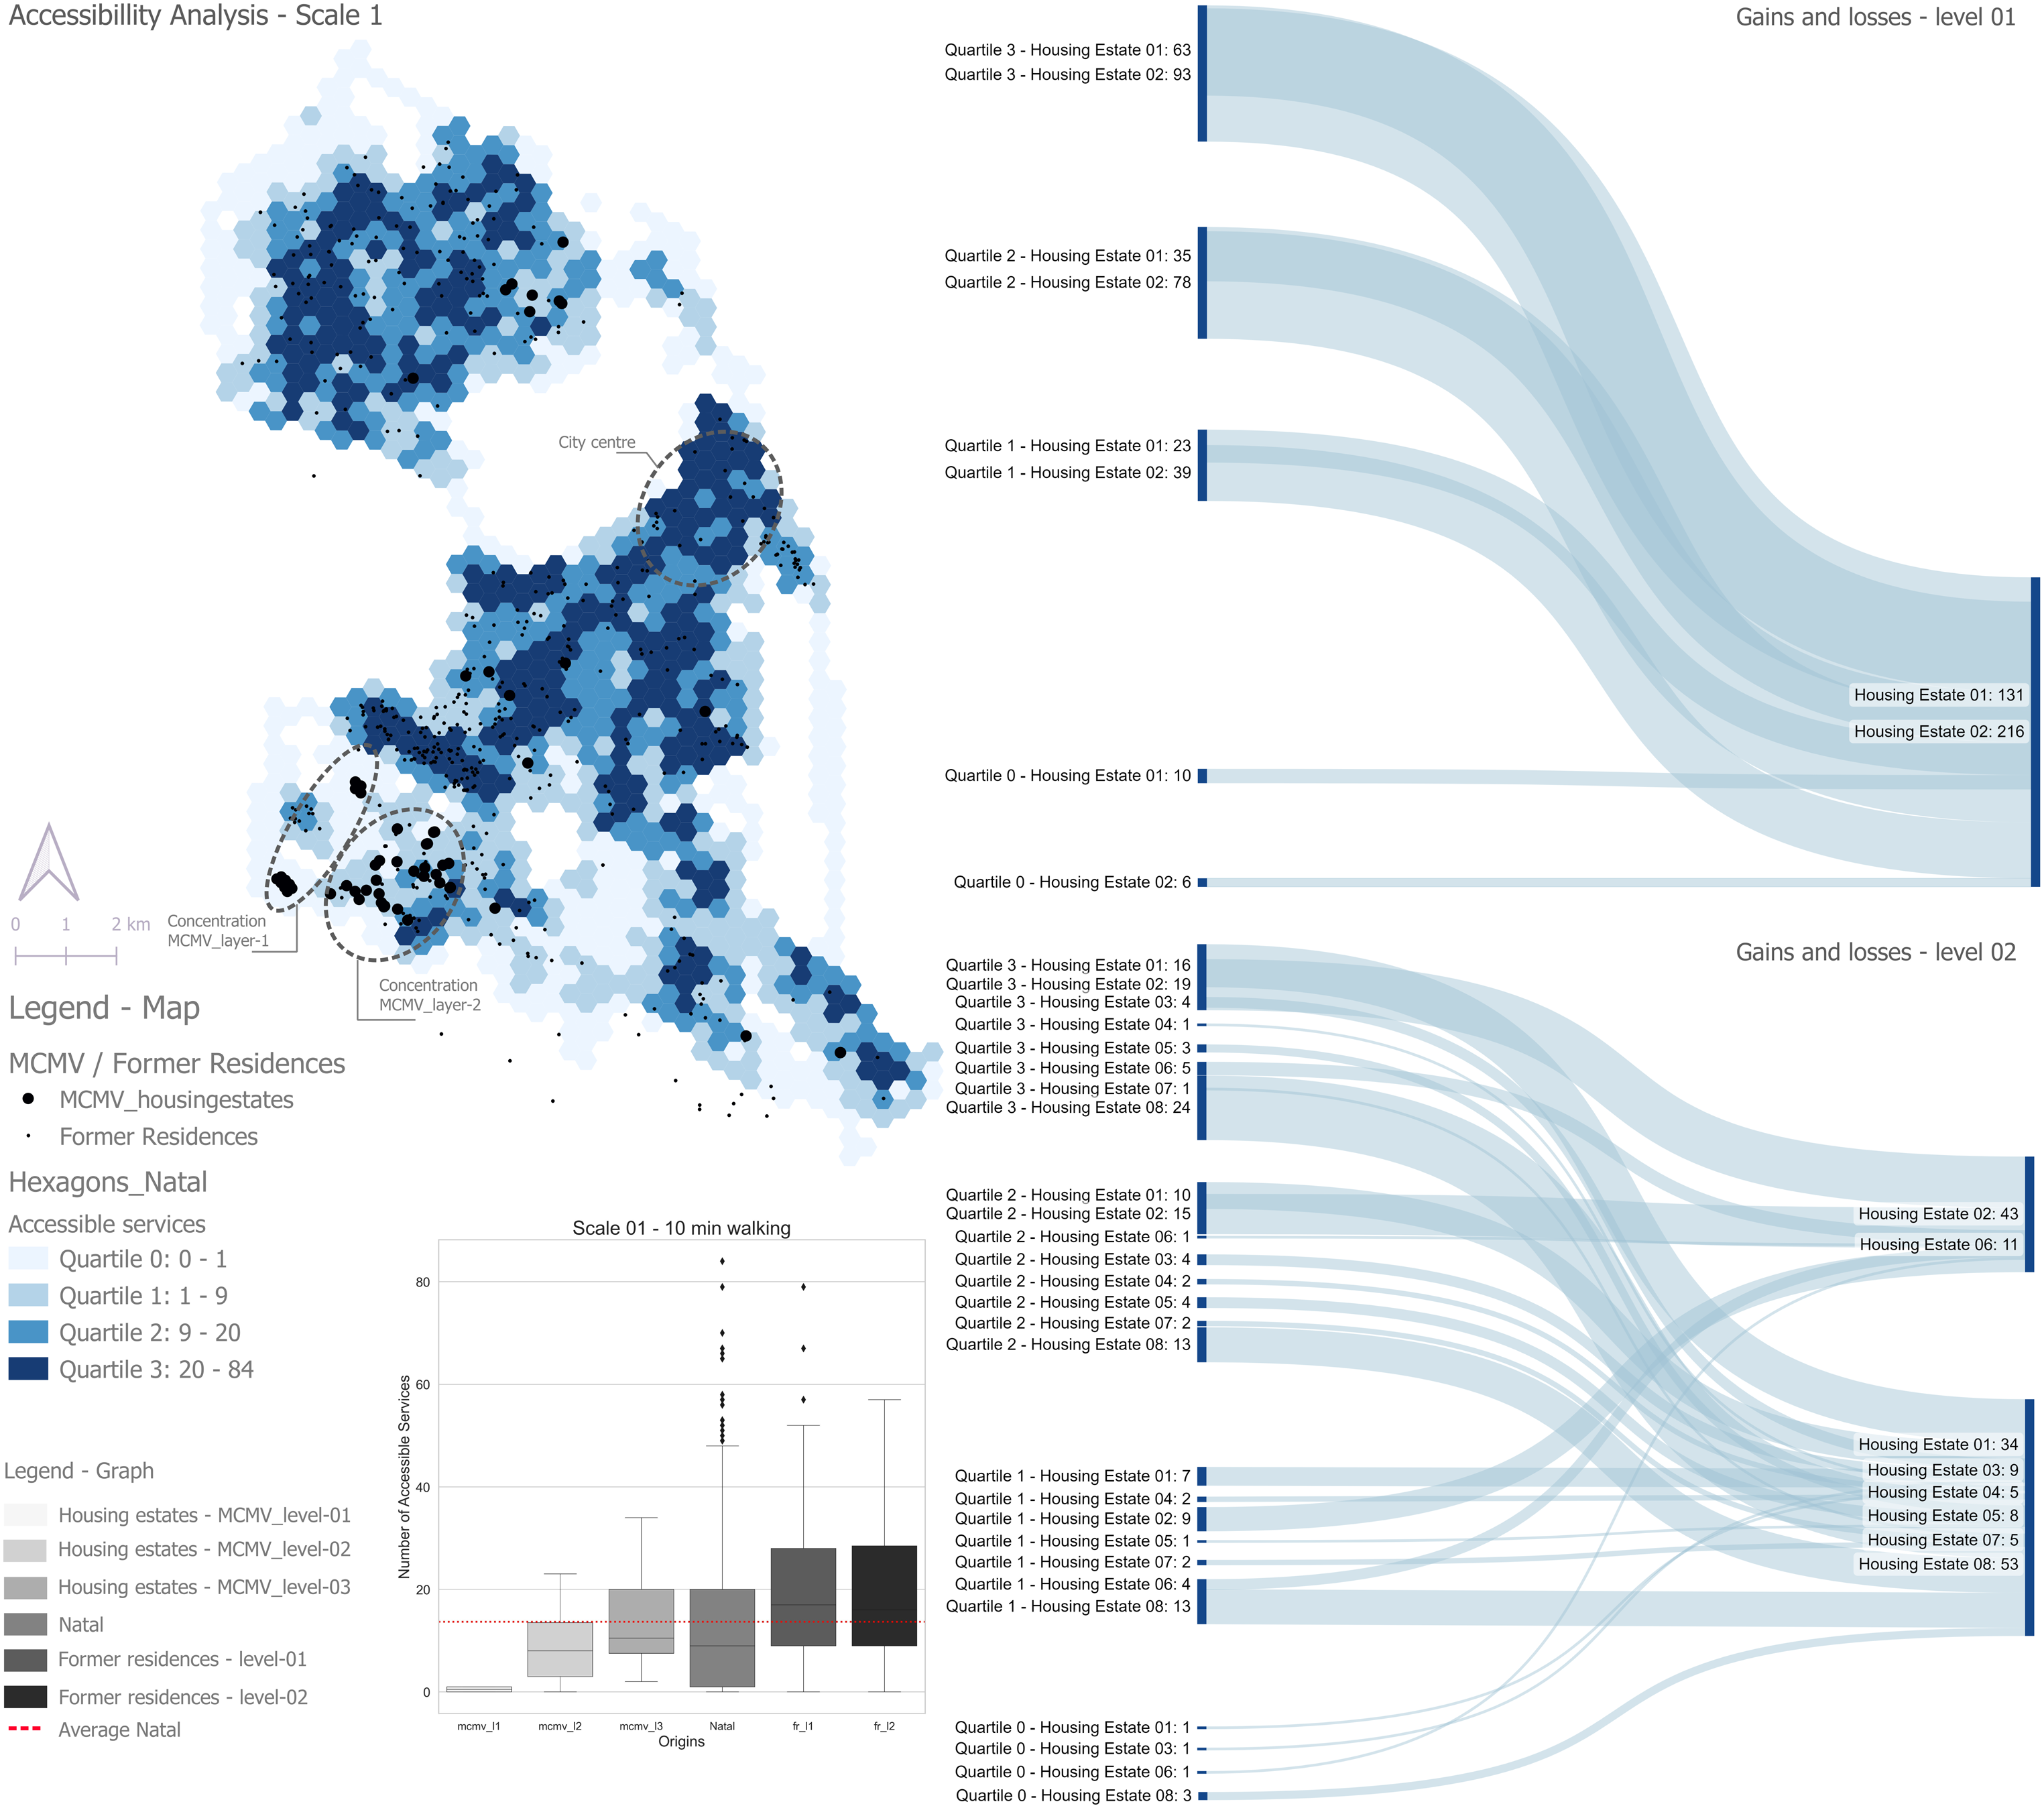
Thus, when comparing the accessibility of previous residences to those of MCMV housing estates, the results show that beneficiaries of level-01, upon moving to the housing estates, experienced a decrease in accessibility to essential services (Figure 4). As shown in the Sankey diagram, a mere 4.6% of level-01 beneficiaries were able to maintain accessibility, while the majority of 95.4% lost accessibility at this scale by moving to the housing projects. According to the analysis, 18.70% of beneficiaries lost accessibility from quartile 1 to quartile 0, while 34.15% lost accessibility from quartile 2 to quartile 0. Additionally, 47.15% experienced major losses in accessibility from quartile 3 to quartile 0.
Beneficiaries of level-02, on the other hand, experienced mixed results, with some experiencing a decrease or maintaining the same level of accessibility as their former residence, while a small group gained accessibility by moving to the housing projects (Figure 4). In level-02, 11.30% of beneficiaries gained accessibility by moving to housing projects, while 24.40% maintained their accessibility and 64.30% experienced losses. Of those who lost accessibility, 32.40% lost accessibility when moving from quartile 2 to quartile 1, 22.20% lost accessibility when moving from quartile 3 to quartile 2, and 45.40% experienced major loss when moving from quartile 3 to quartile 1.
Scale 02—cycling accessibility
The results of scale 02 reveal that the eastern and southern axes of the city have experienced a consolidation in essential services, resulting in higher accessibility in this area. Although some MCMV housing projects are located within this axis, most of them are situated in the southwest of the city. The accessibility of these developments continues to differ at this scale, meaning that those at level-02 and level-03 have higher accessibility than those at level-01 (Figure 5). Cumulative accessibility results—Scale 02—cycling.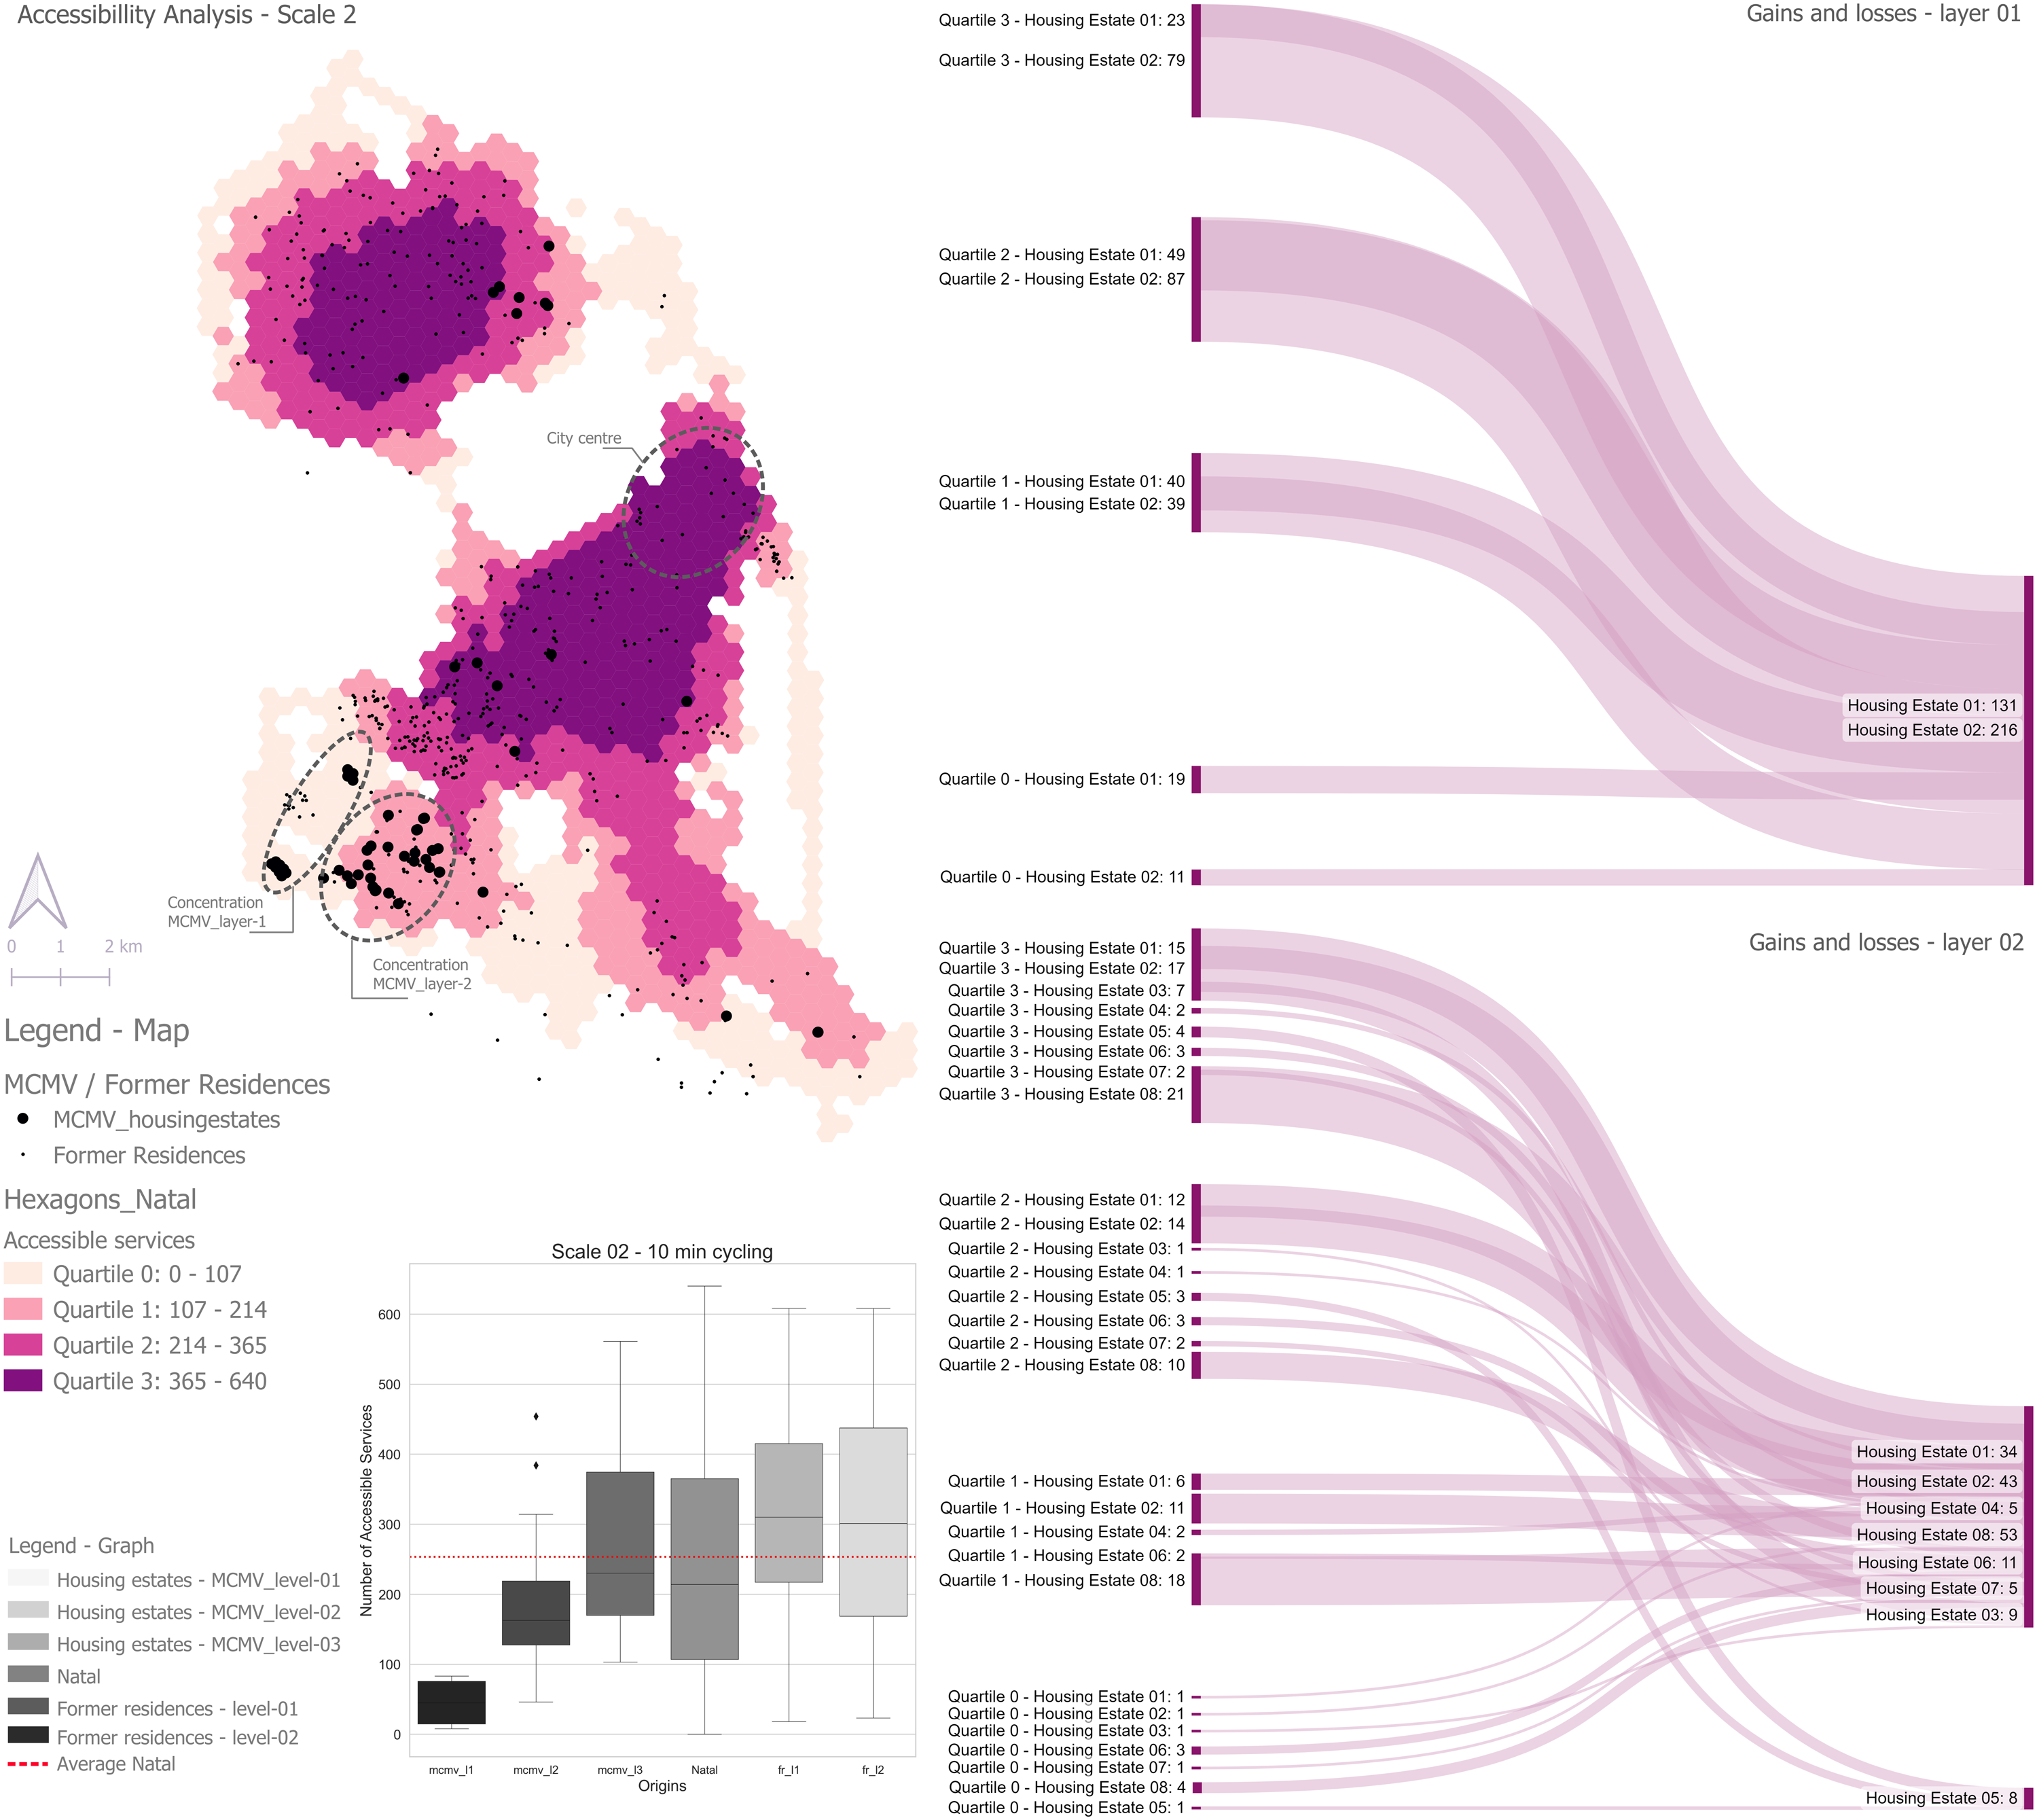
Regarding the comparison of accessibility between former residences and the housing developments, the findings of this scale are consistent with those of the previous scale. In level-01 developments, only 8.65% of beneficiaries maintained their level of accessibility while 91.35% lost accessibility. The Sankey diagram in Figure 5 shows that among beneficiaries who experienced loss of accessibility in level-01, 24.90% lost accessibility when moving from quartile 1 to quartile 0, while 42.90% experienced loss when moving from quartile 2 to quartile 1. Moreover, 32.20% experienced major loss when moving from quartile 3 to quartile 0.
In level-02 developments, 23.8% of beneficiaries maintained their accessibility, 6.55% gained accessibility, and 69.65% experienced a decrease in accessibility. In detail, 36.75% lost accessibility when moving from quartile 2 to quartile 1, 2.55% experienced loss when moving from quartile 2 to quartile 0, while 57.30% experienced loss when moving from quartile 3 to quartile 1. Finally, 3.40% experienced major loss when moving from quartile 3 to quartile 0.
Scale 03—public transport accessibility
The results of this scale repeat the findings from previous scales concerning the concentration and differentiation of location by income level. However, for the first time, there is a slight improvement in accessibility for the housing estates in level-01, as some of them move up from quartile 0 to quartile 1 (Figure 6). Cumulative accessibility—Scale 03—public transport.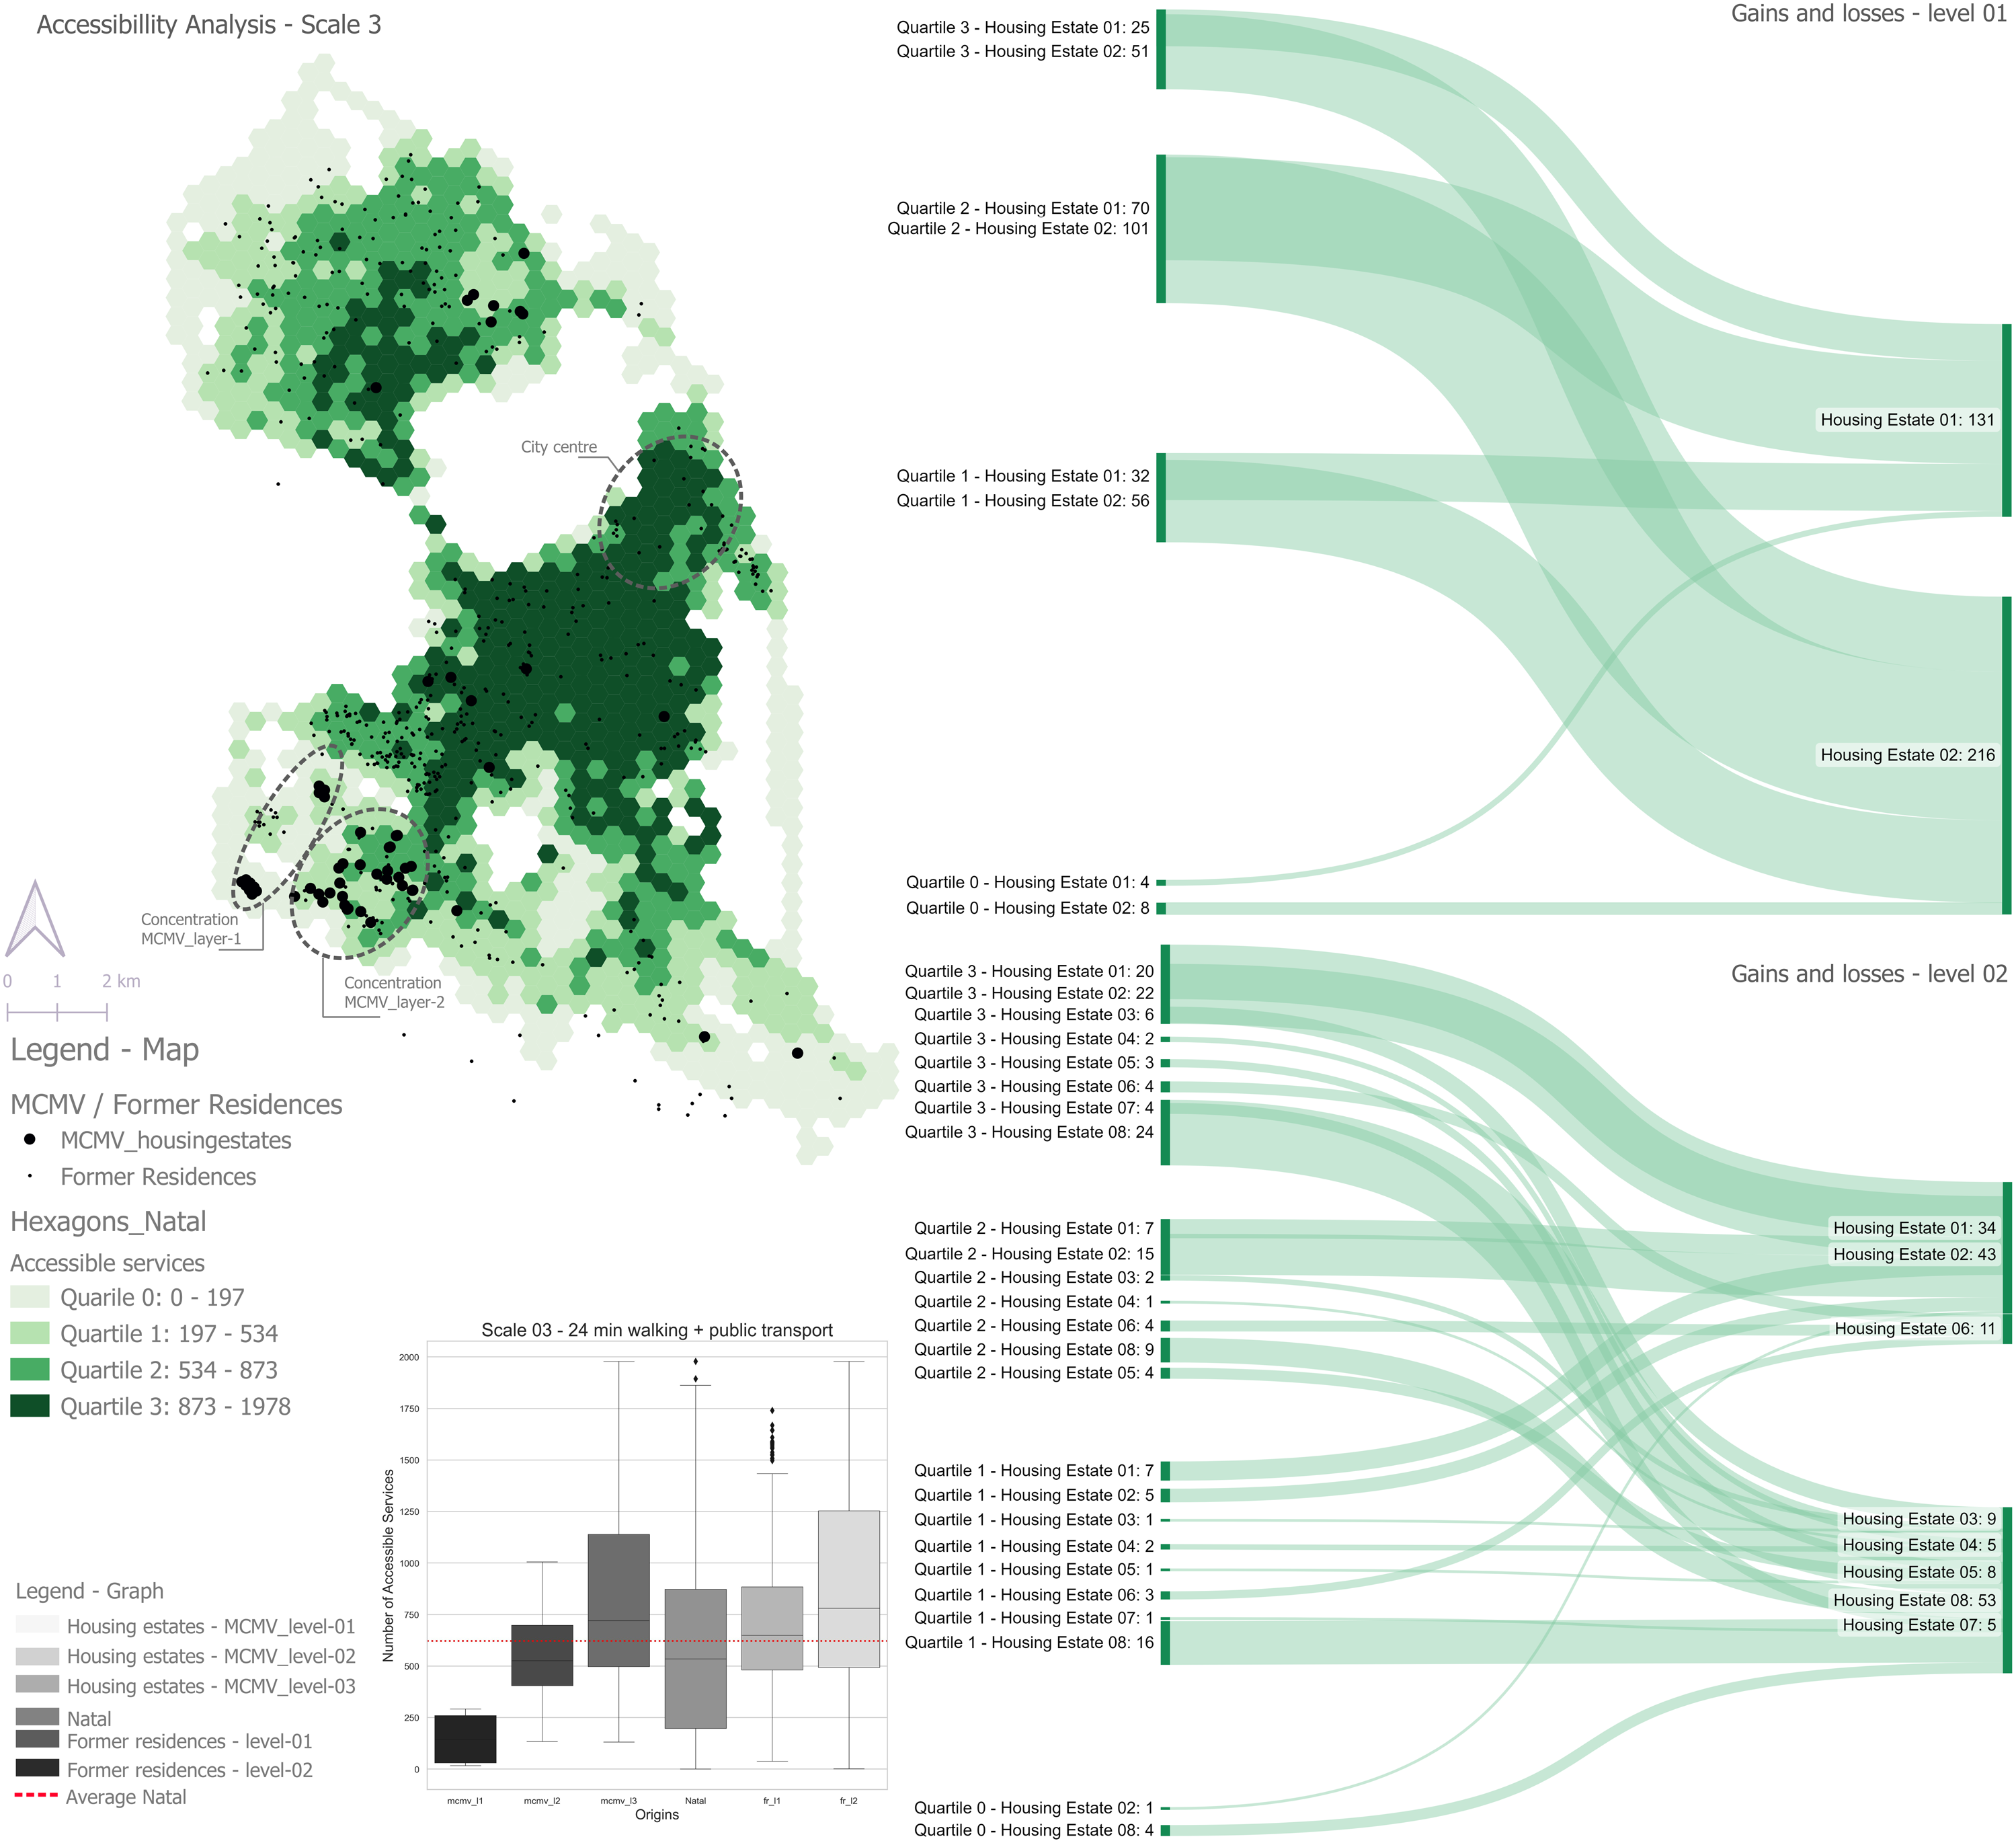
Despite this improvement, the vast majority (87.30%) of beneficiaries in level-01 still experienced a loss in accessibility by moving to the housing projects, while 1.20% gained and 11.50% maintained their level of accessibility. More specifically, looking at the Sankey diagram in Figure 6, 18.50% lost accessibility when moving from quartile 1 to quartile 0, while 23.10% experienced loss when moving from quartile 2 to quartile 1. Additionally, 33.35% experienced loss when moving from quartile 2 to quartile 0, 8.25% experienced loss when moving from quartile 3 to quartile 1, and 16.80% experienced major loss when moving from quartile 3 to quartile 0.
In level-02, 62.5% of beneficiaries lost accessibility, while 25.60% maintained their accessibility, and 11.90% gained accessibility. More specifically, among level-02 beneficiaries who lost accessibility, 19.05% experienced loss when moving from quartile 2 to quartile 1, and 37.15% experienced loss when moving from quartile 3 to quartile 1. Furthermore, 43.80% experienced major loss when moving from quartile 3 to quartile 1, as there are no housing projects of layer-2 in quartile 0 in this scale (Figure 6).
Discussion
Following the cumulative accessibility analyses, the results unveil two distinct facets of how the housing program addresses the issue of accessibility. Firstly, a notable contrast in accessibility emerges among housing projects designed for different income levels. Specifically, developments built for lower-income individuals (level-01) exhibit lower access to essential daily services when compared to their middle-income (level-02 and level-03) counterparts across all scales. These results echo findings reported by different researchers worldwide (see Table 1).
The second and more substantial finding is the persistent decline in accessibility across all three scales of analysis for all program beneficiaries, with lower-income beneficiaries (level-01) experiencing the most pronounced effects. These accessibility losses imply that the housing program has not succeeded in promoting social and spatial equity. Instead, the policy seems to be pushing lower-income individuals away from the functional city center, towards newer or developing areas with lower service density compared to housing developments for the other two MCMV income levels.
This relocation has particularly adverse consequences for lower-income beneficiaries who heavily rely on the available physical space and the presence of effective public services to enhance their economic and social well-being (Marques, 2019). Loss of access to these resources compels them to cover longer distances to attain opportunities comparable to what they enjoyed previously. The low-income population, when faced with the need to travel long distances, must either resort to paying for motorized forms of transportation or spend an increased amount of time walking or cycling, if feasible. This presents additional costs, be they temporal or economic in nature, which can severely constrain their options. Such limitations can, in turn, deepen poverty, diminish social connections, and result in pronounced social and spatial segregation (Benevenuto and Caulfield, 2019; Lucas et al., 2016). Thus, the housing program that was intended to offer new opportunities to its beneficiaries has engendered the opposite effect.
These results showcase the ability of the proposed methodology to capture shifts in accessibility. Nonetheless, it is necessary to recognize specific limitations concerning data extraction, spatial units, and accessibility measures that warrant further consideration and resolution. Regarding the data extraction methods, especially about the former residences of policy beneficiaries, the approach presented in this paper may not be easily transferrable to other contexts where such records are not publicly available. An alternative solution could involve conducting surveys with the beneficiaries of housing programs. While this approach might be more labor-intensive, it could provide a means to obtain the necessary data.
Another limitation involves the utilization of the H3 hexagonal spatial index, which may potentially introduce the Modifiable Areal Unit Problem (MAUP) (Dark and Bram, 2007). While the adoption of an open-source spatial index supports replicability of the methodology in various parts of the world, it is essential to explore different resolutions and spatial units to ensure consistent results. In this study, resolution level 8 was adopted due to an ongoing study on access to opportunities in Brazil that uses the same resolution (Pereira et al., 2019).
Furthermore, it is important to note that the accessibility measure employed in this study, cumulative accessibility, is an indicator of social inclusion or exclusion but it is also a generic measure, as highlighted by Geurs and Van Wee (2004). It does not consider the specific capacities of services, nor the needs and capabilities of individuals. For this reason, it could be necessary to test other accessibility measures within the proposed methodology.
Conclusion
This study has contributed to addressing the gap in analyzing the relationship between housing policies and accessibility, shedding light on the potential impact of such policies on the daily lives of beneficiaries. To tackle this issue, a comprehensive comparative methodology for conducting both uni- and multi-modal accessibility was developed. The comparison occurred at two levels: firstly, between the former residences of program beneficiaries and the housing projects funded by these programs to which the beneficiaries relocated, and secondly, across the housing projects for different income levels benefiting from the policy.
The comparison was conducted at three distinct scales, each associated with a specific mode of transportation (walking, cycling, and public transport) and their respective travel times. The analysis was carried out using both uni- and multi-modal urban network models, specially designed to support this methodology.
The results have demonstrated the effectiveness of the approach in capturing changes in accessibility and understanding the potential impact of housing programs on their beneficiaries’ everyday lives. Furthermore, this methodology holds potential for replication in various global contexts.
Regarding the case study, the findings have unveiled a crucial distinction: housing estates designed for lower-income beneficiaries (level-01) are less accessible than those constructed for beneficiaries with greater purchasing power (level-02 and level-03). Notably, it was the lower-income individuals who experienced the most substantial reduction in accessibility when relocating to MCMV housing estates.
These results suggest that the lower-income population is more likely to be facing increased location costs, which can strain family budgets and potentially lead to a deepening of poverty. This study highlights the critical need for policymakers to consider the accessibility implications of housing policies and their differential impacts on distinct economic groups.
Besides adding to the existing body of knowledge concerning the intersections of social housing policies and accessibility, this study may establish groundwork for future research in this field. As the limitations discussed in the preceding sections are addressed, and the focus sharpens on the day-to-day needs of beneficiaries, particularly emphasizing individual accessibility, a realm of intriguing prospects for future inquiries is unveiled.
Footnotes
Declaration of conflicting interests
The author(s) declared no potential conflicts of interest with respect to the research, authorship, and/or publication of this article.
Funding
The author(s) disclosed receipt of the following financial support for the research, authorship, and/or publication of this article: This work was supported by the Coordenação de Aperfeiçoamento de Pessoal de Nível Superior—Brasil (CAPES) [Finance Code 001].