
Abstract
Having had the most rapid urbanization in the world since the 1990s, mega-cities in East Asia featured highly compact and atomized modernist architecture. With densely built modernist architecture and relatively free building regulations, it is challenging to trace the actual development of the whole city. Compared to European cities, their overall urban landscapes are much denser, higher, and functionally mixed. In order to achieve a quicker and more accurate identification of urban forms in mega-cities, this study proposed a two-level machine-learning approach. At the building level, we extracted features from topographic maps and building licenses to automatically classify building types. Four state-of-the-art multi-class classification models were compared. At the block level, we used building types as input data and compared two methods for block clustering. In total 61,426 buildings from Taipei were classified and grouped into 10 block types. Different from Western cities, many of the block types in Taipei were mixtures of different types of buildings. This approach is efficient in exploring new urban form types, especially for emerging mega-cities where block types are previously unknown. The result not only sheds light on the features of East Asian urban landscapes but also serves as important basis of type-based strategic plans for contemporary urban issues.
Introduction
Recent studies have recognized the relevance of urban forms to sustainable urban development (Arundel and Ronald, 2017; Beermann et al., 2014; Hermand and Quesada, 2019; Yosef, 2006). Urban forms are crucial not only for socio-economic aspects (Conzen, 2004), but they are also a key to many contemporary urban issues (Hackenbruch, 2018; Pauleit, 2016; Su et al., 2021). Among the nested structure of urban landscapes—buildings, blocks, quarters, and towns (Reicher, 2017), street blocks are the smallest elements that still possess urban characters. Block types not only provide information about construction periods and buildings styles but also suggest surface-to-volume ratios (Ratti et al., 2003), degrees of open spaces, energy consumption, and land-use intensity (Beck et al., 2020; Li et al., 2018; Salat, 2009; Steadman et al., 2014). However, the analysis of urban forms in building and block levels is a time-intensive task that heavily relies on expert knowledge (cf. Caniggia and Maffei, 2001; Whitehand, 2001). While existing literature mainly focuses on Western cities or historic towns, only a few studies have covered the urban forms of contemporary mega-cities in the East (Levy, 1999; Whitehand, 2011). Having had the fastest urbanization rate in the world since the 1990s (ESCAP, 2013), East Asian cities feature highly compact and atomized modernist architecture, which is dominated by free-standing tower-buildings that have less connection to surrounding environment. Compared to European cities, the overall urban landscapes are much denser, higher, and functionally mixed (Hamnett and Forbes, 2011; Schneider et al., 2015; Wolff et al., 2018). As one of the fastest-growing mega-cities, Taipei is greatly shaped by rapid urbanization since the post-war era (Bai et al., 2011). With densely built modernist architecture and relatively free building regulations, it is challenging to trace the actual block development of the whole city. In order to facilitate an efficient method of urban form analysis, we propose a data-driven approach for classifying street blocks of the mega-city scale.
Machine learning is a rising field of study in urban form classification. This approach uses algorithms to automatically optimize the classifier by minimizing errors between training and testing data, which is efficient in providing consistent results over a large area. With given training data, the same process is widely applicable in other cities. Supervised machine-learning models (classification), which are trained against known target classes, are much faster and easier to build, because they do not require predefined rules as in rule-based classification (Belgiu et al., 2014; Orford and Radcliffe, 2007). Depending on the scale and objectives of classification, different datasets are available, for example, (vector or raster-based) topographic maps, 3D-city models, and satellite images. Among them, 3D-city models and vector-based topographic maps with a minimum resolution of 1:25,000 were found to have the best results (Hecht et al., 2015). For a smaller number of classes, binary classification models such as Support Vector Machine (SVM) has found useful in the building style classification in Germany (Henn et al., 2012) and the classification of urban tissues (in quarter level) across European cities (Steiniger et al., 2008). For a larger number of classes, multi-class classification models such as Random Forest (RF), Artificial Neural Networks (ANNs), and Light Gradient Boosted Machine (LightGBM) are reported to have better performances than binary classifiers (Hecht, 2014; Hecht et al., 2015; McCarty et al., 2020). Random forest is an ensemble-classifier based on decision trees that is often used for feature selection, such as examining the effectiveness of new spatial metrics for street blocks (Vanderhaegen and Canters, 2017). While ANNs are a useful tool for pattern recognition in the cartography field (Yan et al., 2019), a single-hidden-layer neural network was found to have slightly worse performance than RF in the building classification from Hecht (2014). LightGBM is an emerging algorithm in the remote-sensing field for land cover classification (Candido et al., 2021; Chen et al., 2021; McCarty et al., 2020). LightGBM and XGBoost are both tree-based models similar to RF, but they use boosting method instead of bagging. While bagging builds multiple trees at once and gets the mean results at the end, boosting builds one tree at a time and adjusts branches as the tree grows.
On the other hand, unsupervised machine-learning algorithms such as k-means clustering and the Gaussian mixture model (GMM) are frequently used for clustering urban forms on larger scales. K-means has been one of the most popular clustering methods since it was first published in 1955 (Jain, 2010). This method has been used in various urban form studies such as neighborhoods (Francisco et al., 2017; Song and Knaap, 2007), building groups (Schirmer and Axhausen, 2013), and street blocks (Gil et al., 2012). Besides K-means, recent studies have started to explore GMM in clustering block and neighborhood types (Fleischmann et al., 2021; Ma et al., 2021). As an advanced version of k-means, GMM considers the data density and distribution, which has been applied in classification of more complicated urban forms (Huang et al., 2007; Li and Quan, 2023; Samuelsson et al., 2019; Su et al., 2021). While many of these studies are raster-based that focus on large urban scales, other studies developed block-level spatial metrics (Araldi and Fusco, 2019; Fleischmann et al., 2021; Gil et al., 2012; Hermosilla et al., 2014; Ma et al., 2021; Vanderhaegen and Canters, 2017) to classify street blocks. Among them, Fleischmann et al. (2021), Gil et al. (2012), and Ma et al. (2021) used GMM to cluster blocks based on spatial metrics that described block geometries and positions of buildings inside. However, these studies focused on European or American cities. The systematic review from Chen et al. (2020) revealed that especially urban areas in Taiwan, South Korea, and the cities of Singapore and Hong Kong are characterized through high population density and diversity concerning urban forms and land uses. This is a result of existing planning systems with few construction restrictions, cultural background, social norms, and economic development, while European cities such as Berlin with a highly controlled planning regime have a more continuous urban fabric (Burdett and Rode, 2018: 529; Chen et al., 2020). This makes block types in European cities more homogeneous and easier to identify. For complex urban landscapes in East Asia mega-cities, applying these clustering methods directly on the block level could be very complicated.
This study sets out to explore the underlying block types in East Asian mega-cities. Considering the street blocks in Taipei are highly heterogeneous due to juxtaposition of free-standing buildings, we use a similar approach by Meinel et al. (2008) to derive block types from the buildings within. We propose a two-level approach that incorporates both supervised and unsupervised machine-learning methods. In the building level, multi-class classification algorithms are used to classify building types. In the block level, clustering methods based on results from building types are used to explore street-block types. This approach utilizes big data to provide detailed results for a very large spatial coverage and unveiled the block types that were previously too complicated for qualitative methods.
Methods
Figure 1 shows the analytical framework of the analysis. First, the topographic map and building license were prepared as input data for the (1) multi-class classification for building types, which used supervised machine-learning algorithms to train four classifiers. The result of the best classifier was prepared as input data for the (2) clustering of street-blocks, which used two unsupervised machine-learning models to derive block types in Taipei. Analytical framework of the two-level machine-learning approach for classifying urban forms. The upper part shows the workflow of the (1) multi-class classification for building types, and the lower part is the process of (2) clustering of street-blocks.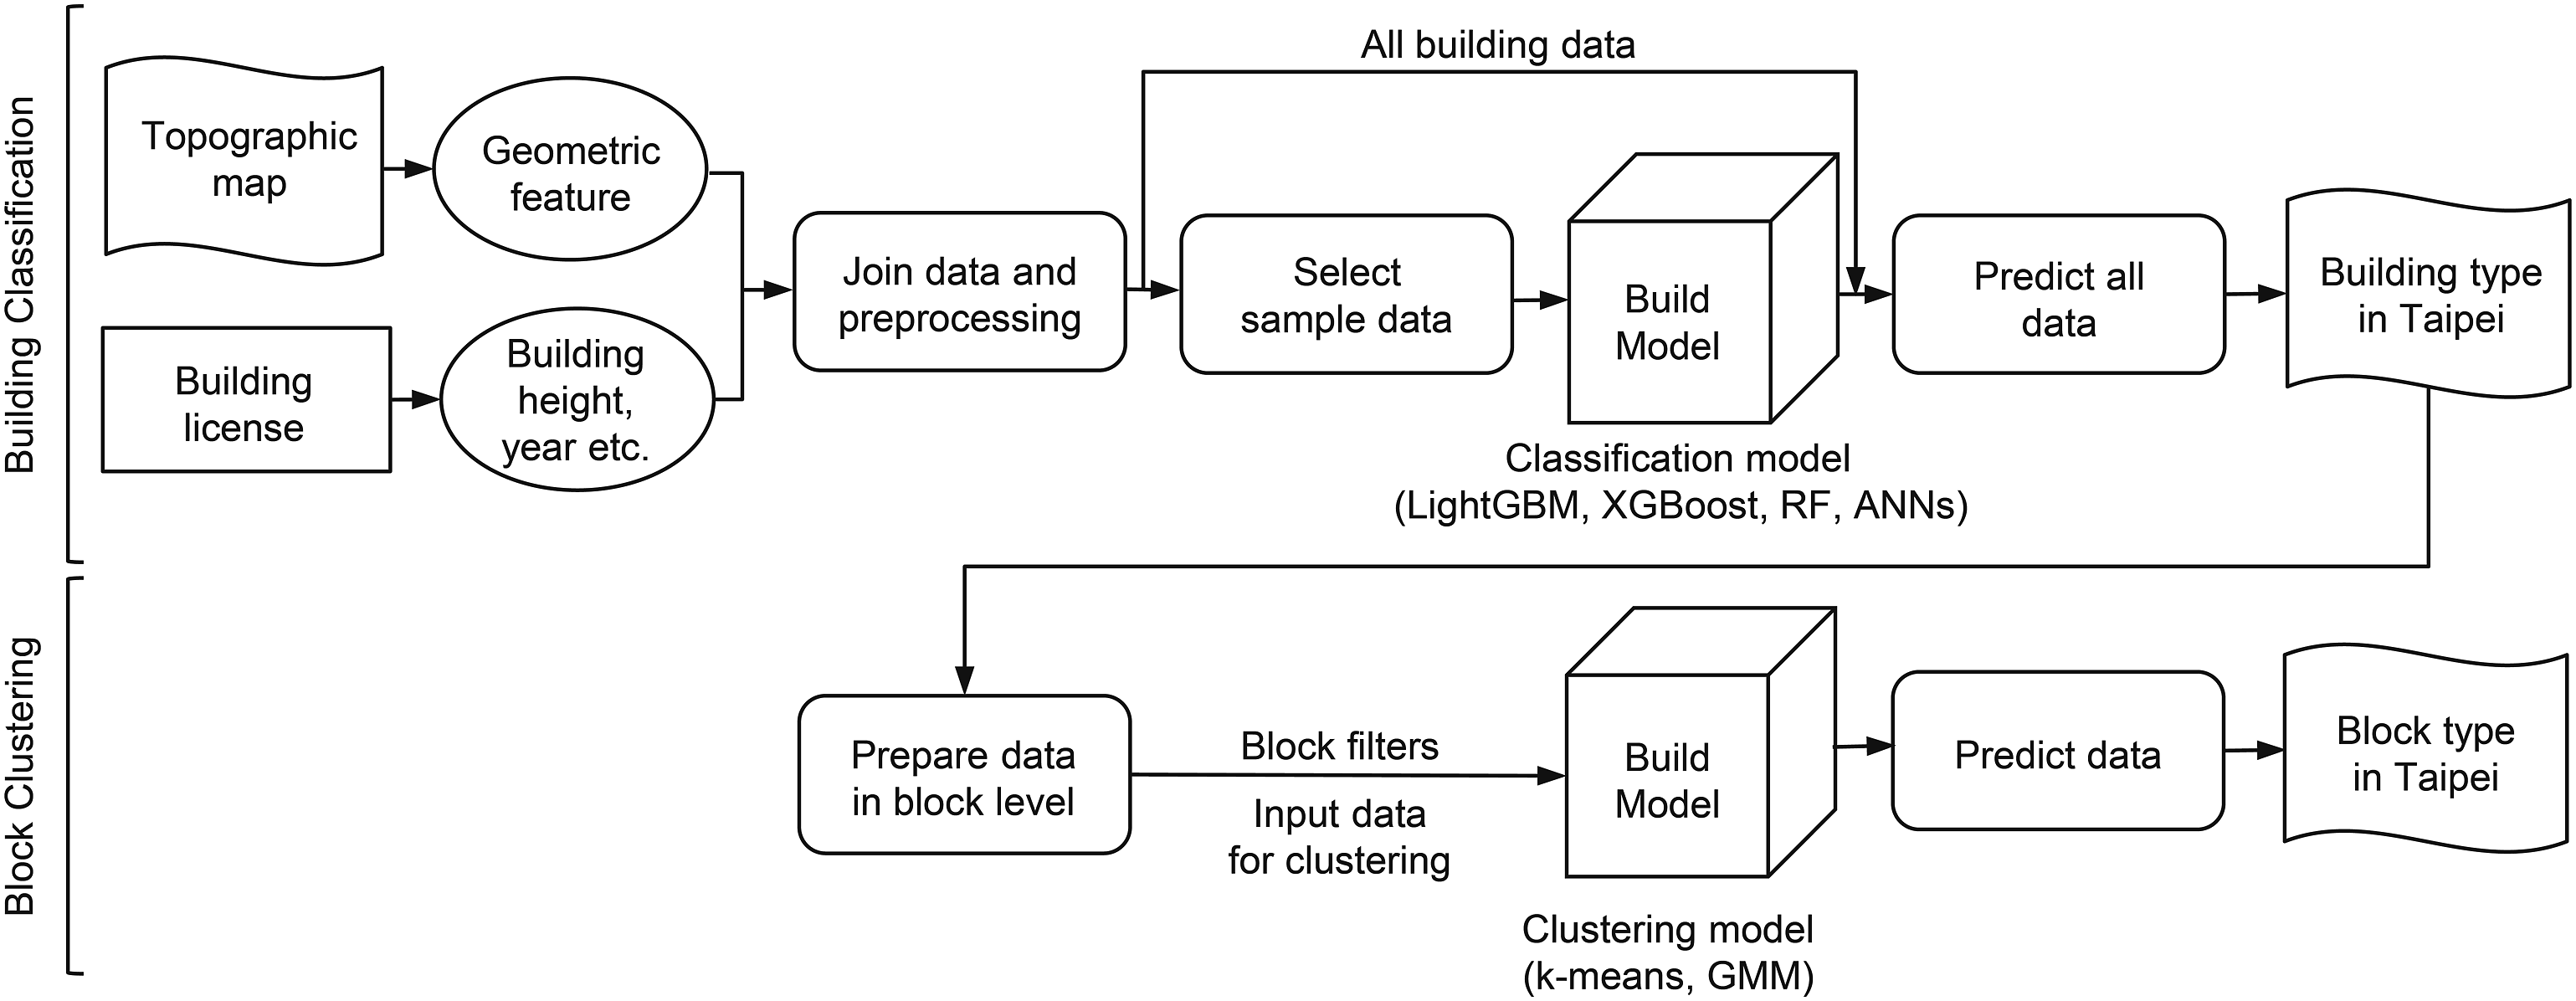
Building classification
Data preparation is an important step before the building classification. First, we defined the building types in Taipei according to architectural features. Then, we extracted features from the topographic map and building license and collected sample data for training.
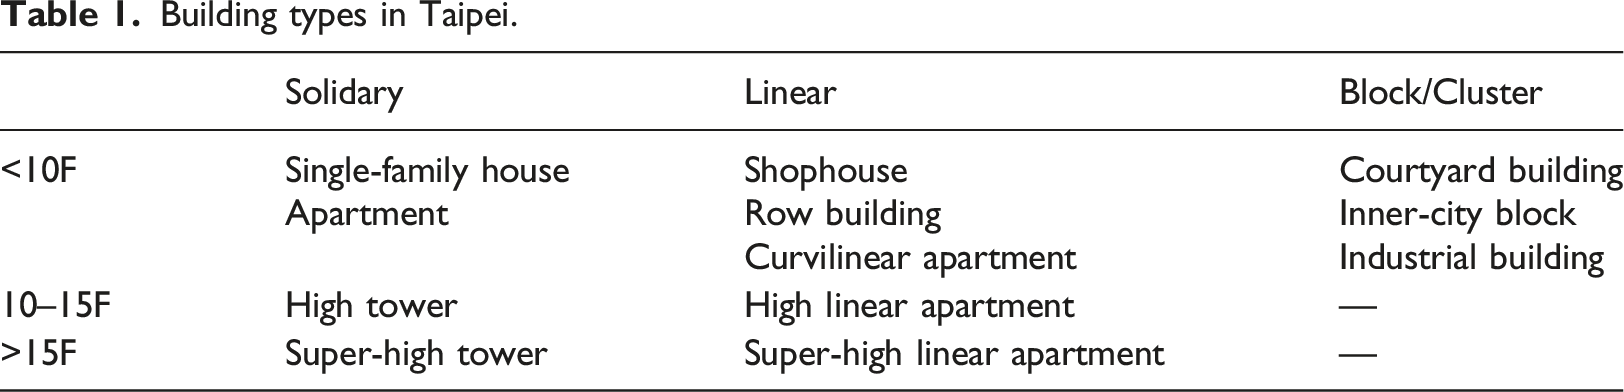
Building type in Taipei
Building types in Taipei.
Feature extraction and data preprocessing
By the time of this research, there was only a part of the 3D-city models in Taipei available for the public. While 3D-city models contain much information about building heights and shapes, topographic maps are found to have similar performance in prior studies (Hecht et al., 2015) and are widely available in most places. Using vector-based topographic maps also enables an increased level of detail and avoids the problem of boundary definition as in most of the raster-based analysis (Clifton et al., 2008; Horner, 2007; Huang et al., 2007; Ye and Van Nes, 2014). In this study, we used the 1:2500 topographic map of Taipei for the analysis, which was produced by National Land Surveying and Mapping Center (2016). The map contains building footprints and street blocks, but it does not include information such as building heights, land uses, plots, and street widths. Therefore, we extracted information from building usage licenses from the years 1951 to 2016 from the open data platform of Taipei City (Taipei City Construction Management Office, 2019) and joined them to the topographic map based on plot addresses. Finally, the cadastral map, land-use survey, and street width data from open data platform were joined spatially in ArcGIS to provide additional feature data.
In ArcGIS, the buildings on the topographic map were generalized, where building edges that are shorter than 0.25 m were simplified and buildings with area <46 m2 were omitted. In total, 94 features were extracted from 61,426 effective buildings using geoprocessing tools from ArcGIS, QGIS, and Python scripts (Bard, 2004; Beyhan et al., 2020; Maceachren, 1985; Schumm, 1956). Among the input features, 38 of them were building features, 27 were block- or urban-level features, 17 were information from building licenses, and 12 features were from streets, plots, and land-use data (Table S2).
Following the feature extraction, categorical data was encoded into numeric data. We filled the missing values of building-license features with the mean value while the rest of the features with zero. For models such as Artificial Neural Networks (ANNs), we normalized the data according to the data range. Finally, we built a building dataset of 10,000 samples (reference data), which was collected between March and May 2021 by one trained expert to ensure consistency. The data was collected through Google Maps and street views, where the number of samples is evenly distributed across the 12 districts in Taipei city with each district having similar ratios of building classes.
Training classification model
We trained four state-of-the-art classification models and compared their results, including Random Forest (RF), Light Gradient Boosted Machine (LightGBM), eXtreme Gradient Boosting (XGBoost), and Artificial Neural Networks (ANNs) (Table S3). In the model training step, we first split the 10,000 sample data into 70% training and validation data and 30% testing data to tune the hyperparameters (Table S3), where a 5-fold cross-validation was used in the grid search. The results were evaluated using 10-fold cross-validation across all sample data to check the variance of accuracy among different training/testing data splits. We evaluated the models using the mean accuracy scores and their standard deviation. We chose the best classifier according to the mean accuracy on testing data, which tells the model’s ability to predict data. Because the building-class distribution is imbalanced, we also included the Cohen's kappa coefficient (κ) in the evaluation to ensure the accuracy is not skewed in some classes. Finally, the best model with the best hyperparameters was trained again with 90% training data to predict building types for the whole city.
Block clustering model
Aspects of block typology
The block forms in Taipei are varied, because the legal plan only specifies land-use zoning in the street-block level und there are rarely master plans for residential areas. Given the lack of prior knowledge, clustering is a good way to derive block typologies. Block typologies are usually the ensemble of building types (Hecht et al., 2015); therefore, the combination of building types serve as the basis of block typologies, which not only implies building styles but also construction periods and building functions. Moreover, block types should also inform about density, degrees of open spaces, and land uses, which are criteria related to urban sustainability. These aspects therefore serve as the criteria for the choice of block types.
Data preparation and clustering
To find street-block types in Taipei, we first aggregated the building-type results in the block level by calculating the area percentage of each building type in the blocks. Here, street-blocks with area >100,000 m2 and built density <0.05 (Ma et al., 2021) were filtered out (e.g., rivers or parks). The effective blocks with area ratios of each building type, unbuilt area, and block area were prepared as input data for clustering (Table S4). For the analysis of block types, we compared the clustering results from k-means and the Gaussian mixture model (GMM).
K-means assigns observations into k clusters so that each cluster has maximum in-group homogeneity and maximum between-group heterogeneity. This method optimizes the result by minimizing the Euclidean distance between points and cluster centroids. The result produces a circular decision boundary that approximates a Voronoi partition. K-means clustering requires a user-defined number of clusters k. In this study, we used silhouette coefficient (
Result
Accuracy evaluation
Accuracy rates of classification models on the Taipei dataset.
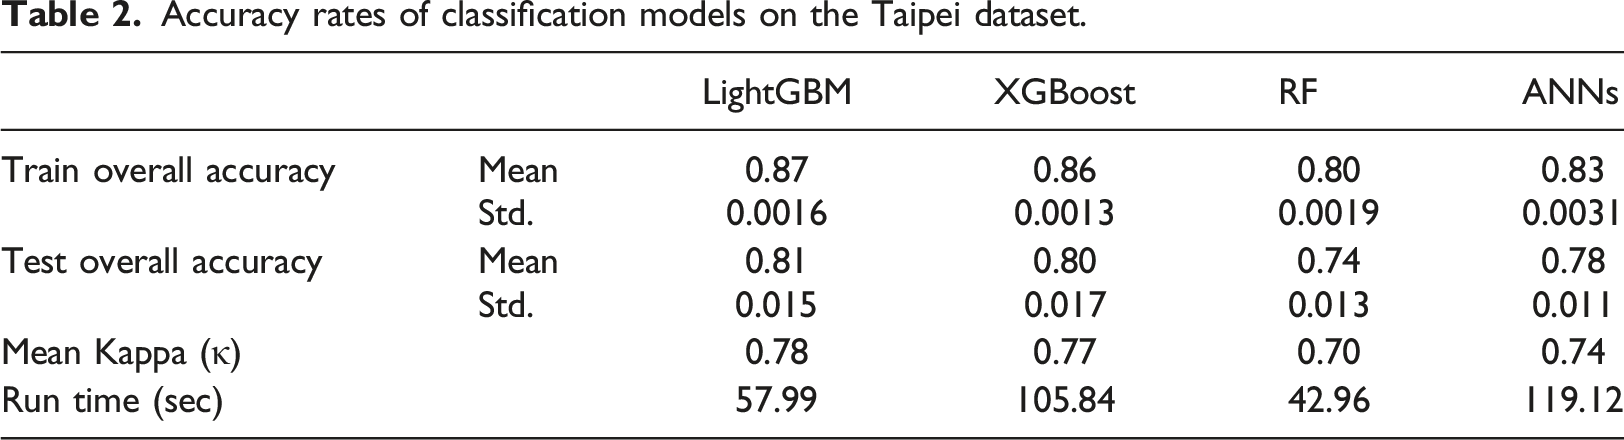
The between-class accuracy is visualized in the confusion matrixes in Figure S1. In comparison to RF and ANNs, our results showed that LightGBM and XGBoost had much higher accuracy and coherent results. Most of the classes had accuracy scores higher than 0.8. On the other hand, RF and ANNs also had very high accuracy scores for classes such as single-family houses and apartments, but they performed worse in tall buildings. RF had very low accuracy rates in shophouses, industrial buildings, and courtyard buildings. Overall, gradient boosting models were able to identify more complicated buildings such as super-high towers, super-high linear apartments, and courtyard buildings.
Feature importance
This study used a large number of features. Therefore, we used permutation feature importance to examine the features’ relevance to the classification results. Permutation importance observes the decrease in model scores after randomly shuffling the features. A large decrease, or a higher permutation score, implies the feature is more important. Figure 2 shows the 20 most important features for each model. Among the 94 features, the number of floors above ground, length-width ratio of the minimum bounding rectangle (MBR), and land value are the most important features. Many of these features were extracted from the building license. In comparison, LightGBM and XGBoost depend on similar features such as shape index, width of MBR, and number of plots. All models except RF depend on urban features such as the ratio of building to block area, road id, and distances to the city center, while for ANNs, features from the building license such as construction types and structure types are more important. Feature importance (top 20) of building classification models on the Taipei dataset using (a) LightGBM, (b) XGBoost, (c) RF, and (d) ANNs.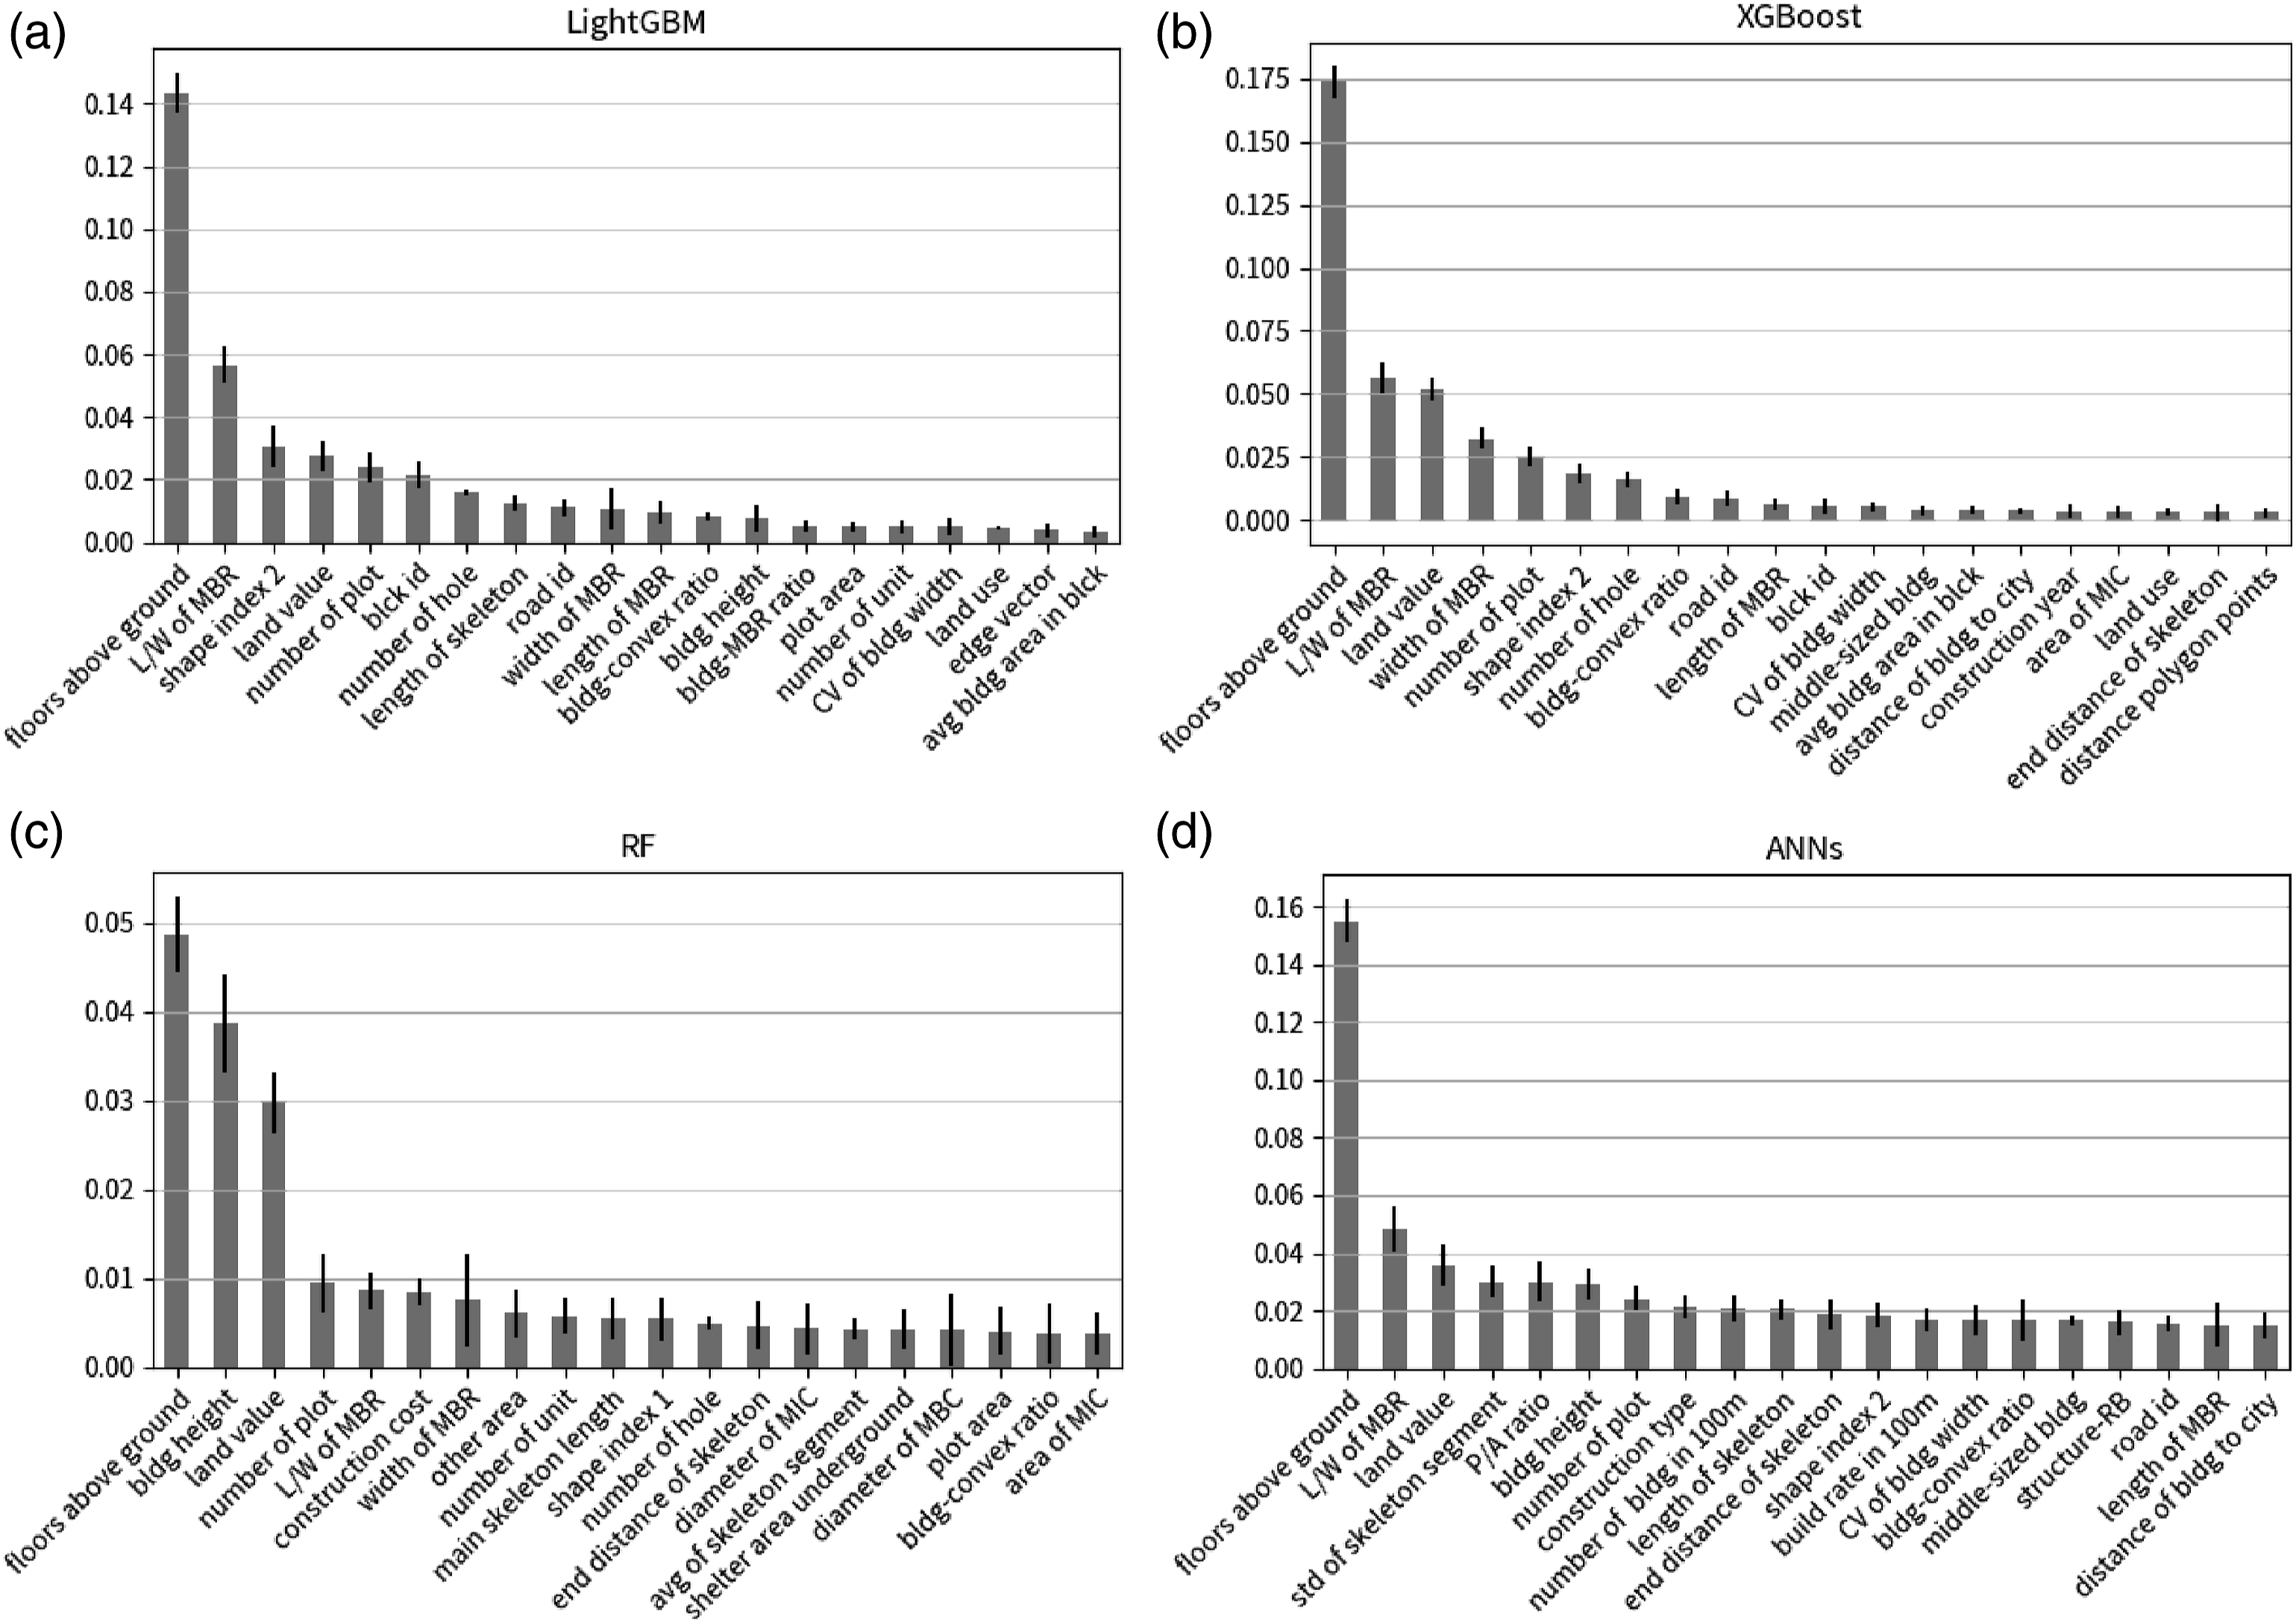
Building types in Taipei
We used the LightGBM model to predict building types throughout the whole city. The result of in total 61,426 buildings is shown in Figure 3. In Taipei, the most common building type is apartments, which take up 29.8% of all buildings. It is followed by single-family houses (18%), row buildings (11%), curvilinear apartments (6%), and inner-city blocks (5%). Free-standing apartment buildings under 10 floors are especially concentrated in some neighborhoods in the southern center, but they could also be found throughout the city and especially on street corners. As the second most frequent types in Taipei, single-family houses usually appear in gated communities in the periphery areas. Only a few of them are located inside the city center. Row buildings are one of the most typical buildings in Taipei as a result of a series of housing projects in the 1960s and 70s. These buildings usually come in groups and are mostly found in the eastern part of the city. Curvilinear buildings are also a very common type as a result of the housing projects in the 1970s. Inner-city blocks are densely built street blocks that are mostly located near the river coast in the west. This area was once the old city center and therefore has much higher built density and fewer open spaces. Building types in Taipei classified by the LightGBM model.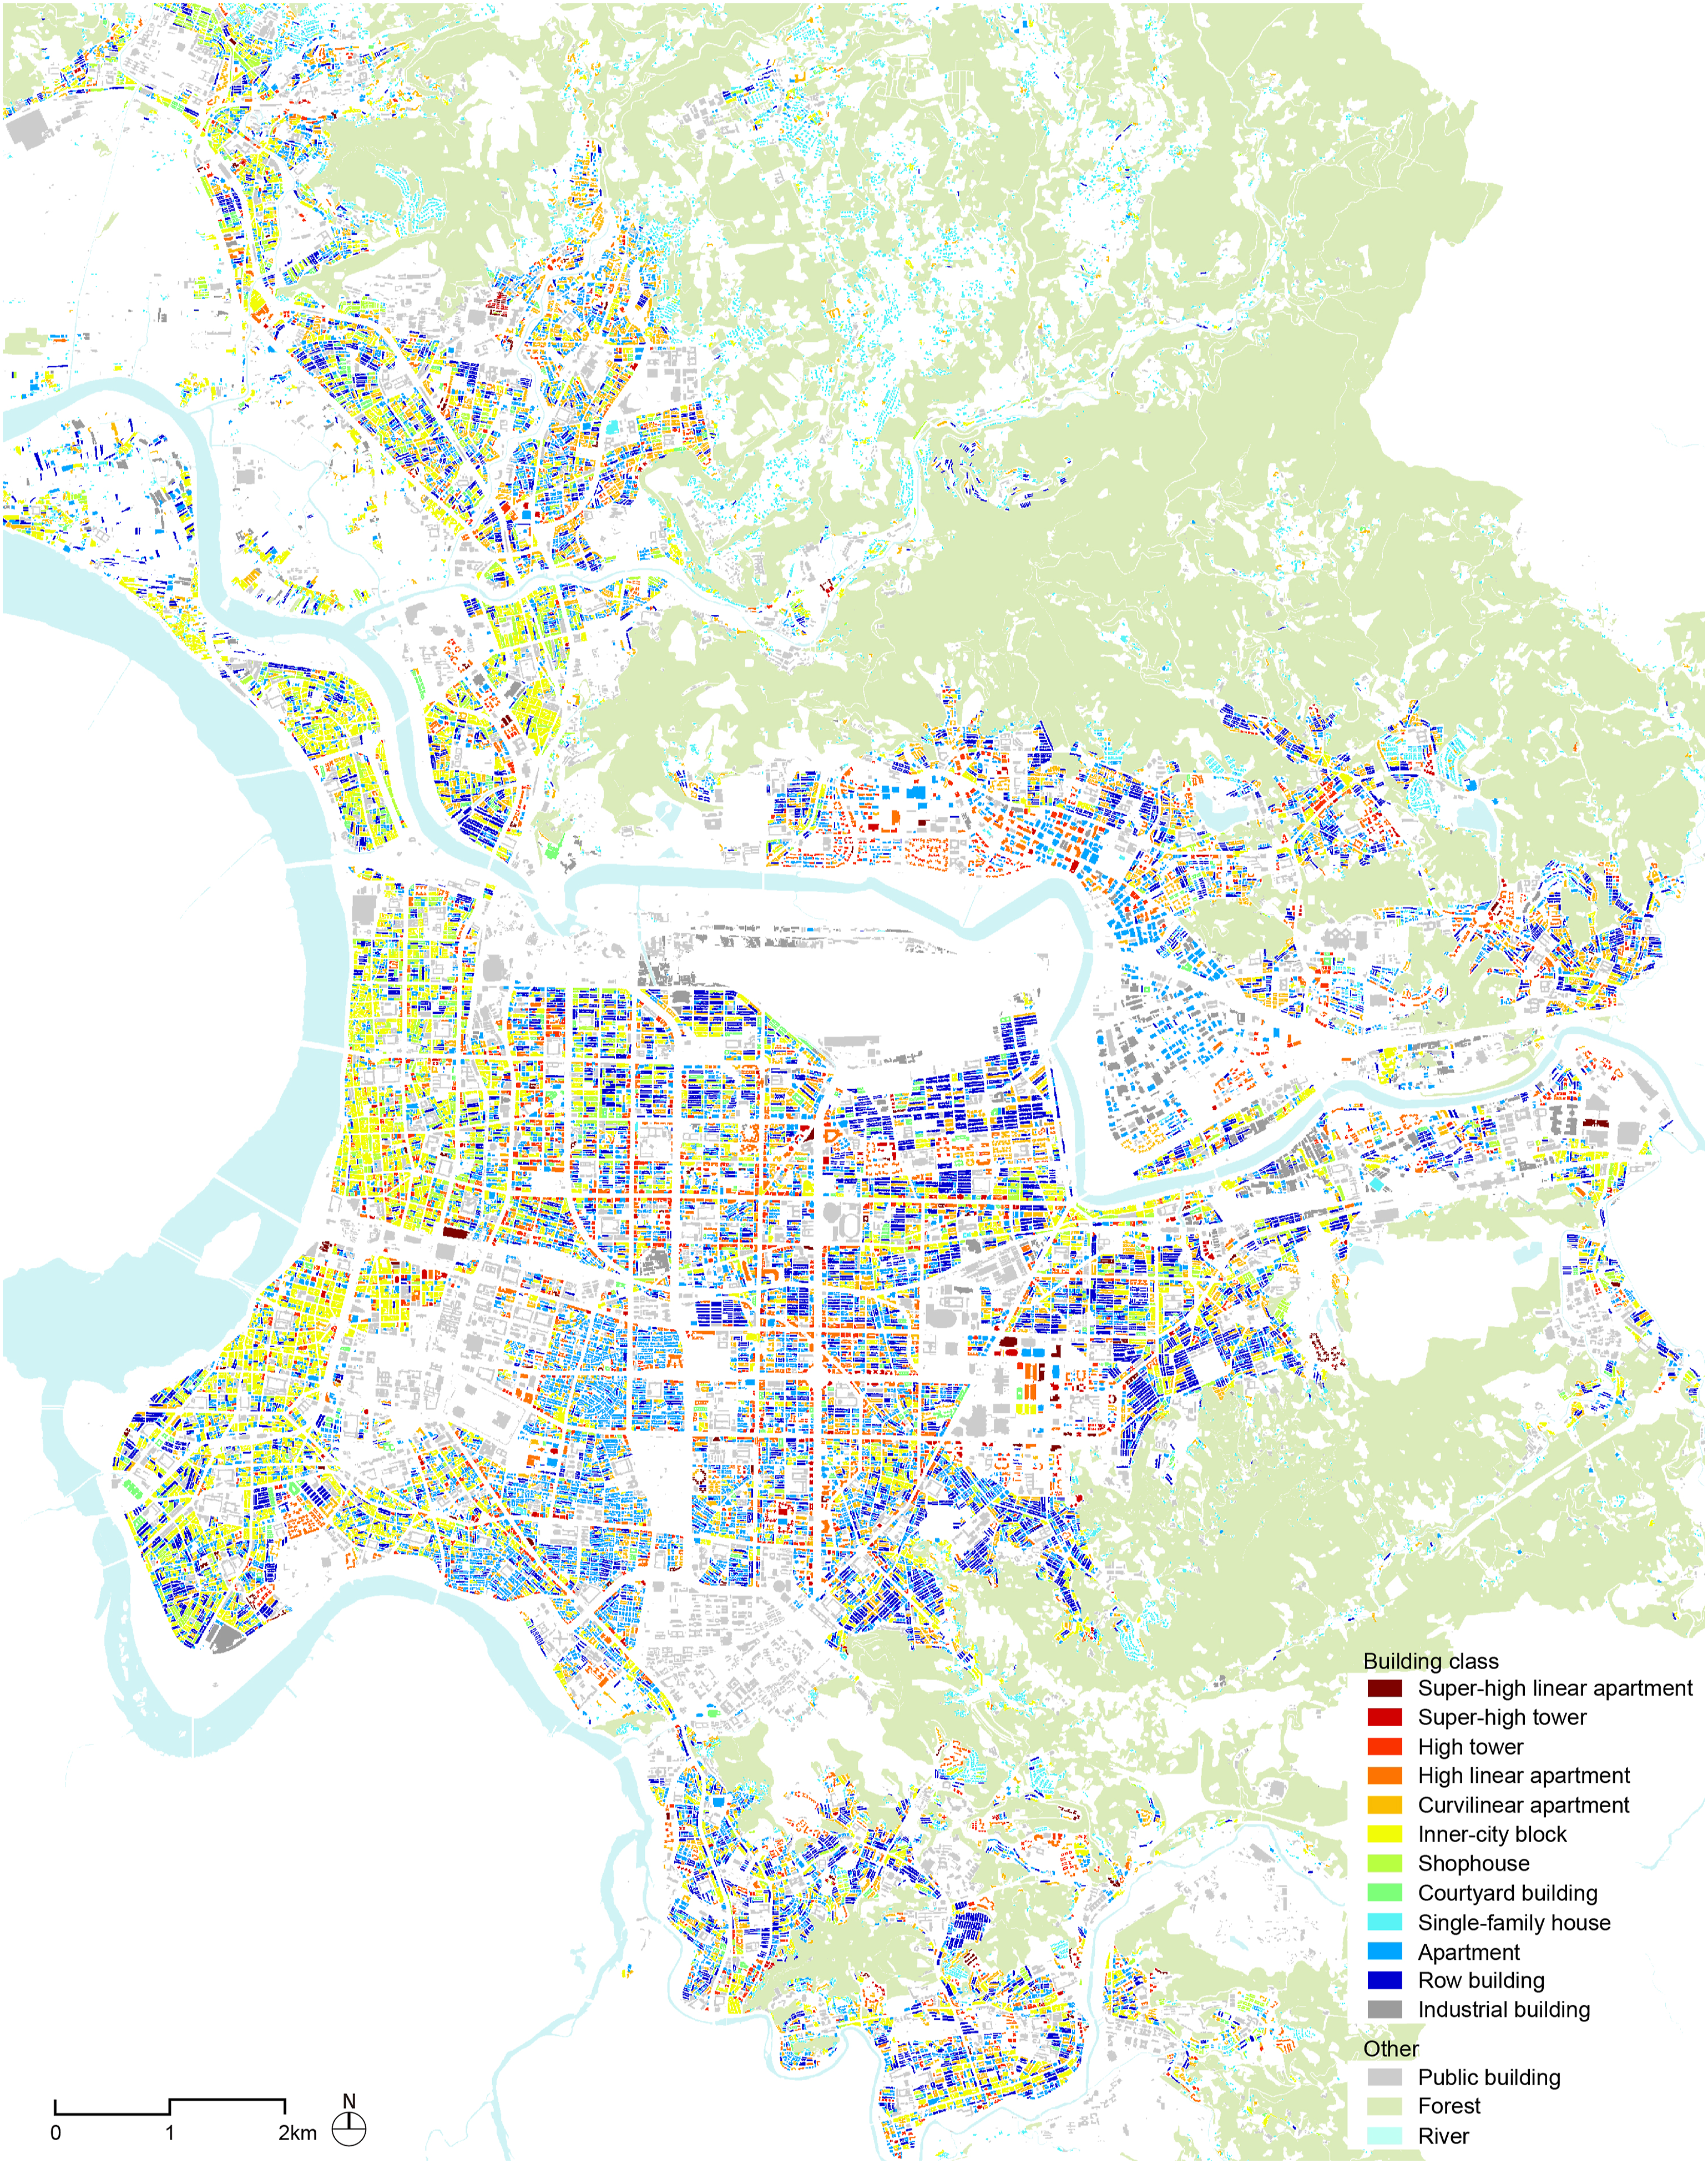
Moreover, tall buildings are also dominant in the urban landscape of Taipei, which takes up around 13.5% of all buildings. Among them, 11.8% are high buildings between 10 and 15 floors while 1.7% are super-high towers above 15 floors. These tall buildings are mostly located along main streets in the center and eastern parts of Taipei. In general, traditional buildings such as inner-city blocks and shophouses are mostly located in the western part of Taipei. Other modernist or post-modernist buildings often appear in the eastern part of the city, including row buildings, apartments, and various tall buildings. On the urban periphery, there are groups of single-family houses surrounding the city area in the north, the east, and the south.
Clustering results
For block clustering, it is important to determine the optimal number of clusters. Figure S2 shows that the k-means model had the highest silhouette score with k = 7, which was shortly followed by k = 13 and 10. For the GMM model, the BIC score first stopped at k = 5, then slowed down again between k = 10. In order to compare both models, we chose to cluster the street-blocks into 10 groups.
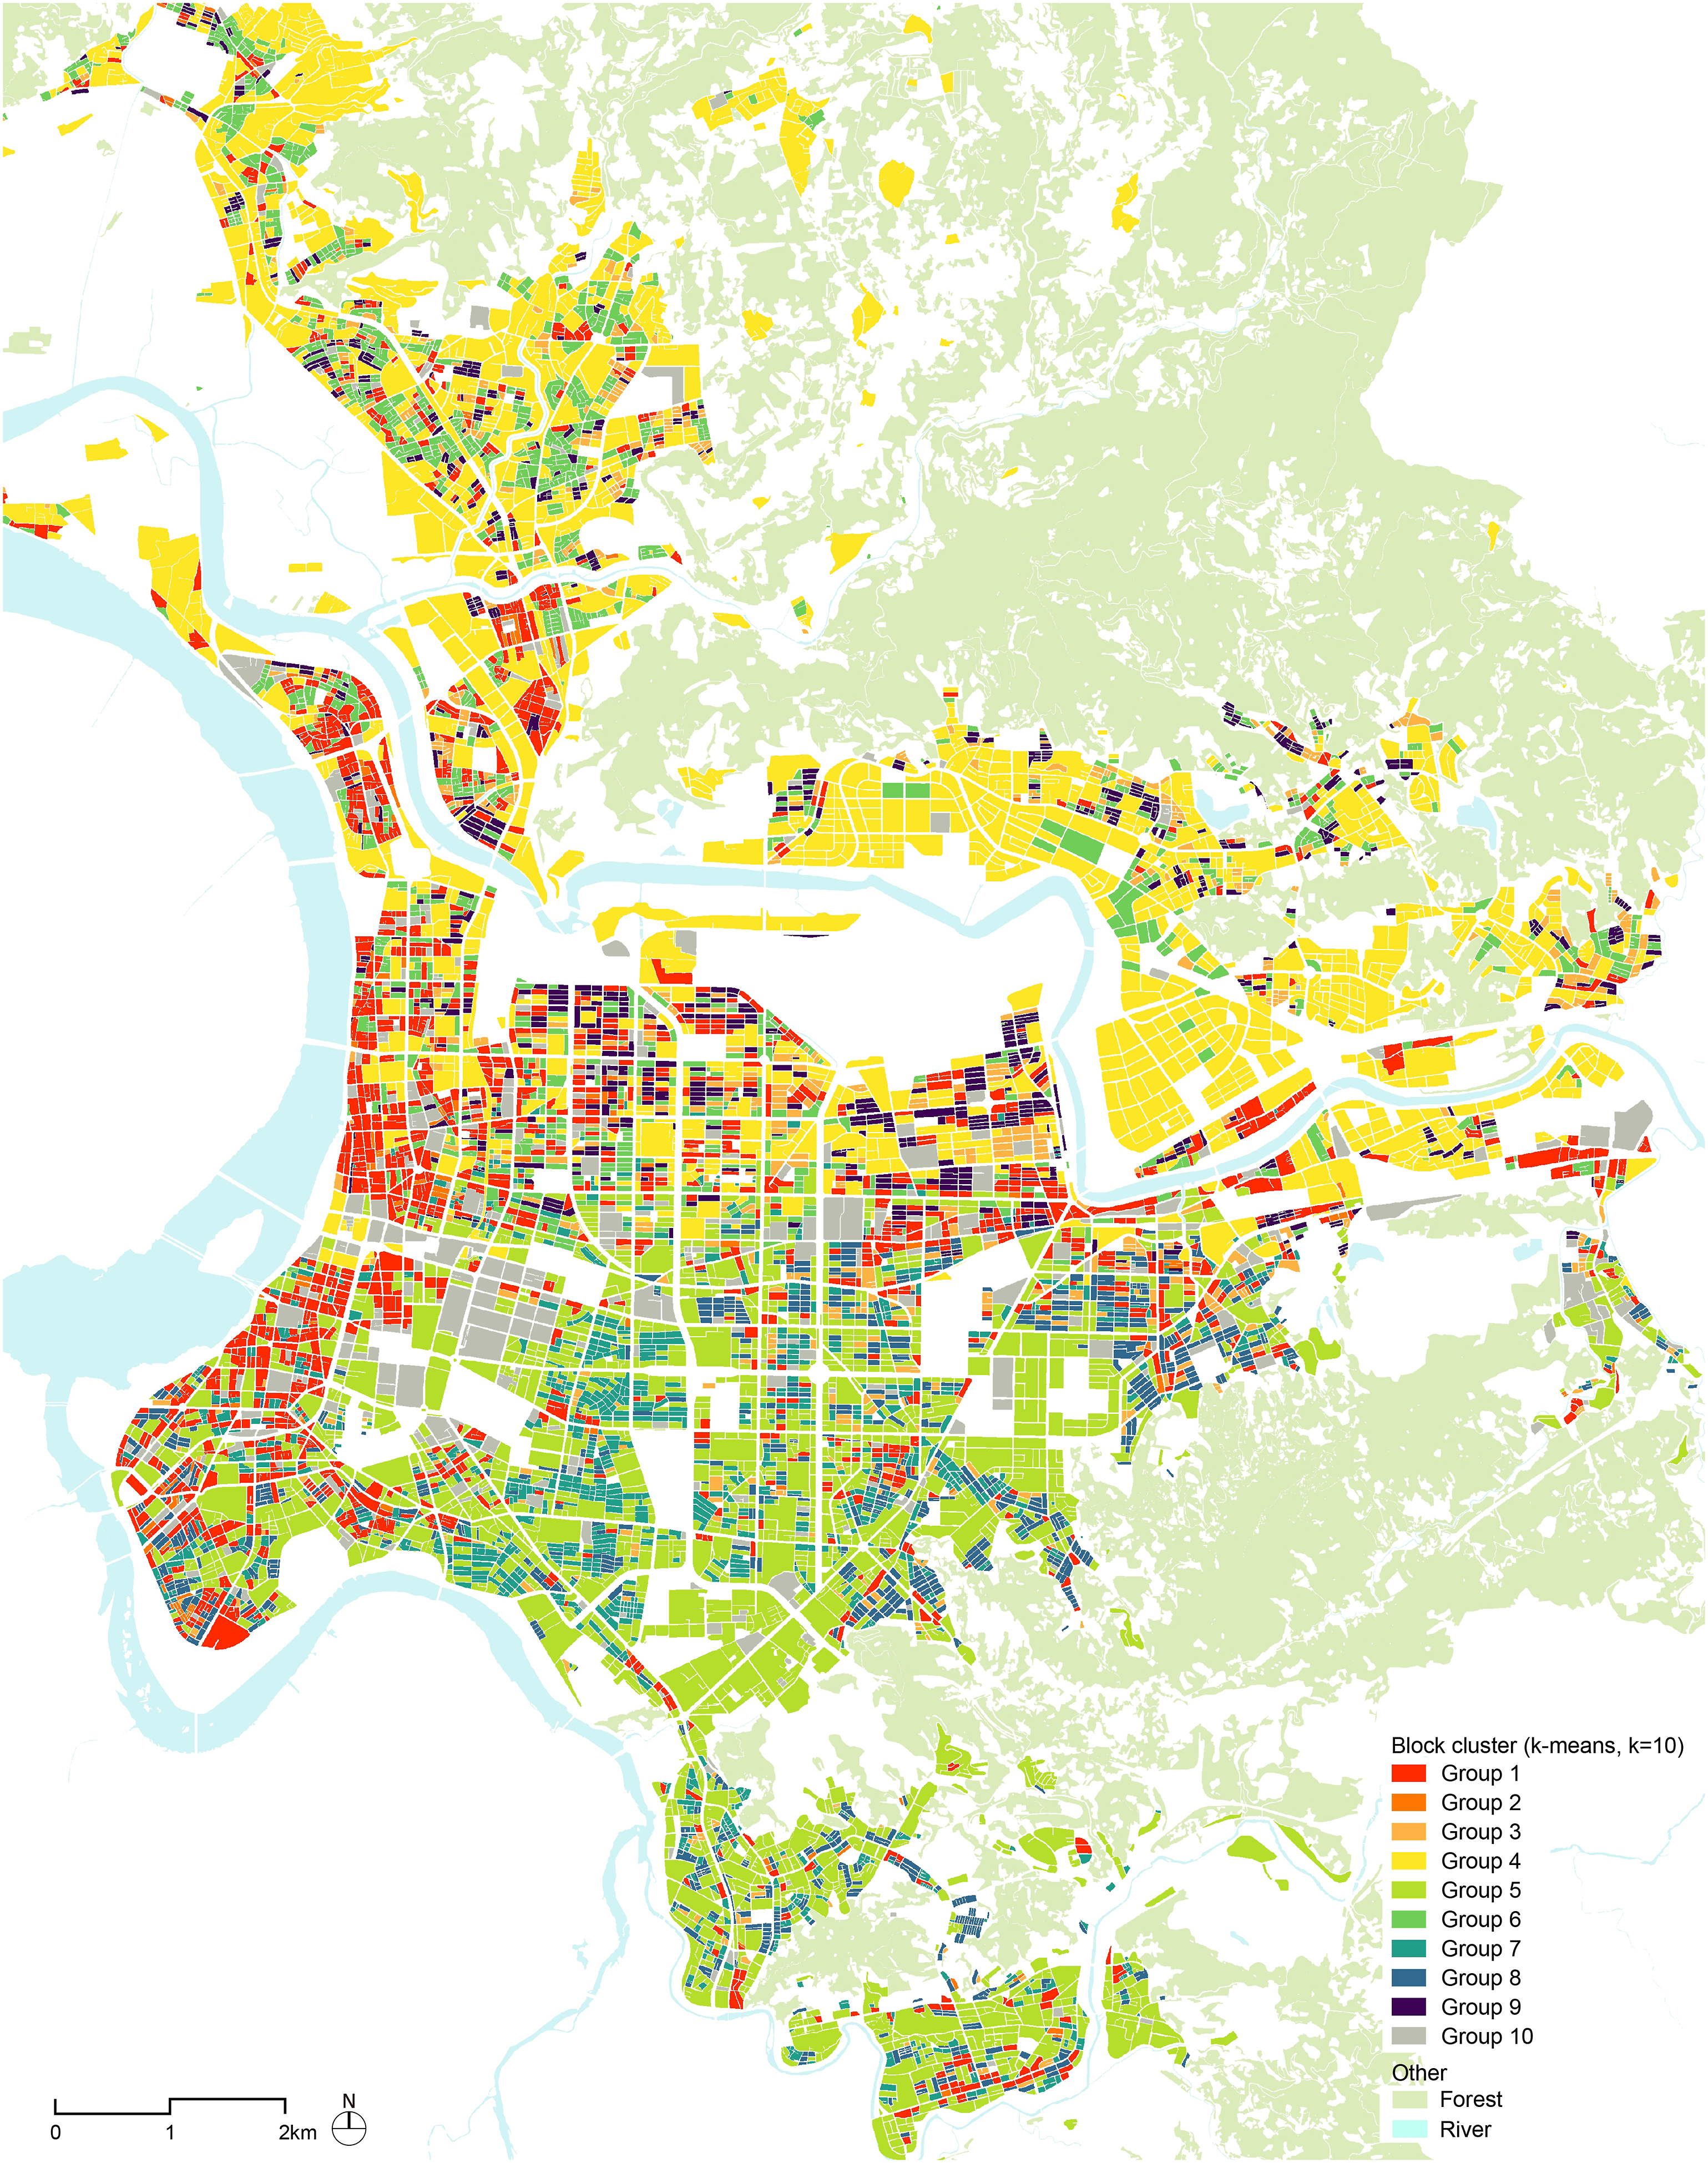
Figure 4 summarizes the clustering results. Among them, the k-means model produced one block type of mainly inner-city blocks (Figure 4(a), group 1), two types of tall buildings (group 4 and 5), two types of apartments (group 6 and 7), two for row buildings (group 8 and 9), and three other less frequent block types (group 2, 3, and 10). The GMM model also produced similar results, such as street-blocks of inner-city blocks (Figure 4(b), group 1) and public buildings (Figure 4(b), group 10). However, their building composition is more complex and the featuring building types of each cluster are different. For instance, instead of having apartment blocks or row-building blocks, the GMM model categorized both types as the same group (Figure 4(b), group 8). Other than grouping all tall buildings into one group, the GMM model separated them into three different clusters (group 5, 6, and 9). Composition of the block types in Taipei as results of clustering from (a) k-means. (b) GMM model. Both models had a value of k = 10. The Result of other numbers of k is shown in Figure S3 in supplementary material.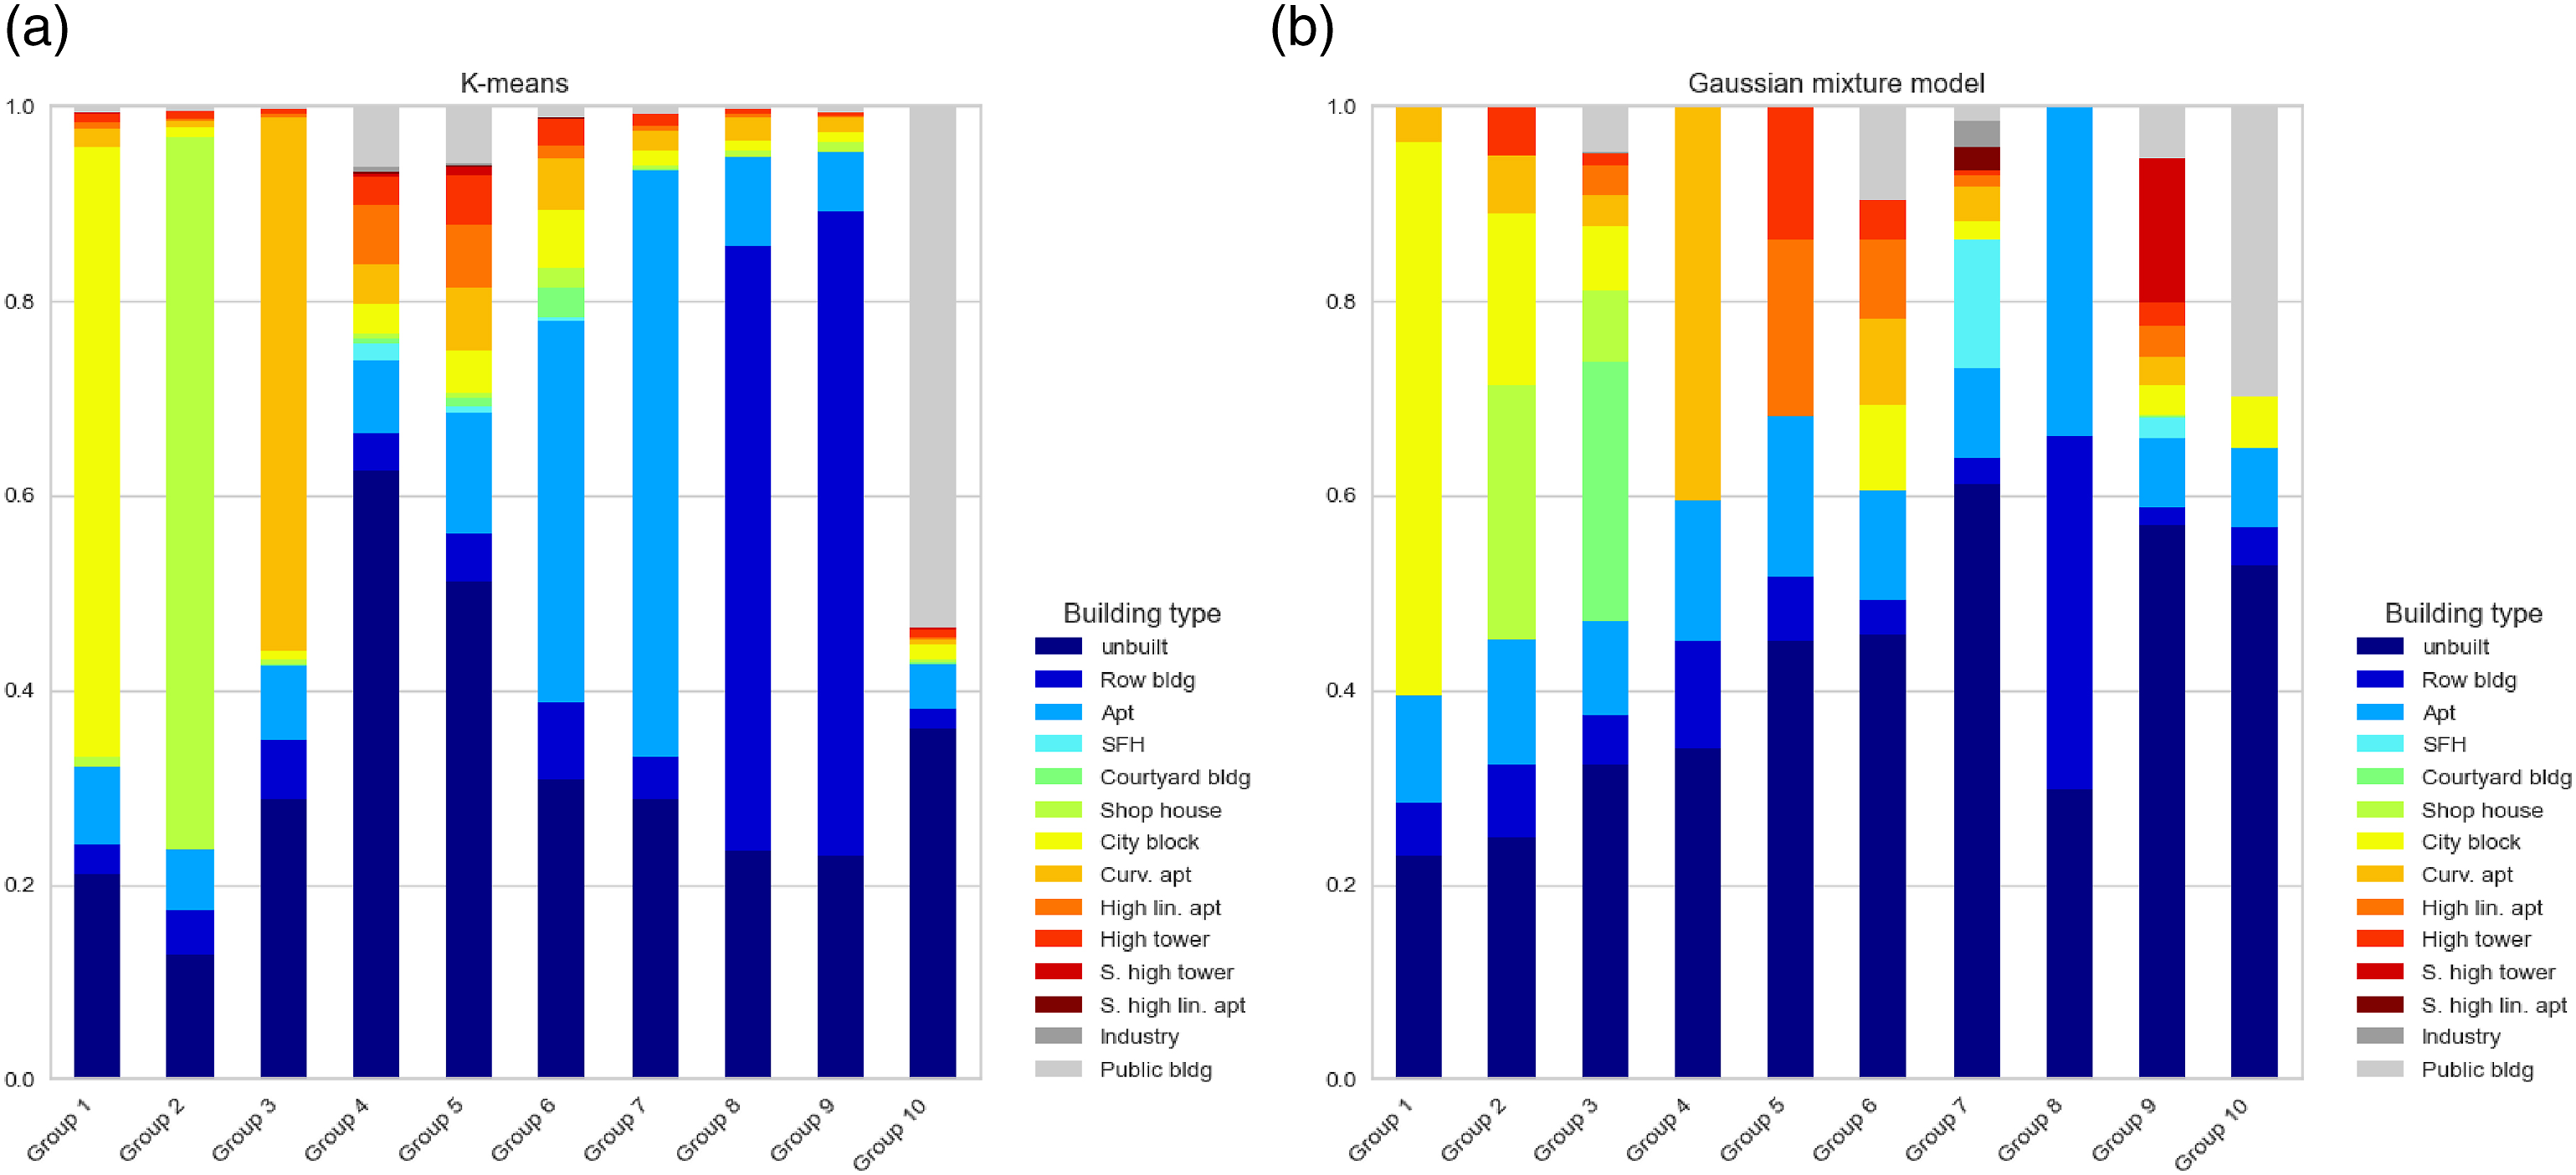
We further compared both models with box plots (Figure 5). Among them, group 2 of the k-means model has the highest built density and least open spaces, which represents the narrow and densely built historic shopping streets (Figure 6). In contrast, group 4 and 5 are street-blocks with modern tall buildings, which have the lowest density and more open spaces. Apartments and row buildings are common residential constructions in Taipei, while the former has slightly lower built density and more open spaces. Overall, clusters from the k-means model differentiate themselves better than the GMM model, as each cluster has its unique value ranges and has fewer outlier. This result is in accordance with the building composition in Figure 4, in which clusters from the GMM model are more complex and therefore more heterogeneous within groups. Instead of finding the simpler and more “classic” block types, the GMM model was robust against street-blocks with mixed composition and therefore set the cluster centers on those kinds of blocks. Concerning the aspects related to land-use policies and sustainability, the result from k-means of the given dataset and methods may be more suitable for urban planning practices. Density, degree of open space, and block area of the block types in Taipei. All numbers are scaled from 0 to 1.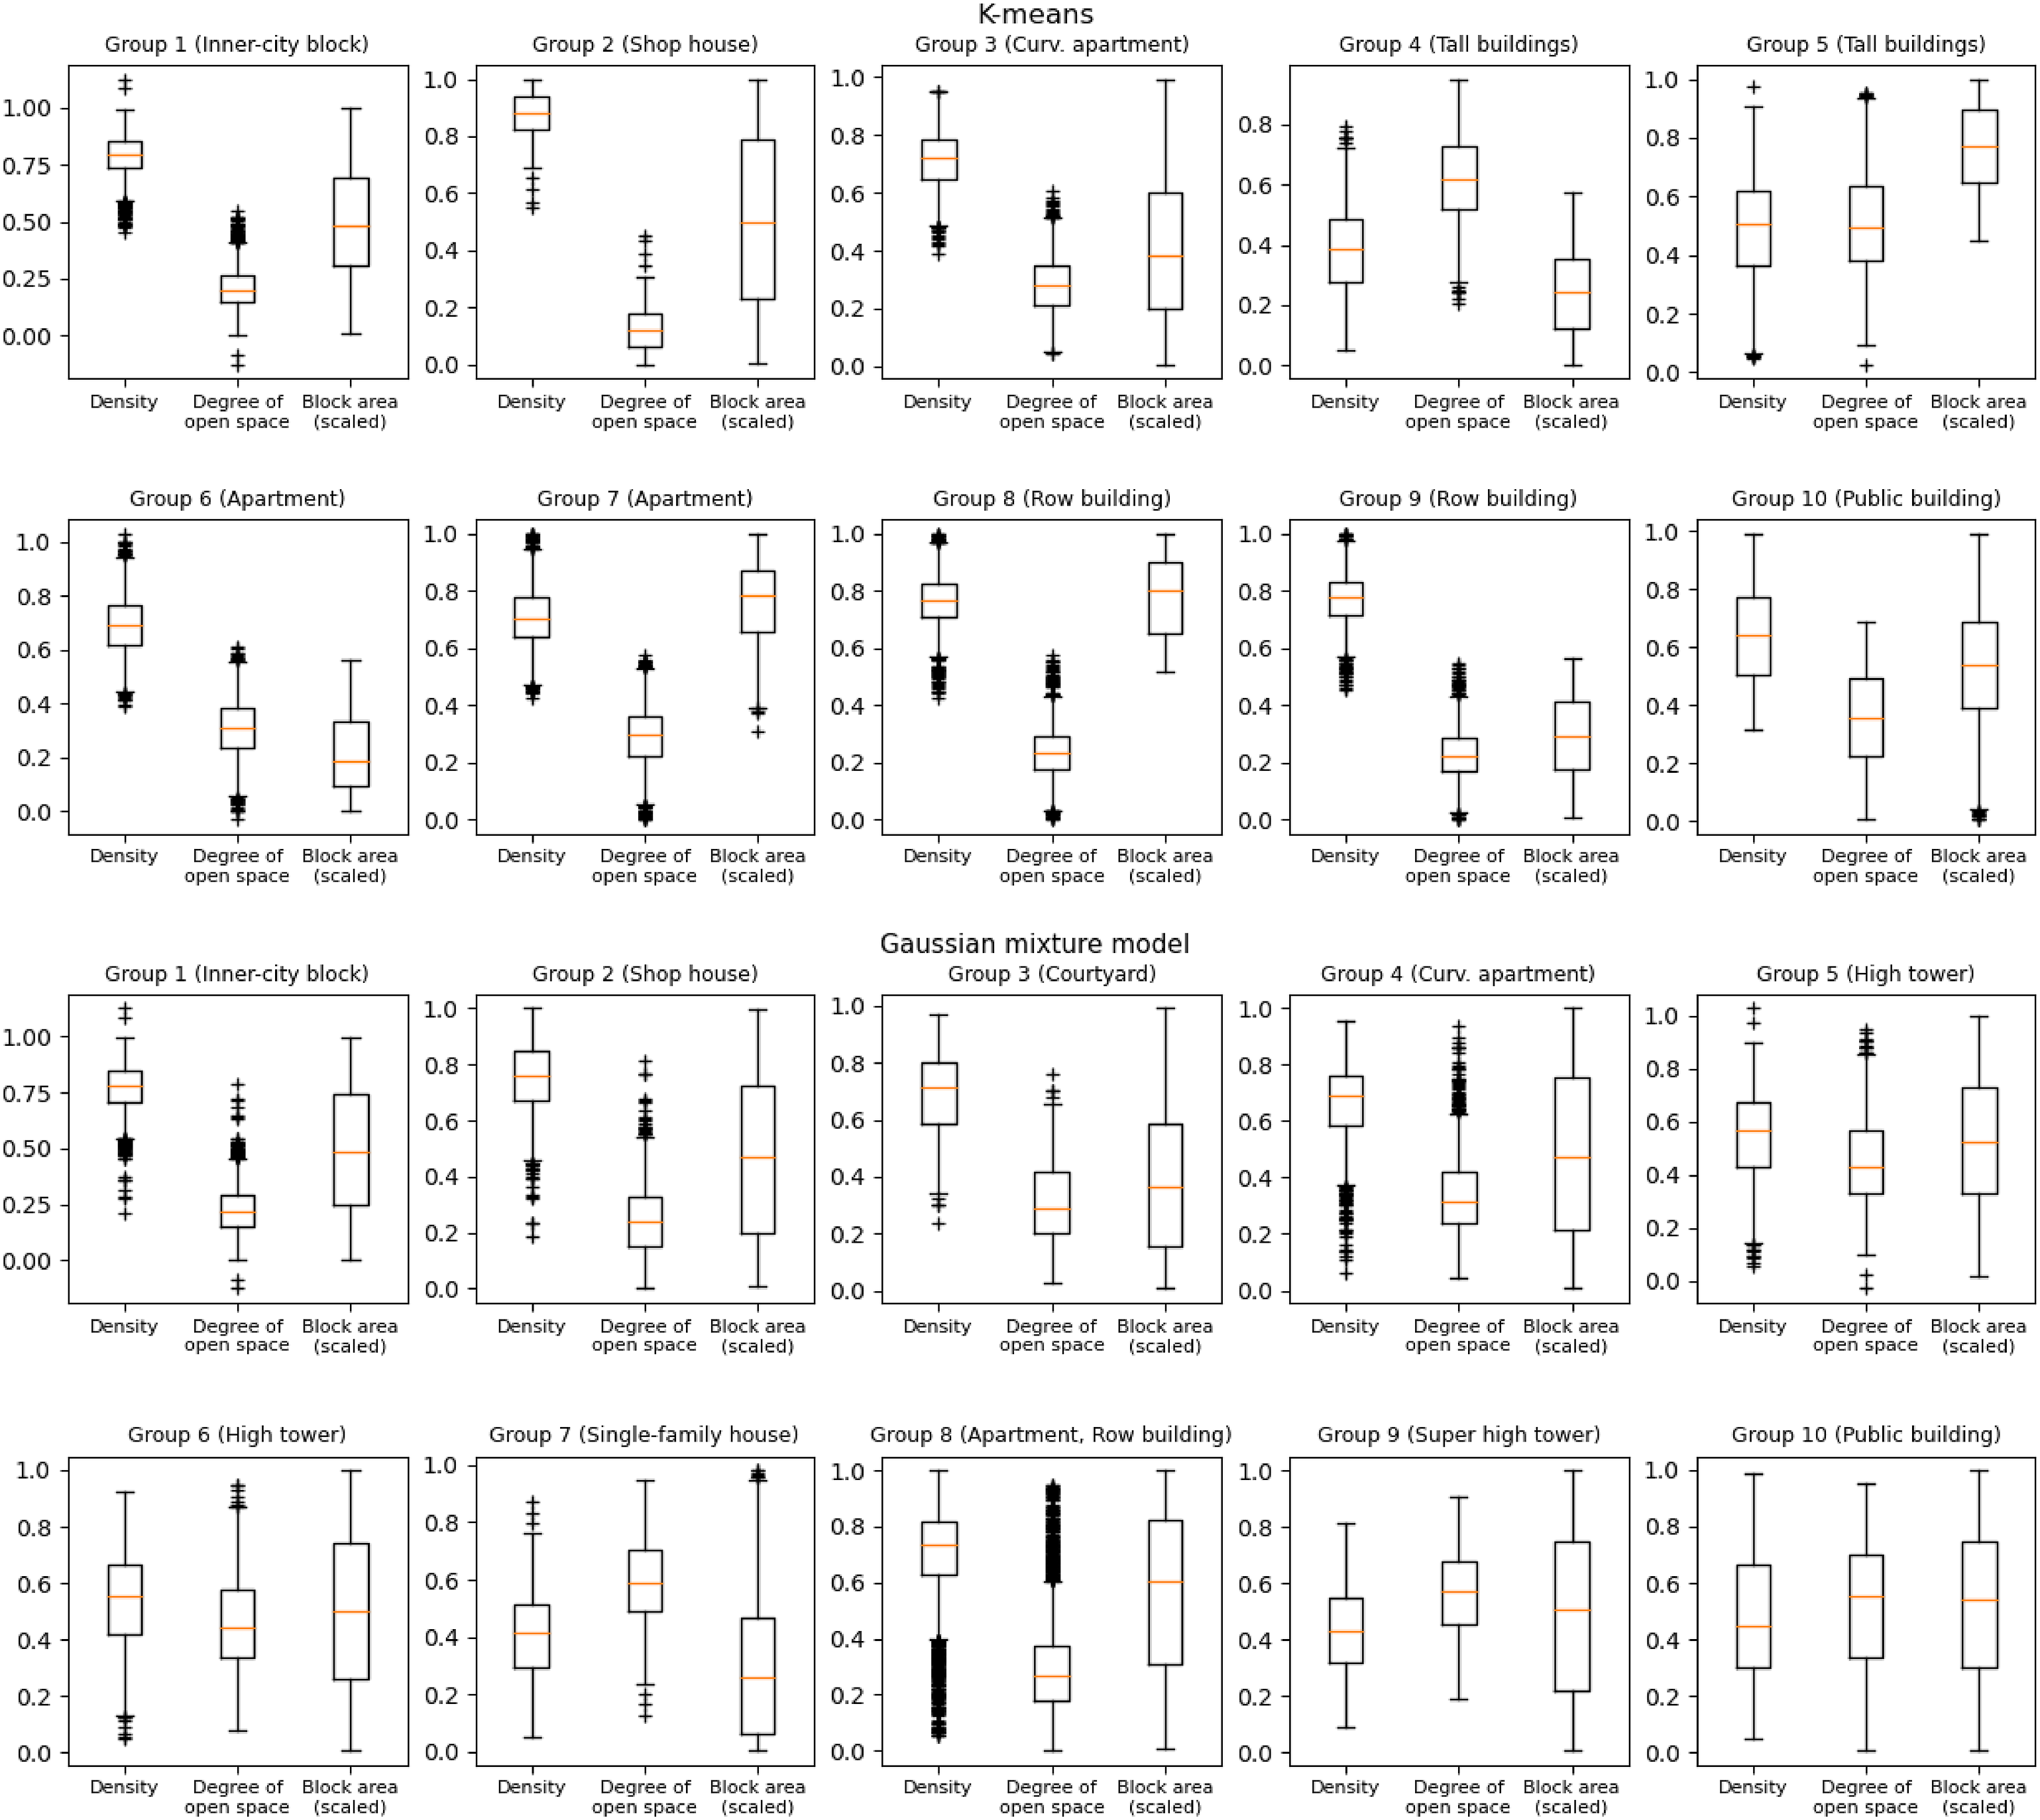
Discussion
This article compared four state-of-the-art machine-learning algorithms for automatic building classification. For the given dataset and methodology, after hyperparameter tuning, we found that gradient boosting models substantially increased the overall accuracy, and their performance greatly exceeded other conventional models such as RF and ANNs. In particular, our study found that LightGBM produced the highest overall accuracy in both training and testing datasets within a very short run time.
However, the accuracy rates of the same algorithms such as RF and ANNs were found approx. 20% lower in Taipei than the study by Hecht (2014). The possible reason could be differences in building types and the information on the topographic map. Building types in Taipei with higher accuracy are mostly similar to those in Western cities, for example, single-family houses, apartments, and row buildings. While East Asian specific types such as shophouses and tall buildings tend to have lower accuracy. Many of these buildings have similar footprints but very different vertical dimensions and functions. Moreover, the models in this study relied on different features in building classification as Hecht’s study (2014) of European cities. In Taipei, building heights and more complicated geometric features such as length-width ratios of MBR and shape indexes are more important in the decision-making. This implies that building types in Taipei are much variant in the vertical dimension. Potential ways to improve the results include using more-detailed datasets such as 3D-city models or using deep-learning algorithms for image segmentation.
At the block level, we used building-type ratios of the blocks as input features, which is different from prior studies (Fleischmann et al., 2021; Gil et al., 2012; Hermosilla et al., 2014; Ma et al., 2021) that used the average value of building height, building coverage, and building distance as input data. However, in East Asian mega-cities where street blocks are highly heterogeneous, averaging building features may have misleading results. While building-type ratios keep information about the geometric and functional features of individual buildings, it also efficiently reduced the number of input features for clustering models and made the result easy to interpret. For the given dataset and methods, the results of block clustering showed that the k-means model accurately identified homogeneous blocks such as inner-city blocks, row-building blocks, and apartment blocks, whereas the GMM model focused more on the various mixed blocks and different tall buildings. For practical purposes, we chose the clustering result from the k-means model for more distinguishable form features.
In comparison to Western cities, Taipei has a high proportion of tall-building blocks. The city is primarily made up of apartments, row buildings, curvilinear apartments, and high-rise linear buildings, which differs from the courtyard buildings common in Western cities. The old city center in Taipei is made up of inner-city blocks and shophouses, and its boundary is spread out and blended in the rest of the city. Because the buildings are well-mixed, many street-blocks in Taipei are identified as mixtures of several building types. For example, row-building blocks (Figure 4(a), group 8, 9) usually contain some apartments at street corners. In fact, this is a very common phenomenon in contemporary mega-cities as a result of the land use zoning, where building-coverage ratios and floor-area ratios are regulated in the block level, which gives architects much freedom in deciding building sizes and volumes within a street-block. With the use of big-data and machine-learning methods, we were able to shed light on this phenomenon in detail.
Conclusion
This paper discusses the seldomly analyzed urban forms in East Asian mega-cities by using a two-level approach to automatically generate block typologies. In the building level, we used the topographic map, building licenses, streets, and cadastral maps to extract input features for the building classification. The result showed that even without the state-of-the-art 3D-city models, this method reached an accuracy rate of 80% by using supplementary sources and gradient boosting models. In the block level, we used clustering methods based on building-type ratios to explore block typologies. The result showed that the street-blocks in Taipei may be categorized in different ways depending on the choice of clustering algorithms. We evaluated the clusters based on building types, density, open spaces, and block areas, which are the aspects related to land-use policies and sustainable urban developments.
As most East Asian cities still lack sufficient urban-form data, this approach would be an efficient and low-cost alternative to analyze urban landscapes. Especially for cities such as Taipei which has fewer building regulations, the method can help to keep track of changes in the urban development. The result also provides detailed information of the mega-city scale, which serves as a crucial spatial reference for sustainable development strategies. The block typologies, which implies construction periods, density, and functions, support a type-based strategic plan for urban issues such as urban regeneration, mitigation of urban heat island effects, and allocation of infrastructure. The two-level information provides the possibility to localize potential urban planning interventions such as areas of re-densification, climate adaptation measures, or areas which require new zoning regulations. Although urban forms have regional and size differences (Hecht, 2014; Steiniger et al., 2008), this approach may be applied in other contexts with pre-collected training data. The sampling process may be time-intensive if no existing data is available. However, the amount of work can be reduced for future studies by building an open-source library to provide pretrained building-classification models and sample data, which will not only improve the model accuracy and efficiency but also increase the applicability in other cities.
Supplemental Material
Supplemental Material - Developing a two-level machine-learning approach for classifying urban form for an East Asian mega-city
Supplemental Material for Developing a two-level machine-learning approach for classifying urban form for an East Asian mega-city by Chih-Yu Chen, Florian Koch and Christa Reicher in Environment and Planning B: Urban Analytics and City Science
Footnotes
Author’s note
We declare that this manuscript is original, has not been published before, and is not under consideration for another journal. As Corresponding Author, I confirm that the manuscript has been read and approved for submission by all authors.
Declaration of conflicting interests
The author(s) declared no potential conflicts of interest with respect to the research, authorship, and/or publication of this article.
Funding
The author(s) disclosed receipt of the following financial support for the research, authorship, and/or publication of this article: This work was supported by the PhD grant by Ministry of Education, Taiwan.
Supplemental Material
Supplemental material for this article is available online.
References
Supplementary Material
Please find the following supplemental material available below.
For Open Access articles published under a Creative Commons License, all supplemental material carries the same license as the article it is associated with.
For non-Open Access articles published, all supplemental material carries a non-exclusive license, and permission requests for re-use of supplemental material or any part of supplemental material shall be sent directly to the copyright owner as specified in the copyright notice associated with the article.