
Abstract
Building usage is an important variable in modelling the energetic, material and social properties of a building stock. Gathering this data on large geographical scale, and in the necessary temporal and spatial resolution, that means, on building level, is a challenging task. Machine Learning algorithms like Random Forest have proven useful in predicting building-related features in the past but often resort to training sets of limited geographic scope, for example, cities. This study presents a workflow of predicting the semantic attribute of usage on the level of individual buildings. Based on screening data of the previous ENOB:dataNWG project, a novel building ground-truth data set distributed across Germany, a Random Forest algorithm is used to assess how the German building stock can be classified according to its residential or non-residential use. Different sampling strategies had been applied in order to find a robust evaluation metric for the classifier. Furthermore, the relevance of the feature set is highlighted and it is examined whether regional differences in classification quality exist. Results show that a classification of residential and non-residential building footprints has good prospects with an AUC of up to 0.9.
Keywords
Introduction
Motivation
Knowledge about structure and dynamics of the building stock is an important prerequisite for taking measures promoting a socially just and resource-efficient design of the built environment (Creutzig et al., 2016; Zhu et al., 2019). Buildings and their spatial distribution have been shown to be an important proxy for estimating population figures and studying urbanization processes (Kunze and Hecht, 2015; Biljecki et al., 2016; Tomás et al., 2016; Sturrock et al., 2018; Wardrop et al., 2018; Jochem et al., 2020; Schug et al., 2021). Furthermore, energetic retrofitting of the building stock, its share of anthropogenic material stocks and vulnerability to natural hazards are topics that have become more important in recent years. Besides geometric properties of buildings and age, their use is an important, yet still often unknown, variable when it comes to analysis in the mentioned fields (Pauliuk and Müller, 2014; Cheng et al., 2018; Dabbeek and Silva 2020; Haberl et al., 2021).
The sheer amount of geometric data about buildings has grown in the past decades, both in coverage and levels of detail. A variety of data sources (e.g. official statistics like census, cadastre, voluntarily collected Geographical Information (VGI), remote sensing) and models (tabular, 2D vector, 3D, raster) come into consideration for analysis purposes, and often the merging and integration of these data is necessary (Hecht et al., 2019); Evans et al., 2019; Schug et al., 2021). The challenge is to achieve results at the finest possible resolution – ideally at building level. Appropriate standardization for building modelling has been advanced with CityGML and National Mapping and Cadastral Agencies offer products in the form of 2D building footprints and 3D building models (e.g. OS MasterMap Topography Layer® (UK), 3D building models LoD1 (Germany)). Nevertheless, the situation is very uneven from country to country and especially at global scale. According to the Global Open Data Index, only 10% of the surveyed countries had freely available small-scale national maps in 2016 (GODI, 2016). It must be assumed that the share of countries that can provide building data is even lower. In order to increase the global coverage of these important data sets, remote sensing projects such as Global Urban Footprint (GUF, 2022), Global Human Settlement Layer (GHSL, 2022), World Settlement Footprint (WSF, 2022), Microsoft Building Footprints (MBF, 2022) and VGI initiatives such as the Missing Maps project (MMP, 2022) and the Humanitarian OpenStreetMap Team (HOTOSM, 2022) have made attempts to derive and map settlement respectively building footprints.
The grown number of data sources leads to the aspect of harmonization and standardization in order to make them ready-to-use for analysis purposes. With regard to European Union (EU), the INSPIRE (Infrastructure for Spatial Information in the European Community) Directive was an impulse for transnational standardization, interoperability and availability of official geodata inventories (Vancauwenberghe and Van Loenen, 2018). Consistency and accuracy at the semantic and geometric level are important quality elements of geodata (ISO19157, 2013). The aforementioned VGI, such as OpenStreetMap (OSM), have increased accessibility to building data and can be spatially very up-to-date and accurate (Brovelli and Zamboni, 2018). However, this is not necessarily true for the semantics and attribute data (Haklay, 2010; Kunze and Hecht, 2015), especially since the data can be edited improperly (Juhász et al., 2020).
Recently, German federal authorities have more and more adopted open data strategies, which enhanced public access to official geo data products (Open Government Germany, 2019). In most federal states building footprints and 3D building models are freely available. Official geo data in Germany fulfil spatial quality criteria and, in the case of 3D building models, are also provided with standardized semantic attributes (AdV, 2021). However, these object catalogues can be interpreted differently by the federal state authorities, and further standardization is the goal of current efforts. A nationwide assessment of the situation in the building stock is therefore not trivial (BBSR, 2013; Schwarz et al., 2021). Furthermore, collecting and updating attributes for a large number of buildings requires a great deal of effort. In consequence attributes like building use, or numbers of stories are still in some cases not known or outdated.
Related work
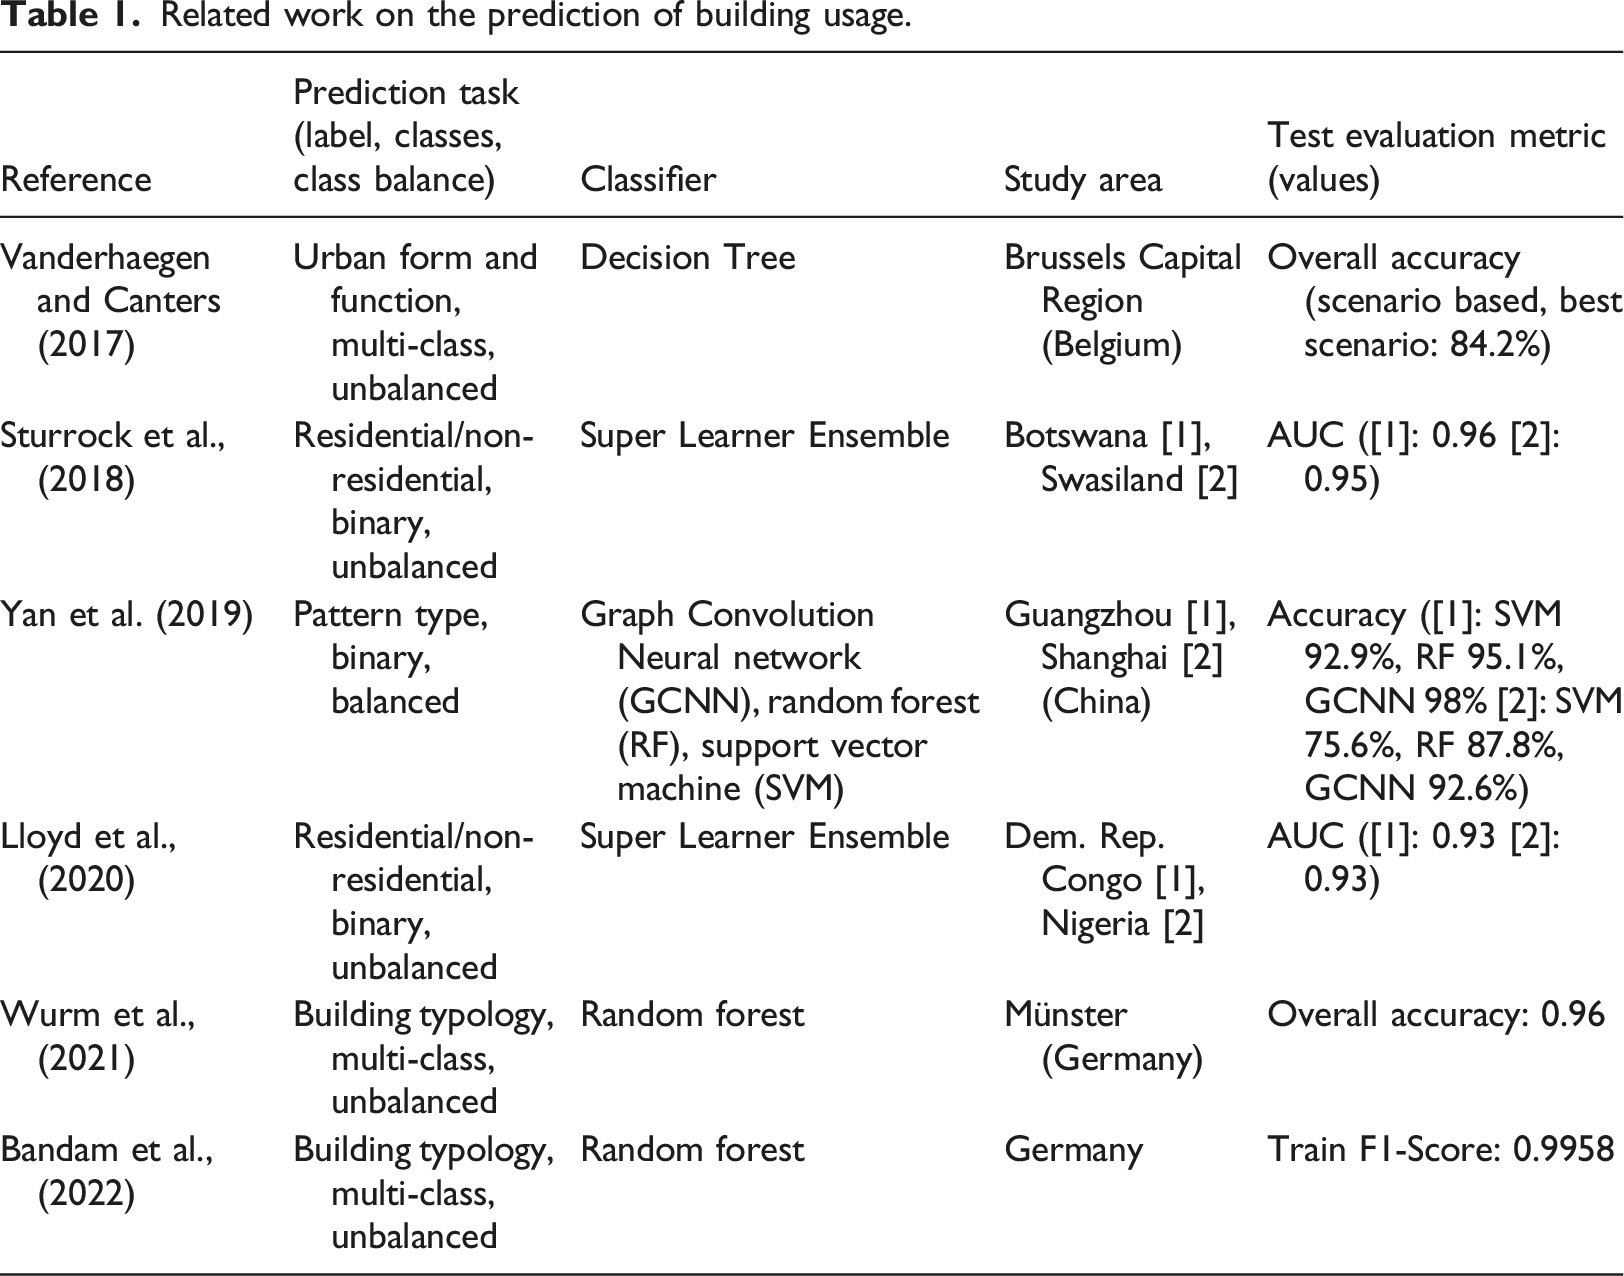
Related work on the prediction of building usage.
Aim of this study
Referring to the challenge of missing or lacking ground-truth data, we aim on using a state of the art classifier model on a novel ground trothed reference data set. For the present study, it was possible to use data from a nationwide representative survey of 89,000 buildings, it is therefore of particular interest how a classifier model can be built on this reference data set. In summary, it can be stated that, despite grown amounts and better availability of building-related geo data, semantic attributes on level of a single building are often not accessible or not of sufficient quality. The contribution that machine learning can make to closing knowledge gaps with regard to semantic attributes of building use, respective residential and non-residential, is subject of this paper.
The following research questions arise from the background obtained from the literature review. (1) How well can residential and non-residential buildings be distinguished by means of Random Forest Classification? (2) Which features are particularly relevant for the classification? (3) Are there regional differences in the quality of classification?
The basic hypothesis is that there is a function-form relationship at the level of buildings, which, mediated by numerical characteristics, enables at least a binary classification of the stock. After this introduction, the second section will inform about the data basis and method. This is followed by a presentation of results and discussion. In the last section, conclusions and future perspectives are given.
Data and method
Reference data and study area
The data used is an outcome of a national stratified random sample of 100,000 buildings drawn from 48 million building footprints in the official German real estate cadastre (ENOB, 2020). In a second step, on-site screenings of the sample objects were carried out. Via a mobile application data on building boundaries, age, types of use, façade condition, owners was collected. Not all sample objects had been accessible, but in this way, a data set of 84,001 screening objects was created and 20,056 residential buildings (RB) and 63,945 non-residential buildings (NRB) were thus available. Since imbalanced data sets could lead to classifications biased towards class majorities, counterstrategies can be applied directly on the data set, or by adapting the classification model (Santos et al., 2018). Garbasevschi et al. (2021) used a combination of oversampling minority (synthetic minority oversampling technique – SMOTE) and under sampling majority in order to classify building age in cities of the state North Rhine-Westphalia with an approx. 69% majority in a multi-class data set. In our study, different training class balances are generated within the cross-validation loop, in order to assess the impact on classifier performance (see Results).
Model
For the classification problem, we use the three-based Random forest as a learning algorithm. During this process, not only one decision tree is formed, but several trees by means of random subsets of the data. Their classification results are combined into an overall result for the respective data point by means of a voting procedure (Breiman, 2001). An advantage of the Random Forest method is its ability to assess the importance of the features used (feature importance). In the original version of the method, this is determined by the Gini Importance or the Mean Decrease of Impurity at the nodes (Breiman, 2001). As random forest applications became more widespread, it became apparent that impurity-based feature importance tends to be biased when a: features occur that are categorical or of low cardinality, or b: correlated features enter the classification. To overcome these Issues, aside from different implementations of random forests, Strobl et al., (2008) recommend using permutation importances without bootstrapping in random forest models.
In the classical implementation of random forests in R libraries and Python packages, there are a number of hyperparameters by which the performance of the model can be influenced. The most important of these are the number of trees in the model (n_estimators or ntree), and the number of features considered per partition (max_features). In the software, values of these parameters are often pre-set, and an adjustment to the specific task may be necessary. The most favourable selection of the hyperparameters (n_estimators = 500, max_features = 8, bootstrap = False) was made by a grid search with 3-fold cross-validation. However, the influence of these settings on the F1-score of the grid search was marginal. Only the number of trees was changed in the following runs, aiming at minimal run times.
Feature set
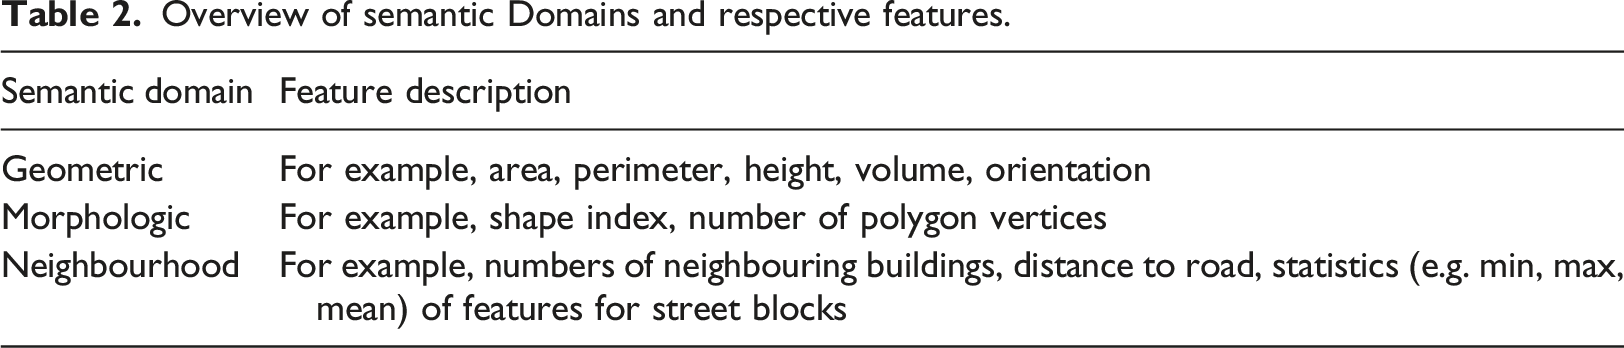
The features are based on the hypothesis of the function-form relationship, according to which individual geometric/morphological properties can be important for the classification. As a consequence of Tobler’s law (Tobler, 1970), it is further assumed, that also properties of neighbour objects should be taken into consideration. Another decisive factor for the selection of a specific feature was the applicability and implementability for vector data. A vector-to-raster conversion, in order to be able to calculate raster-based features, was not carried out. The features are calculated for the buildings defined from the screening phase of the ENOB:dataNWG project. From a structural point these buildings can consist of more than one building footprint in the official HU-DE.
The feature type represents the semantic domain of the feature; these are geometry (e.g. area and perimeter), morphology (shape description) or neighbourhood of the object. In order to calculate neighbour and block based metrics, official building footprints with additional building height information have been used to fill the street blocks. For the definition of the street blocks, the axes of roads and driveways were extracted from the official German basic landscape model ATKIS (FCG, 2022), low-ranking roads were neglected. These linear features had been converted into polygons and spatially intersected with the building objects. On this basis, block-specific statistics were calculated for individual features.
Shape-describing features establish a relationship between the geometric parameters perimeter and area of the footprint polygon. A value for the area alone does not allow a statement about the shape of a geometric figure. However, if the geometric parameters are combined in an index, the similarity between a certain polygon and, for example, a circle or an ellipse can be estimated. In the broadest sense, these so-called ‘shape’ metrics are also measures of the compactness or indirectly the complexity of a building footprint. One assumption for the significance of these characteristics is that simple shapes tend to predominate in the residential building sector. Complex and less compact footprints would therefore predominantly occur in the area of non-residential buildings. In the literature (e.g. Maceachren, 1985; Steiniger et al., 2008; Wurm et al., 2016), a number of other compactness measures for different areas of application are discussed in addition to shape indices.
Overview of semantic Domains and respective features.
The workflow is depicted in Figure 1. Based on the combination of screening data footprints, HU-DE building footprints and ATKIS road data, the feature engineering leads to numeric expressions of properties for the screening data footprints. These are input variables for the random forest training and classification. Workflow consisting of data fusion, feature processing, sampling and cross-validation. The evaluation metric of the 10-fold cross-validation is used to interpret the block cross-validation.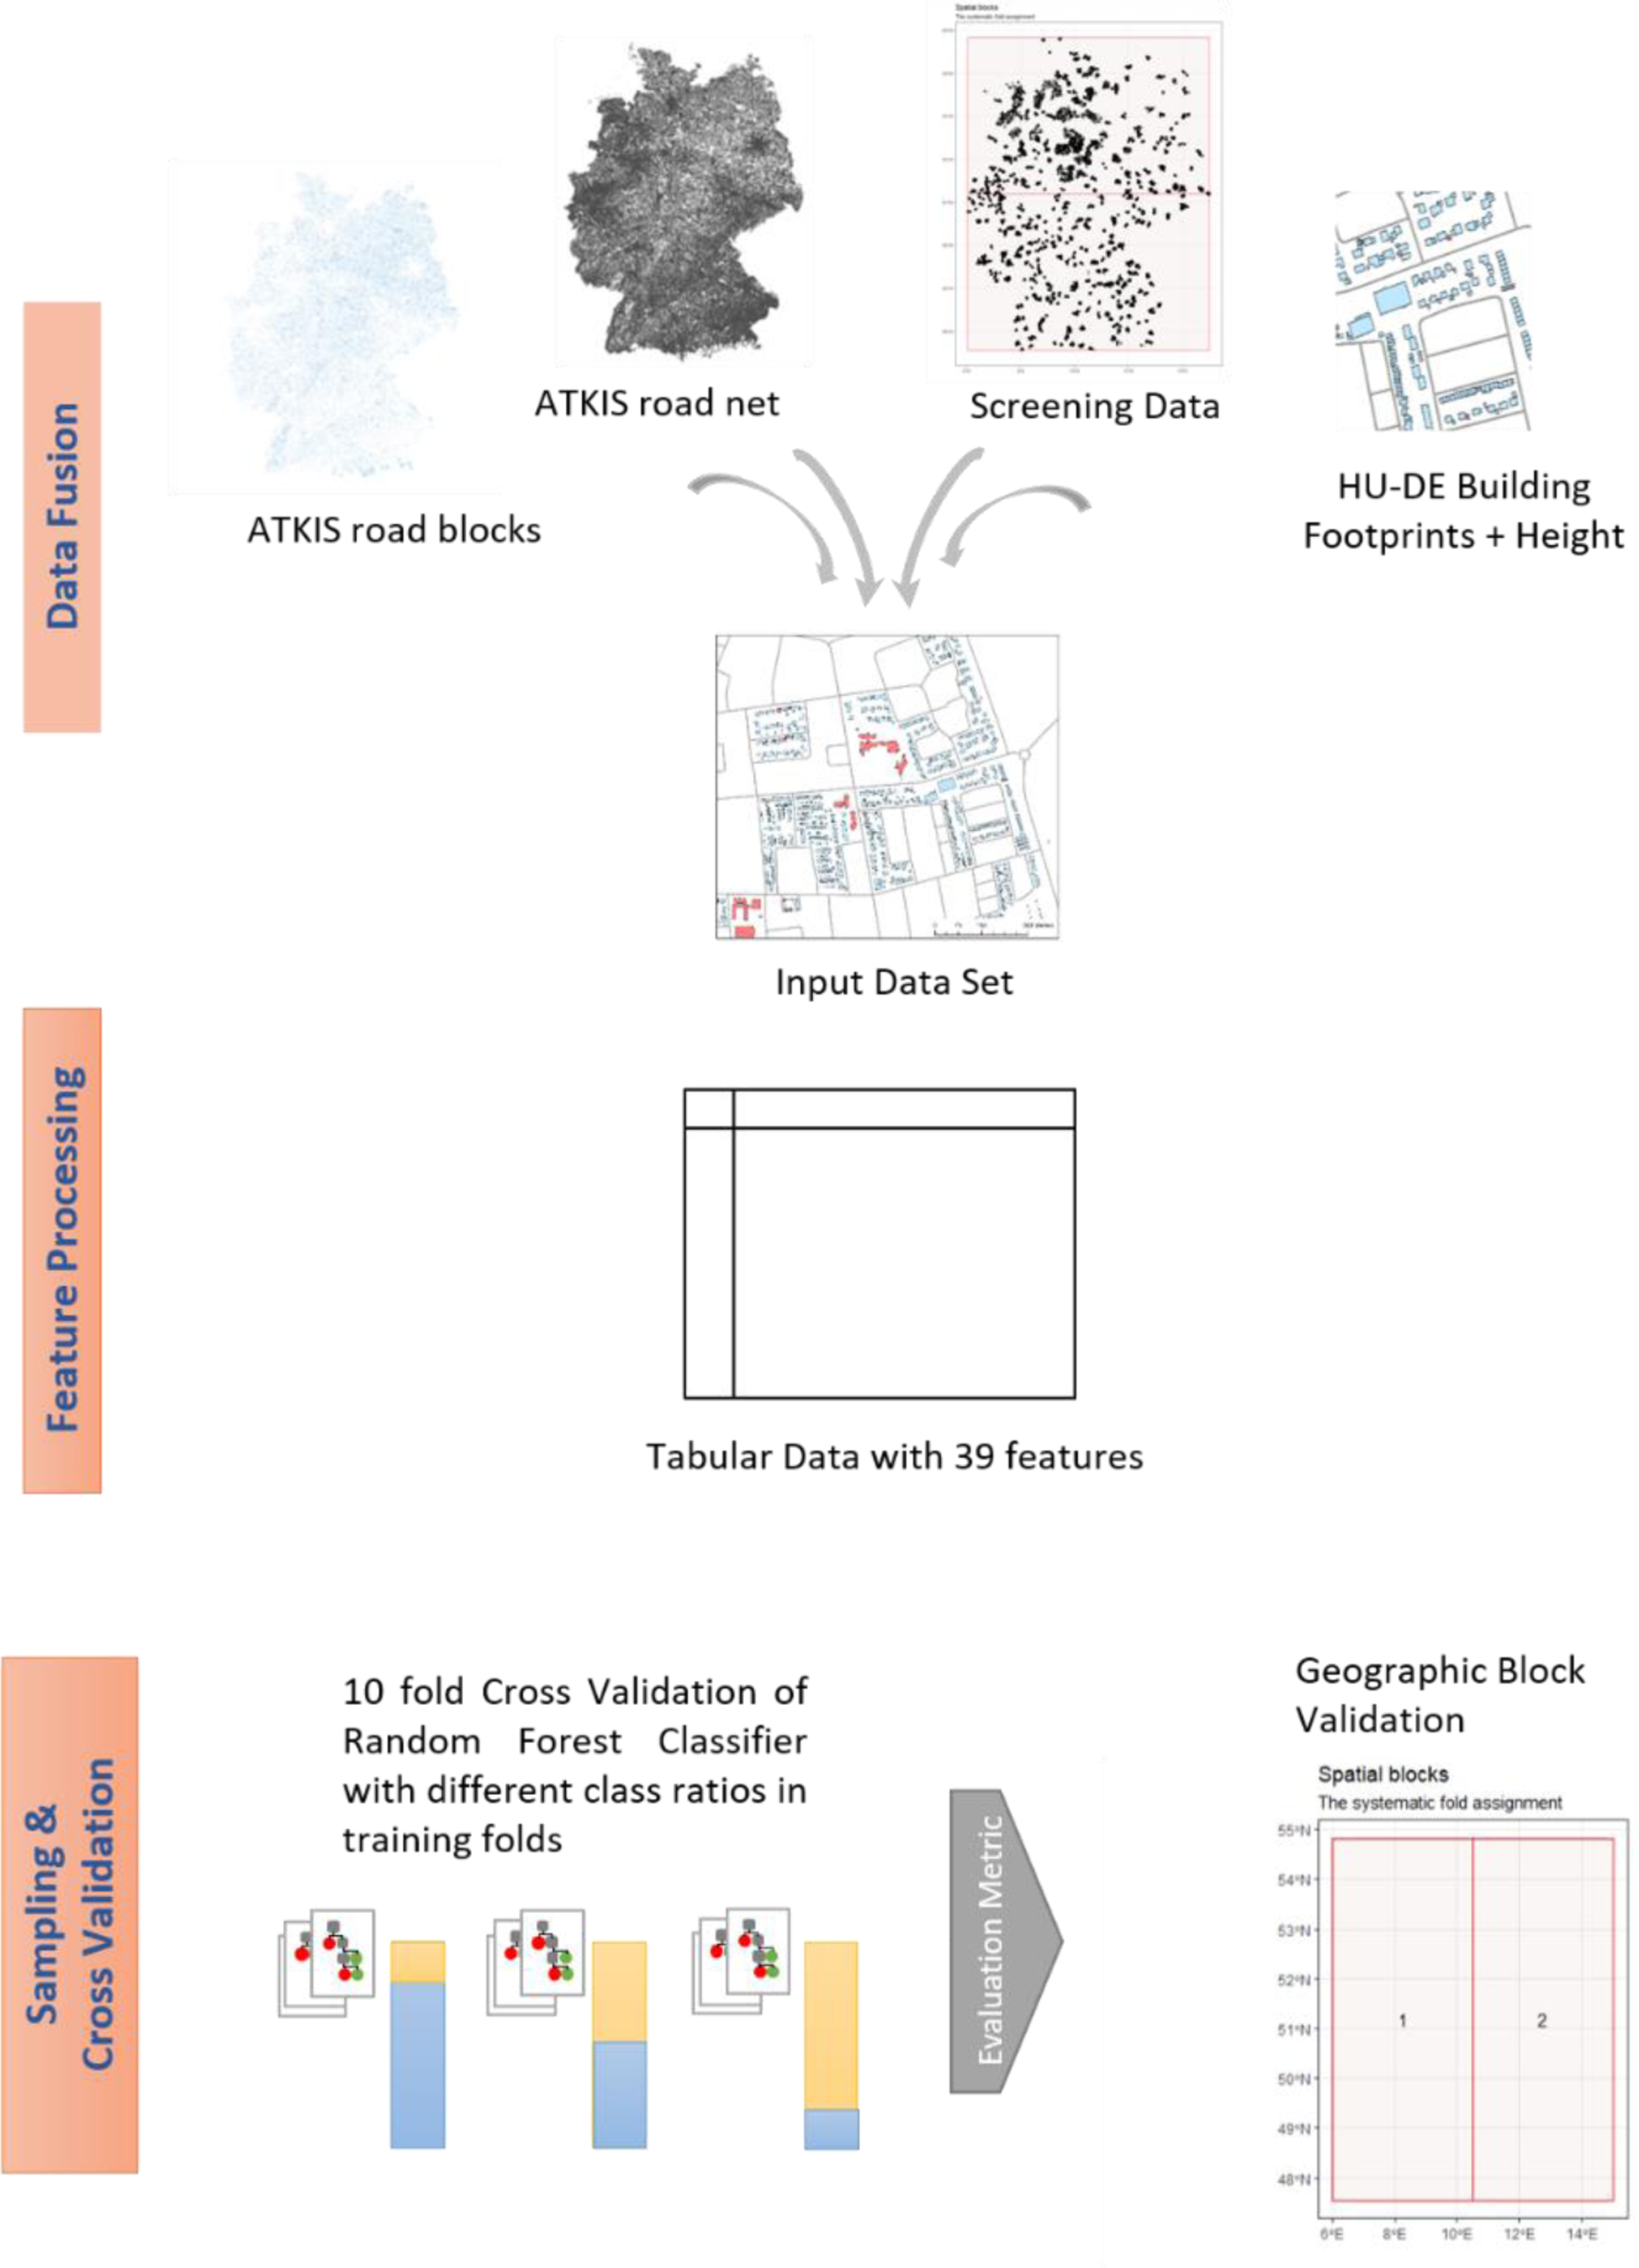
Cross-validation and sampling
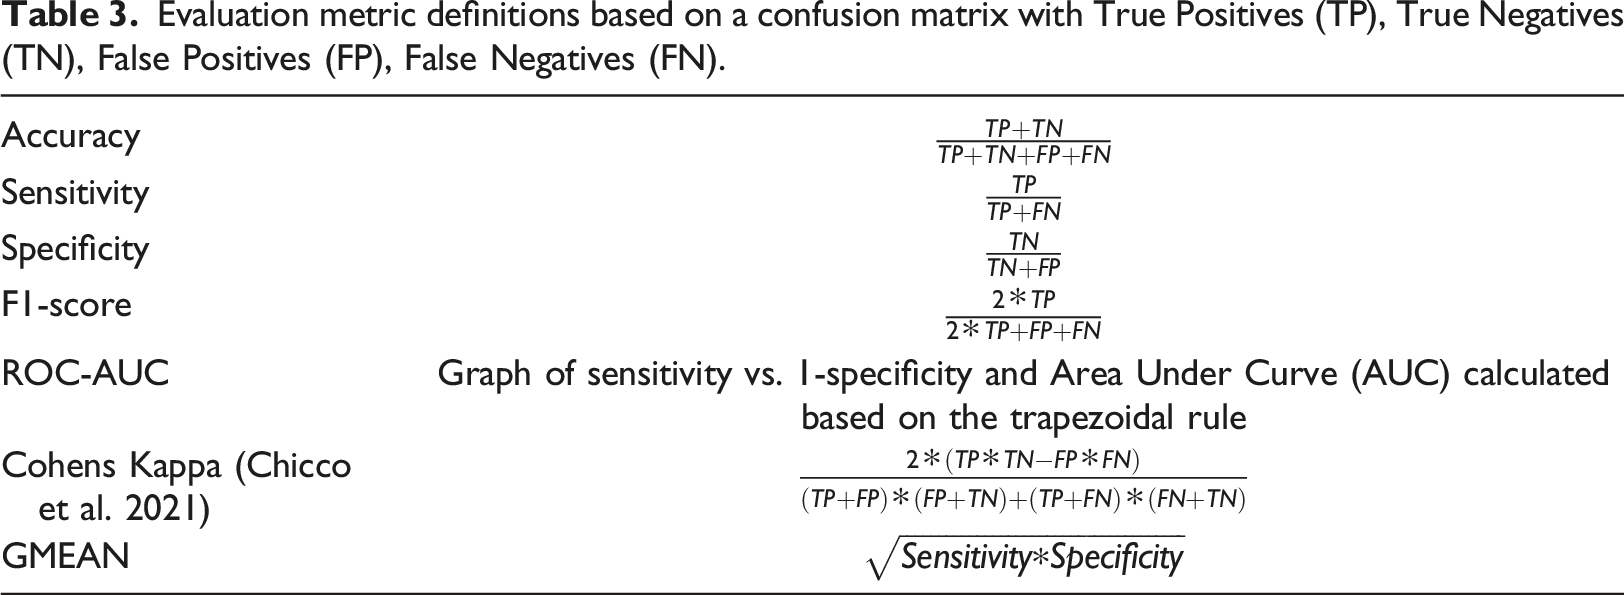
Evaluation metric definitions based on a confusion matrix with True Positives (TP), True Negatives (TN), False Positives (FP), False Negatives (FN).
Another method of cross-validation takes the spatial distribution of the folds into account. The motivation came from the assumed spatial autocorrelation in the data between different regions. The R library blockCV (Valavi et al., 2019) allows the creation of folds that represent geographically defined blocks within the study area. Polygonal grids, buffers or strips along the latitudes or longitudes can be formed. We so far did not plan to cross-validate federal states or specific administrative regions in Germany against one another, since the coverage of the data would require more detail in this case. Hence, for the investigation of the model, the folds were created by strips along the latitude and longitude circles. Their number was varied and two, three and five folds were formed.
Implementation
ESRI ArcGIS Pro and Python, as well as R (R Core Team, 2020) were used to carry out the analyses. The classification procedures and validations are implemented and documented in the Scikit-Learn Python library (SKL, 2021). The spatial cross-validation is based on the R library blockCV (Valavi et al., 2019) and the corresponding implementations of the Random Forest algorithm (Breiman, 2001). The hardware consisted of a workstation with 64 GB RAM and a 12-core Intel Xeon processor.
Results
The following sections present the results of the cross-validation approaches. A standard 10-fold cross-validation is used to assess model performance under different class balances. In comparison, a spatial cross-validation is used to assess the influence of region effect in the model. Afterwards specific use categories and feature importance are viewed in more detail.
Cross-validations and sampling
Data sampling.
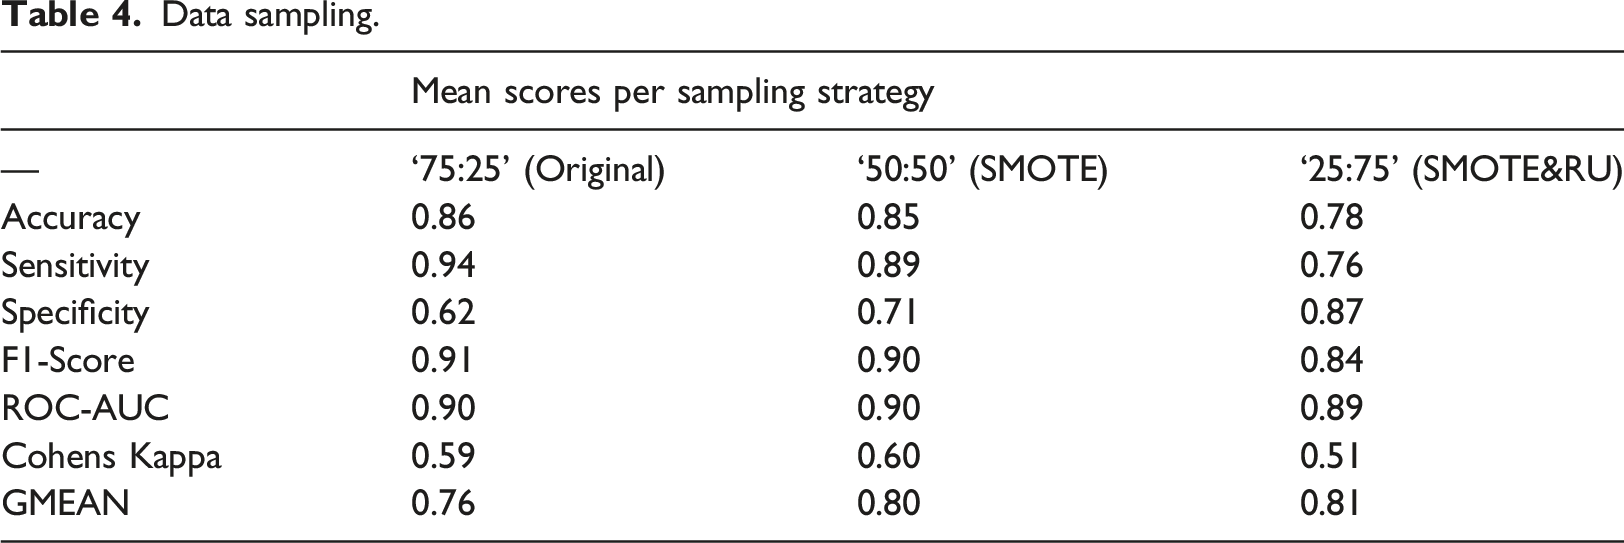
Metrics that are related to one side of the classification, are strongly affected by the change in class ratios. A higher rate of residential buildings in the training set (‘25:75’) leads to a higher specificity, that is, sensitivity of the residential class, in the test. Likewise sensitivity (of the non-residential class) drops in the setting of inverted class ratio. Combined metrics, like ROC-AUC (0.89–0.9) and GMEAN (0.76–0.81), remain relatively stable throughout the settings. It is assumed that ROC-AUC is a good representation of the classifiers ability to separate the classes. Since we aim on separating residential and non-residential buildings, we put equal weight on true positive and true negative predictions of the model. This is also reflected in ROC-AUC metric and it is used to report on the models performance under the different geographic settings of the following block cross-validation.
Block cross-validation
The block cross-validation was performed in the reference system WGS84, in a way that the area of Germany was divided into stripes along longitude and latitude circles. Per run 2, three and five folds had been created, so that the north-south resp. west-east partition becomes more detailed with a higher number of folds (Figure 2). The number of partitions was chosen to be not higher than 5, as a higher number would be more difficult to interpret with the given pattern. Geographic zones used in block cross-validation. The distribution of screening buildings shown in sub images a and d.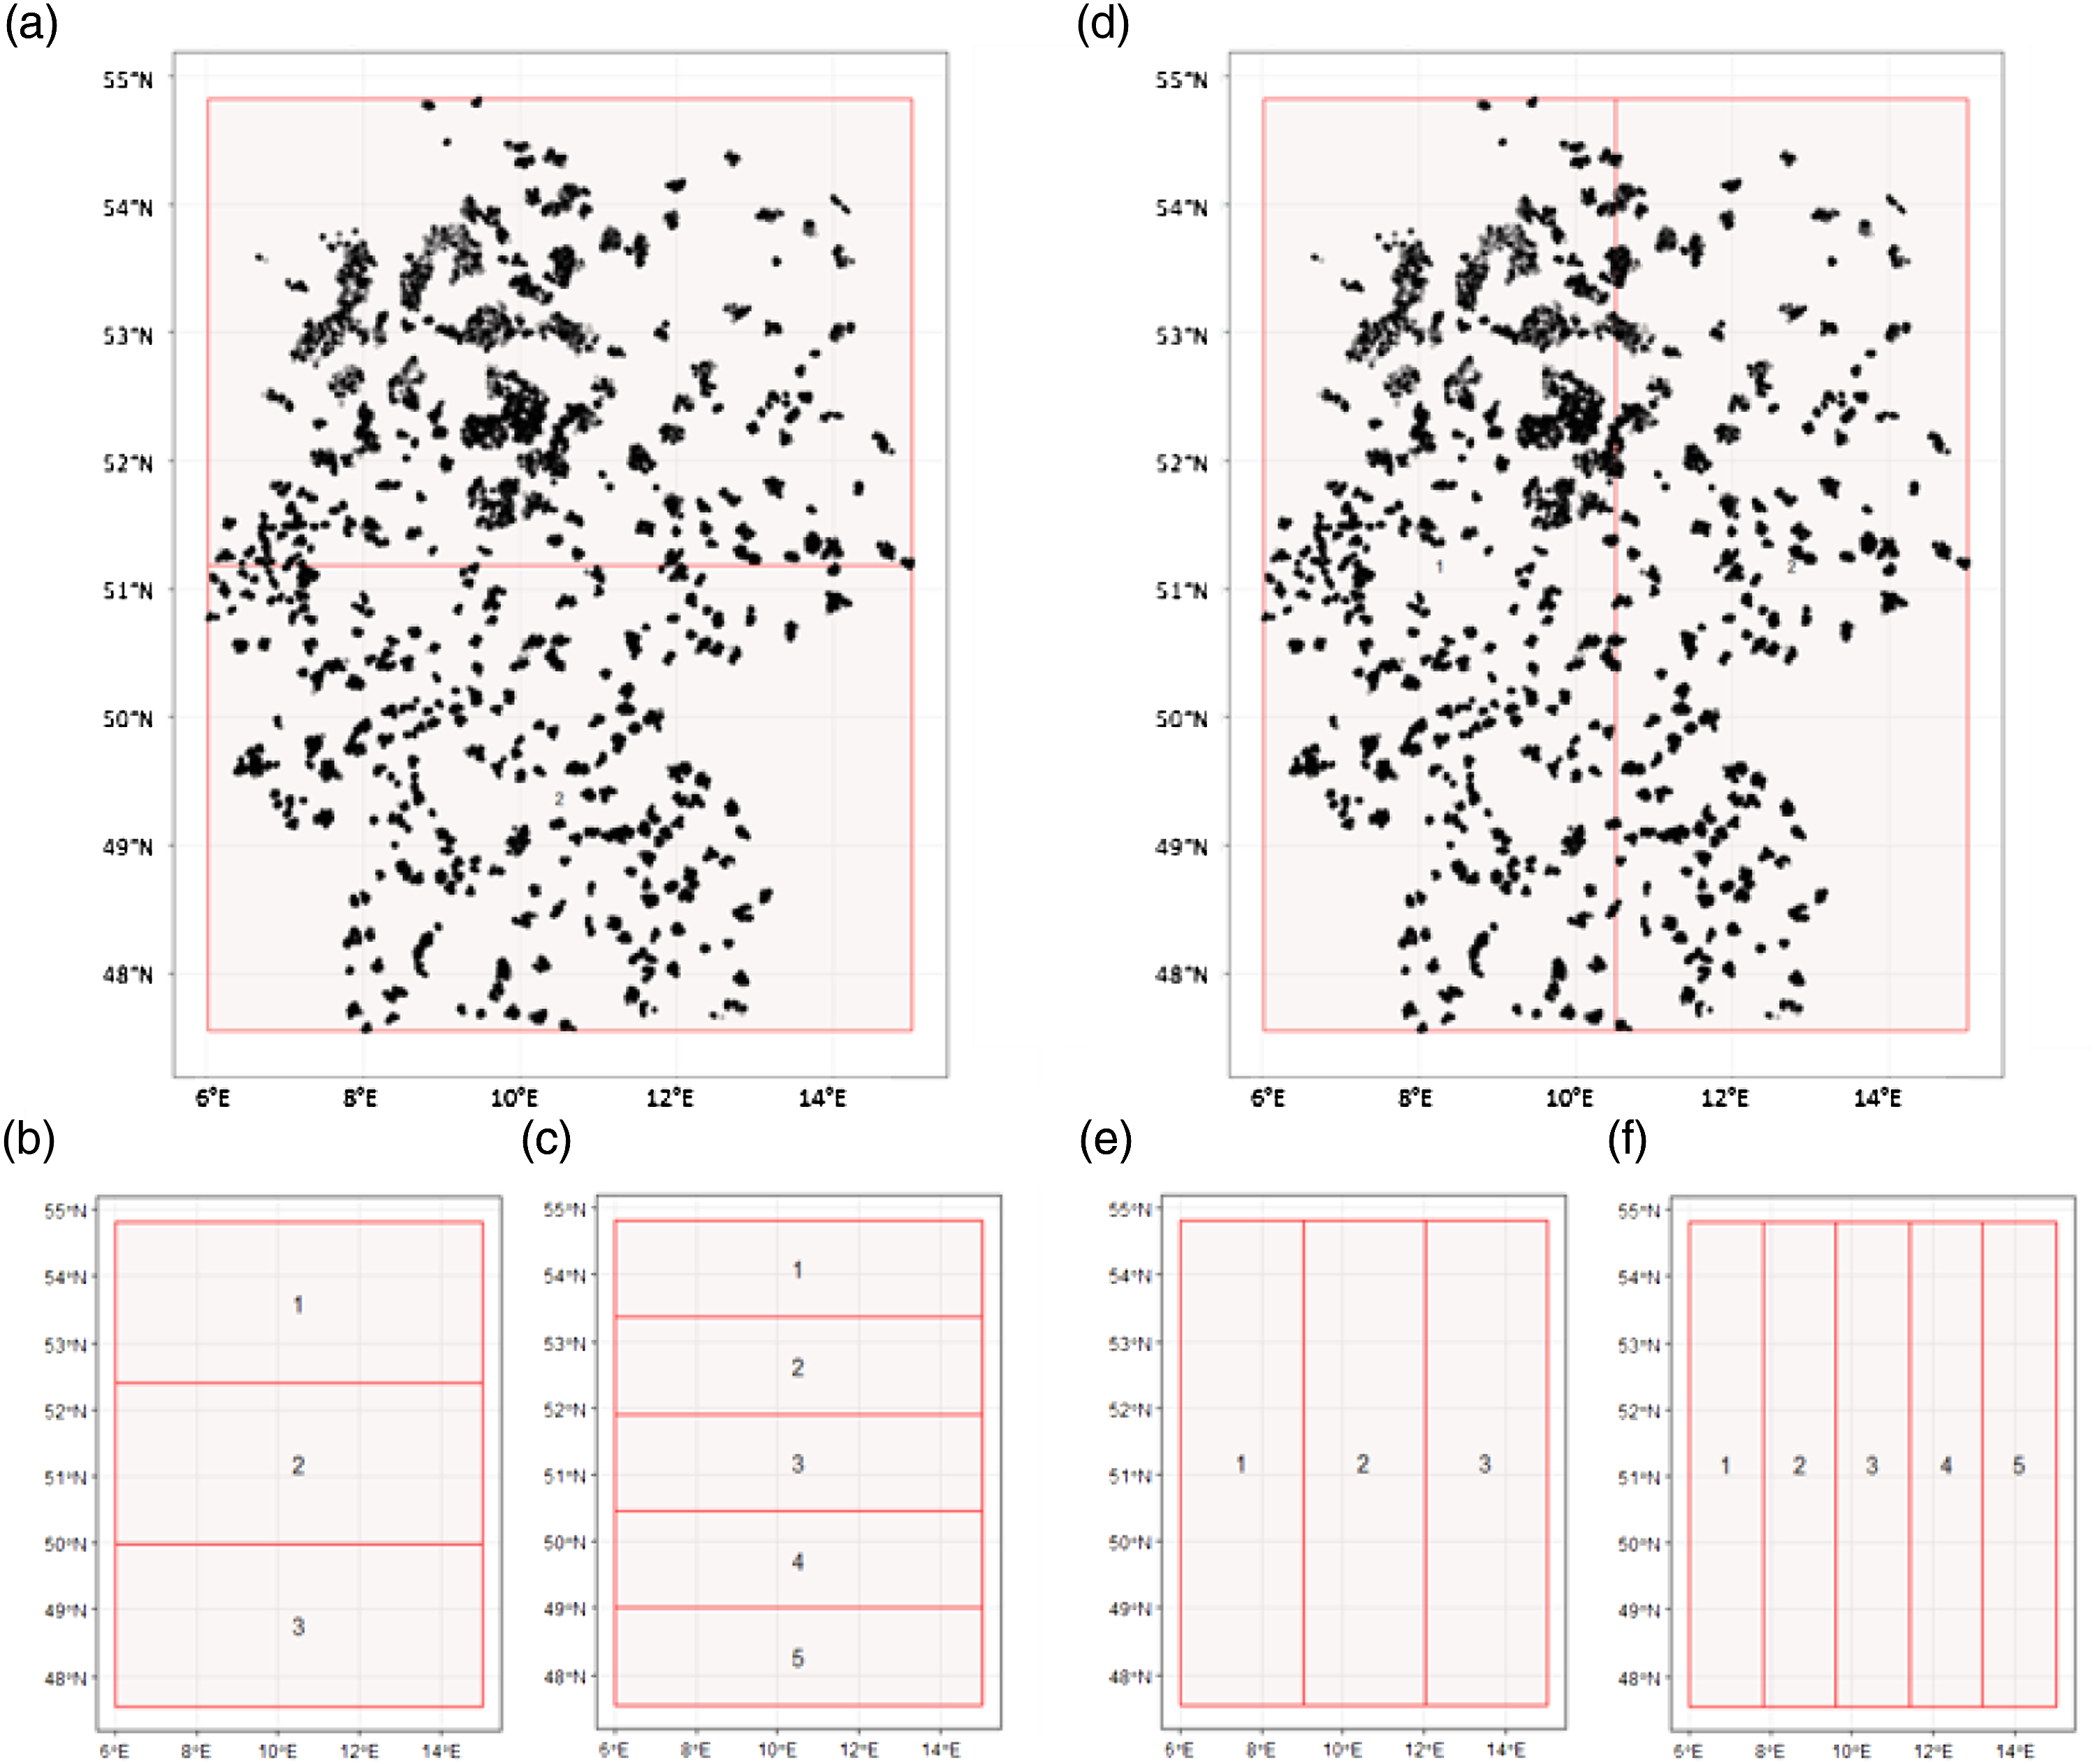
Scores in block CV from west to east.
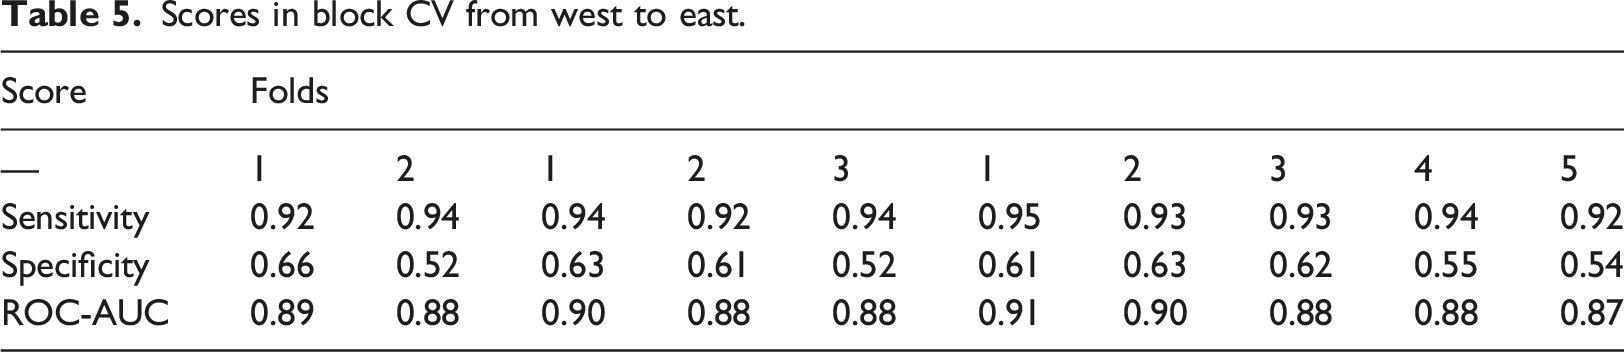
The scores show a tendency become lower towards the east. Considering the example of the three Fold partition, sensitivity is between 0.92 and 0.94, that is, over 90% of the non-residential objects are found. In the western and middle fold also, over 60% of the residential class are correct. But in the easternmost fold, the rate of correct residential objects drops to 0.52. Also, ROC-AUC of 0.88 indicates that the classification of the eastern portion is less accurate, when the classifier was trained with folds in the western part.
Scores in block CV from north to south.
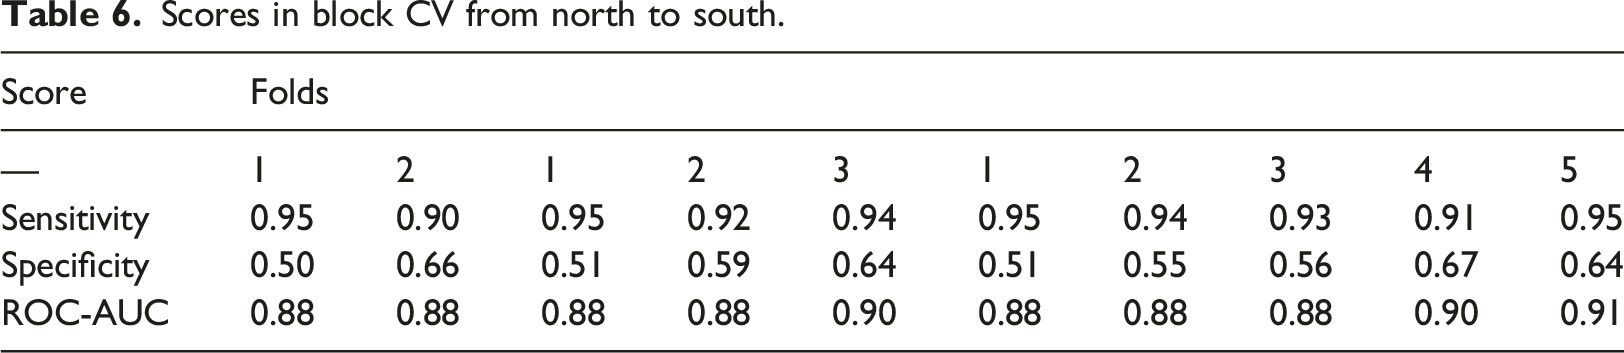
In summary a spatial influence on the classifier performance is recognized in longitude and latitude. The effect appears a little higher in the west-east partition, what is going to be discussed further in the following section.
Feature importance
The model presented here works with a comparatively large number of features, some of which are correlated. While this is not necessarily influencing the performance of a random forests classifier, it does influence the interpretation of the feature importance (Strobl et al., 2008). Therefore, for the estimation of feature importance, the number of strongly correlated features was reduced by means of a principal component analysis and feature selection using method B4 according to Jolliffe (1972).
The starting point for this methodology is the matrix of Pearson correlations (See Supplementary Material: Figure S1), on the basis of which highly correlated characteristics are determined. The threshold for “high” correlation was set at Feature importances of the model.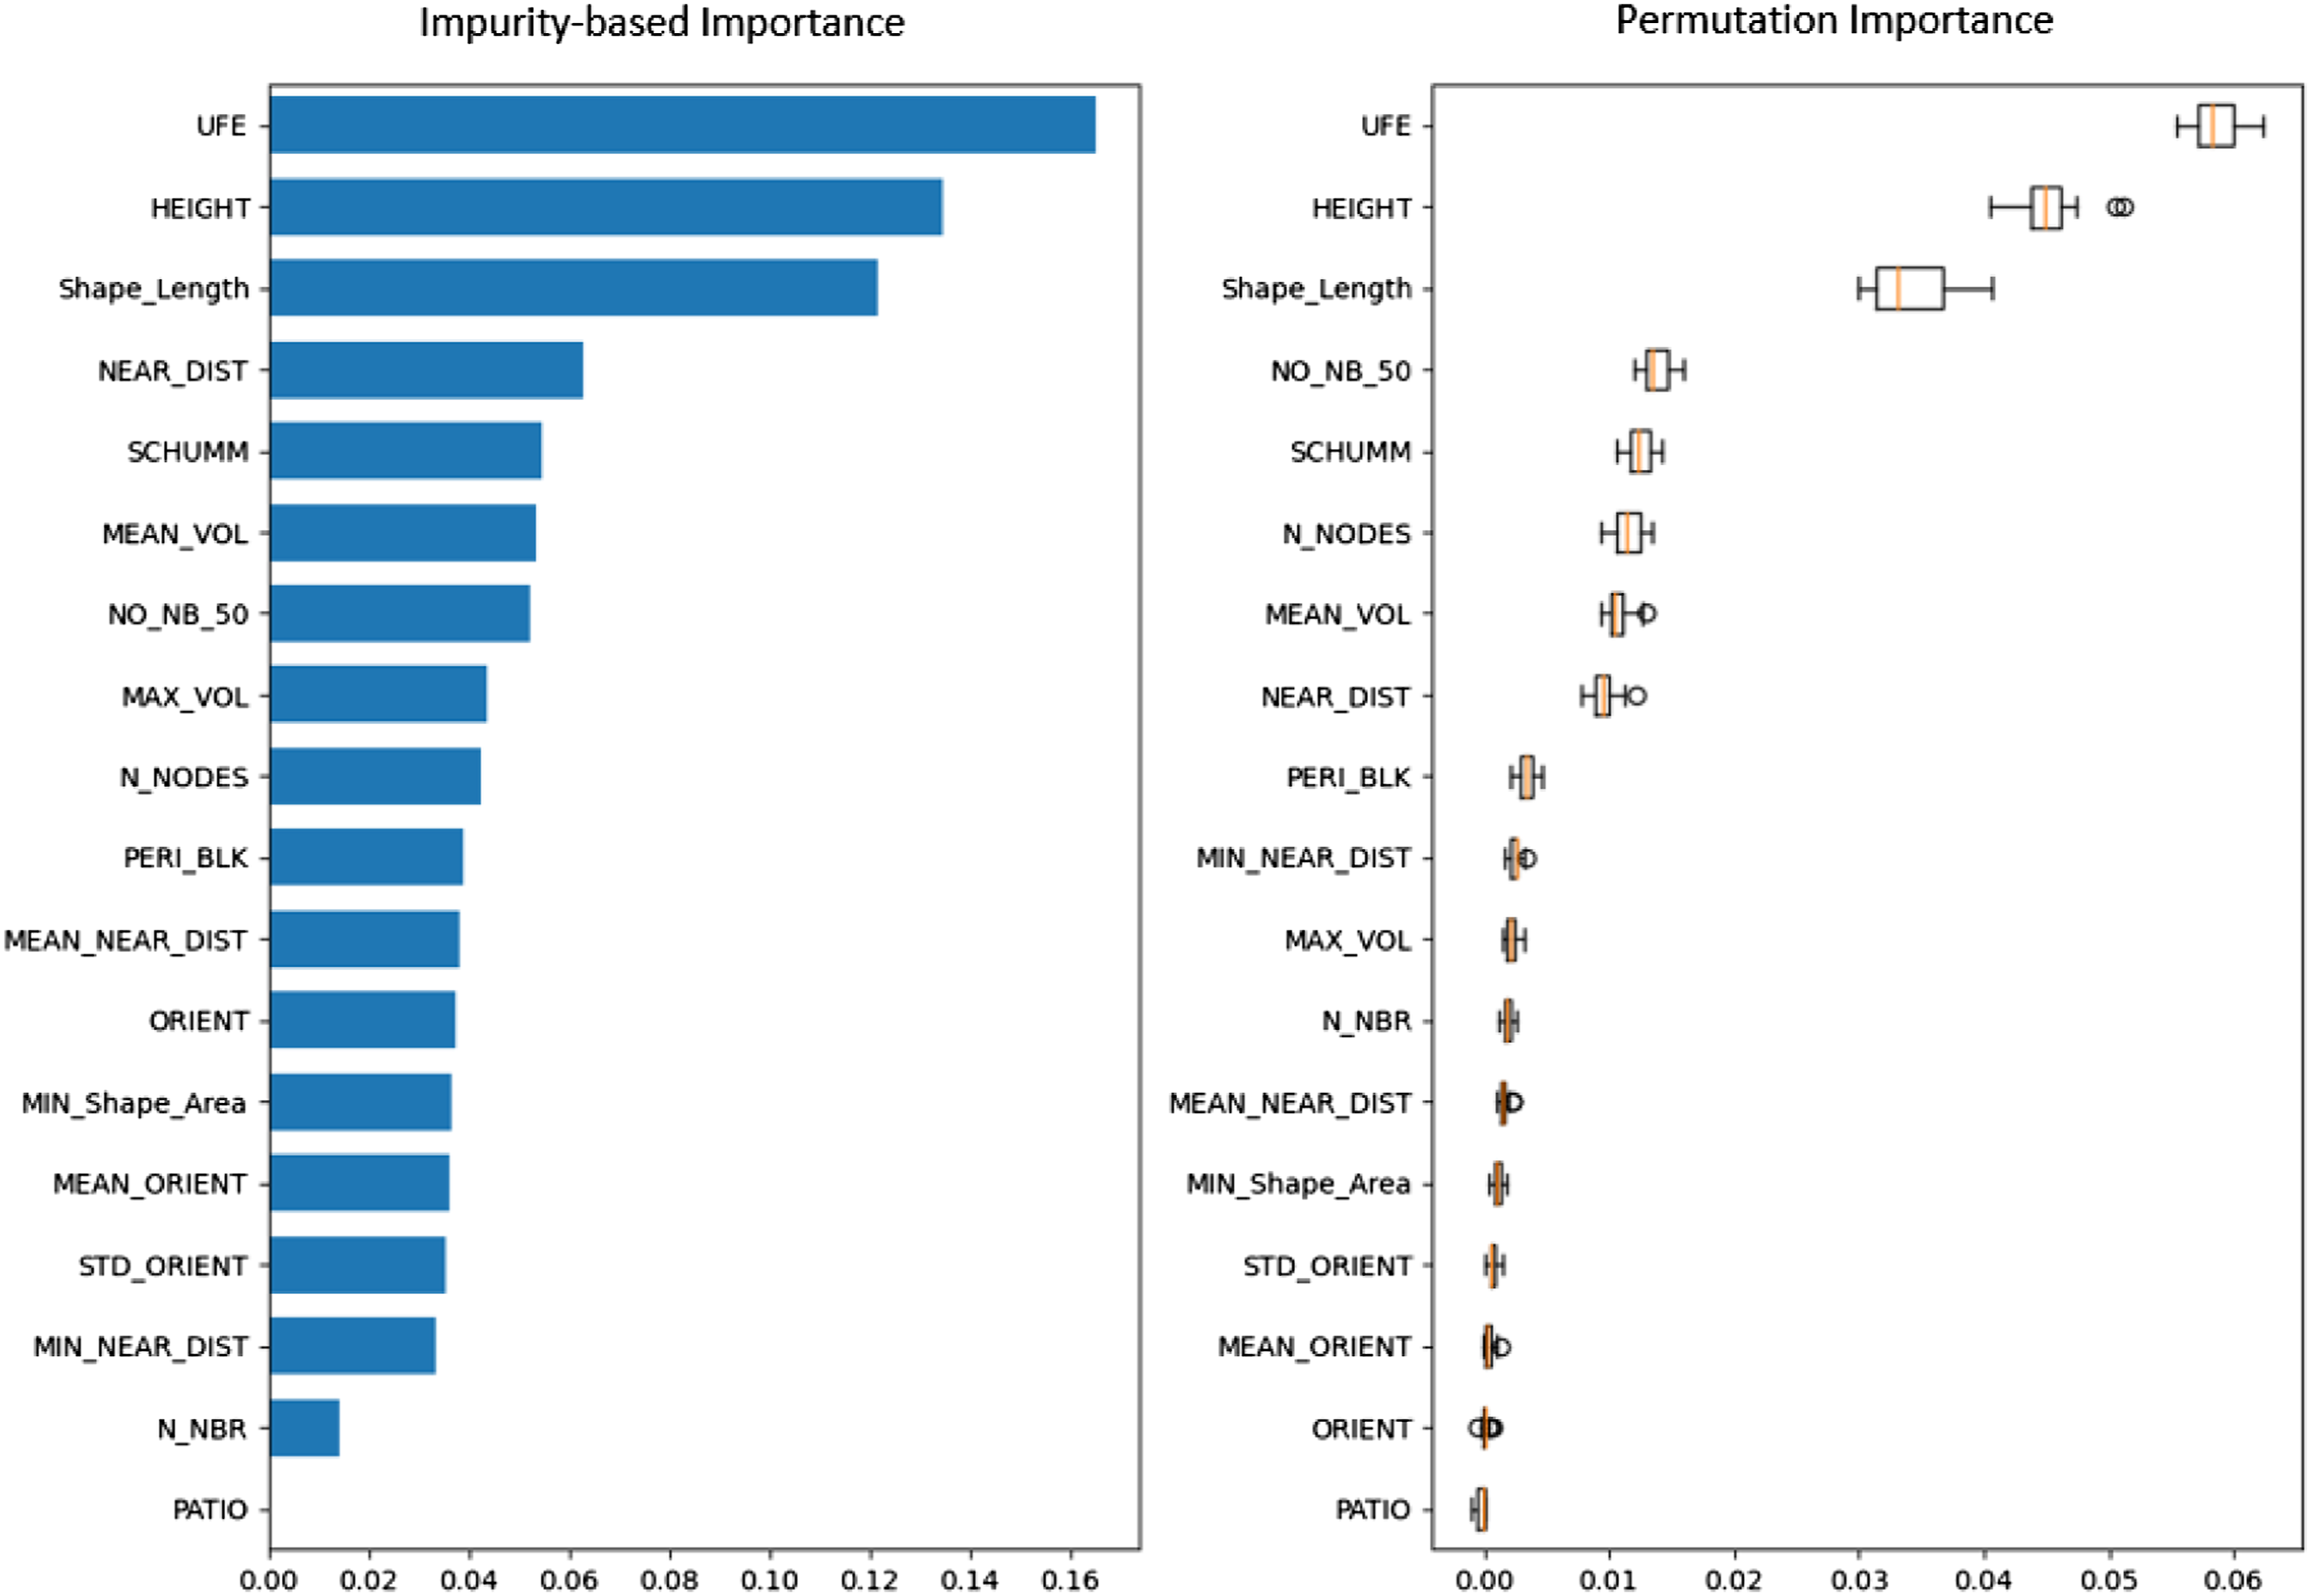
By comparing IFI and PI both importance measures look similar, with only some positional differences. As expected, features of morphologic (UFE) and geometric (HEIGHT, Shape_Length) domain are listed high in first three positions of both measures. At the following positions the order differs, with low cardinality features of 50 m buffer neighbourhood (NO_NB_50) and number of polygon vertices (N_NODES) being ranked higher in PI, while in IFI the distance to road (NEAR_DIST) is at fourth position. In both measures the second morphologic feature (SCHUMM) is ranked fifth position. The feature PATIO, concerning number of holes in the building footprints, is ranked lowest in both measures.
In summary, both importance measures reflect a high importance of morphologic, geometric and neighbourhood related features (either buffer counts of or distances to objects), which, concerning the computational coast of the latter, is important for feature engineering.
Discussion
The present study investigated the automatic separability of the classes residential and non-residential buildings in geodata. A feature set was built up with the help of footprint data and street networks, which was then used for training a Random Forest classifier. In the following we will discuss our results from different perspectives. Initially, the discussion reflects our basic hypotheses about classifying residential and non-residential buildings (see Introduction), concerning function-form relationship, feature importance and class distributions.
The reference footprint data came from a sample of the ENOB:dataNWG project. The aim of the project was to collect sample data on non-residential buildings and extrapolate it to the total inventory. For this purpose, selected buildings were visited and the data was gathered on site. Due to the distribution of the properties over the entire federal territory, data is also available in federal states where official data would be patchy otherwise (Schwarz et al., 2021). So this data set can be considered a ground-truth reference for non-residential buildings. However, it must be noted that the footprints in the resulting sample may have been modified, compared to the original HU-DE used before the screening. Sub goal of the project was to compare the delineation of building footprints from the real estate cadastre with the real building situation. Several cases are conceivable in which the footprints from the cadastre and the situation on site do not correspond: 1. A footprint represents several buildings (1:n). 2. Several footprints represent one building (n:1). 3. Any number of footprints represent any number of buildings (m:n). 4. Footprints without buildings.
It would be possible, that the characteristics and classifications of this sample could not be transferred to input data that lacks such verification and post-editing, e.g. OSM data and HU-DE. However, during the preparation, it was found that only a comparatively small proportion of the footprints had been modified in a way that would lead to noticeable differences from the delineation in the original HU-DE. It is therefore assumed, that there was no change that would alter any hypothetical function-form relationship.
The selected features have proven to be sufficient in their informative value with regard to separability. Their selection represented a compromise between the resources for the calculation and their presumed informative value for the classification. In order to evaluate importance of features, and their respective domains, the original feature set was reduced by discarding highly correlated features. It was confirmed that morphologic and neighbourhood related features rank high in both importance measures applied, what confirms indications of other studies (Steiniger et al., 2008; Vanderhaegen and Canters, 2017; Sturrock et al., 2018, Rosser et al., 2019). With a view to future continuation and repeatable use cases for use classifications of buildings, it is therefore concluded that at least elevation data and the street network must be available for the respective building footprints, in order to enable an acceptable classification.
As described in Data and Method, the prevalence of the classes in the real building stock is, strictly speaking, an unknown. Reasonable estimates exist, but these differ in definition for non-residential buildings. It is comparatively well possible to delineate the stock of residential buildings (Hartmann et al., 2016). These are usually provided with addresses and are located on building block areas to which residential use is assigned; accordingly, buildings for which this does not apply, fall into the group of non-residential buildings. With this definition, the prevalence of non-residential buildings in Germany is around 60%. For energy-economic analyses, however, the number of non-residential buildings is often calculated to be significantly lower. In this case, only non-residential buildings, to which an address can be assigned, are considered; these are approx. 2.7 million buildings (DENA, 2019).
Different sampling strategies had been used to assess the effect of class imbalances on classifier training. Those sampling strategies either create synthetic instances of the minority class (upsampling), randomly discard objects of the majority (downsampling) or work in combination. Their synthetic approach might have unwanted effects, e.g. in the case that a specific feature characteristic is overemphasized by upsampling, that does not reflect the unknown ‘natural’ non-residential building stock. We see the analysis of these sampling strategies and their possible problematic implications on building classification as a future research aspect.
Through this cross-validation ROC-AUC score was found to be a sufficient metric for the classifier performance under different sampling settings. Using this metric, a spatial cross-validation showed lower classifier performance in eastern and northern parts of longitudinal and latitudinal fold partitions. It is possible, that in both cases the calculated feature set is not instructive or predictive enough in training, in order to separate the classes. From the distribution of the objects (Figure 2), it is visible that the 3-fold west-east partition divides the data roughly in the boundaries of former West and East Germany. An influence of historic different architectural and planning patterns, which would make a feature set for the whole of Germany less applicable, cannot be ruled out. Concerning this point, it would be necessary to have a deeper look at special administrative regions during block cross-validation. However, the study at present was not intended to provide an analysis on federal state or county level, since the distribution of the whole data population would not allow the use of administrative boundaries alone. This is due to the fact, that not all subclasses of non-residential buildings might be represented in such an administrative subset. As an example, it is possible that the non-residential class in some county or state (think of Berlin or Hamburg) contains more multiuse office buildings, whereas in another there are more warehouses and agricultural buildings. This would lead to semantically biased learning data. In order to have a more general learning data selection it was decided to use a geographic block pattern during block cross-validation. The detailed look on linkages between non-residential building stock structure with its historic and economic backgrounds is field of future research.
Conclusions and future perspectives
As for the research questions raised, it can be noted that the random forest classifier has demonstrated its ability to both separate classes and determine important features. By limiting the effort of feature engineering, it is easier to extend the analysis to larger areas and datasets with reasonable computing time and classification quality. This does not mean that extensive feature sets should be avoided in general.
In principle transferability of the approach should be given, with regard to the data and software used. This means that only data products were used that are either already available in other countries or can be acquired by means of remote sensing. Geometric vector data on building footprints and roads are required as input data, and these are nowadays often freely available in many countries, at least as VGI. Globally, the mentioned works for deriving building footprints from remote sensing data, make it plausible to think of general applicability of the approach.
All processing steps can be implemented in open software. The fact that the approach was based on a specially prepared reference database should not limit the transferability to other data sets. Although the reference data were edited geometrically, these edits only affect a small part of the objects in the database. Furthermore, the data is likely to change geometrically in a direction that corresponds to that of the OSM data. How far the classification results differ when using either official data or OSM alone is the subject of further research.
Another important starting point for further development is the refinement of the procedure for further classes. However, it has to be considered which aspects are used for class formation. Often, classes are formed according to morphological characteristics (e.g. single-family house, apartment building, high-rise building). In the present case, however, geometric morphological characteristics were used to classify the building function. The classification of the classes residential and non-residential in this study is based on the main categories of the ENOB:dataNWG project. These main categories were created on the basis of similar energy and functional characteristics collected during the screening, rather than on the basis of similar geometric characteristics. A classifier trained with geometric features inevitably provides mixed results.
The monitoring of the building stock on national level is an important goal in the context of the transformation towards a climate-neutral and resource-efficient building stock. Deriving the population distributions in less developed countries is of similar importance and knowledge of building use is a necessary input parameter. Under the assumption of incomplete data, machine learning techniques have proven to be valuable tools for filling in any gaps. Considering the results of the spatial cross-validation in Germany, further research should deepen the understanding of regional specifics, when predictions on the whole building stock are made. The further development of the present approach is seen as a way to achieve a reliable classification with few input data or geometric feature set. In this way, it can be integrated into workflows for building-related area, material or population analyses.
Supplemental Material
Supplemental Material - Prediction of residential and non-residential building usage in Germany based on a novel nationwide reference data set
Supplemental Material for Prediction of residential and non-residential building usage in Germany based on a novel nationwide reference data set by André Hartmann, Martin Behnisch, Robert Hecht and Gotthard Meinel in Environment and Planning B: Urban Analytics and City Science
Footnotes
Declaration of conflicting interests
The author(s) declared no potential conflicts of interest with respect to the research, authorship, and/or publication of this article.
Funding
The author(s) received no financial support for the research, authorship, and/or publication of this article. This study was partly supported by the Federal Ministry For Economic Affairs And Climate Action (Grant Number: FKZ 03ET1315B, Forschungsdatenbank Nichtwohngebäude).
Data availability statement
The data that support the findings of this study are available on request from the corresponding author. The data are not publicly available due to research partner restrictions.
Supplemental Material
Supplemental material for this article is available online.
References
Supplementary Material
Please find the following supplemental material available below.
For Open Access articles published under a Creative Commons License, all supplemental material carries the same license as the article it is associated with.
For non-Open Access articles published, all supplemental material carries a non-exclusive license, and permission requests for re-use of supplemental material or any part of supplemental material shall be sent directly to the copyright owner as specified in the copyright notice associated with the article.