
Abstract
This paper proposes a new methodological framework to identify economic clusters over space and time. We employ a unique open source dataset of geolocated and archived business webpages and interrogate them using Natural Language Processing to build bottom-up classifications of economic activities. We validate our method on an iconic UK tech cluster – Shoreditch, East London. We benchmark our results against existing case studies and administrative data, replicating the main features of the cluster and providing fresh insights. As well as overcoming limitations in conventional industrial classification, our method addresses some of the spatial and temporal limitations of the clustering literature.
JEL codes
C55, L86, O31, R12
Introduction
Modelling economic activities in space is a key theme of geographical research. Clusters are most simply understood as physically co-located, interacting groups of firms (Marshall, 1890), but now there is a vast literature on cluster formation, characteristics and dynamics (Duranton, 2011; Uyarra and Ramlogan, 2013). 1
Despite this wealth of activity, key questions about clusters remain unresolved. First, we are still unclear about the relative salience of different cluster microfoundations, especially the balance between industrial specialization and diversity (Cariagliu et al., 2016; Frenken et al., 2015; Kerr and Kominers, 2015). Frameworks for cluster evolution are still in debate, particularly the desirable level of analytical generalizability (Martin and Sunley, 2011; Neffke et al., 2011). As a result, the feasibility of cluster policy and the appropriate policy mix also remain unclear (Duranton and Kerr, 2015).
In part, these questions are hard to answer because of some hard-to-fix empirical challenges. Identifying and describing clusters remains extremely challenging. For example, clustering does not always take place at the scale of available data, and working at inappropriate scales can distort results (Modifiable Areal Unit Problem, or MAUP). Researchers have turned to geocoded plant-level data to tackle this (Baldwin et al., 2010; Neffke et al., 2011). However, the industrial classifications used in such ‘administrative big data’ are backward-looking and tend to lag real-world industrial evolution (OECD, 2013; Papagiannidis et al., 2018). Defining clusters based on industries constrains our understanding of emergent sectors such as fintech or cleantech, which sit across multiple industry bins (Li et al., 2018). Using web data allows to capture company self-descriptions (Nathan and Rosso, 2015). Third, there are tradeoffs between data richness and reach. Firm censuses ask limited questions, while online sources often require extensive validation. Conversely, the case studies and small-n surveys used in some evolutionary studies, while rich, have limited reach (Gök et al., 2015).
This paper makes two contributions to tackling these difficulties. First, we propose a novel methodological approach to analyze clusters over time, based on geolocated web data and data science methods. Our approach tackles several of the analytical challenges facing empirical cluster research, including MAUP, the industrial classification problem and the richness/reach tradeoff. It enables us to explore key concepts in the literature at scale, notably cluster evolution and emergent structures of economic activity. Second, we provide new empirical insights for a well-known UK tech cluster in London, only hitherto explored through a handful of case studies (Foord, 2013; Martins, 2015b; Nathan and Vandore, 2014; Nathan et al., 2019). The Shoreditch cluster also gives us an established ground truth (Pickles, 1995) and clear empirical priors on which to benchmark our approach. We also compare our results against administrative microdata from Companies House, the UK companies register, showing that our approach delivers insight over and above what is possible with more conventional data.
Our approach is motivated by recent developments in qualitative GIScience (Martin and Schuurman, 2020). We exploit a cache of archived and geolocated website data 2000–2012, the JISC UK Web Domain Dataset (JISC and the Internet Archive, 2013; Jackson, 2017). While in the public domain, this dataset, like other web archives, has been rarely used by geographers (Tranos et al., 2020). We work first at the level of activities. We allow a single firm to be active in multiple activities, as described in website metadata. We extensively clean and validate these raw data, focusing on websites which meaningfully represent economic activity on the ground. We use topic modelling to bundle activities in economic space, working both across the cluster and within modelled ‘verticals’. We apply this approach to Shoreditch and expose its industrial micro-geography by observing co-location of related activities at the postcode level; we explore cluster-level topics, their granular content, and their evolution over time; and we provide a detailed breakdown of ‘creative digital’ industry space. We reproduce several stylized facts, for example picking out the growth of creative digital activities and the uptick of activity after the introduction of the ‘Tech City’ cluster program. We capture the evolution of the different economic activities and processes of branching out of new and technologically related activities. The use of recent historical web data allows us to validate our approach against the ground truth. Our proposed methodological framework is transferable to different geographical contexts and timeframes given the growth of web archives, which can provide current web data (Summers, 2020).
Our framework illustrates the utility of qualitative spatial data derived from web archives and NLP to answer questions rooted within the core of geographical research. We contribute to an evolving literature which aims to expose the mechanisms of cluster formation, by moving beyond a pre-determined understanding of economic clusters in spatial, temporal and technological terms (Balland et al., 2015; Catini et al., 2015; Delgado et al., 2015; Ter Wal and Boschma, 2011). We also join a growing literature employing web data for answering economic geography research questions (Musso and Merletti, 2016; Papagiannidis et al., 2018).
Using web data to uncover business practices discusses how web data have helped to uncover business practices. Data and methods presents the data and methods. Results gives our results and Conclusions concludes.
Using web data to uncover business practices
Just like most economic activities, businesses leave digital traces that can be used to learn more about their behavior (Arribas-Bel, 2014; Rabari and Storper, 2014). One example is website data, which are readily available, cheap to obtain and extensive in terms of coverage. Most businesses maintain websites, which act as self-reporting platforms and include valuable information. Over 81% of firms with 10 or more employees had a website across OECD countries in 2018. 2 Coverage for smaller firms is only slightly less: in 2014 75% of all UK companies with at least one employee maintained a website (Gök et al., 2015). Business website text typically contains qualitative information on a variety of themes: from the types of economic activity and the firm outputs (products and services), to export orientation, research and development and innovation activities (Blazquez and Domenech, 2018a). Businesses may not necessarily expose all of their strategies on their websites, but neither do they do this for other conventional data collection methods (Arora et al., 2013). Importantly, the literature has identified a typology of business functions that such websites perform: they are designed to spread information and establish a public image for businesses, support online transactions and communicate with customers (Blazquez and Domenech, 2018a; Blazquez and Domenech, 2018b; Hernández et al., 2009). The quality of the web text is essential to achieve these objectives: “the firm must include on its website all the information it wants its real and potential clients to know, presenting it in the most adequate manner” (Hernández et al., 2009: 364). Among other things, the richness of web text also allows for potentially more flexible methods of industrial classification than conventional industry typologies (Papagiannidis et al., 2018). Crucially for our purposes, around 70% of all websites contain some place reference (Hill, 2009).
A handful of recent studies use web data and data science tools for industry and/or cluster analysis. Blazquez and Domenech (2018b) use data from corporate websites to test the export orientation of a small sample of 350 Spanish companies. They ‘nowcast’ and track important cluster features. Arora et al. (2013) and Shapira et al. (2016) study the early commercialization strategies of novel graphene technologies focusing on a sample of 65 small and medium-sized enterprises (SMEs) in the US, UK, and China. Gök et al. (2015) explore the R&D activities of 296 UK green goods SMEs and Li et al. (2018) focus on a similar sample of US-based SMEs to build a Triple Helix framework. Papagiannidis et al. (2015) use longitudinal archived web data to analyze the diffusion of different web technologies within and between specific sectors in the UK as well as across different mega-regions. Musso and Merletti (2016) and Hale et al. (2014) use these data to illustrate UK business’ web adoption in the late 1990s, and the linking practices of British university websites. Kinne and Axenbeck (2020) and Kinne and Resch (2018) in a large-scale study, scraped business websites to model firm innovative behaviour. The closest contribution to this paper is Papagiannidis et al. (2018), who retrieve the text and the metadata from the live websites of circa 8500 firms in the UK North-East, sampled from a market research database. They benchmark classifications based on Standard Industrial Classification (SIC) codes against new classifications from web text, identifying clusters not shown by conventional typologies.
All these studies have important empirical limitations. Typically, only a few hundred subjects or less are covered, the temporal dimension is ignored, and the geolocation process is coarse at best. Conversely, we work with 12 years of data for thousands of business websites to explore cluster dynamics. We use postcode level information from self-reported trading addresses, rather than the registration addresses usually included in UK administrative data. Importantly, commercial or freely available firm data are not bias-free. Companies House, the UK’s registrar of companies, does not include any information about business websites and only 24% of the records that Papagiannidis et al. (2018) used included business URLs.
Data and methods
We employ a unique source of archived web data, which have never been used before in such a context and extent: the JISC UK Web Domain Dataset (JISC and the Internet Archive, 2013; Tranos and Stich, 2020). This is a bespoke subset of the Internet Archive (IA) and includes all the archived webpages under the .uk country code Top Level Domain (ccTLD), 3 which is one of the oldest ccTLD created in 1985 (Hope, 2017) and was the second most popular in 1999 (Zook, 2001). Established in 1996, the IA is a non-profit organization that archives web content via a web crawler and a seed list of URLs. During the archival of the HTML documents from these URLs, it also discovers the hyperlinks included in these documents and uses them to discover more URLs following a snowball-like sampling technique (Hale, Blank, and Alexander, 2017). In 2016 the IA contained 273 billion webpages from 361 million websites (Internet Archive, 2016). While the IA continues its operation today, the preprocessing of their data by the British Library and, therefore, the time frame of this dataset ends in Q1 2013. Nevertheless, this dataset offers some rare advantages. As it is readily available it is more accessible to researchers outside digital humanities, which tend to monopolize the use of web archives (Schroeder and Brügger, 2017). We make use of this constraint to validate our approach against the ground truth of Shoreditch’s recent history. Our results illustrate the potential of our approach for contemporary analysis and nowcasting applications using more recent web archives. 4
We rely on archived web data instead of live ones because this is the only way to obtain longitudinal web data. Moreover, the publicly available business registration data in the UK (Companies House) do not include business website URLs and, importantly, the process of matching business names with websites is not trivial. This might be possible for other countries, the business registration data of which contain URL information – see for instance the work of Kinne and Axenbeck (2020) for German businesses.
Our raw data consists of billions of timestamped URLs of .uk webpages, which have been archived in 2000–2012. We access their text programmatically through the IA API. 5 We use a subset of all the archived .uk webpages, which include a string in the format of a UK postcode (e.g. EC1A 1AA) in the web text. Created by the British Library, this dataset includes 2.5 billion URLs (Jackson, 2017). The postcode-based geolocation method does not suffer by the widely discussed IP geolocation limitations (Zook, 2000) and by the ‘here and now’ problem often occur with data derived from social media (Crampton et al., 2013). Both ideas refer to the mismatch between the location an activity takes place and its reflection in the different layers of the internet: while the former refers to the difference between the physical address included in a website registration, which is used for the geolocation of IP addresses, and the actual location of the underpinning activity, the latter points out the difference between the location and the time social media content refers to and how this propagates over space and time through different social media channels.
Such data are not without limitations as some websites might escape web crawlers. Ainsworth et al. (2011) find that 35–90% of webpages have been archived globally by public archives. The IA, just like any other archive, only captures publicly available webpages and is constrained by robot exclusions. 6 Webpages that attract more traffic also have higher probability of being archived. Nevertheless, the consensus is that the IA is the most extensive and complete archive in the world (Ainsworth et al., 2011; Holzmann et al., 2016). Focusing on a subset of websites similar to the one used here, Thelwall and Vaughan (2004) indicate that the IA captures at least one webpage for 92% of all the US commercial websites.
Data cleaning
We start with all the archived .uk webpages with a string in the UK postcode format in the web text. UK postcodes are alphanumeric strings with a hierarchical structure which refer to very small areas. For densely populated areas, they might refer to a single building. Hence, we treat them as point data. We trim data to 2000–2012, as the archived web data before 2000 is sparse and for 2013 we only have data for the first quarter. We drop false positives postcodes and keep webpages under the .co.uk or .ltd.uk second level domains, which represent commercial activities (Thelwall, 2000). A potential caveat here is that a UK company might decide to use a ccTLD different than the .uk one (e.g. .com). However, the established popularity of the .uk provides confidence for using these data to capture economic activities anchored in the UK and, more specifically, within Shoreditch: during the first year of our study period three .co.uk websites were registered every minute (OECD, 2001); and Hope (2017) illustrated the strong preference of UK consumers towards .uk websites when they are looking for services or products.
We then use these webpages to rebuild archived websites: for example, www.website1.co.uk/webpage1 and www.website1.co.uk/webpage2 are part of the www.website1.co.uk. We further subset these data and only keep webpages with at least one postcode within the Shoreditch area. Following Nathan et al. (2019), we define the Shoreditch as a 1 km zone around Old Street Roundabout.
Websites do not necessarily correspond to underlying firms. Matching to company-level administrative data is both challenging and provides limited added value in this case, so instead we run diagnostics to understand website-firm relationships. Using the above example, if each archived webpage includes the same postcode, then we link www.website1.co.uk to a unique postcode. Otherwise, we sum all the unique postcodes included in the archived webpages of a specific website and this is the total number of different postcodes included in this website. We repeat this exercise yearly for the period 2000–2012. Figure 1 presents this distribution. N. of postcodes per website distribution 2000–2012.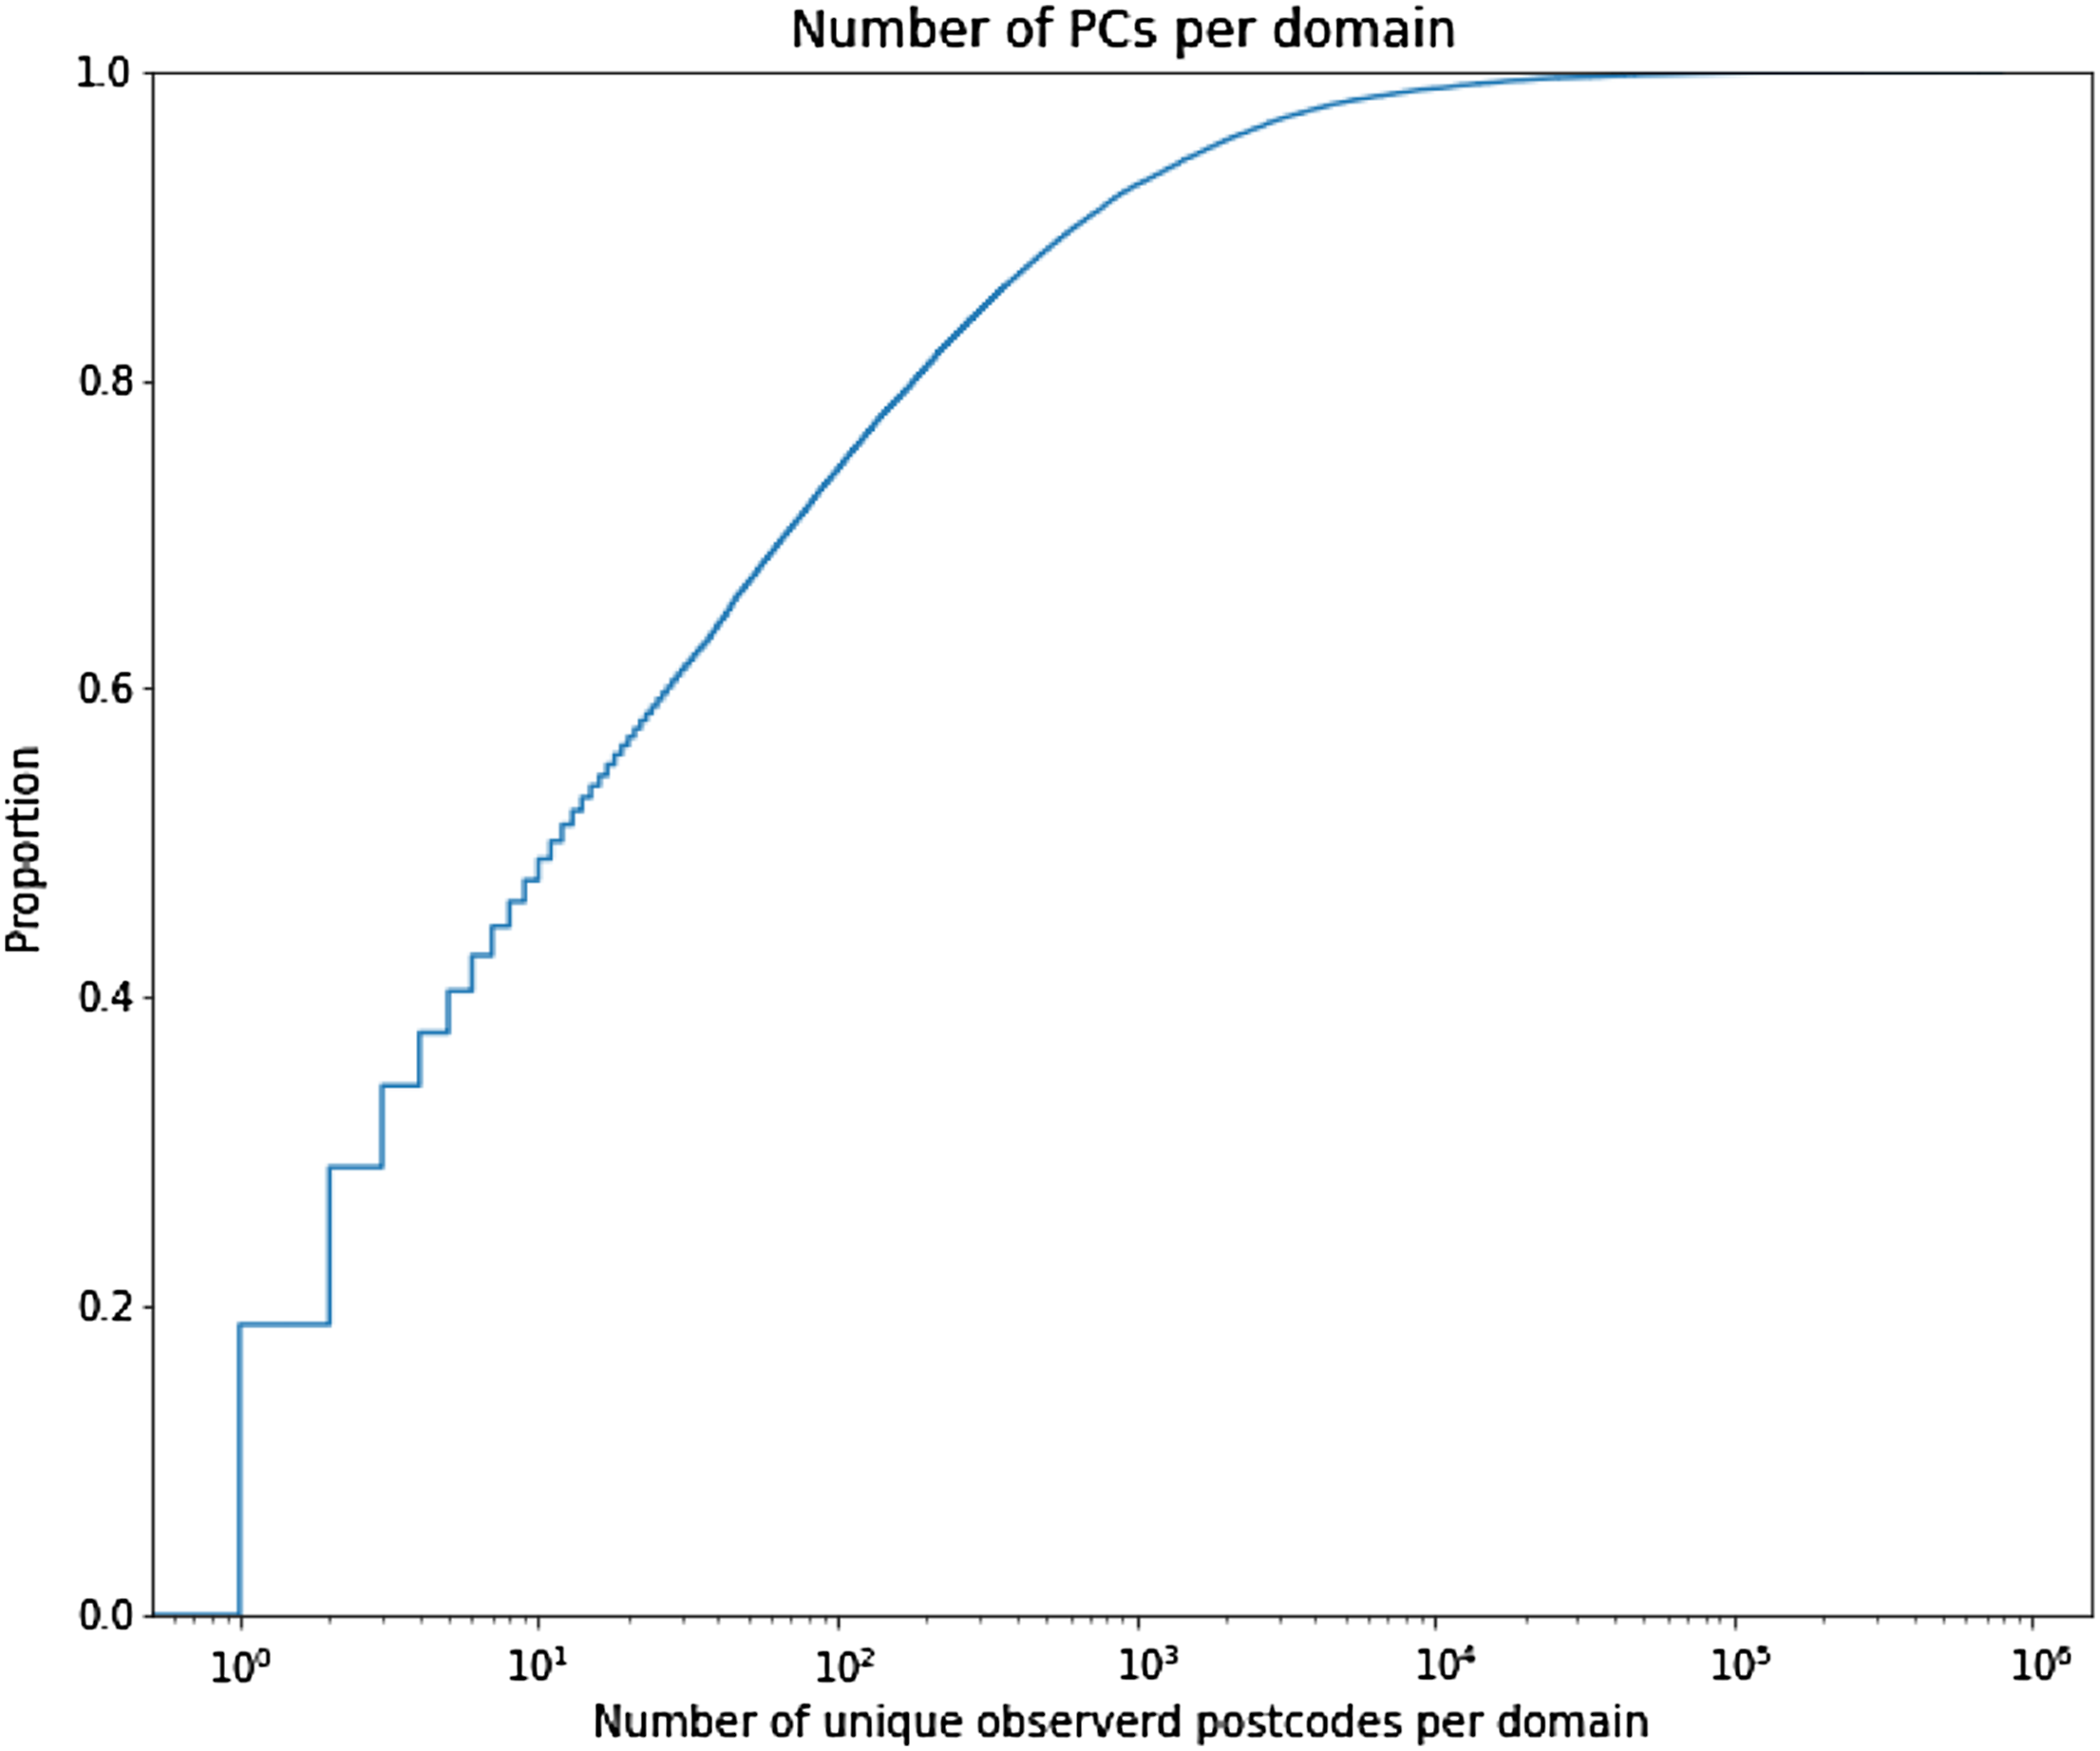
Websites located at the right end of the long tail include many postcodes, at least one of which falls within Shoreditch. These are typically online directories, which were popular in the beginning of the study period (Figure S3). We drop such websites as they are artefacts of the internet’s past and they do not represent economic activities anchored to the study area. Instead, we focus on commercial websites with a clear location within Shoreditch. To begin with, we only include in the analysis websites with one unique postcode, which fall within Shoreditch (18% of all the websites with at least one postcode in Shoreditch for 2000–2012). We argue that these websites represent economic activities that take place within our study area. As discussed in Using web data to uncover business practices, businesses are motivated to include accurate information in their websites in order to establish a public image and communicate with their customers, among other things (Blazquez and Domenech, 2018a; Hernández et al., 2009). Figure 2 illustrates examples of such websites. It presents the homepage of commercial websites with a unique postcode within Shoreditch, where usually the economic activity is presented, and the ‘contact’ page, where usually the Shoreditch postcode can be found. At a second stage we run a sensitivity check by running the analysis to a larger sample that includes websites with up to 11 postcodes, at least one of which is in Shoreditch (50% of all the websites with at least one postcode in Shoreditch in 2000–2012). These sites plausibly represent economic activity in multiple locations, but may also represent generic economic activity less connected to the cluster. Snapshots of examples of websites with a unique postcode in Shoreditch.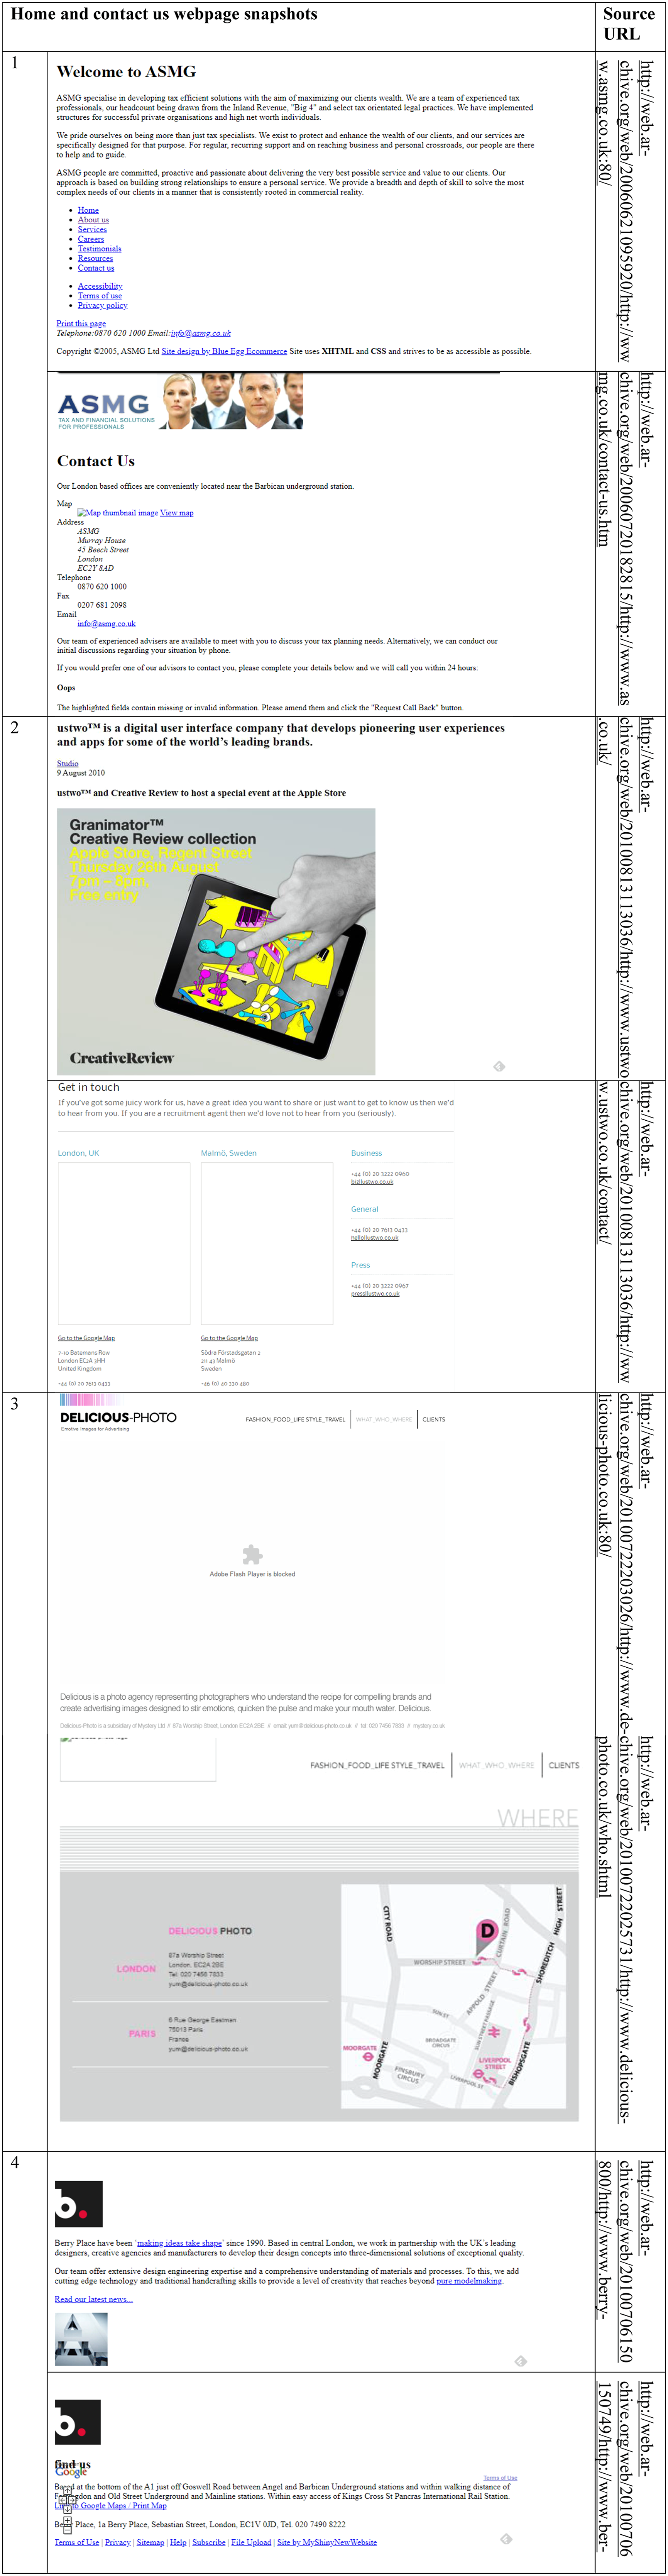
We deal briefly here with two other concerns. Firms use websites in numerous ways, including defensive purposes akin to trademarking future products (Blazquez and Domenech, 2018a). Defunct firms’ websites may also live on after the underlying business has closed. However, the likelihood of having such websites in our data is small because the IA crawler finds, and archives websites based on hyperlinks from other websites leading to that website. We expect ‘placeholder’ or defunct websites to contain zero or very few live hyperlinks from other sites. Moreover, we would not expect defunct firms to continue paying domain names fees. Also, once a website is archived by the IA, chances are that this website will keep on being archived. Previous research has indicated that only 7.5% of the websites which contain at least one postcode appear in two or more years without these 2 years being consequent (Tranos and Stich, 2020). Lastly, the first year that a website appears in our data does not necessarily reflect the firm or the website creation year, but instead the first year the website was archived.
Topic modelling
To analyze the cleaned website text we use Latent Dirichlet allocation (LDA) and, specifically, an extension by Blei and Lafferty (2006), which accounts for the temporal evolution of the dataset. LDA is a widely used tool in natural language processing. Several studies have utilized LDA in spatial settings, such as the spatial distribution of topics on Twitter (Lansley and Longley, 2016; Martin and Schuurman, 2017), improving geographic information retrieval (Li et al., 2007), understanding residents’ views of their neighborhoods (Hu et al., 2019) or identifying classes of economic activities in a region (Papagiannidis et al., 2018).
This approach has advantages over administrative datasets, which classify firms into industries using standardized typologies such as NAICS (in the US) or SIC/NACE (in the EU). Typically, firms are given only one code, where the underlying classification system may be several years old (in the case of current SIC/NACE, over a decade old). Here, we use website metadata to describe firms’ economic activities (‘terms’) in the year of extraction and use LDA to bundle this into larger ‘topics’ which represent parts of activity space. This strategy means that each company can be part of several ‘topics’ at the same time, reflecting the fact that businesses can be active in several industries simultaneously. We combine topic and term-level information to identify specialized and cross-topic activities, such as the use of general-purpose technologies. Classification is also based on contemporaneous description by the firm itself. In the spirit of evolutionary economic geography, we then look at the growth and change of topics over time.
The intuition of LDA is that each website – or document, per NLP terminology – is composed by several different overlapping topics, which form the overall economic activity space. However, we cannot directly observe these topics, only the words that make up the documents. Formally, we assume that there is a generative process with hidden variables that defines a joint probability distribution for both the hidden and observed variables (Blei, 2012). LDA can then be described as finding a mixture of topics for each document:

We run the dynamic LDA on the human assigned keywords that describe the purpose of each website, to exclude extraneous vocabulary from our corpus. These keywords are part of HTML documents and are used from search engines to classify webpages. 7 We follow standard NLP procedures to clean the keyword-based corpus. We exclude all English stop words and use the Snowball Stemmer (Porter, 2006) to only consider the word stems.
We use genism (Rehurek and Sojka, 2010) for modelling the dynamic LDA and pyLDAvis (Sievert and Shirley, 2014) for visualizing the generated models. We set the maximum number of iterations to 300. To find an appropriate random seed for the topic modelling we create a population of 25 models with varying seeds. We then select the seed for our analysis that produces a model that is closest to the average of the log-likelihood of the population of models. Given that typical evaluation metrics such as coherence score are not available for the dynamic LDA, and that our research aim is to analyze the industrial structure of Shoreditch we opted for the highest number of topics up to the point that the derived topics could not have been interpreted by the authors. Hence, Cluster-level analysis presents the LDA outputs for k = 15 topics.
Solutions with less topics, which can be provided upon request, lead to similar conclusions when we look at the topic terms and more aggregated bundles of economic activities. As Cluster-level analysis illustrates, k = 15 led to fine-grained topics that were still interpretable and well delineated. This human judgement in selecting k is supported by the literature as previous work has shown that metrics based on the log-likelihood such as perplexity do often not agree with human judgement (Chang et al., 2009).
Robustness checks
We deploy different strategies to assess the robustness of our findings. Crucially, we implement our approach to model a well-known technology cluster in East London (Shoreditch). The theoretical and empirical stylized facts allow us to benchmark our results against established ground truth and previous literature. We also reproduce our cluster-level analysis using a larger set of websites containing up to 11 different postcodes, which represent larger multi-site firms, including chains. These may be economically important but less embedded in the cluster itself. Finally, we compare results derived from web-based methods with a more traditional approach based on administrative microdata from the UK company register (Companies House). This exercise illustrates how our research framework complements established analytical approaches in understanding clusters.
Our case study: Shoreditch
Shoreditch (known as ‘Tech City’) is a good test case, having much in common with urban technology production districts in large cities around the world (e.g. in New York, San Fran-cisco, Berlin, Stockholm and Tel Aviv), including its evolution from ‘depressed’ ex-industrial area to ‘vibrant’ post-industrial milieu (Hall, 1998; Hutton, 2008; Scott, 1997, 2014; Zukin, 1982). Here we set out some stylized facts, drawing on existing qualitative and quanti-tative case studies, which form the ground truth that we want our framework to reproduce: beyond this, we want to deliver additional insights not uncovered by previous work.
The cluster is located in a set of ex-industrial East London neighborhoods a few miles from the West End and close to the City of London and is tightly drawn around the Old St roundabout (‘Silicon Roundabout’). Historically a working-class district organized around warehousing and light/craft manufacturing (including printing), Shoreditch declined in the post-WWII period. By the 1980s the area had large amounts of empty warehouse and office space. By the mid-1990s, these were taken up by a mix of artists (Harris, 2012), loft-dwellers (Hamnett, 2003) and (in the early 1990s) advertising, media and ‘new media’ firms moving east from more expensive central areas, followed shortly by a wave of dotcoms (Hutton, 2008; Pratt, 2009). This mixture of creative industries and technology firms has gradually evolved into the current ‘creative digital’ cluster (Foord, 2013; Nathan et al., 2019). Proximity to London’s main financial district gives the area a body of financial and business services firms, with sev-eral new office developments in recent years. The area has become a desirable residential neighborhood, with extensive new luxury apartment developments and local amenities for well-off incomers. At the same time, leisure and night-time economy has emerged, with many cafes, bars and restaurants doubling as ‘soft infrastructure’ where creative professionals meet (Currid, 2007; Martins, 2015b). Like similar clusters, the creative technology community grew ‘organically’ for many years before coming to the attention of policymakers (Foord, 2013; Jones, 2017; Nathan and Vandore, 2014; Pratt, 2009). The flagship ‘Tech City’ cluster de-velopment program was launched in 2010, and the cluster has become substantially larger and costlier in the following years (Nathan et al., 2019).
Results
Exploratory spatial analysis
Figure 3 presents the distribution of the number of websites per postcode in Shoreditch in 2012. Readers are reminded that postcodes in the UK are very small areas and for dense urban areas, they can even consist of a single building. Therefore, it is difficult to justify the extreme outlier at the right end of the distribution in Figure 3, according to which more than 80 unique websites point to a specific postcode in Shoreditch (EC1V 2NX). The Supplementary Materials section illustrates the interesting story behind this outlier, which has been removed. Number of websites per postcode in Shoreditch in 2012.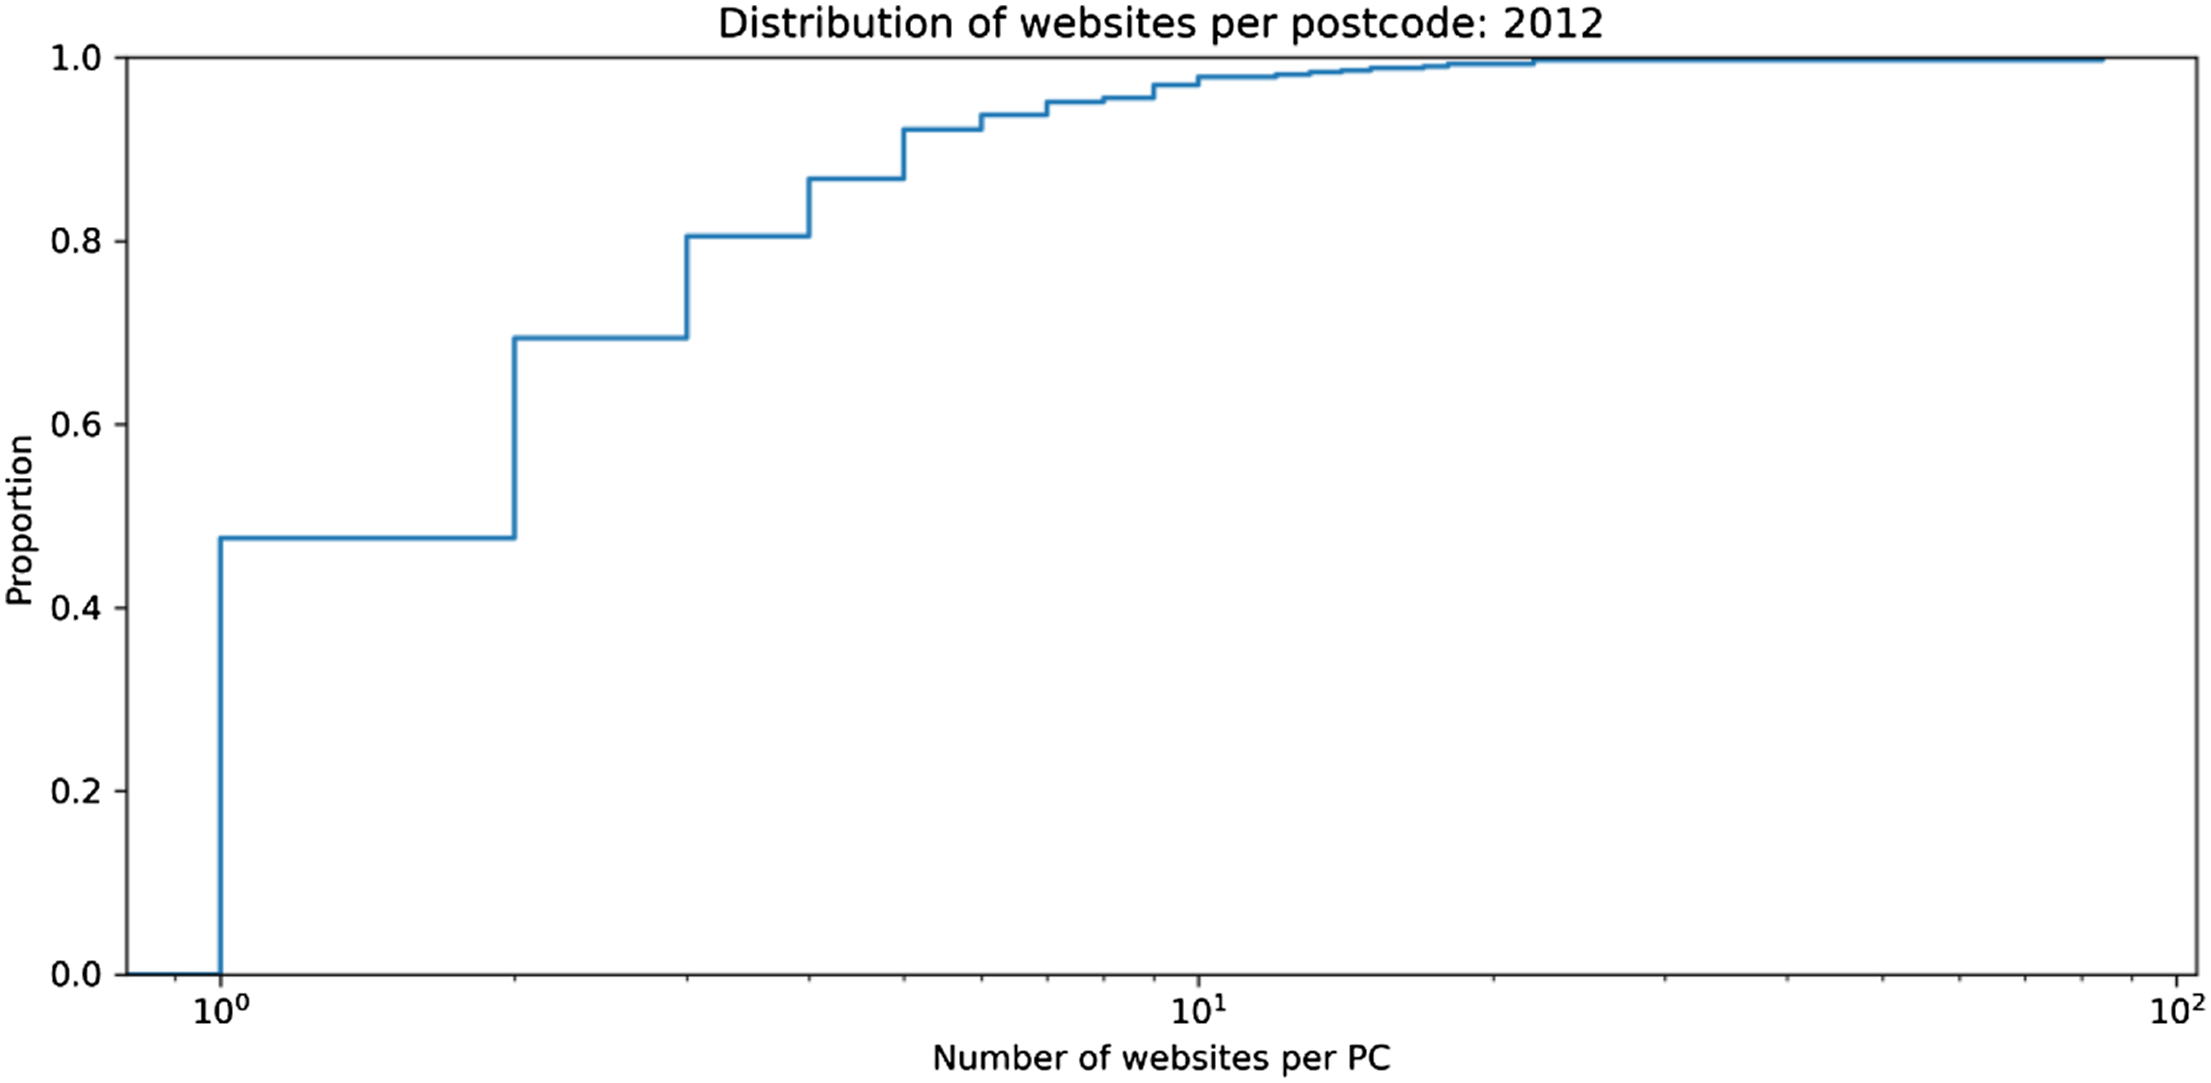
Cluster-level analysis
LDA topics.
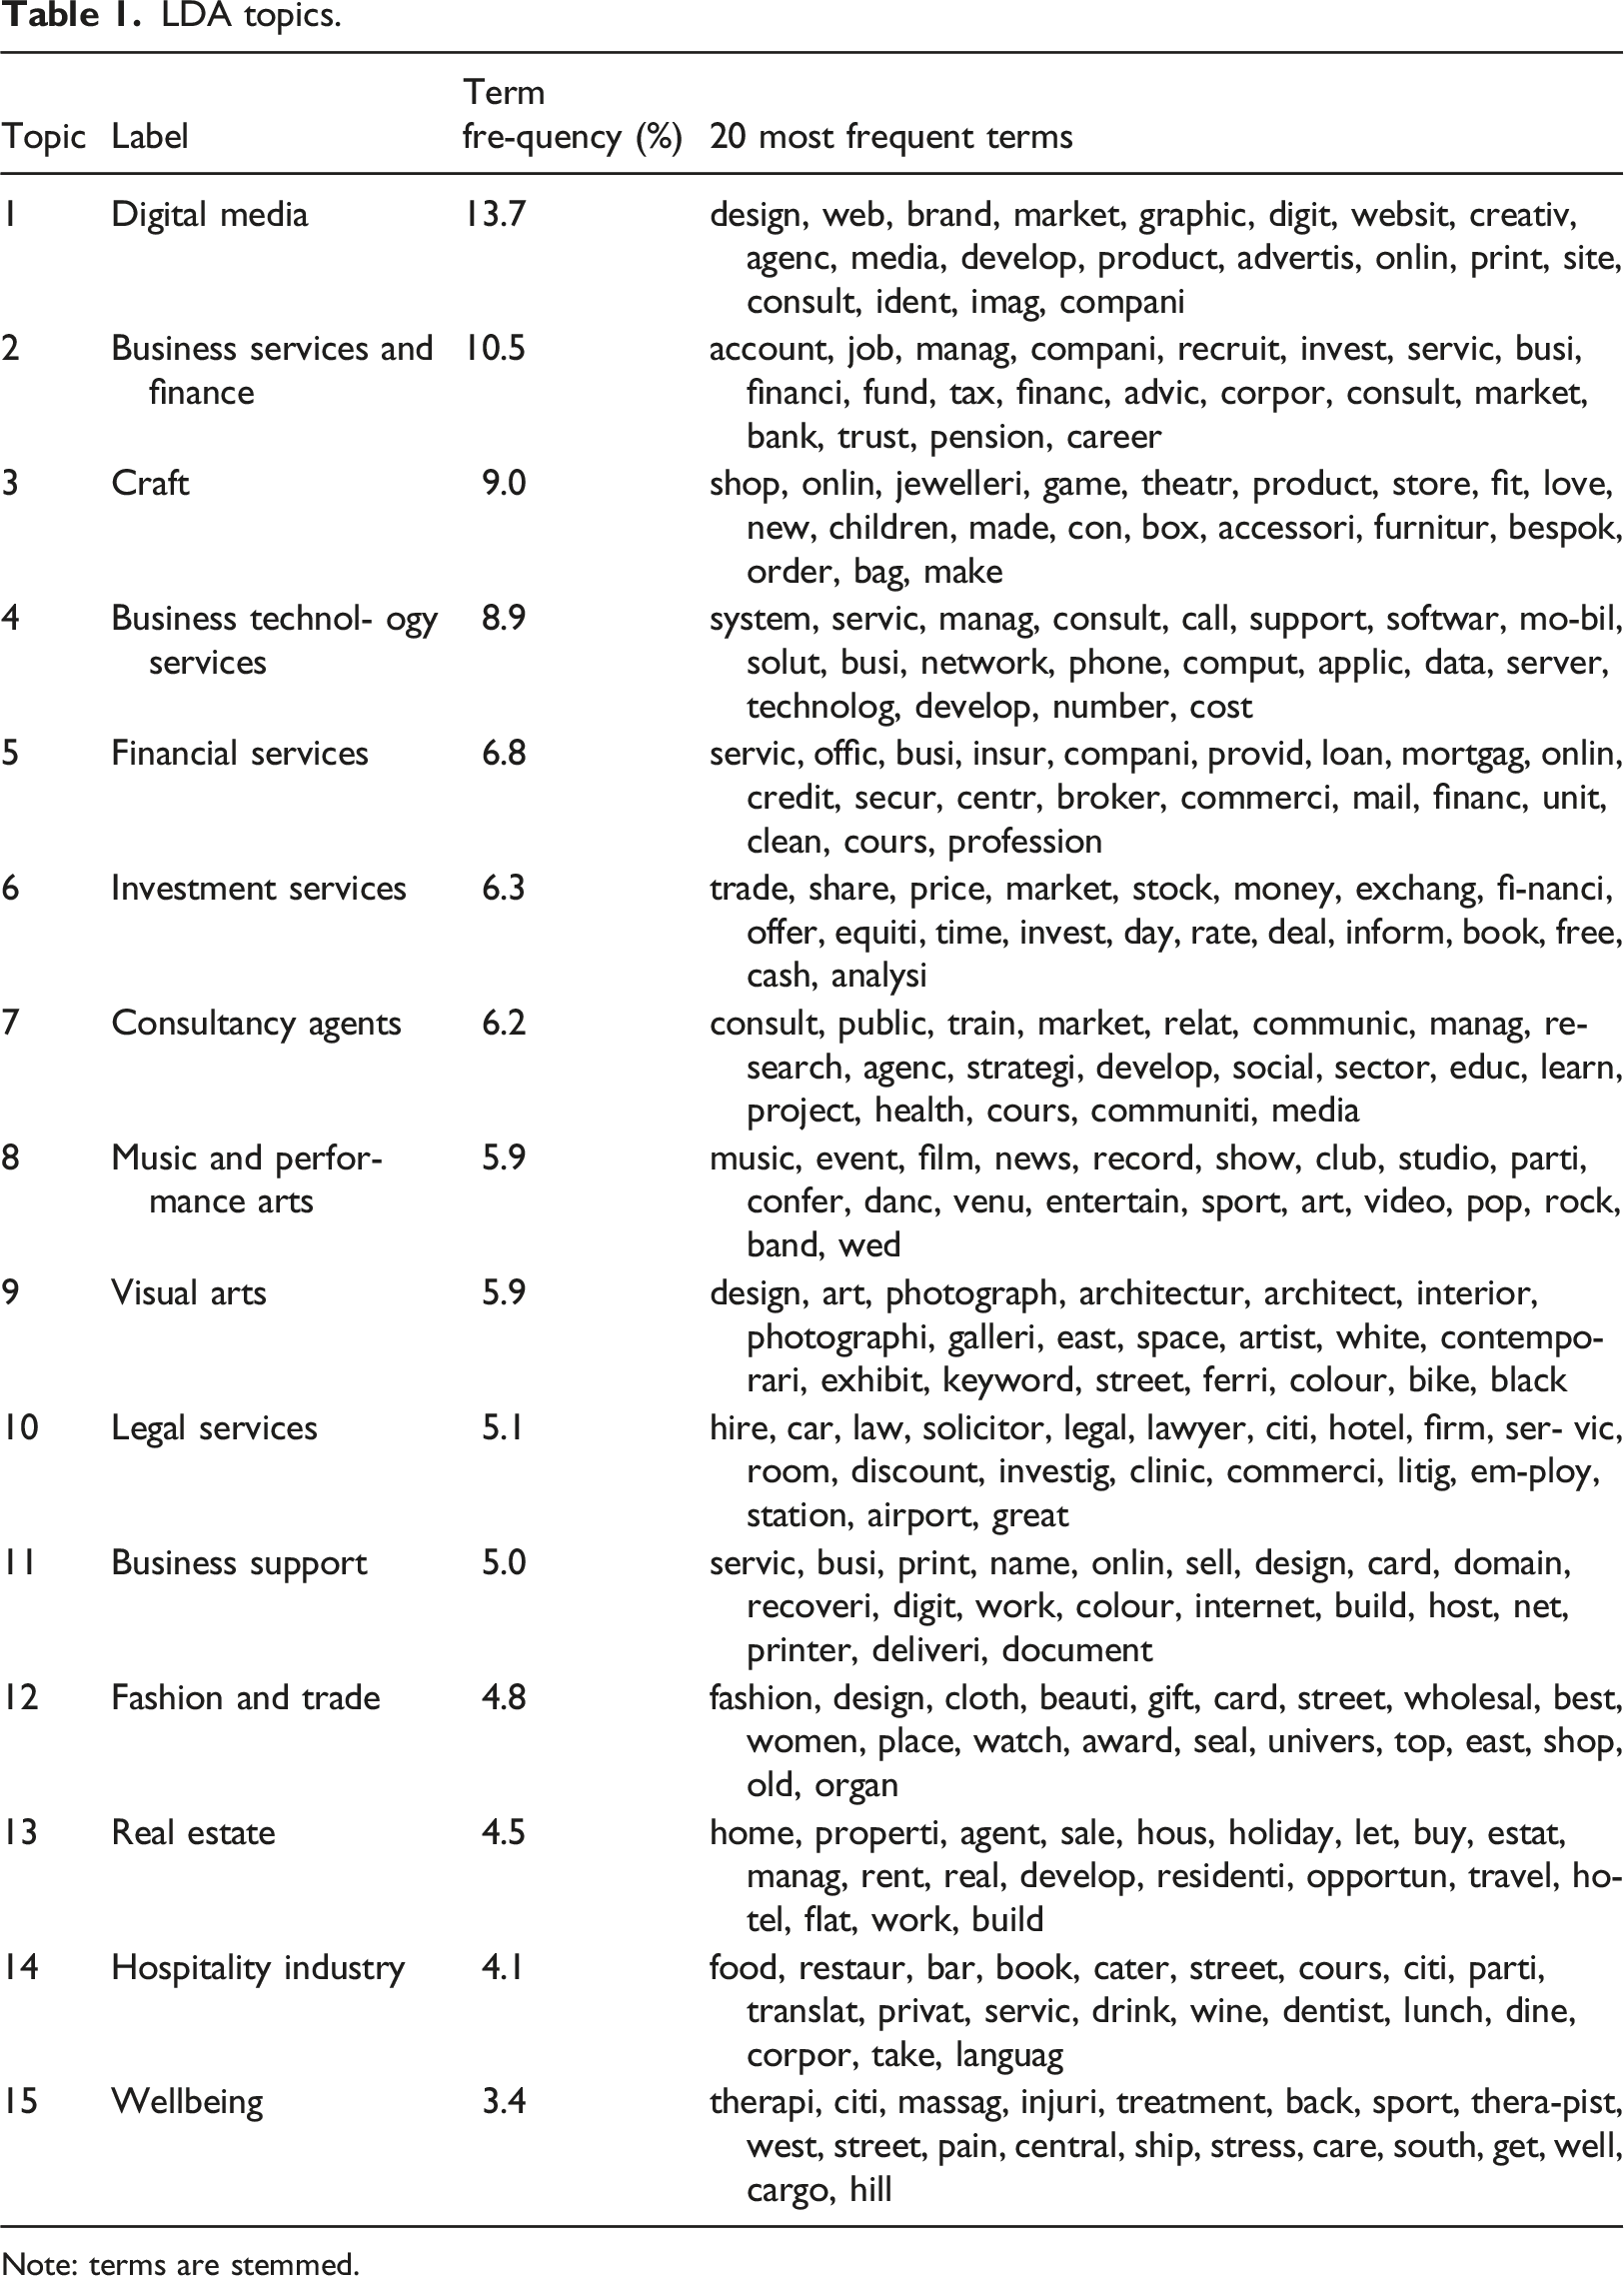
Note: terms are stemmed.
The last column of Table 1 presents the 20 most frequent terms – that is stemmed website keywords – for each topic for the last year in the study period (2012). We use these terms to label each topic and their underlying term-level relationships (Sievert and Shirley, 2014). We rank these topics based on the overall frequency of their terms. Importantly, the topics correspond closely to the stylized facts about the cluster.
The digital and creative character of Shoreditch is clearly depicted in topics 1, 3, 8, 9, 12 and 14. Digital media is the most prevalent one (topic 1) and is a good representation of the area’s creative and media-orientated technology cluster, as illustrated in recent case studies (Foord, 2013; Jones, 2017; Nathan and Vandore, 2014; Nathan et al., 2019). Its terms highlight economic activities related to online content creation and services, including roots in printing, graphics and ‘new media’: design, web, websit, graphic, digit. Other terms – creativ, media, print, imag – illustrate the area’s more recent creative core. A third group of terms covers the area’s digitized advertising and marketing activities, with terms such as brand, advertis, and indet.
Topics 3, 8, 9 and 12 depict the art scene of Shoreditch. The pre-WW2 craft tradition is reflected in topic 3 (shop, jewelleri, accessori, furniture, bespoke, bag, make). Music and performance arts are grouped in topic 8 (music, event, record, show, club, danc), while visual arts can be found in topic 9 (design, art, photograph, architecture, architect, interior). Topic 12 represents fashion related economic activities (fashion, design, cloth, watch). These LDA findings are in accordance with previous research and reflect past urban economic developments programs, which aimed to support creative industries including fashion, jewelry and furniture makers (Foord, 2013). Linked to the above is topic 14, which corresponds to the hospitality industry. This topic maps closely the typology of ancillary spaces for creative workers in Shoreditch uncovered in interviews by Martins (2015a): bar/pubs, coffee shops, restaurants, hotels, members’ club, parks, squares and street markets.
The second batch of topics are linked to business and financial activities. Topic 2 represents business services and finance as it includes terms such as account, job, manag, compani, recruit, invest, and finance. Financial and investment services are also present in topic 5 (insur, compani, provid, loan, mortgag, onlin, credit, secur, broker) and 6 (trade, share, price, market, stock, money, exchang, financi, analysi).
Topics 4, 7, 10 and 11 represent a bundle of advanced producer services, a key feature of global cities such as London (Taylor et al., 2014). For instance, we can identify business technology services (system, servic, call, support, softwar, mobil, solut, network, phone, comput, applic, data, server, technolog), consultancy agents (consult, public, train, market, relat, communic, manag, research, agenc, strategi), legal services (law, solicitor, legal, lawyer, citi) and broader business support (servic, busi, print, name, onlin, sell, design, card, domain, recoveri, digit).
Finally, the LDA revealed two topics linked to the urban nature of Shoreditch. Topic 13 reflects real estate (home, properti, agent, sale, hous, holiday, let, buy) and topic 15 wellbeing activities (therapi, citi, massag, injuri, treatment, back, sport, therapist).
Cluster evolution
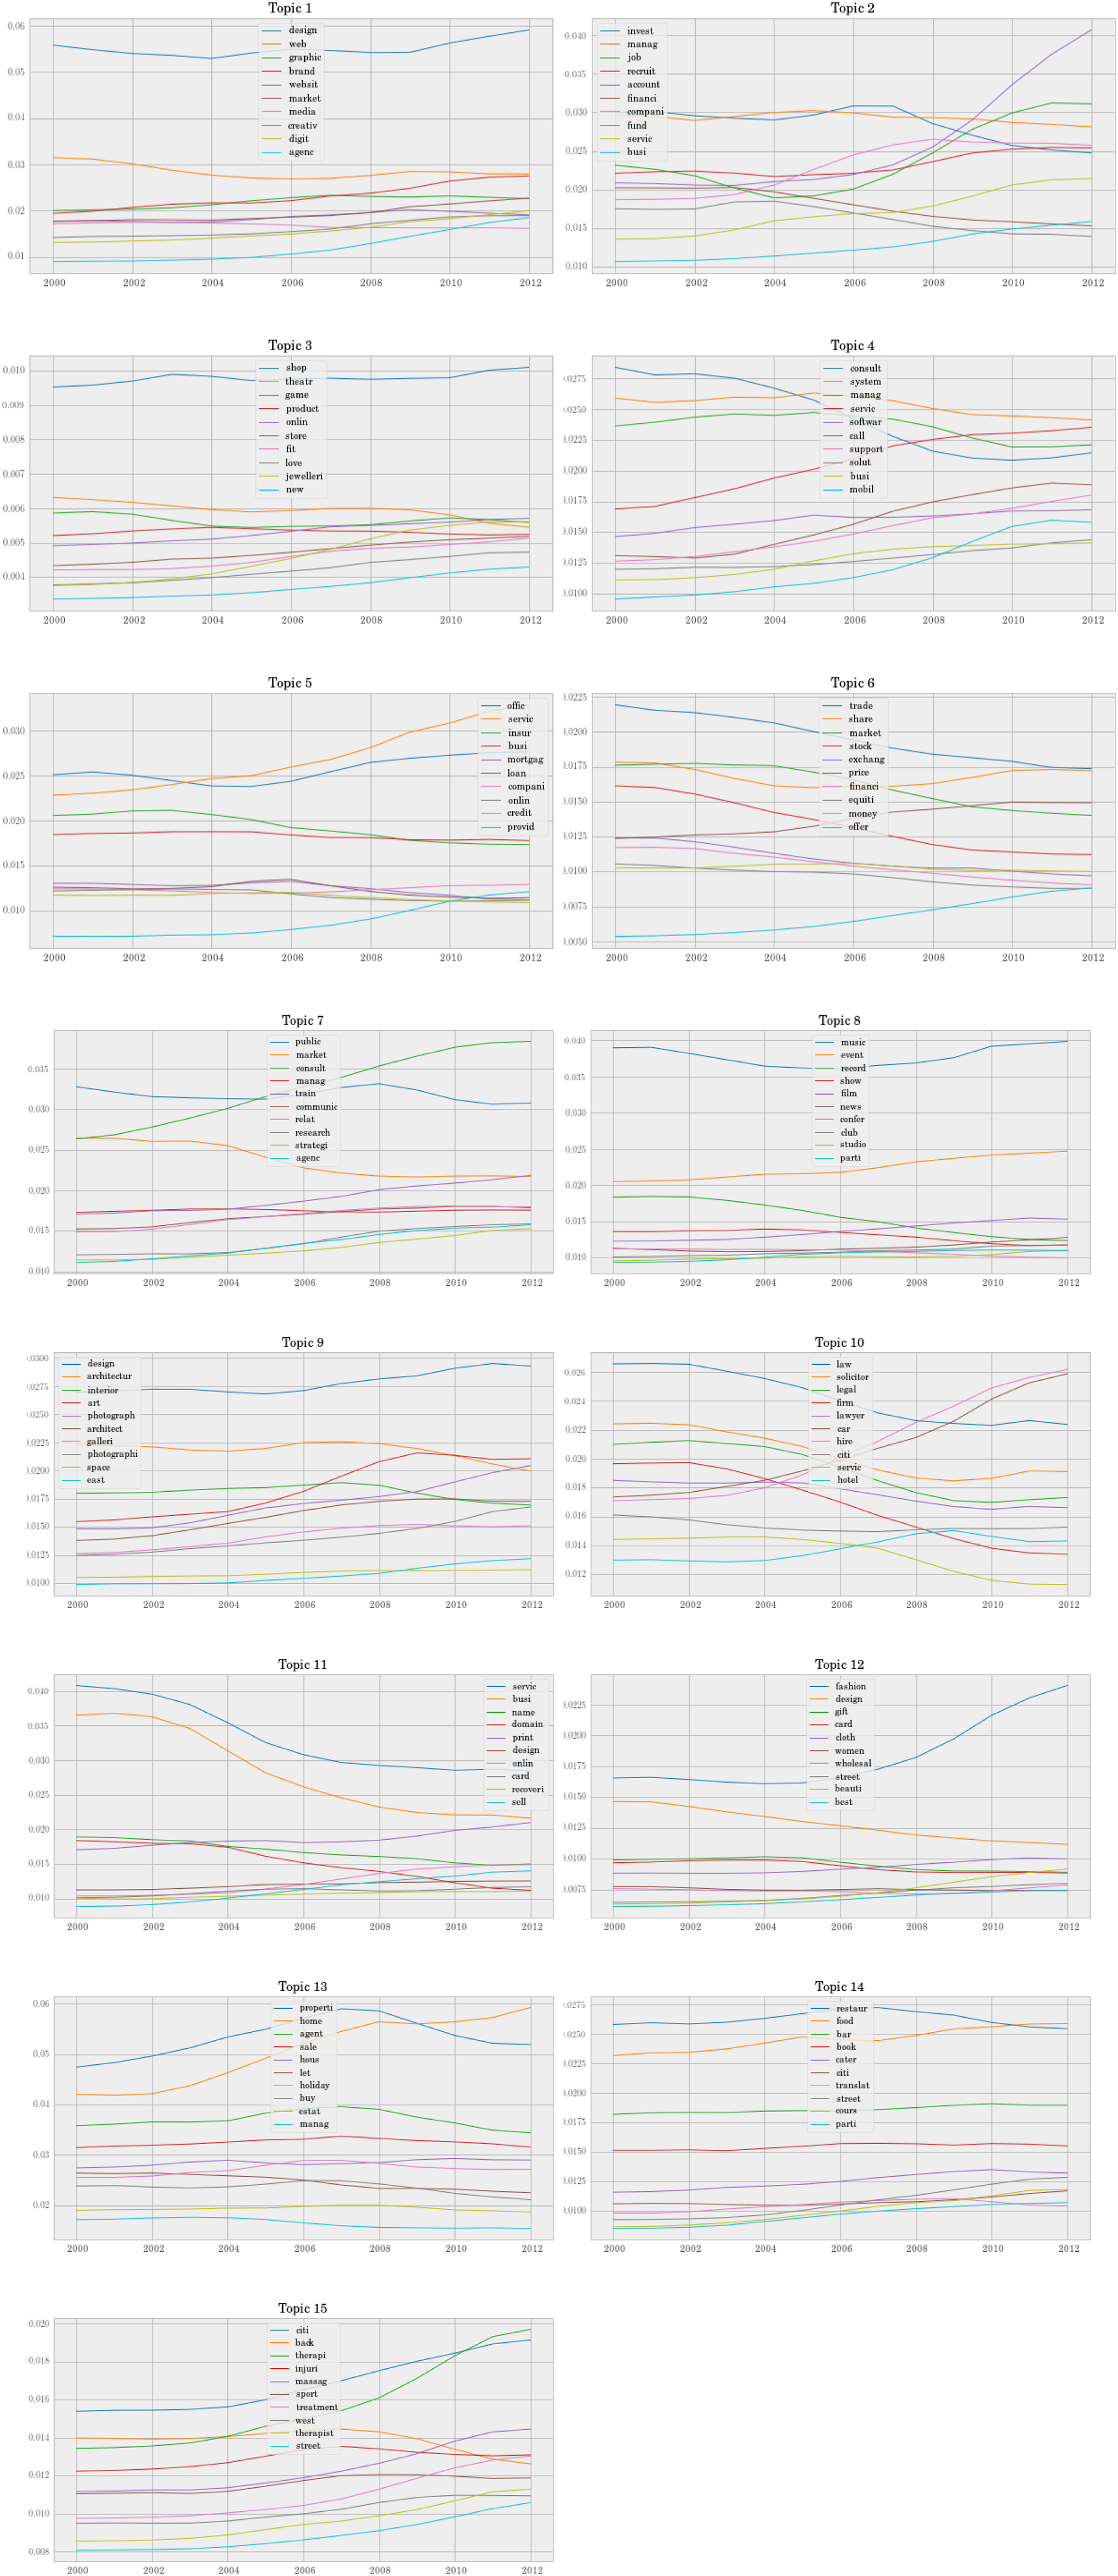
Evolutionary frameworks highlight the way economic systems such as clusters ‘branch’ over time, with new industries emerging out of technologically related prior layers (Martin and Sunley, 2006; Neffke et al., 2011). Our framework can explore these temporal dynamics by looking at the topic prevalence (Figure 4) and within topics term frequency (Figure 5). Topic prevalence over time. Dynamic term frequency per topic.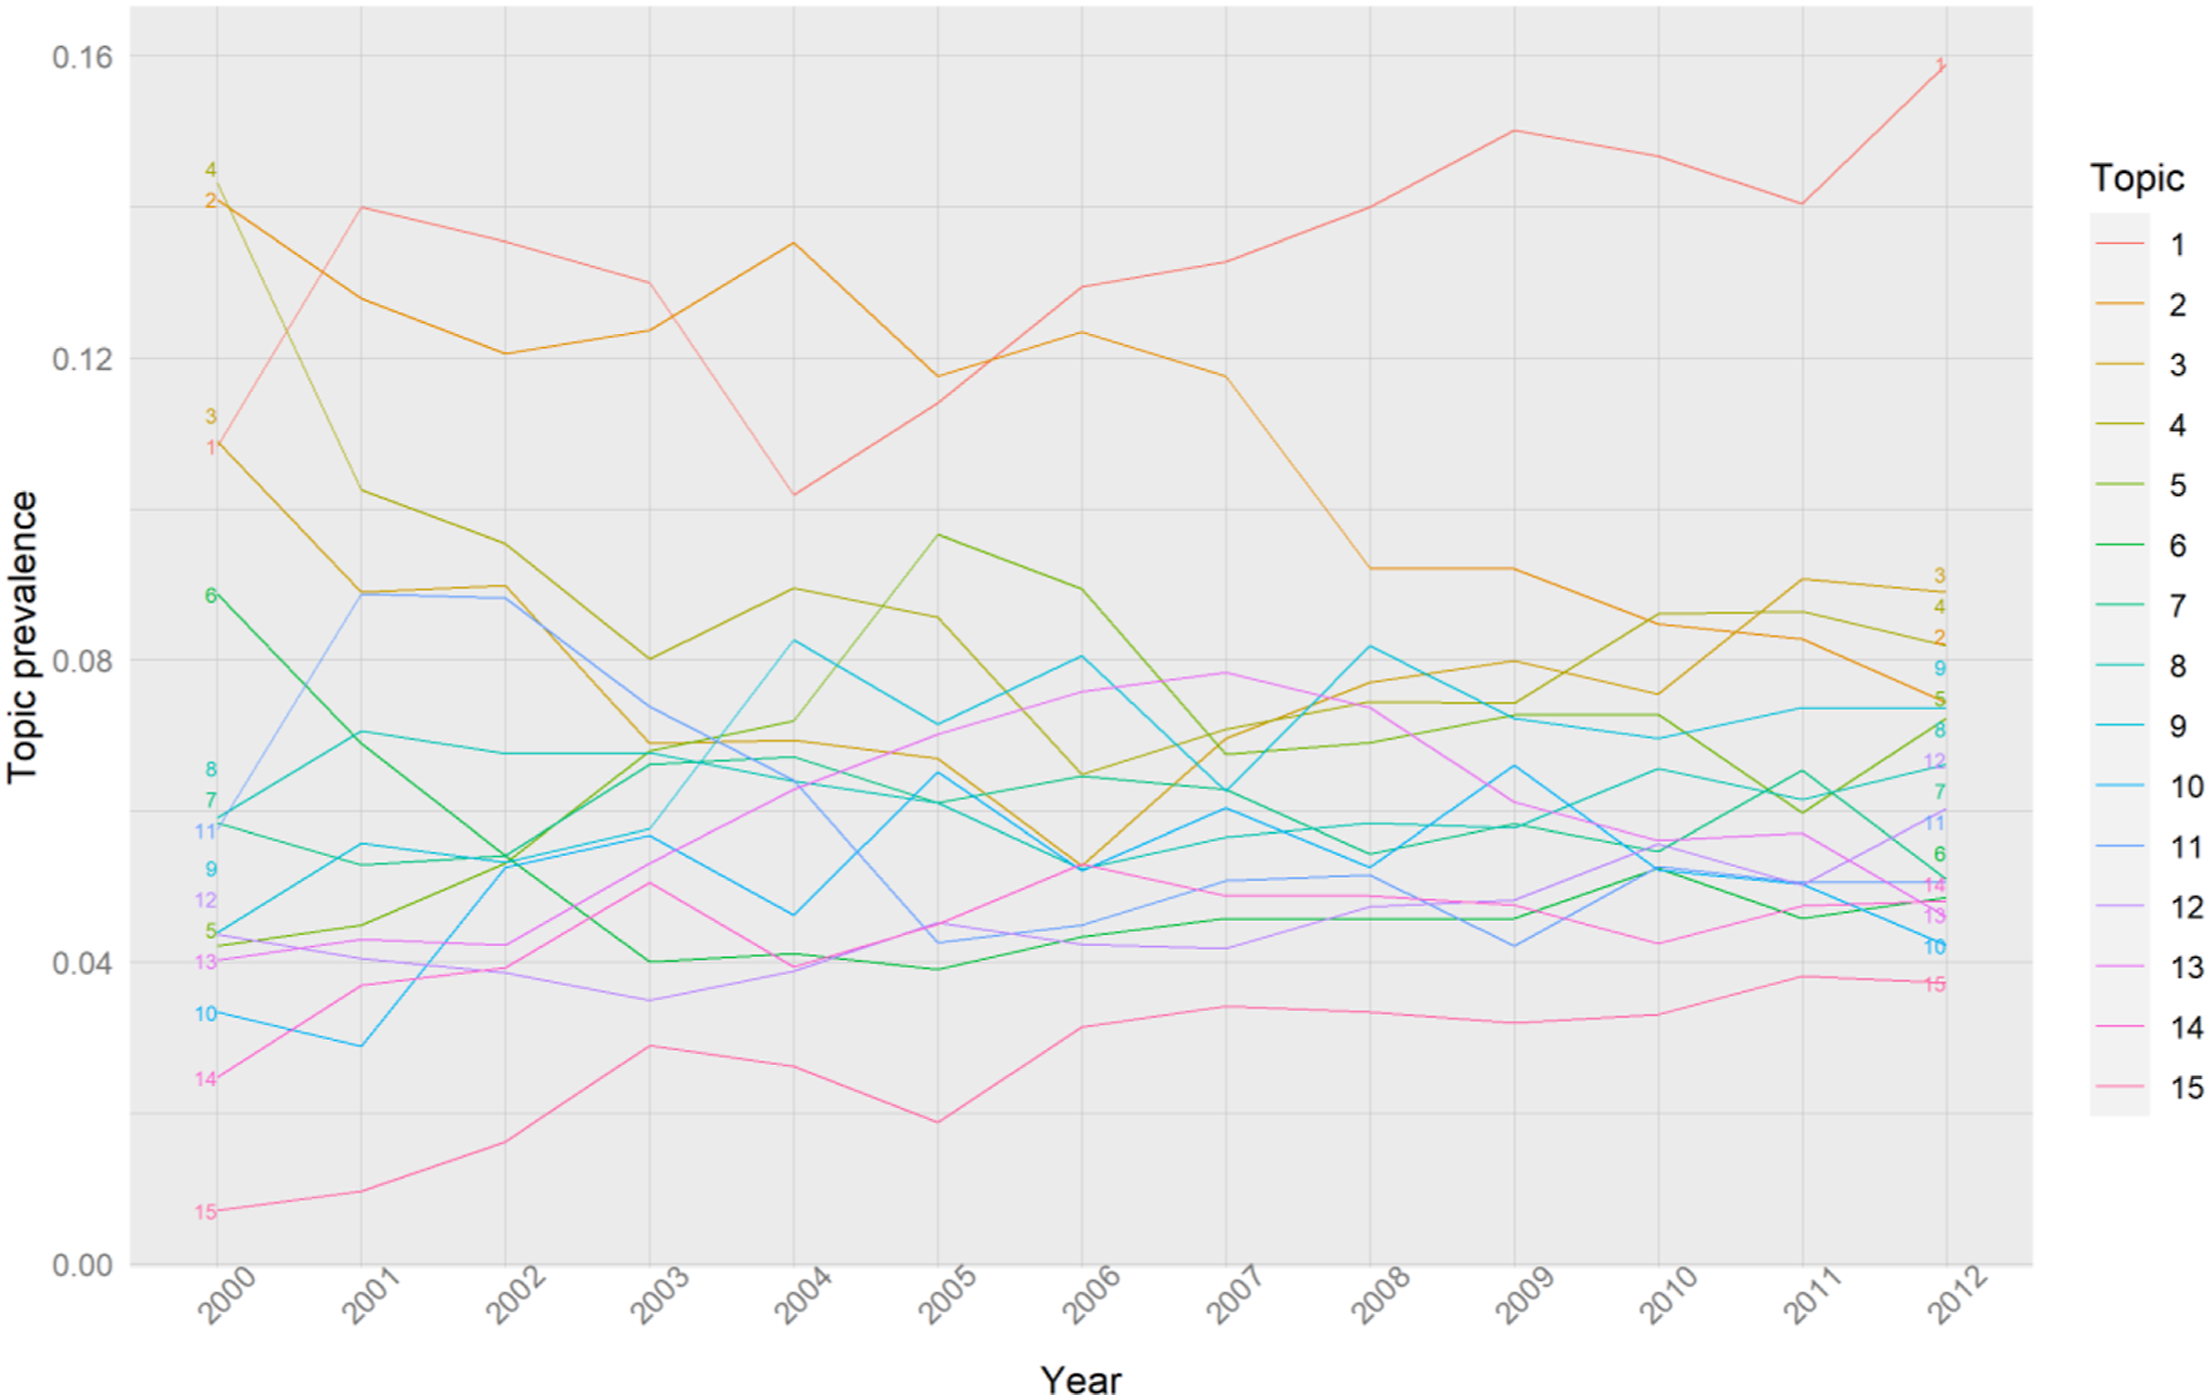
Again, our framework cleanly reproduces existing stylized facts (Cushman and Wakefield, 2013; Harris, 2012; Nathan et al., 2019). Digital media (topic 1) is the most prevalent topic with a brief exception during the post-dotcom crash period (2003–2005, Figure 4). It has an overall positive trend and its difference with the other topics increases over time. At the end of the study period, digital media is undoubtedly the dominant topic of the business websites geolocated to Shoreditch. Importantly, 2010 is the year of the launch of the East London Tech City programme, which aimed to ‘accelerate’ the cluster (Foord, 2013). In line with other evidence (Nathan et al., 2019), we observe an increase of digital activities a year after the policy intervention.
Business services and finance activities (topic 2) appear to have a competitive relationship with Topic 1 (digital media) as whenever the prevalence of topic 1 increases, the prevalence of topic 2 decreases and vice versa. Moreover, the prevalence of business technology services (topic 4) overcame topic 2 in 2010, consistent with digital technologies gradually shifting the industrial base of Shoreditch and leading to new and related economic activities, a process reflecting branching and recombination of knowledge within economic clusters (Boschma and Frenken, 2011; Boschma and Iammarino, 2009).
Economic activities linked to craft (topic 3) were decreasing in prevalence until 2006 and since then their importance steadily increases illustrating the resurgence of the crafts and art industries (Foord, 2013). A steady but small increase can be observed for fashion and trade (topic 12), which can be linked to publicly funded initiatives to support creative sectors such as the 2003–2009 City Growth Programme (Bagwell, 2008).
Figure 5 presents the within topics term frequency to assess how the consistency of topic changes over time. Starting from the digital media topic (topic 1), the term frequency remains stable. The main message is the consistent difference between the two most frequent terms – design and web. Design was and remained throughout the study period an integral characteristic of the economic activities clustered in Shoreditch. Similar observations can be made for the other related topics. Shop is the most frequent term for topic 3 throughout the study period reflecting the retail nature of the economic activities reflected in the craft topic.
Similarly, music and design are the dominant terms for music and performance arts (topic 8) and visual arts (topic 9). Regarding the fashion and trade topic (topic 12) the difference between fashion and design steadily increases highlighting the rising role that fashion plays for Shoreditch (Bagwell, 2008; Foord, 2013).
Contrary to the topics linked to digital and creative activities, business and financial activities topics are not as stable during the study period. The frequency of terms like invest, finance and fund drop after the 2008 financial crisis for topic 2 (business services and finance). Similarly, the frequency of terms including trade and stock decrease over time in topic 6 (investment services), while terms such as price and offer appear more frequently at the end of the study period. Within topic 4 (business technology services) the frequency of terms such as servic, call, support and mobil increases. The topic with the most changes is the one referring to legal services (topic 10). While terms such as law, legal, solicitor and firm decrease overtime, the frequency of car and hire increase.
Interestingly, we see the digital and technology terms associated with topic 1 appearing in other topics with greater frequency over time. We observe the growth of term onlin in topic 3 (craft) and 11 (business support), and softwar and mobil in topic 4 (business technology services), which is consistent with both the overall growth of digital technologies during the study period, and the technological diffusion within Shoreditch, from the dominant economic activities reflected in topic 1 (digital media) to other economic activities.
Our framework highlighted the well-established nature of digital and creative activities rooted in Shoreditch and the more volatile character of business and financial activities, which are present in Shoreditch, but as the next section highlights are spatially linked to adjacent areas. We were able to observe the evolution of economic activities illustrating processes of branching and, to a lesser extent, technological diffusion. Moreover, we associated changes in the prevalence of specific topics with place-based policies during the study period.
Cluster footprint
The heatmaps of the websites assigned to the different topics derived from the dynamic LDA model (Figure 6) expose the spatial structure of the different economic activities. Interestingly, the topics linked to the digital and creative character of Shoreditch (1, 3, 8, 9, 12 and 14) are anchored to the west and north of the Old Street roundabout, which appears in the center of the maps. We also observe some less intense concentrations in the south part of the study area linked to art, fashion and music (e.g. topic 8) as this is the area where the Barbican, a large arts center is located. Topic 14 (hospitality) has the same epicenter as the digital media topic reflecting again how interwoven these topics are. It captures all the study area just like consultancy agents and wellbeing activities (topics 7 and 15). On the contrary, business services and finance and investment services (topics 2 and 6) gravitate towards the City of London, a world-leading financial cluster. Altogether, although the maps clearly indicate two distinct poles in the study area – that is the more creative northwest quarter and the more finance focused south area which is adjacent to the City of London – they also exemplify the spatial mixing of different activities which synthesize the Shoreditch’s identity. The spatial footprint of the different topics.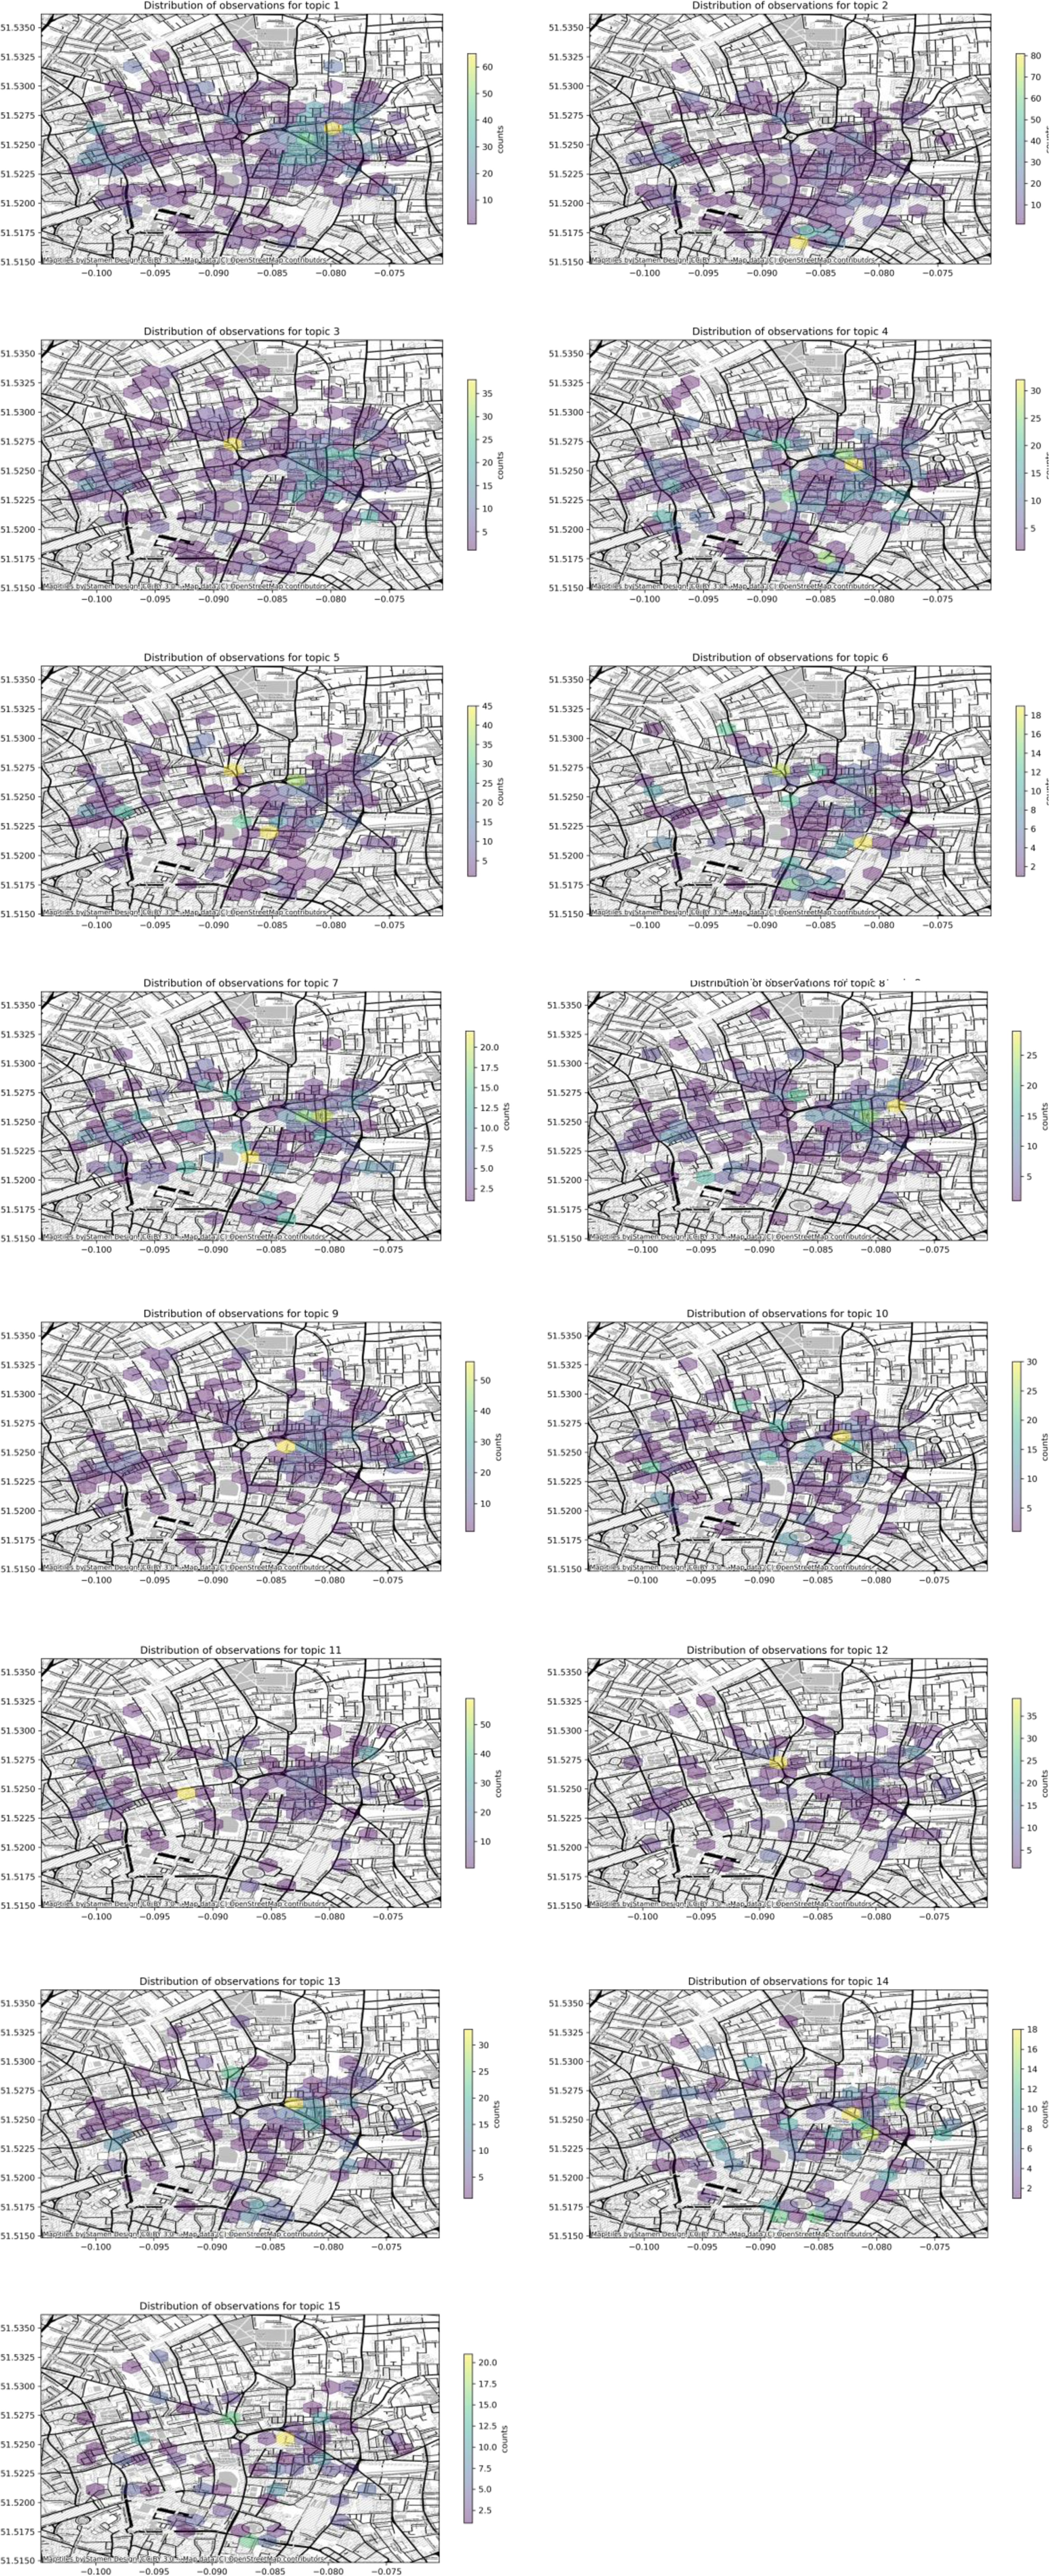
The above draws a detailed picture of the types of economic activities that are present in Shoreditch. Our analysis, which is based on freely available archived web data and data science methods confirms the results from previous studies, which were based on extensive interviews and fieldwork (Martins, 2015; Nathan et al., 2019), web inquiries on a pre-defined small sample of firms (Taylor et al., 2014), or secondary data analysis from propriety data providers (Foord, 2013). In addition, our approach enables to identify the evolution of these activities over time and provide a more in-depth analysis of the types of the economic activities that have been clustering and growing in Shoreditch.
In the supplementary material we provide two important extensions, specifically (i) a robustness check using an extended sample of archived, commercial websites linked to Shoreditch, and (ii) comparing the depth of analysis that our proposed research framework can achieve against the use of Companies House administrative business records. The first exercise confirms that our findings can also be replicated when using a much larger and spatially extended subset. The second shows that our approach reveals more insights about the economic activities of the study area than using administrative data, which tend to be the mainstream for such research and policy-oriented analysis.
Conclusions
Clusters, their formation and evolution are central issues in geography and urban science. Nevertheless, modelling clusters and their dynamics faces some hard-to-solve empirical challenges. This paper introduces a novel approach for analyzing and modeling clusters using public web data and data science methods. Our powerful and flexible approach, which is aligned with developments in qualitative GIScience, enables us to directly tackle some of these empirical challenges and implement many key theoretical concepts in cluster research, including within-cluster co-location patterns, local distinctiveness, related/unrelated variety of activity, and cluster evolution. We use this approach to analyze a well-known tech cluster in London, reproducing key stylized facts and generating new insights. We show that this approach is significantly more informative than next-best analysis using open administrative data. Our approach has multiple potential applications, not only for re-analyzing existing clusters, but also in detecting unknown or emerging cluster formations.
The use of unstructured textual data from the web enables us to move beyond the rigid SIC- based understanding of the activity space. Business websites typically accurately describe business outputs (Blazquez and Domenech, 2018a; Hernández et al., 2009). Using website metadata – HTML keywords which aim to accurately represent the activities behind a website in a concise manner – we depict the economic activities and their evolution in Shoreditch at a level of detail akin to the ones produced by qualitative studies based on lengthy participant observation and interviews, and greater than the one we obtained when we employed widely used administrative data. Despite the richness of our results, our methods and data are transferable to different spatial and temporal contexts given the current broad availability of web archives combined with tools and the computational capacity to analyze big volumes of textual data. Also, the spatial granularity of our data allow to overcome MAUP linked to the availability of only aggregated data about economic activities. Moreover, instead of focusing on firm registration addresses – which is a common fallacy of business administration data – the web data enables us to better approximate actual trading locations.
Our empirical findings are linked to key theoretical discussion within the cluster literature. Regarding the MAR/Jacobs debate, our analysis clearly indicates the role of specialization (digital content creation), but we also find evidence regarding the importance of diversity including the spillovers from the City of London and the importance of related ancillary activities. Despite the potential footloose nature of digital activities, co-location remains important for these firms, including tight co-location patterns within cluster space. From an evolutionary perspective, our analysis illustrates how the digital content activities have become dominant in the area, and how this specialization has led to the creation of new related economic activities. Although our aim is not to assess related urban policies, we observe a correspondence between the establishment of the Tech City programme and digital economic activities becoming dominant in Shoreditch.
The research framework proposed here is transferable to other clusters, for which we do not have enough data to study their evolution and specialization. It can also provide the basis for building algorithms to detect cluster formation on a near real-time manner and, therefore, directly support urban policy makers. The above exemplify the need to enrich the economic geography methodological toolkit with methods outside its traditional core including, among others, NLP which enables researchers to extract meaningful knowledge about places, their economic activities and relations utilizing the vast amounts of textual web data, which are currently unexplored.
Supplemental Material
Supplemental Material - Modeling clusters from the ground up: A web data approach
Supplemental Material for Modeling clusters from the ground up: A web data approach by Christoph Stich, Emmanouil Tranos and Max Nathan in Environment and Planning B: Urban Analytics and City Science
Footnotes
Acknowledgements
We are thankful to the participants of the following conferences: Building Better Methods in Economic Geography session in AAG 2019, ERSA 2019, RSAI-BIS 2019 and GfR2020. Thanks to the British Library for curation of the JISC UK Web Domain Archive and to OpenCorporates for Companies House archive data. Thanks also to the anonymous reviewers and the editor for their valueable comments and suggestions.
Declaration of conflicting interests
The author(s) declared no potential conflicts of interest with respect to the research, authorship, and/or publication of this article.
Funding
The author(s) disclosed receipt of the following financial support for the research, authorship, and/or publication of this article: The authors acknowledge funding from the Consumer Data Research Centre (CDRC) and Engineering and Physical Sciences Research Council (ESRC) (ES/L011840/1, ES/L011891/1). This paper represents the views of the authors, not the funders or data providers.
Supplemental Material
Supplemental material for this article is available online.
Notes
Author Biographies
References
Supplementary Material
Please find the following supplemental material available below.
For Open Access articles published under a Creative Commons License, all supplemental material carries the same license as the article it is associated with.
For non-Open Access articles published, all supplemental material carries a non-exclusive license, and permission requests for re-use of supplemental material or any part of supplemental material shall be sent directly to the copyright owner as specified in the copyright notice associated with the article.