
Abstract
Pedestrian navigation is often guided by points-of-interest and visibility, yet most planning and design models ignore these, solely addressing street networks. Our innovative ‘POI VizNet’ tool utilises open-source geographical data for integrating points-of-interest and visibility into network-based framework. The tool was applied to the Fitzrovia redevelopment project in London, to support the reallocation of urban activities based on desired locations of various assets. Our results demonstrate the quantifying of location patterns according to the planning project goals, and the examining of urban activities while controlling visibility and accessibility. The developed method is aimed to assist researchers and developers in making more informed planning decisions intended to promote neighbourhood vibrancy and create a sustainable urban context with mixed land use that is desirable for pedestrians.
Keywords
Introduction
Representation of complex city systems through graphs and networks
Cities are not only comprised of concentrations of people and activities but are also ‘systems of organised complexity’, formed through bottom-up, self-organising processes, and through top-down planning interventions (Batty, 2013). Moreover, people shape cities and in turn, are shaped by them. At the most fundamental level, this urban complexity could be abstractly defined as a set of structured relationships between spaces, activities, human perceptions, and actions. For decades, these relationships have been systematised by mathematical graphs and studied through network science (Agryzkov et al., 2017; Barthelemy, 2015; Ducruet and Beauguitte, 2014; Marshall et al., 2018).
Graphs are constructed from vertices (nodes) and a set of edges (links), whereas network may be thought of as a real-world situation, such as social networks (where the vertices are humans, and the edges are their interpersonal relationships) or the World Wide Web (where the vertices are webpages, and the edges are hyperlinks). In the urban context, different types of spatial representations can be used to portray networks – with graph vertices demonstrating relationships between urban features such as street intersections, segments, or names; street continuity or axiality; transportation systems and neighbourhoods; parks, buildings, and landmarks (Agryzkov et al., 2017; Barthelemy, 2015; Caduff and Timpf, 2005; Filomena and Verstegen, 2021; Jiang and Claramunt, 2004). In addition to urban features, vertices can bear characteristics of human behaviour such as pedestrian travel decisions. Relationships between vertices in a graph can vary, from representation of direct connections or distances to route-related choices (Boeing, 2020; Chrastil and Warren, 2014; Franz et al., 2005; Warren et al., 2017; Werner et al., 2000).
A unified framework for urban tissue, activities, and visual perception
In this paper, we explored how visual properties and physical space parameters are linked to the street arrangement, and as such should be incorporated in city planning and design. We examined and quantified the invaluable contribution of human visual perceptions to the creation of new activity patterns addressing the following research questions: (1) How can the urban environment be encoded as a network of pedestrian visual information? (2) How can relationships between the visual properties of street network, buildings, and urban activities be quantitatively formalised?
We developed the innovative open-source tool called ‘POI VizNet’ (see 1. Software Availability in Supplementary Material), which utilises open-source geographical data for integrating points-of-interest (POI) and visibility into street network framework. This customised software offers a novel unit of analysis that enables the examining of urban tissue (i.e. visual properties) and point-based activity locations. Unlike alternative urban network tools that operate solely using street networks (e.g. depthmapX), the ‘POI VizNet’ also encompasses additional urban elements, namely the locations of predefined POIs. We applied this tool to the Fitzrovia neighbourhood in London, UK, as a case study, enabling us to conduct a more comprehensive analyse of the given urban site, while suggesting new and more optimal allocation solutions. Moreover, by using it, we were able to study relationships between urban activities in the given setting, across a range of scenarios, to account for specific locations, buildings, entrances, or land use – none of which can be addressed in existing network approaches.
Background
The importance of visual perceptions and visibility
Emergence and planning of new locations in the city are strongly correlated with pedestrian activity, economic development, growth, and the overall wellbeing of the urban population. (Elzeni et al., 2022). However, existing graph-based approaches in urban studies are commonly applied to street networks alone and tend to ignore visual perception and relevant infourban activity information.
On the other hand, in behavioural and cognitive sciences there has been an increase in the use of graph-based models (Franz et al. 2005; Christoph Hölscher et al., 2006). These models schematise mental representations of environments and mainly rely on visibility properties, embedded in both the urban environment and human behaviour (Jiang and Claramunt, 2002; Kim, 2009; Lu et al., 2017; Turner et al., 2001). Unlike the simple notation of distance or location, visibility graphs (VG) used in these models and in the current study, reflect a cognitive complexity that is intertwined in urban realm.
Environment visibility and human visual perceptions – which shape our spatial cognition and play a major role in human behaviour (Gibson, 1979) – are key factors in orientating and functioning within the urban space (Javadi et al., 2016; Wang et al., 2014). More specifically, wayfinding, navigation, and exploration in an unfamiliar urban environment are based on utilisation of the sense of sight as a generative feature for shaping spatial memory and behaviour (Newman and McNamara, 2021).
POI as a key factor in pedestrian travel decisions
Most graph methods and tools only consider street networks (Boeing, 2017; Chiaradia et al., 2012; Jiang et al., 1999; Sevtsuk and Mekonnen, 2012; Ståhle et al., 2005; Turneavar, 2007), while ignoring additional aspects of the built environment, such as specific buildings and their purposes – assuming that it is solely the street configuration that impacts how a person moves (Hillier, 1996). Indeed, streets are the main channel of movement, and they are less destined to change compared to other urban features (Vernesz-Mouton, 1989). Central streets with high connectivity will probably always remain central and well-connected, despite urban evolution processes (Strano et al. 2012). However, aspects of urban form, such as the location of urban activities or POI are also very important (Yue et al., 2017). When only addressing streets as a unit of visibility analysis – as with the Space Syntax method (Hillier and Hanson, 1984) – the analysis fails to differentiate between the centrality values of a particular location at the different ends of the street. Instead, all locations along the street correspond to one single line, resulting in a single value that represents the street’s connectivity.
In urban studies, the ability to evaluate the level of attractiveness of different assets and features is a key concept, referred to as accessibility (Batty, 2009). Urban facilities and locations can be referred to as POI, and they function as origins and destinations of urban travels, or as accommodative centres for urban activities (Bielik et al., 2018). Typically, only metric distance is used for analysing POI locations. Gravity models and other accessibility methods predict bilateral goods and human flows based on the metric distance between land uses and POIs, while disregarding visual properties of the space.
As increasing volumes of geographic data in geographic information systems (GIS) become available, such as OpenStreetMap (OSM), readily accessible tools are needed to integrate POI locations into spatial analysis and planning techniques. Depending on the social, economic, or cultural context, POI could refer to the location of healthcare (Luo and Wang, 2003), drinking water (Yang et al., 2013), jobs (Hu, 2013), historic landmarks (Binski et al, 2019), different buildings, public transport stations, food and beverage facilities, residential homes, commercial services, sports and leisure centres, educational institutions, and many other urban assets. By utilizing the tool developed in this research, buildings, activities, or amenities on a given street can be analysed, leading to more precise perceptual results.
Methods
The ‘POI VizNet’ was developed using Python as a plug-in for Quantum GIS (QGIS), in compliance with open standards and available to the public to use for any purpose free of charge. The following sections present the visibility algorithm used in POI VizNet and provide an explanation as to how the visuospatial properties of urban environments are shown in the plug-in. Next, the redesign task is depicted, conveying the necessary materials and stages for utilising the tool to a specific neighbourhood.
Representation: Visuospatial properties of urban environments
To integrate visual properties and POI, street-level visibility graphs are needed. Figure 1 presents the principles of graph construction on the simplified fictional urban environment; later, these principals are applied and analysed in the Fitzrovia case study. Three types of visibility graphs, available in the POI VizNet plug-in, are represented by georeferenced and curved visualisations: (a) Integrative visibility graph; (b) Street network visibility graph; and (c) POI visibility graph.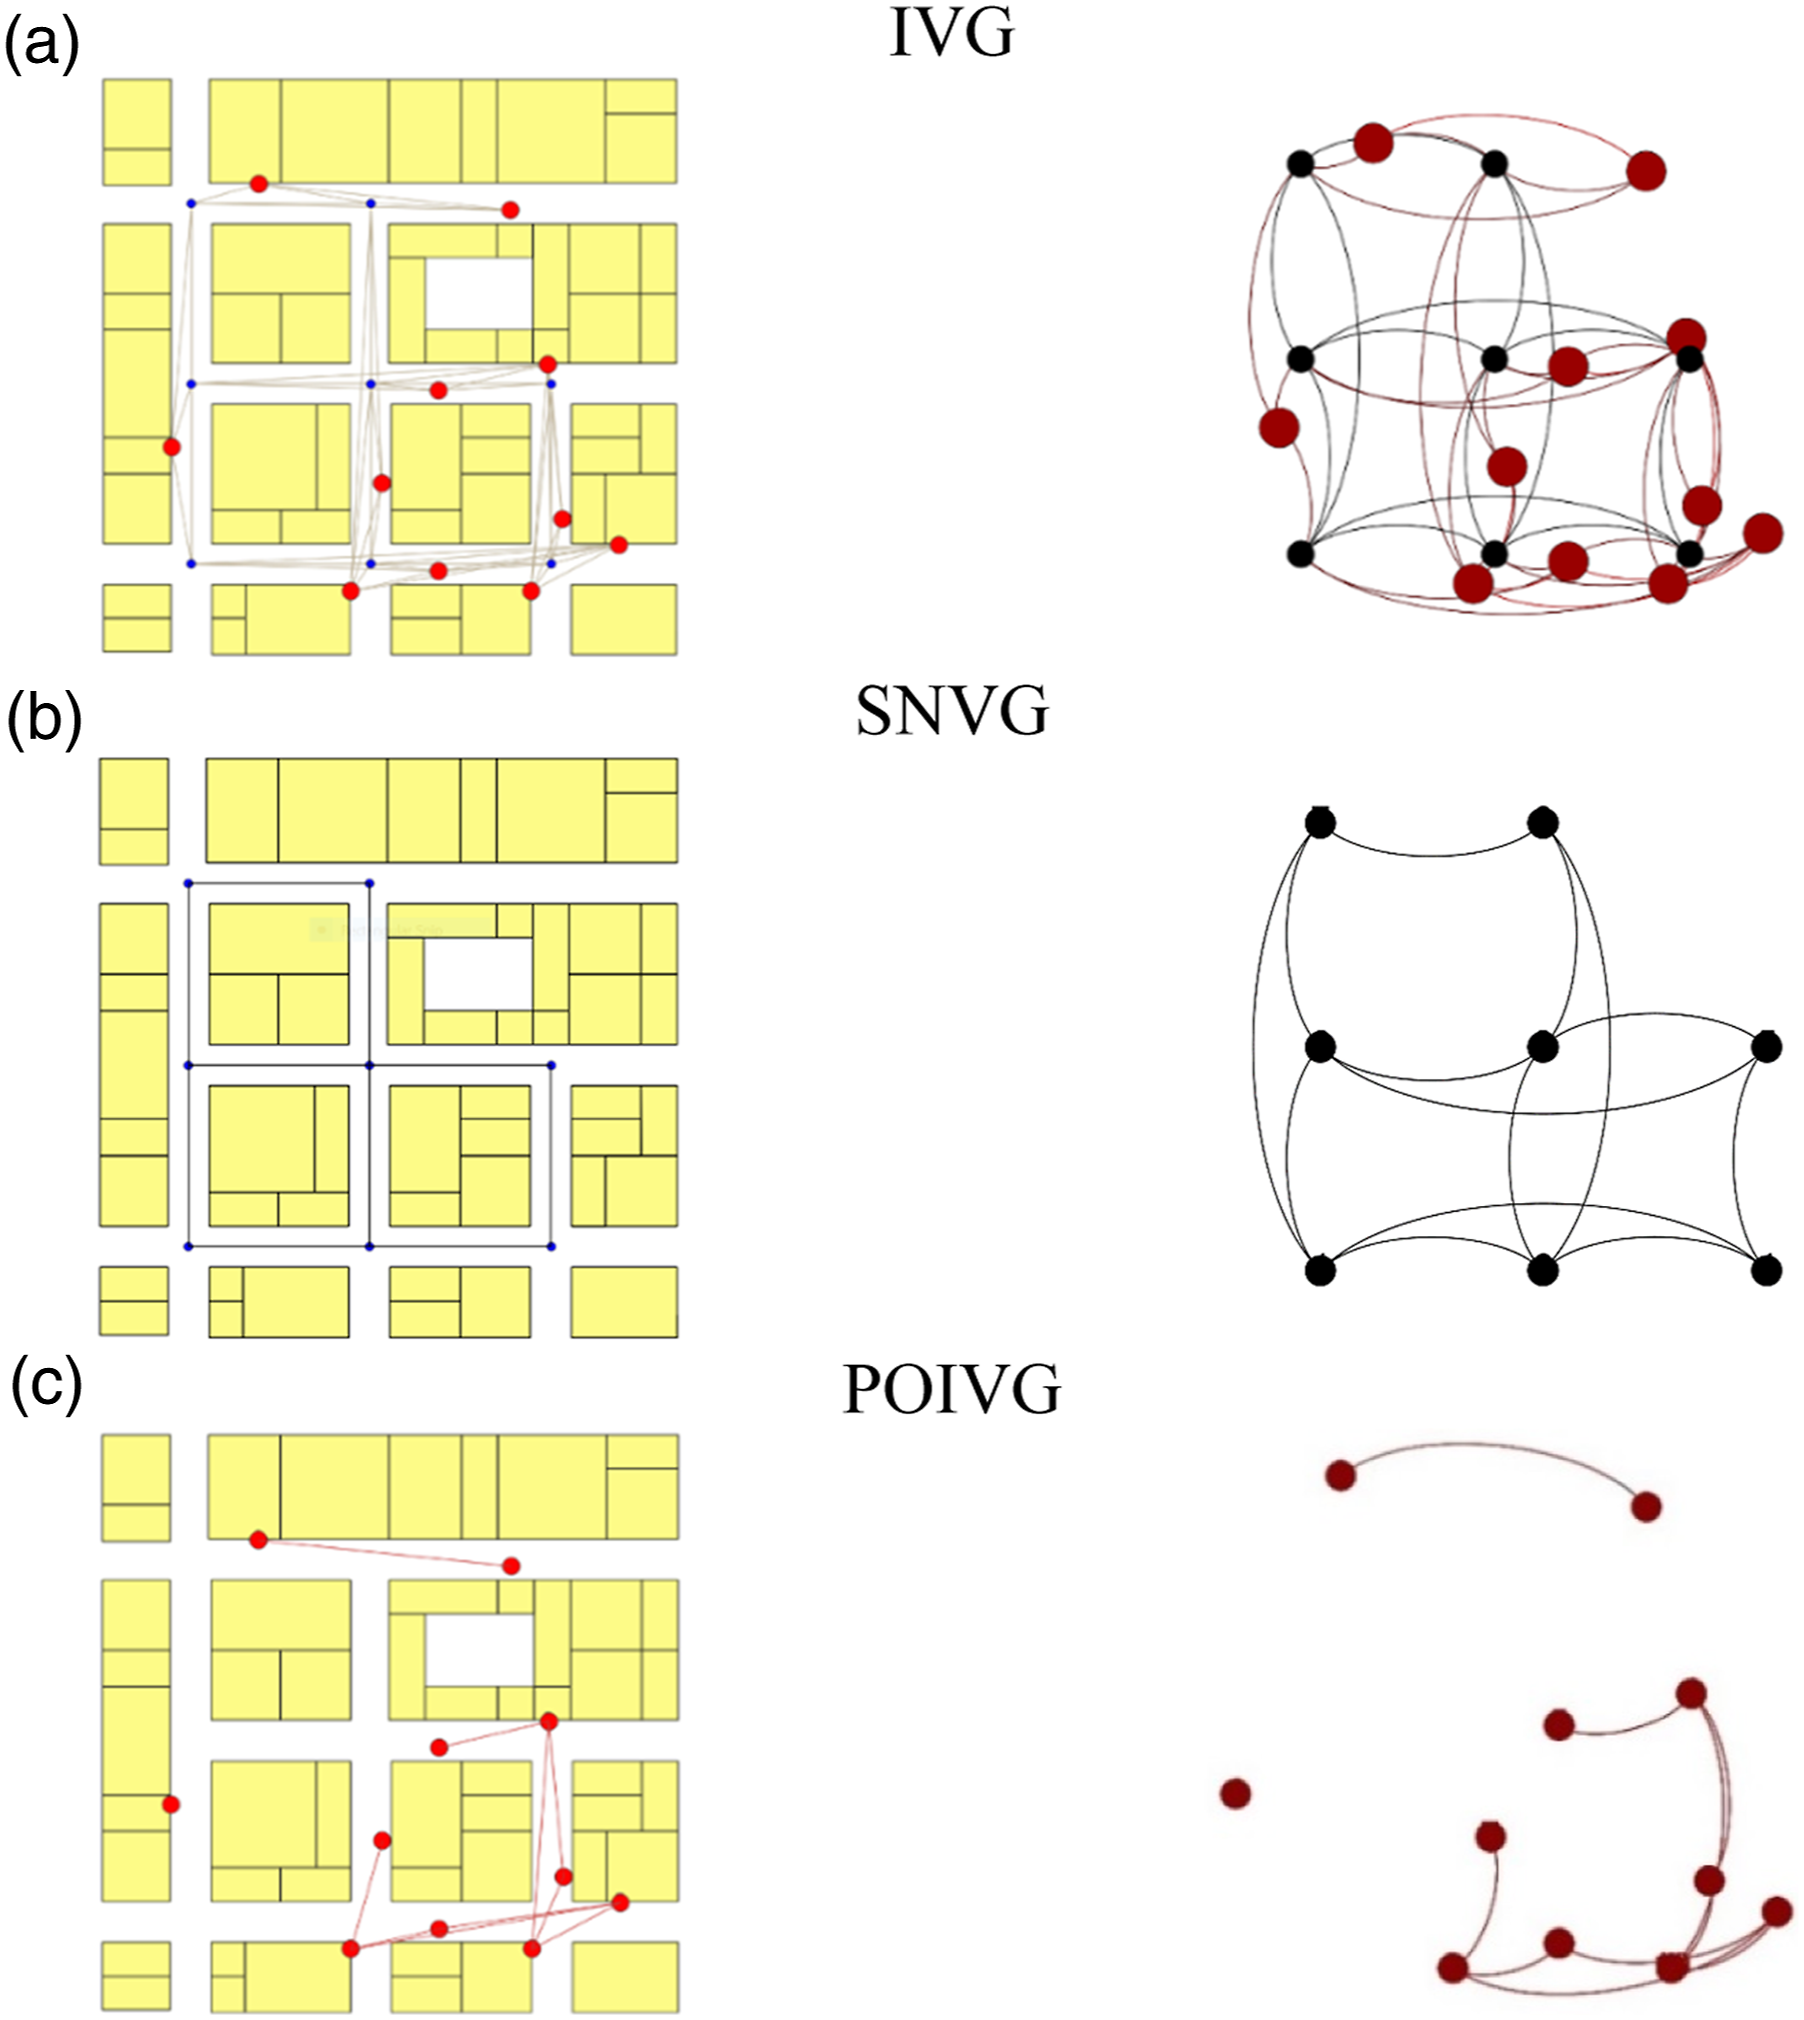
The urban environment was encoded using two types of vertices – street intersections and POI locations – that correspond with potential pedestrian decision points along the urban travel route (Supp Figure S1). If the street intersections and POI locations are visible from one another, then these two vertices are connected by viewing lines (i.e. graph edges). Moreover, as the footprint polygons of the buildings along the streets are considered visibility constraints – the created graphs illustrate the hypothetical visual trajectories of a person who is traversing open space between the buildings or seeking a particular POI.
Based on the above, the ‘POI VizNet’ can create three versions of visibility graphs: (1) Integrative Visibility Graph (IVG), which incorporates both navigational and functional aspects of the city and creates visual connections that integrate POI locations within the street network (Figure 1(a)); (2) Street Network Visibility Graph (SNVG), which creates visual connections between the street intersection, that is, navigational decision points within the street network (Figure 1(b)); and (3) POI Visibility Graph (POIVG), which summarizes how POIs are visible from one another (Figure 1(c)).
Visibility algorithm
When developing the ‘POI VizNet’, the main challenge was to construct the street-level viewing lines. To address this, we first built lines by connecting all the vertices (intersections and/or POI) disregarding building polygons (Supp Figure S2(a) and S2(b)). Next, we removed all lines that intersect with the building footprint contours (Supp Figure S2(c)).
The current visibility algorithm, adapted for working on the QGIS platform, is based on Natapov et al., (2013), who introduced the initial idea of POI-related visibility graphs using MathWorks, MATLAB, and on Jiang and Claramunt (2002) who proposed similar graph-based schematisation of street networks.
Pre-processing and the input data
To create visibility graphs in the ‘POI VizNet’, three input GIS vector layers are required: (1) a street network (centrelines drawn as polylines); (2) visibility constraints (building footprints drawn as polylines or polygons); and (3) POI locations (points, lines, or polygons). In cases where buildings are drawn as polylines, they are automatically converted to polygons by the ‘POI VizNet’. Depending on the drawing style of the original data, pre-processing operations were developed to identify street intersection and to transform POI information (described in detail in 4. Pre-processing and the input data, Supplementary Material).
Redesign task
To demonstrate how visibility graphs can be used, we applied the ‘POI VizNet’ to the case study in Fitzrovia, central London, covering an area of 800 m × 600 m (Supp Figure S5(a) and S5(b)). This historically bohemian area near London’s West End is characterised by a mixture of residential, business, retail, educational, and healthcare structures and facilities, with no one single land use of dominating activity. The chosen area represents an optimal extent of popular pedestrian and touristic trips, and offers flat topography, low building height, and most importantly – the availability of streetscape urban activities at pedestrian eye level.
Supplementary Figures S5(c), S5(d), and S5(e) show the GIS layers that are necessary for the analysis – the building footprints (polygons), street centrelines, and a point-based dataset of food establishments, which was used as POIs. We used food establishments as an arbitrary example of this speculative task, yet a large range of alternative POIs in the form of points, lines, or polygons can be utilised in the tool.
In our redesign task, we considered two alternative POI allocation scenarios based on two required conditions: (a) demonstrating a need to maximise visual proximity and accessibility, and (b) exhibiting segregated, minimised visual exposure. The first scenario is suitable for urban uses that evolve and thrive from pedestrian flows, such as storefront retail, food, and other so-called façade-oriented amenities (Talen and Park, 2021), while the second scenario is potentially suitable for any segregated, private, or illegitimate use that strives to avoid exposure and surveillance, such as private clubs, segregated venues, certain bars, some beauty salons, and gambling venues. These kinds of uses require previous spatial knowledge and tend to be located in more discrete and hidden areas (Natapov and Grinshpun, 2020; Spain, 2014).
We hypostatise that in the maximised scenario, POIs will have maximum visual accessibility, while in the minimised scenario, POIs will be visually disconnected. To assess new scenarios, we compare them to the original setting of Fitzrovia POI obtained from the OSM.
Main operational steps and attractiveness measurement
There are five implementational steps of the redesign task (Supp Figure S6). First, input data are prepared (Section Pre-processing and the input data). Next, the desired graph types are chosen (Section 3.3.1 Fitzrovia graph construction and visualisation). The third and main step entails the construction of the visibility graphs between the chosen location options, which is then displayed on the QGIS platform. At this stage, the graph data file (GDF) is created for further analysis outside the plug-in. Next, the graphs are analysed using a network analysis software, such as Gephi (Jacomy et al., 2009) or any other network analysis package.
To quantify the maximum or minimum visual accessibility and to assess the ‘importance’ or ‘influence’ of the individual locations (i.e. the vertex within the graphs) we used three network measures from the social network analysis (Freeman, 1979) detailed in 7. Graph definition and measures, Supplementary Material. Finally, the results of the analysis are visualised back into QGIS and made available for further exploration.
Fitzrovia graph construction and visualisation
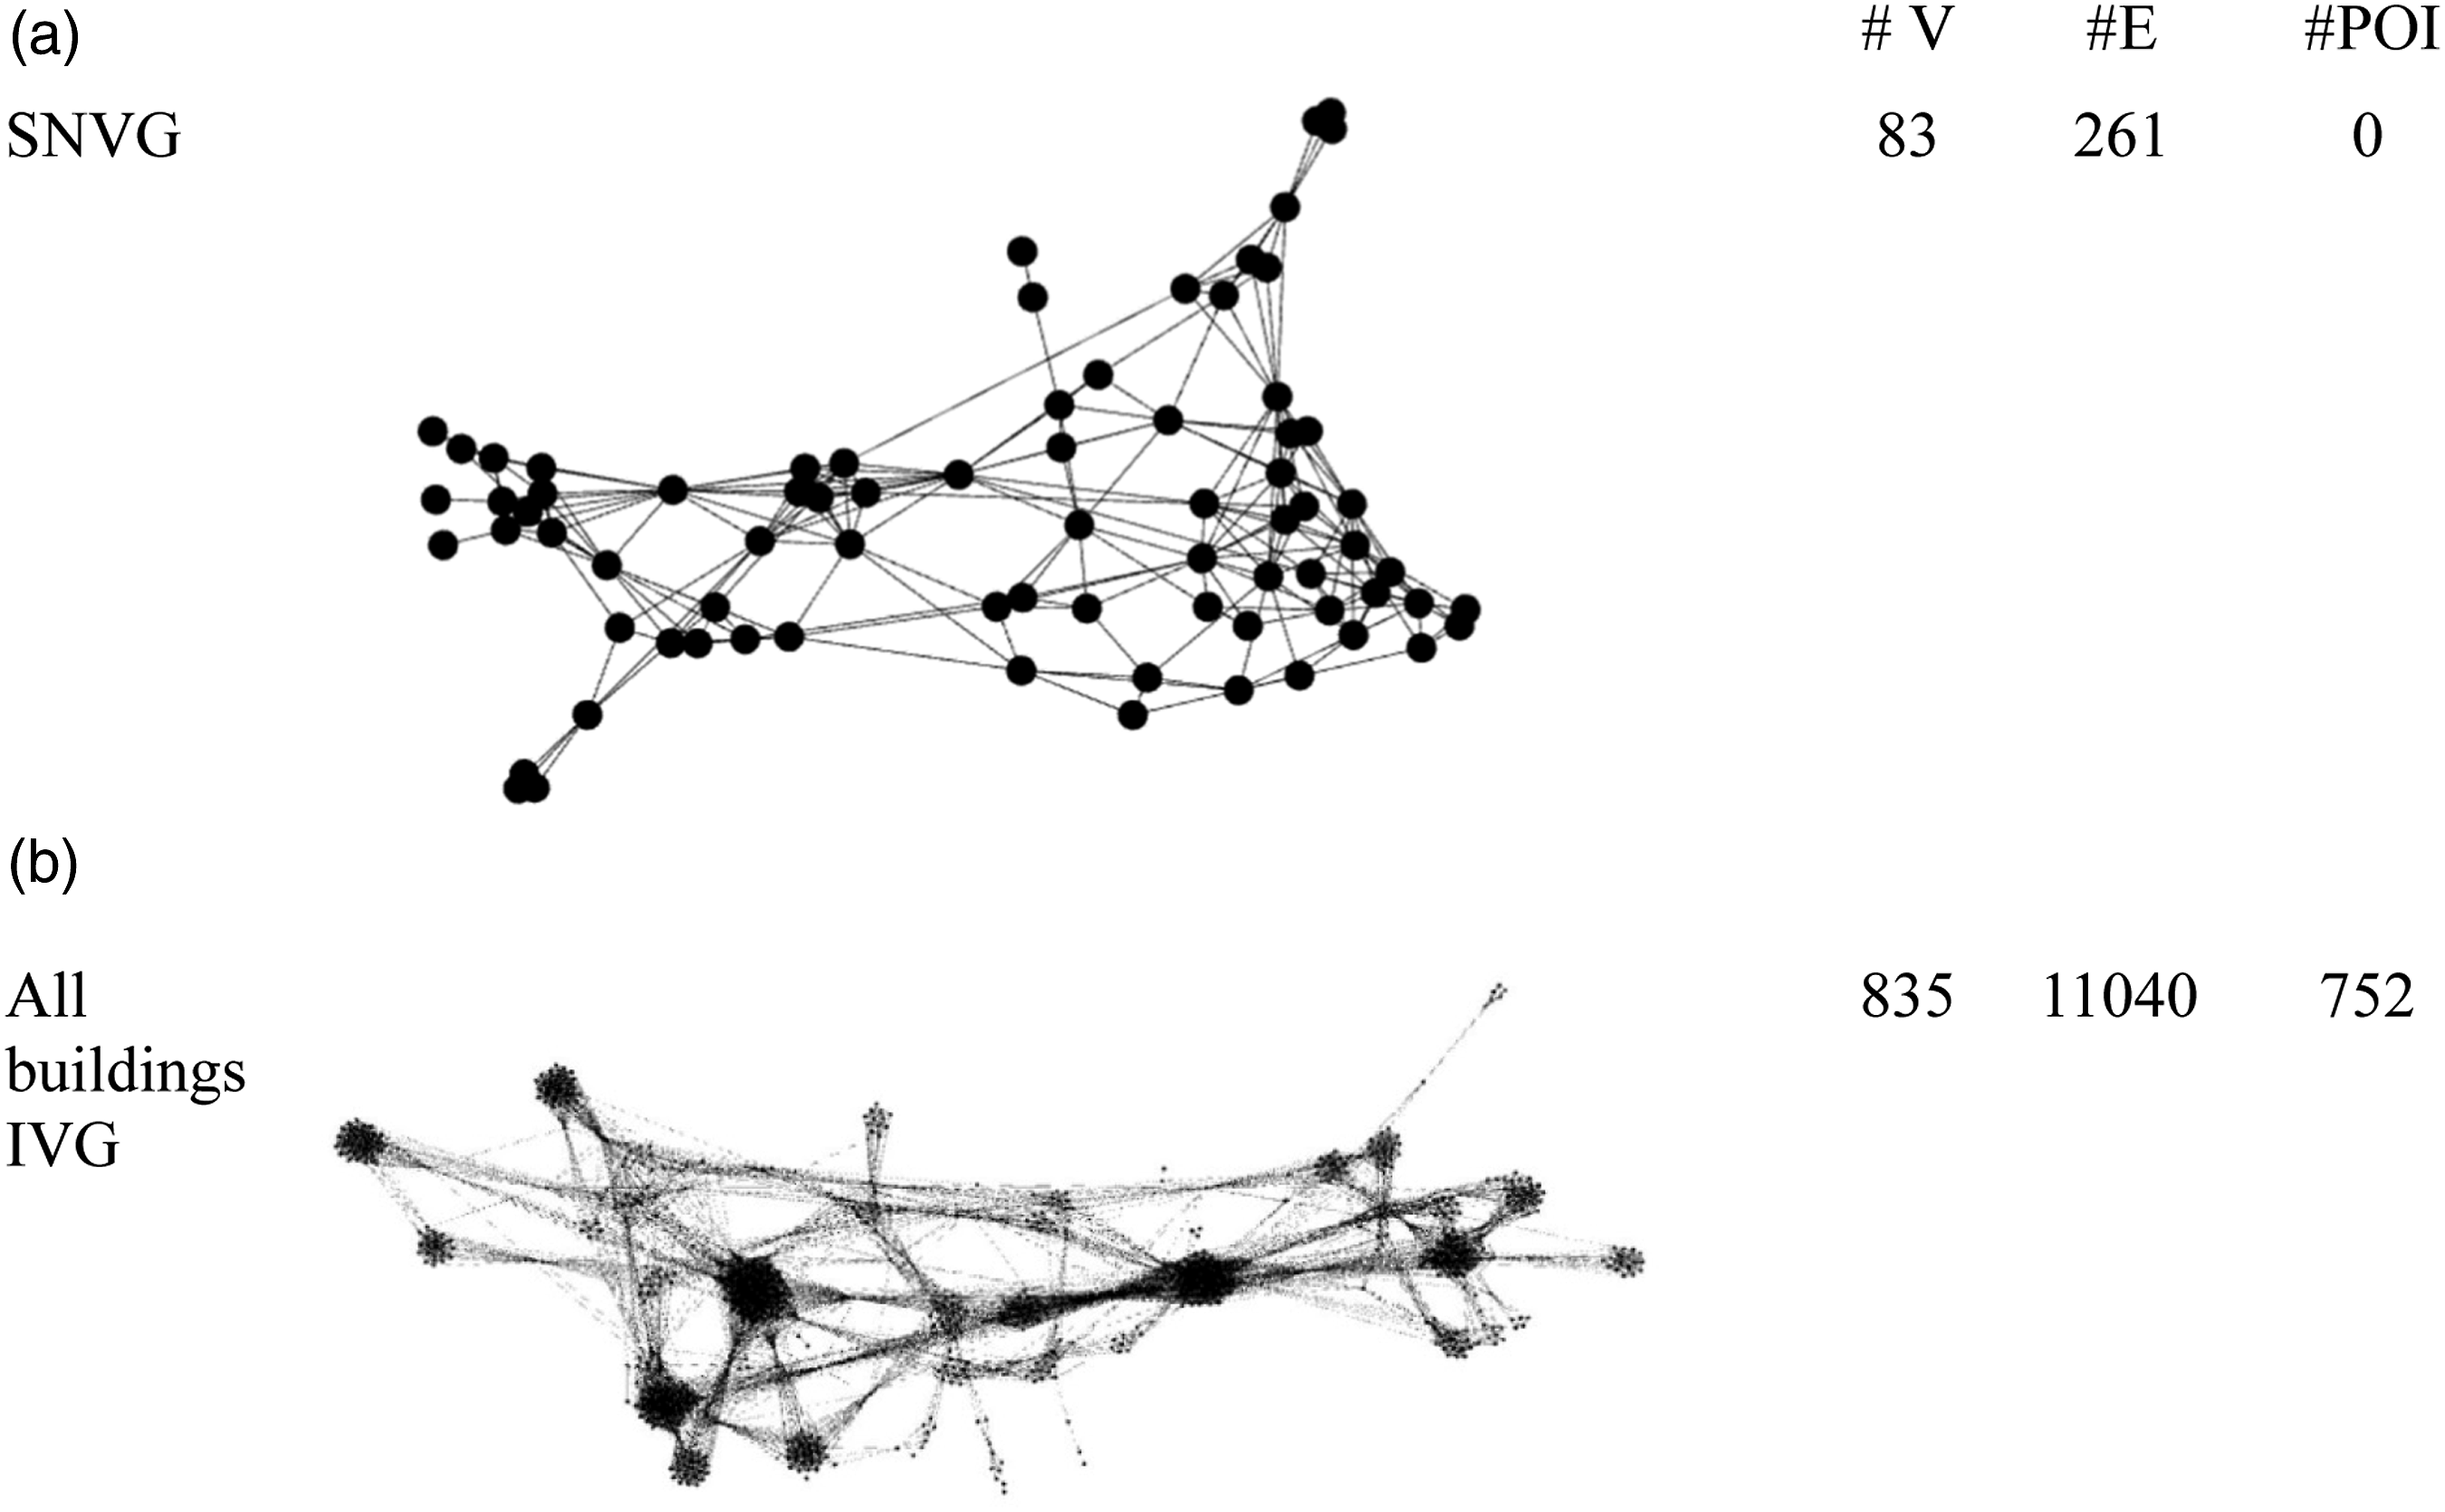
We identified in Fitzrovia 83 intersections and 21 POIs and performed redistribution of POIs for new scenarios using the following graphs: (1) SNVG (Figure 2(a)), which is used as a base to examine street network for both redesign scenarios. The original Fitzrovia’s street network remained unchanged, therefore the SNVG centrality analysis allowed us to find the most visually attractive and segregated street intersections in the area (Section 3.4.1, Supp Figure S7). (2) IVG of the original layout, whereby all existing buildings served as potential locations for new POIs, called ‘All building IVG’ (Figure 2(b)). The graph is used to find potential locations of building entrances for the most visually attractive and segregated POIs (Section 3.4.2, Supp Figure S8). (3) Three additional visibility graphs: the original IVG with existing POI (food establishments), maximised IVG, and minimised IVG with new POI. These are later used to assess new scenarios (Section 4.1). (4) Finally, we built a POIVG for the three options (original, maximised, and minimised), to study the mutual relationship of the POIs in the different design scenarios (Section 4.2). Street network visibility graph and ‘all buildings IVG’ and their corresponding number of vertices (#V), edges (#E), and POIs.
Redesign process
Street intersection identification
In the maximised scenario, POIs will tend to be allocated near central street intersections, while simultaneously having a high visual value of visibility at the building entrance. On the other hand, those in the minimised scenario will be found in proximity to the most segregated and isolated street intersections and will have the lowest possible values of the building where the entrance is located.
To identify the 21 street intersections suitable for each scenario, we calculated centrality measures of the SNVG vertices (Supp Figure S7(a)). A total of 21 locations were needed as this is the number of POIs in the original environment. First, we identified 21 street intersections for the maximised scenario, choosing those with the highest accumulated visibility. Then we did so again for the minimised scenario, this time choosing those with the lowest accumulated visibility (Figures S7(b) and S7(c)).
New POIs generated from existing buildings
Next, using the IVG of ‘all the buildings’ in the area, we calculated and visualised centrality measures for potential locations of POIs in both scenarios (Supp Figure S8). These locations were extracted as a projection of the building centroid of the existing building polygons. We then chose 21 locations twice: those corresponding to the highest POI values and then those corresponding to the lowest POI values (Figure 3). When identifying these locations, we also considered the proximity of the highest and lowest intersections identified in the SNVG of the area in the earlier phase. (a) 21 POIs with the highest accumulated visibility; (b) 21 POIs with the lowest accumulated visibility.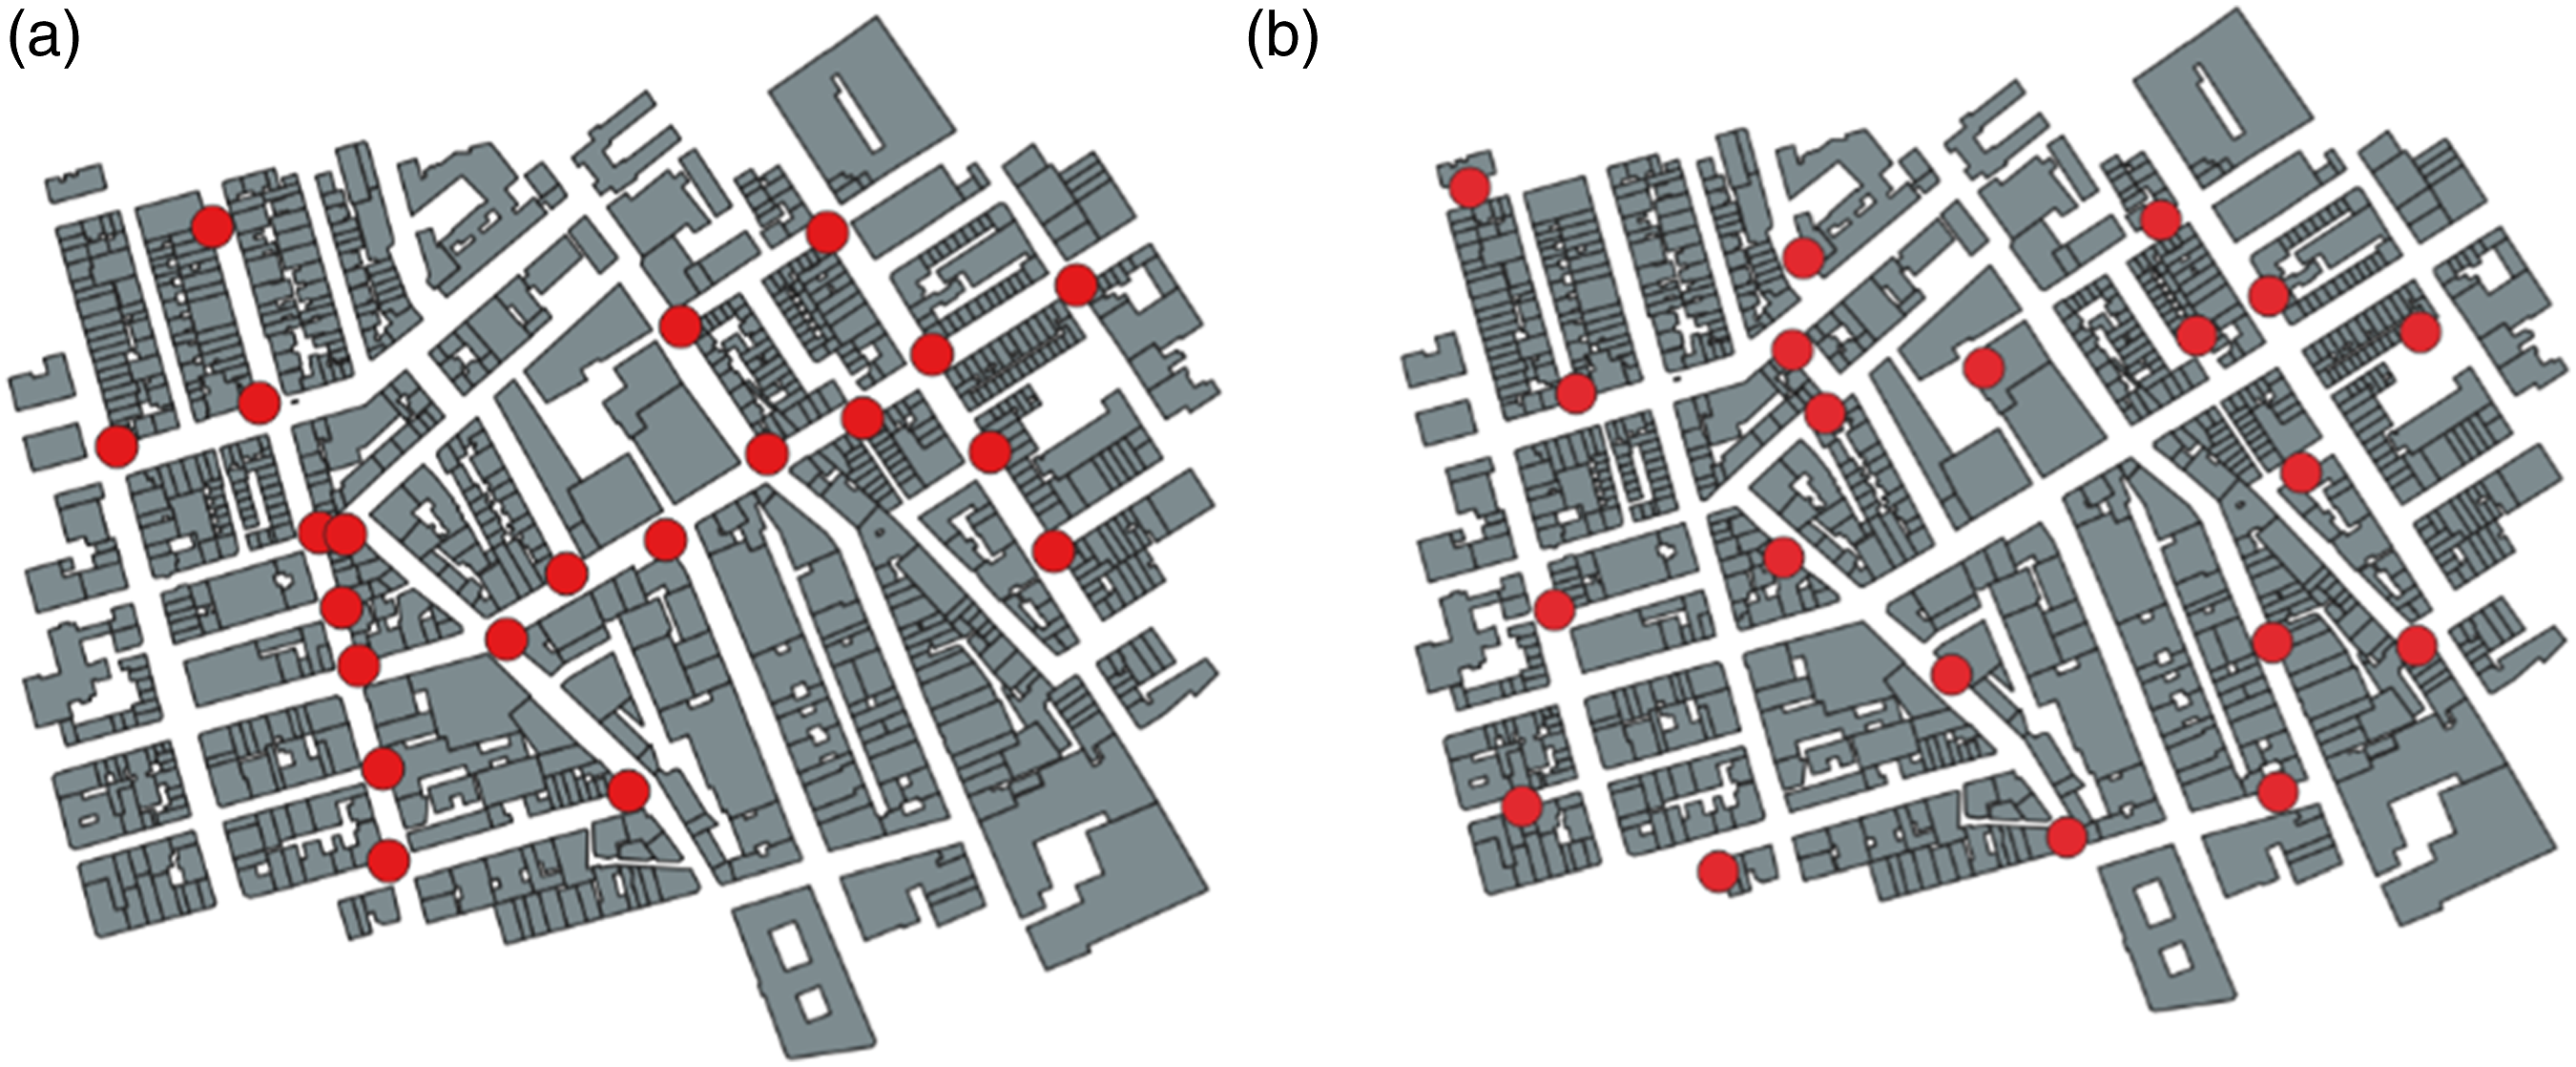
Results
Comparing between scenarios
We compared the visibility graphs for two new urban scenarios with the original environment. Figure 4 presents visualisations of the three cases (original, maximised, and minimised) using the Gephi force directed visualization tool. This tool produces visualisation of the degree centrality that serves as the dependent repulsive force – vertices are pushed apart from each other like charged particles, while edges attract their vertices like springs. Comparison of the IVG visualisations: (a) Original; (b) Maximised, depicting two distinct clusters; (c) Minimised.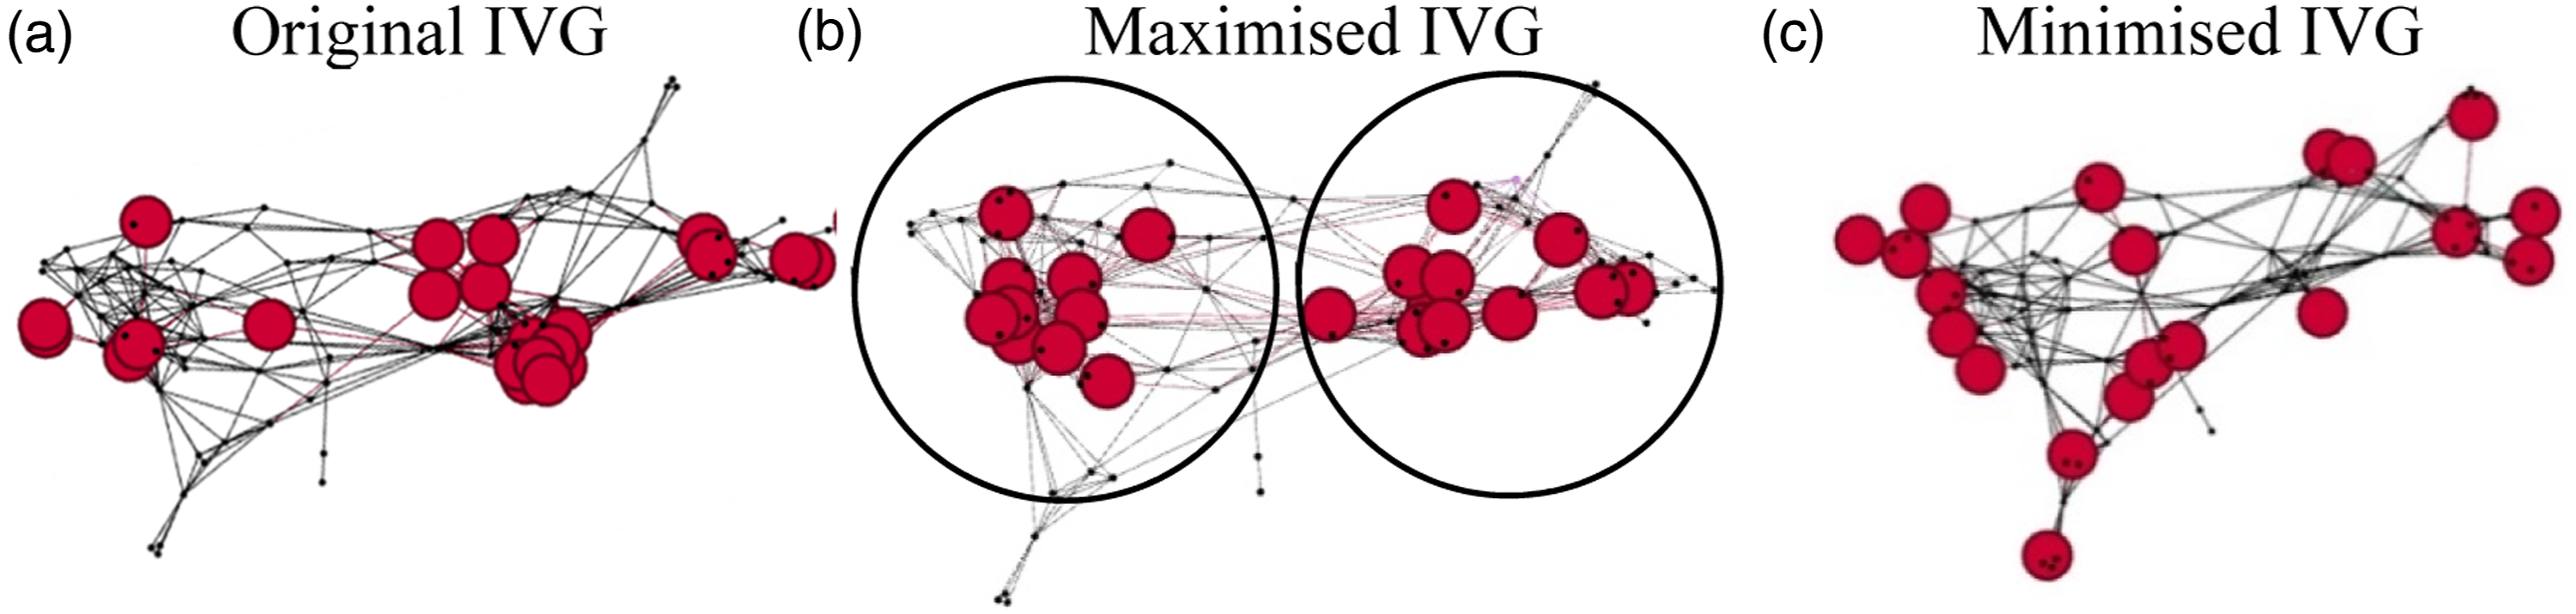
The street network, which was the same for all three versions, is depicted in Figure 4 as small black dots on the background, while the POI are depicted as large red dots on the foreground. The resulting configurations helped us to interpret the new redesigned environments. The maximised graph has two distinct clusters or hubs (circled in Figure 4(b)), unlike the minimised graph (Figure 4(c)) that presents a more homogeneous pattern. The clusters in the maximised IVG correspond to highly connected urban locations, where travelling persons encounter a large number of views. Although the original setting (Figure 4(a)) is not as homogeneous as the minimised one, it does not have distinct urban hubs.
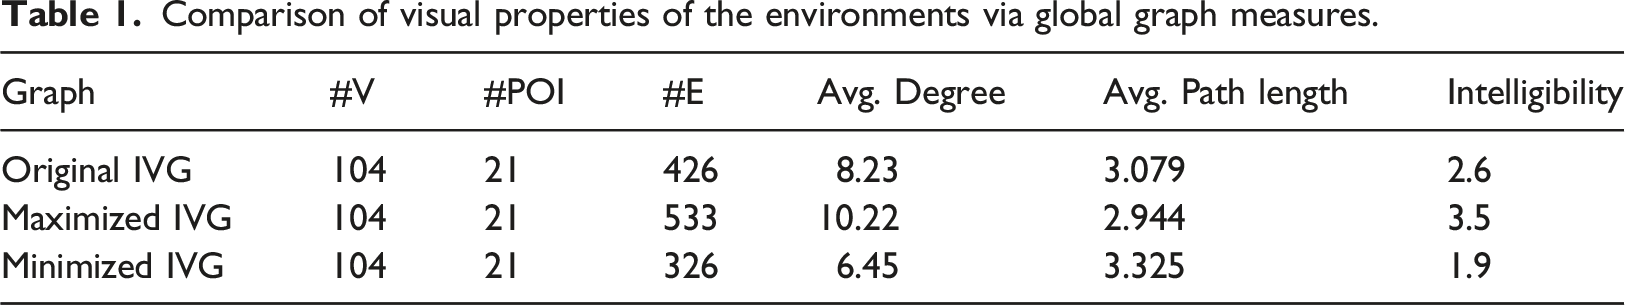
Comparison of visual properties of the environments via global graph measures.
Relations between amenities: POIVG
The POIVG depicts how well each amenity is visible from other amenities within the given environment and when disregarding street intersections. We created a POIVG for all three situations: original, maximised, and minimised. While the number of amenities is identical in all three, their mutual visual relations significantly fluctuate: In the original environment, there are 36 mutual views and only three POIs that are not exposed to others (Supp Figure S9). In the maximised scenario, there are 51 views in total and all POIs are mutually visible. However, in the minimised scenario, only two POIs are mutually visible, while the remaining 19 are completely segregated.
These findings imply that the maximised scenario greatly nurtures visual exposure and clustering, as all amenities are mutually visible. In retail, for example, this effect of view agglomeration is derived from the owners’ desire to be situated as close to their competitors as possible, as a means for attracting more customers. In the minimised scenario, on the other hand, the almost complete visual segregation of the locations prevent exposure and minimise surveillance, which is a desirable trait among both illegal operations and private venues (e.g. such as exclusive clubs and casinos).
Discussion
Quantifying visual perceptions
This study combined three analytical approaches that are traditionally disconnected: graph analysis, planning and design, and visibility analysis – thereby providing new empirical grounds for their integration in urban studies. By incorporating POIs, visual perceptions, and network analytics into one comprehensive framework, we enrich urban research and practices with GIS data and visualisation features, while expanding QGIS with a new behaviour-oriented exploratory functionality. Doing so also enables the independent quantifying of city elements, while simultaneously characterising the complete environment.
Our results in the Fitzrovia’s case study present an innovative method that could assist city planners and architects decide on the allocation of urban utilities. They demonstrate how in different urban conditions, particular patterns of views emerge. Moreover, they offer a means for creating location patterns with various abilities to attract or prevent views that are dictated by project goals or development scenarios.
The method presented in this paper provides a unique opportunity to incorporate the basic human ability of visual perceptions and control their degree of impact. By introducing new POI patterns, accessibility measures arise from both visibility and distance, producing more intuitive and cognitively wise outcomes than simple metric accessibility. We quantify and estimate two extremes of a real pedestrian perceptions of the urban fabric (maximised and minimised), as experienced when walking along the streets. This allows us to understand how the urban tissue and its activities are accommodated therein and how they interact with one another. This is especially important as such practices are expected to rapidly grow with the increasing availability of detailed and diverse geospatial, semantic and imagery data, namely Digital Twins.
In practice, visibility analysis could be used in analysing sites for both public spaces (e.g. parks or squares) and private ones (e.g. retail or residential facilities). Additionally, business owners can employ this method for selecting new venues and examining their relationships with competing venues in the area, especially as it is well known that diverse visuospatial attributes (such as viewpoints or vistas) hold considerable economic significance and value (Lang and Schaffer, 2001). Other developers can employ our proposed minimised scenarios for finding the most visually segregated place in the area.
Furthermore, the traditional modernist principles of city planning theory propose that services and retail facilities of varying scales (such as local or global) ought to be positioned on streets that align with their level of significance (Calthorpe and Fulton, 2001; Duany et al., 2003; Farr, 2008; Perry, 1927). In accordance with this notion, prominent urban streets should serve as focal points for significant urban activities, while local services and smaller amenities should be positioned along tranquil, secondary streets. Using visual perception networks, we can prove the opposite and prevent the withdrawing of pedestrian-oriented commercial uses to secondary streets or avoid creating places like North American strip malls, which are visually disconnected from the rest of the urban environment. All together it could help reducing the excessive automobilisation of cities’ main streets, a phenomenon that can currently be seen in numerous planned, modern cities worldwide (Gehl, 2010). Consequently, visibility network methods developed in this study could promote neighbourhood vibrancy creating a sustainable urban context in line with mixed land use desirable for pedestrians. That will support better solutions by authorities and other stakeholders who deal with the issuing of zoning and building permits for new land uses.
Importance of visibility as a global network
Visibility-oriented methods, such as isovists or viewshelds, have long been implemented in spatial analysis and urban planning. However, these methods are all local, characterising one single location (Benedikt, 1979). In this study, using visibility graphs, we translated a city into a global structure. Such a network-based, abstract notion of visual perceptions enables to show the explorative experience of walking along city streets and resulting urban dynamics. As network measures are global, doing so offers a more nuanced picture of the urban realm, which is unique for each building, land use, and POI location.
Newly created visual patterns of the maximised and minimised design scenarios were examined with measures from the complex network science, suggesting a new link between physical, social, and cognitive processes in the urban context. In the maximised scenario, clusters and hubs with a large number of visual connections have been clearly recognised. Similar to most real networks in other complex network domains, they have a very short average path length, resulting in the concept of a small world where everyone is connected to everyone through just a very short path (Barabasi and Albert, 1999; Bettencourt et al., 2007).
Network science and graph theory have developed a wide range of measures to assist in the understanding of network structures, including density, resilience, connectedness, hierarchy, modularity, and clustering (Arcaute et al., 2015; Barthelemy, 2015; Clauset et al, 2009). The use of this newly developed QGIS plug-in will improve scalability and reproducibility of network analysis, whereby common organizational principles might be revealed in the spatial attributes of cities worldwide across numerous activity datasets.
Limitations and further development
For the sake of simplification, we treated urban environments as two dimensional and referred to visibility as being mutual, thereby rendering the resulting graphs as undirected. Even though the representation of the built environment via basic elements (e.g. vertices, edges, and POIs) may appear limiting at times, such abstraction offers a powerful framework for analysing various research and practice questions. In the future, we plan to add three-dimensional, directional viewing and topography to the plug-in, as well as a wider range of physical properties that impact visual perception, including the size, colour, shape, texture, complexity, and transparency of the urban features.
The same simplification and aggregation principle is applied to notion of who is presumed to be a pedestrian in the study. Currently, the viewer of urban amenities is devoid of any socio-cultural or psychical markers. However, in the further development of the tool, themes such as mobility of special population, for example, physically or visually impaired populations will be considered (Cohen et al., 2022).
Data quality and availability is an additional current shortcoming. Potential issues in the identification of street intersections and POI locations might occur, due to insufficient or defective data sources or mismatches between formats. As described in section 3.2, the ‘POI VizNet’ implements a transformation operation to re-project inner POIs to outside the building. This operation, however, is not perfect and could produce slightly different results than the real location of the POI. That being said, it is a most suitable simplification for describing how POIs are visible from the street when the exact entrance location is unknown. Should a user wish to compute the correct location of the POI, the manual editing of that location should be considered.
Finally, the process of street intersection aggregation faces challenges with regards to data consistency in intersection representation. To make this suitable, a 20-metre threshold was applied, whereby all intersections within this radius are automatically aggregated into one location. However, this threshold might not be optimal for all cases. In future developments, we plan to allow users to define this threshold according to their individual data and design needs.
Conclusion
POI VizNet tool could be implemented by researchers in simulations that predict wayfinding, pedestrian risks, and route efficiency. In turn, such simulations may enable the investigation of interactions between the spatial and cognitive features – how individuals interact with the urban space, or how this space constantly evolves and transforms from the bottom up in response to behavioural patterns.
It can assist in ‘before and after’ estimation situations, namely using POIVG in the evaluation of a particular proximity with respect to qualities of interest. Moreover, a comparison of the development scenarios could be placed alongside prior measurements of other geospatial and architectural characteristics.
As city performance is dependent on human behavioural routines, the method suggested in this paper is highly relevant to both communities – researchers and practitioners. It contributes to providing more informed city designs and assists in understanding the factors that determine and drive the emergence of new building uses.
Supplemental Material
Supplemental Material - Urban planning and design with points of interest and visual perception
Supplemental Material for Urban planning and design with points of interest and visual perception by Asya Natapov, Achituv Cohen and Sagi Dalyot in Environment and Planning B: Urban Analytics and City Science
Footnotes
Declaration of Conflicting Interests
The author(s) declared no potential conflicts of interest with respect to the research, authorship, and/or publication of this article.
Funding
The author(s) disclosed receipt of the following financial support for the research, authorship, and/or publication of this article: This work was supported by the Horizon 2020 European Commission Marie Sklodowska-Curie Individual Fellowship (744835).
Supplemental Material
Supplemental material for this article is available online.
Author Biographies
References
Supplementary Material
Please find the following supplemental material available below.
For Open Access articles published under a Creative Commons License, all supplemental material carries the same license as the article it is associated with.
For non-Open Access articles published, all supplemental material carries a non-exclusive license, and permission requests for re-use of supplemental material or any part of supplemental material shall be sent directly to the copyright owner as specified in the copyright notice associated with the article.