
Abstract
This paper presents a graph model that simultaneously stores route and configurational information about indoor spaces. Existing indoor information models either capture route information to compute shortest paths and to generate route descriptions (i.e., answering how-to-get-to questions), or they store configurational information about objects and places and their spatial relationships to enable spatial querying and inference (i.e., answering where-questions). Consequently, multiple representations of an indoor environment must be stored in information systems to address the various information needs of their users. In this paper, we propose a graph that can capture both configurational and route information in a unified manner. The graph is the dual representation of connected lines of sight, or views. Views can represent continuous movement in an indoor environment, and at the same time, the visible configurational information of each view can be explicitly captured. In this paper, we discuss the conceptual design of the model and an automatic approach to derive the view graph from floorplans. Finally, we demonstrate the capabilities of our model in performing different tasks such as calculating shortest paths, generating route descriptions, and deriving place graphs.
Introduction
Environmental knowledge includes landmark, route, and survey knowledge (Siegel and White, 1975). It enables us to localize and orient ourselves, locate objects and places, navigate and describe locations and routes to other people. Landmarks are uniquely identifiable objects with fixed locations in the environment, anchoring our environmental knowledge with respect to their locations (Winter et al., 2008). Route knowledge consists of sequences of locations that we have visited by moving around in the environment. Survey knowledge refers to configurations of objects and places (Chen et al., 2018a) and is the result of integrating our experiences with the environment (Werner et al., 2000).
Formalizing spatial knowledge about indoor environments into information models has been studied to enable information systems to assist us in our daily tasks such as path planning from a source to a destination and locating objects and places inside an environment (e.g., Lee and Kwan, 2005; Yang and Worboys, 2015). However, indoor environments pose challenges for modeling due to their lack of embedding in a geographic reference frame, requiring reliance on local configuration information. These models are designed to perform specific tasks that require either landmark, route, or survey knowledge of the environments. Focusing on capturing either landmark, route, or survey knowledge leads to incompatible indoor models. In other words, the existing information models are conceptually either place or route graphs. The former stores configurational information, while the latter captures movement information. Consequently, information systems need to store multiple representations of the environment in order to perform different tasks such as querying to locate objects and places, spatial reasoning to discover and store spatial relationships among objects and places, path planning to compute optimal path from a source location to the desired destination, and generating route descriptions to guide the users in the navigation task. Yet, a unified model capable of simultaneously capturing route and survey knowledge of indoor environments is still lacking in the literature.
In this study, we propose to use the concept of views to capture both configurational and route information of indoor environments in a unified way. We define views as directed lines of sight with the property that as we move along the view, the set of visible spatial objects remains the same. This particular property is necessary for our model as we want to capture visible configurational information for each view. In this study, configurational information from a view is a set of visible objects and their relationships for an agent with a predefined visual angle, positioned in the starting point of the view and oriented along the view line. We propose a method to ensure that this property is preserved in our graph model. Using views, route knowledge can be captured by moving from one view to another, and survey knowledge can be captured by augmenting configurational information to each view. Finally, we demonstrate how the model can be used for different tasks that need route or survey knowledge.
In short, this paper makes the following contributions: • A graph-based representation of indoor environments to capture both configurational and route information which can be used in answering different types of spatial questions about the environments; • Demonstrations of computing shortest paths, generating route descriptions, and deriving place graphs from the proposed model to show the diverse applicability of the proposed model for different tasks.
Related work
Current models for indoor spaces can be conceptually categorized as route or place graphs based on their focus on route or survey knowledge. These models are either derived from geometrical representations of environments such as floorplans and Building Information Models (BIM), or from verbal descriptions. Our review is focused on graph-based models designed for answering spatial questions about environments, specifically how-to-get-to and where questions. Finally, we present existing models known as view graphs to highlight the differences between our proposed model and previous work.
Route graphs
Route graphs are representations of an environment as a collection of different routes that an agent can take to navigate (Werner et al., 2000). Route graphs are usually constructed from a geometric representation of the environment (Wallgrün, 2004) or based on a collection of route descriptions (Winter et al., 2018). While the procedures to construct such graphs vary, route graphs conceptually capture information about potential movements in an environment (based on connectivity, accessibility, or visibility), and often nodes refer to locations or places and edges indicate potential movements from one node to another.
To derive the route graphs from geometric information, different algorithms such as skeletonization (e.g., Yang and Worboys, 2015), axial line transformation (e.g., Batty and Rana, 2004; Liu and Jiang, 2012; Turner et al., 2005), Voronoi diagram (e.g., Wallgrün, 2004), and endpoint partitioning (e.g., Viaene et al., 2018) are used in the literature. Skeletonization and axial line transformation are methods to transform areal features into linear representations and the resulting linear features are the potential routes needed to construct the route graph. Another approach is to use partitioning methods to decompose an environment into regions and utilize the adjacency, connectivity or visibility relationships between these regions to generate graph representations that capture a possible movement from one region to another. For example, Voronoi diagram and endpoint partition (Peponis et al., 1997) techniques are used to generate route graphs by Wallgrün (2004) and Viaene et al. (2018), respectively.
Wallgrün (2004) proposed a computational method to extract routes which are organized hierarchically to capture different levels of granularity (Wallgrün, 2004). Lewandowicz et al. (2019) developed a modified navigation graph using Delaunay triangulation and medial axis transformation. Their approach was tested with different floorplans and showed that it produces more natural paths by avoiding zigzag lines in the results (Lewandowicz et al., 2019). Viaene et al. (2018) designed a route graph based on the visibility condition (i.e., expanded connectivity) of endpoint partitions. They considered landmarks as the basis for generating a path from a source to a destination. Their model is able to generate paths that contain landmarks.
Another approach to derive route graphs is to abstract the environment into a set of locations (e.g., doors and decision points) and find the path among them. Yuan and Schneider (2010) proposed a navigation graph by integrating all possible paths between rooms. The nodes are either access points (doors) or intermediate points (decision points) and the edges are the routes between them weighted by their length (Yuan and Schneider, 2010). Yang and Worboys (2015) proposed a navigation graph in which the nodes are categorized as room nodes (dual representation of rooms), portal nodes (doors), and junction nodes (decision points), and the edges are the path between nodes. In contrast to the previous models, this navigation graph preserves the geometric configuration of the nodes in the environment (Yang and Worboys, 2015).
Liu and Zlatanova (2011a) proposed a graph model based on direct visibility between doors. The door-to-door model is able to calculate the shortest path between doors. This model was later improved by considering decision points using the medial axis transformation to generate regularized paths that better represent human movement (Mortari et al., 2014, 2019). The nodes in this model are doors or decision points and the edges describe the direct visibility between nodes.
Pang et al. (2020) developed an indoor visibility map using the rasterization of floorplans and later used the visibility map to generate a detailed navigation graph. The nodes in this graph are dual representations of the cells in the rasterized map and do not necessarily represent indoor constructs such as doors and rooms. To select nodes for the navigation graph, a visibility index is calculated for the cells based on their inter-visibility. The advantage of this approach is the use of visibility and the detailed graph-based representation of indoor spaces (Pang et al., 2020). The route graphs mentioned above are capable of calculating the optimal paths in an indoor environment, but the stored information is not rich enough to generate route descriptions. Zhou et al. (2022) proposed a hierarchical indoor visibility-based graph (HiVG) that captures precise geometric information about the environment. In contrast to previous studies, the augmented geometric information and hierarchical organization enable the model to generate route descriptions with varying granularity (Zhou et al., 2022).
In short, route graphs mainly focused on the route knowledge of the environment and are able to perform route planning tasks such as shortest path computation. However, these models are unable to capture rich configurational information of the environment (e.g., Becker et al., 2009; Lee, 2004; Lee and Kwan, 2005) and cannot perform several tasks such as spatial querying, reasoning, and generating place descriptions.
Place graphs
Place graphs capture the configurational information of places and objects in an environment (Winter et al., 2018). In the context of indoor modeling, topological relationships (e.g., connectivity, containment, and adjacency) have been considered to create a graph model of the environment. Lee and Kwan (2005) designed a combinatorial data model that captures the connectivity of indoor subunits in a graph-based structure. The model is based on Poincaré duality (rooms are considered as nodes and their connectivity as edges) and is organized hierarchically—that is, building, floor, and room levels. This model is later extended by Becker et al. (2009) to include sensor spaces (Wi-Fi access points or RFID sensors).
Conceptually, place graphs store triplets that include three constituents known as locatum, spatial relationships, and relatum. Locatum is a place or object whose location is defined based on a spatial relationship with other places or objects (relatum) (Kordjamshidi et al., 2011; Vasardani et al., 2013). Place graphs are derived from place descriptions using natural language processing techniques (Khan et al., 2013) or based on geometrical information (Hamzei et al., 2018). Place graphs are useful for generating sketch maps (Kim et al., 2016), spatial querying and inference, and georeferencing of places and objects (Chen et al., 2018b).
Chen et al. (2018a) extend the triplet notation to n-plets in order to capture complex spatial relationships (e.g., ternary relationships such as betweeness) and explicitly store information about the frame of reference that is needed for spatial reasoning and consistency checking. The capability of the model has been demonstrated in performing georeferencing, spatial reasoning, and querying tasks (Chen et al., 2018a). While place graphs are able to capture rich survey knowledge about indoor and outdoor places and objects, they neglect route knowledge and are not capable of calculating the shortest path or generating route descriptions for complex indoor spaces.
View graphs
View graphs for navigation purposes are designed based on views (directed lines of sight from one place to other places), and their connectivity, which represent movements in the environment (Schölkopf and Mallot, 1995). Every view represents a possible movement for an agent locating in the starting point of the view and heading toward its end point. The connected views in the graph represent if the agent move from start point of a view to the end point, what would be the next possible movements. The design of view graphs differs conceptually from route graphs in that the nodes do not represent places or objects, but rather view lines (see Figure 1). However, similar to route graphs, view graphs are capable of performing the shortest path calculation as the edges represent movement in the environment. A visual comparison of route graph and view graph in a simple environment with three places (P1, P2, and P3). V1, V2, V3, and V4 representing lines of sight from places to other visible places.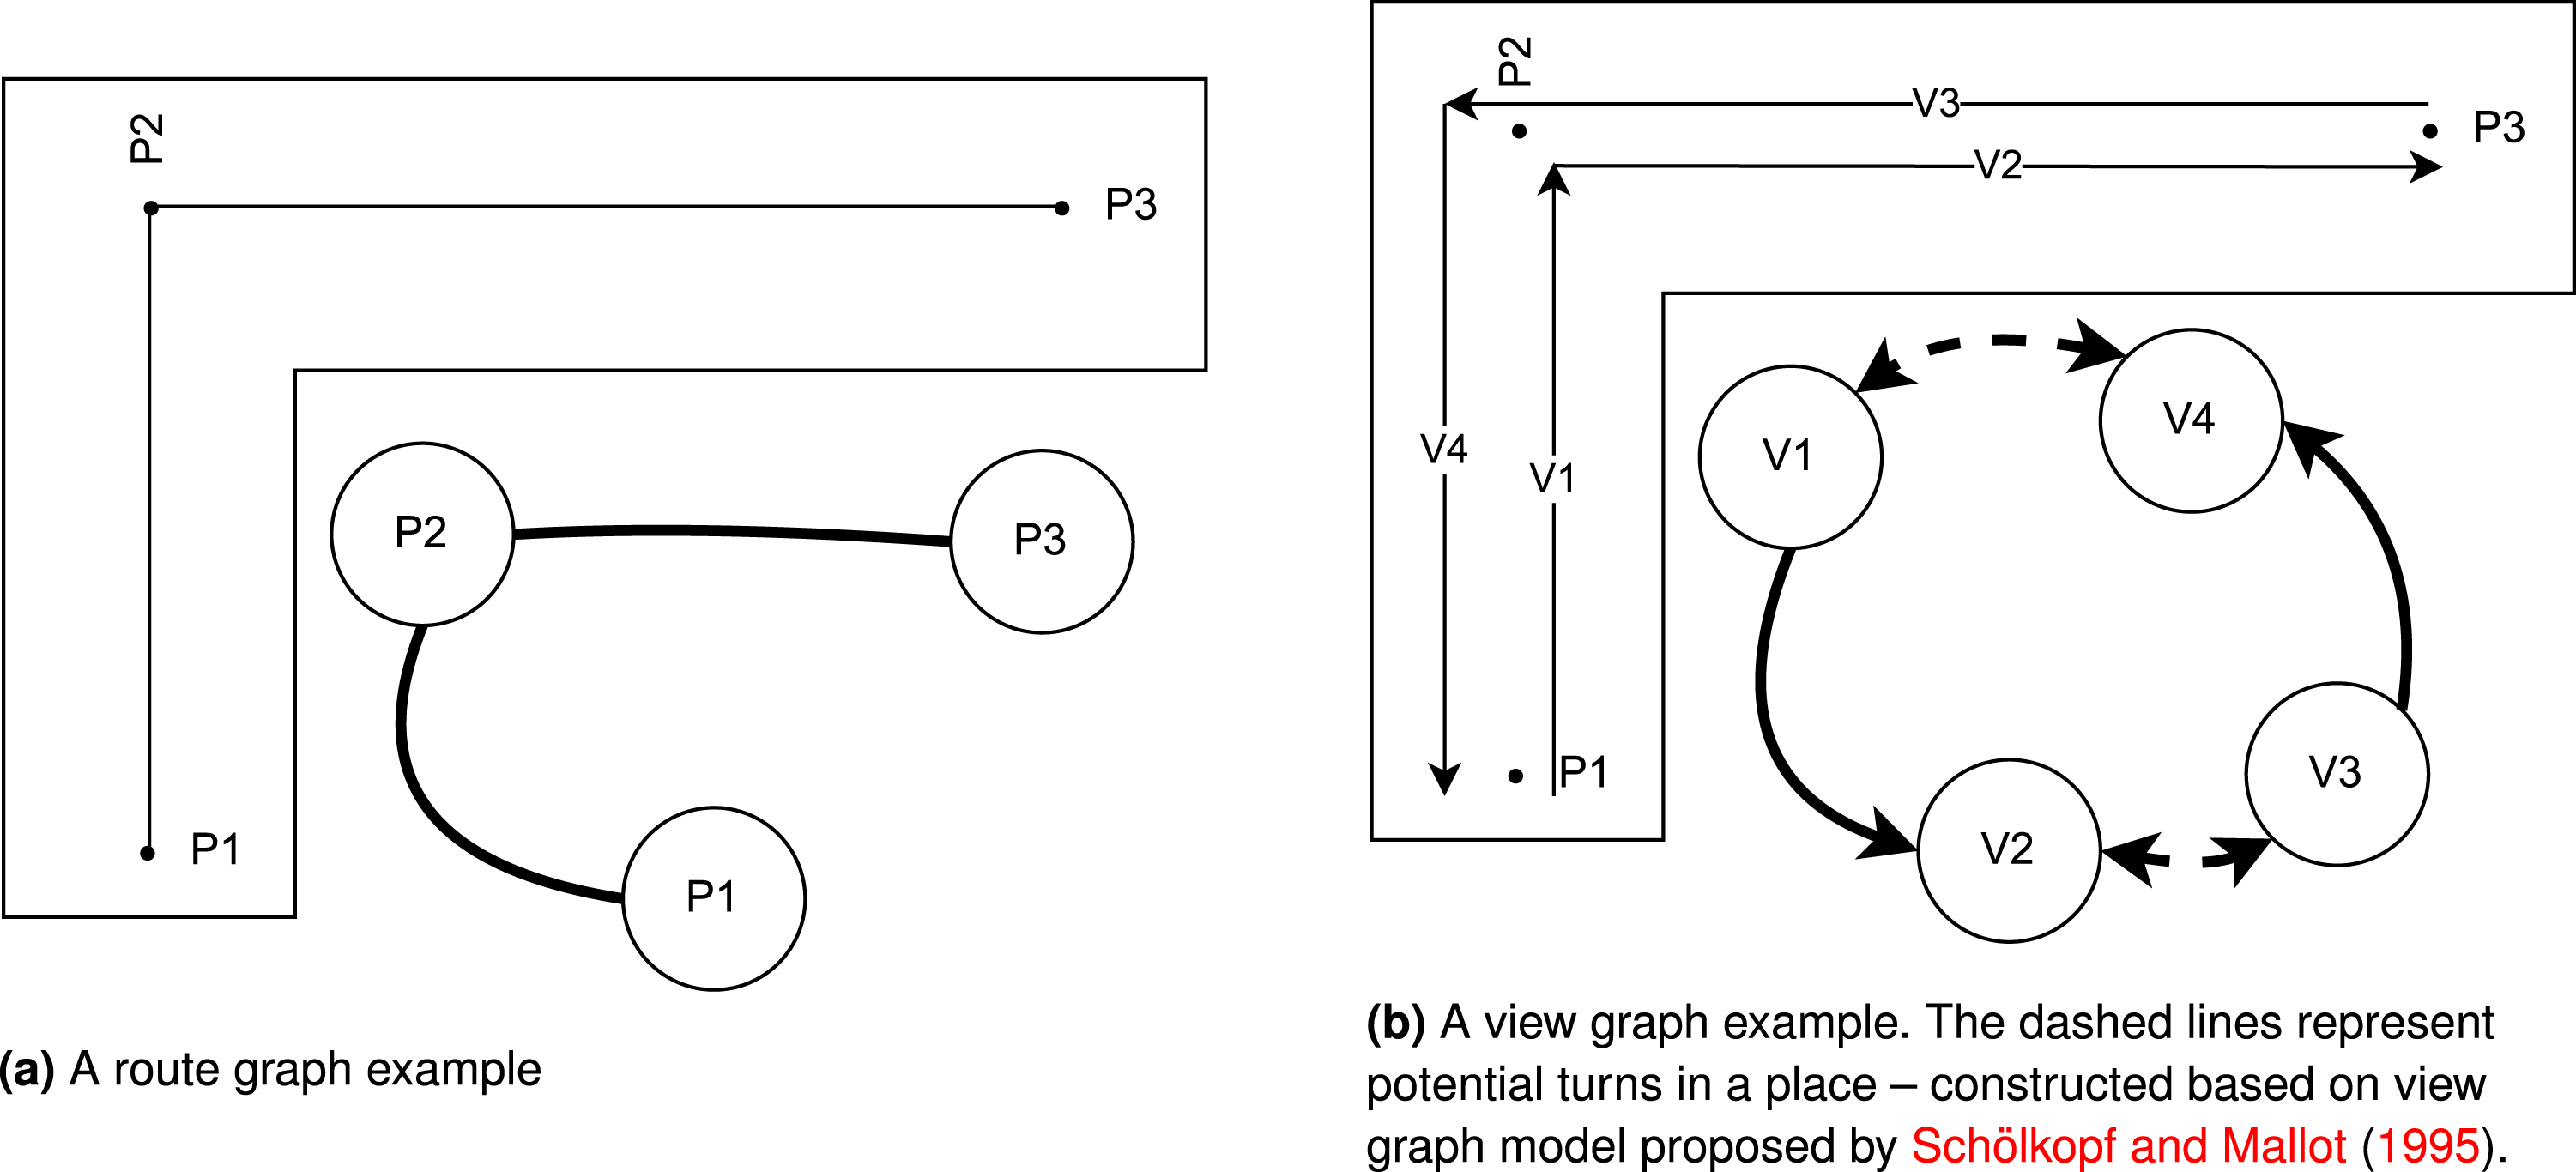
Our model is inspired by the original design of the view graph proposed by Schölkopf and Mallot (1995), but there are several significant differences between our model and previous works. First, the previous models capture only the route knowledge of the environment, while our model uses a decomposition of the views to capture the visible configurational information of each view. Second, views in previous works are defined as lines of sight from one place to another place (without defining how to identify those places), while in this paper, we use space decomposition techniques to identify regions that can be sufficiently represented as points and we use these point-based representations to construct views. In this way, we can automatically create the view graph inside complex indoor spaces (e.g., open spaces and corridors) without reducing the complexity of movement in an indoor space to a trivial task.
The indoor view graph model: Conceptual design
Definitions
First, we define the concepts that describe an indoor environment: • Indoor Environment: An indoor environment is conceptualized as a set of containers (i.e., navigable spaces) that are connected through doors (a specific type of gateway). • Container: A container is a navigable space (e.g., a corridor or a room) that people can enter or exit through doors. Containers are bounded and may be non-convex. Containers may contain landmarks that can be used for guidance purposes. • Gateways: Gateways are located either at the boundary of containers (i.e., doors) where people enter/exit the container, or inside the containers (i.e., decision points) where people can make a decision on how to move further inside the container. • Landmarks: Landmarks are external objects (people do not enter them) that have significance for routing and guidance (e.g., signs).
In this paper, indoor environments are abstracted into a set of direct line segments (views) that are connected if they either have the same start points (representing a change in orientation) or the endpoint of the first segment is the start point of the second segment (representing movement). This abstraction allows us to describe the movement in an indoor environment while storing the visible configurational information at each stage.
Next, we define the concepts that describe our approach to modeling and deriving view graphs of indoor environments: • Isovist: Isovist is a geometric concept that describes the visible space from a location (Benedikt, 1979). • Decomposed Region: Decomposed regions are convex partitions of a container that have the same visibility situations to gateways—that is, all points within a decomposed region have the same visual access to gateways. • View: Views are lines of sight from a starting point in an indoor environment toward a specific direction leading to a potential (intermediate) destination. A view captures a possible location for agents in the environment (i.e., starting point), their orientation (i.e., direction of the view), information visible to them (i.e., any visible object in the agents’ restricted field of view) and potential movement (i.e., toward an intermediate destination). A view, as defined in our work, has a special property (constant visible information): the set of visible objects of interest (i.e., landmarks and gateways) in sight along the view line does not change. What is in sight is determined by the direction of movement along the view line and the restricted field of view of agents. In other words, the endpoint of a view may be a location where either a new object of interest becomes visible or a previously visible object disappears, depending on the agent’s perspective from the starting point of the view. • Field of View: For each view, there is a restricted field of view (Conroy, 2001) that shows the area in the indoor environment that is visible from that view based on the agents’ visual angle – typically 160° for humans (Guenter et al., 2012). The concept of field of view is the same as through vision which is defined and used by Turner (2007) to develop agent-based models that describe the potential actions of agents based on what information are visible to them while moving in an environment. If we consider the isovist from the starting point of the view, the field of view is the part of the isovist that is clipped based on an agent’s visual angle (Meilinger et al., 2012). • View Graph: The view graph is a dual representation of the views. In the view graph, the nodes represent the views and the edges show the connections between the views. There are two types of connections: (1) movement, where the end of one view is the start of the other, (2) turn, where the start of two views is the same but they have different fields of view due to the orientation of the agents.
View graph construction
Figure 2 shows the proposed processing workflow for creating the view graph for an indoor environment.
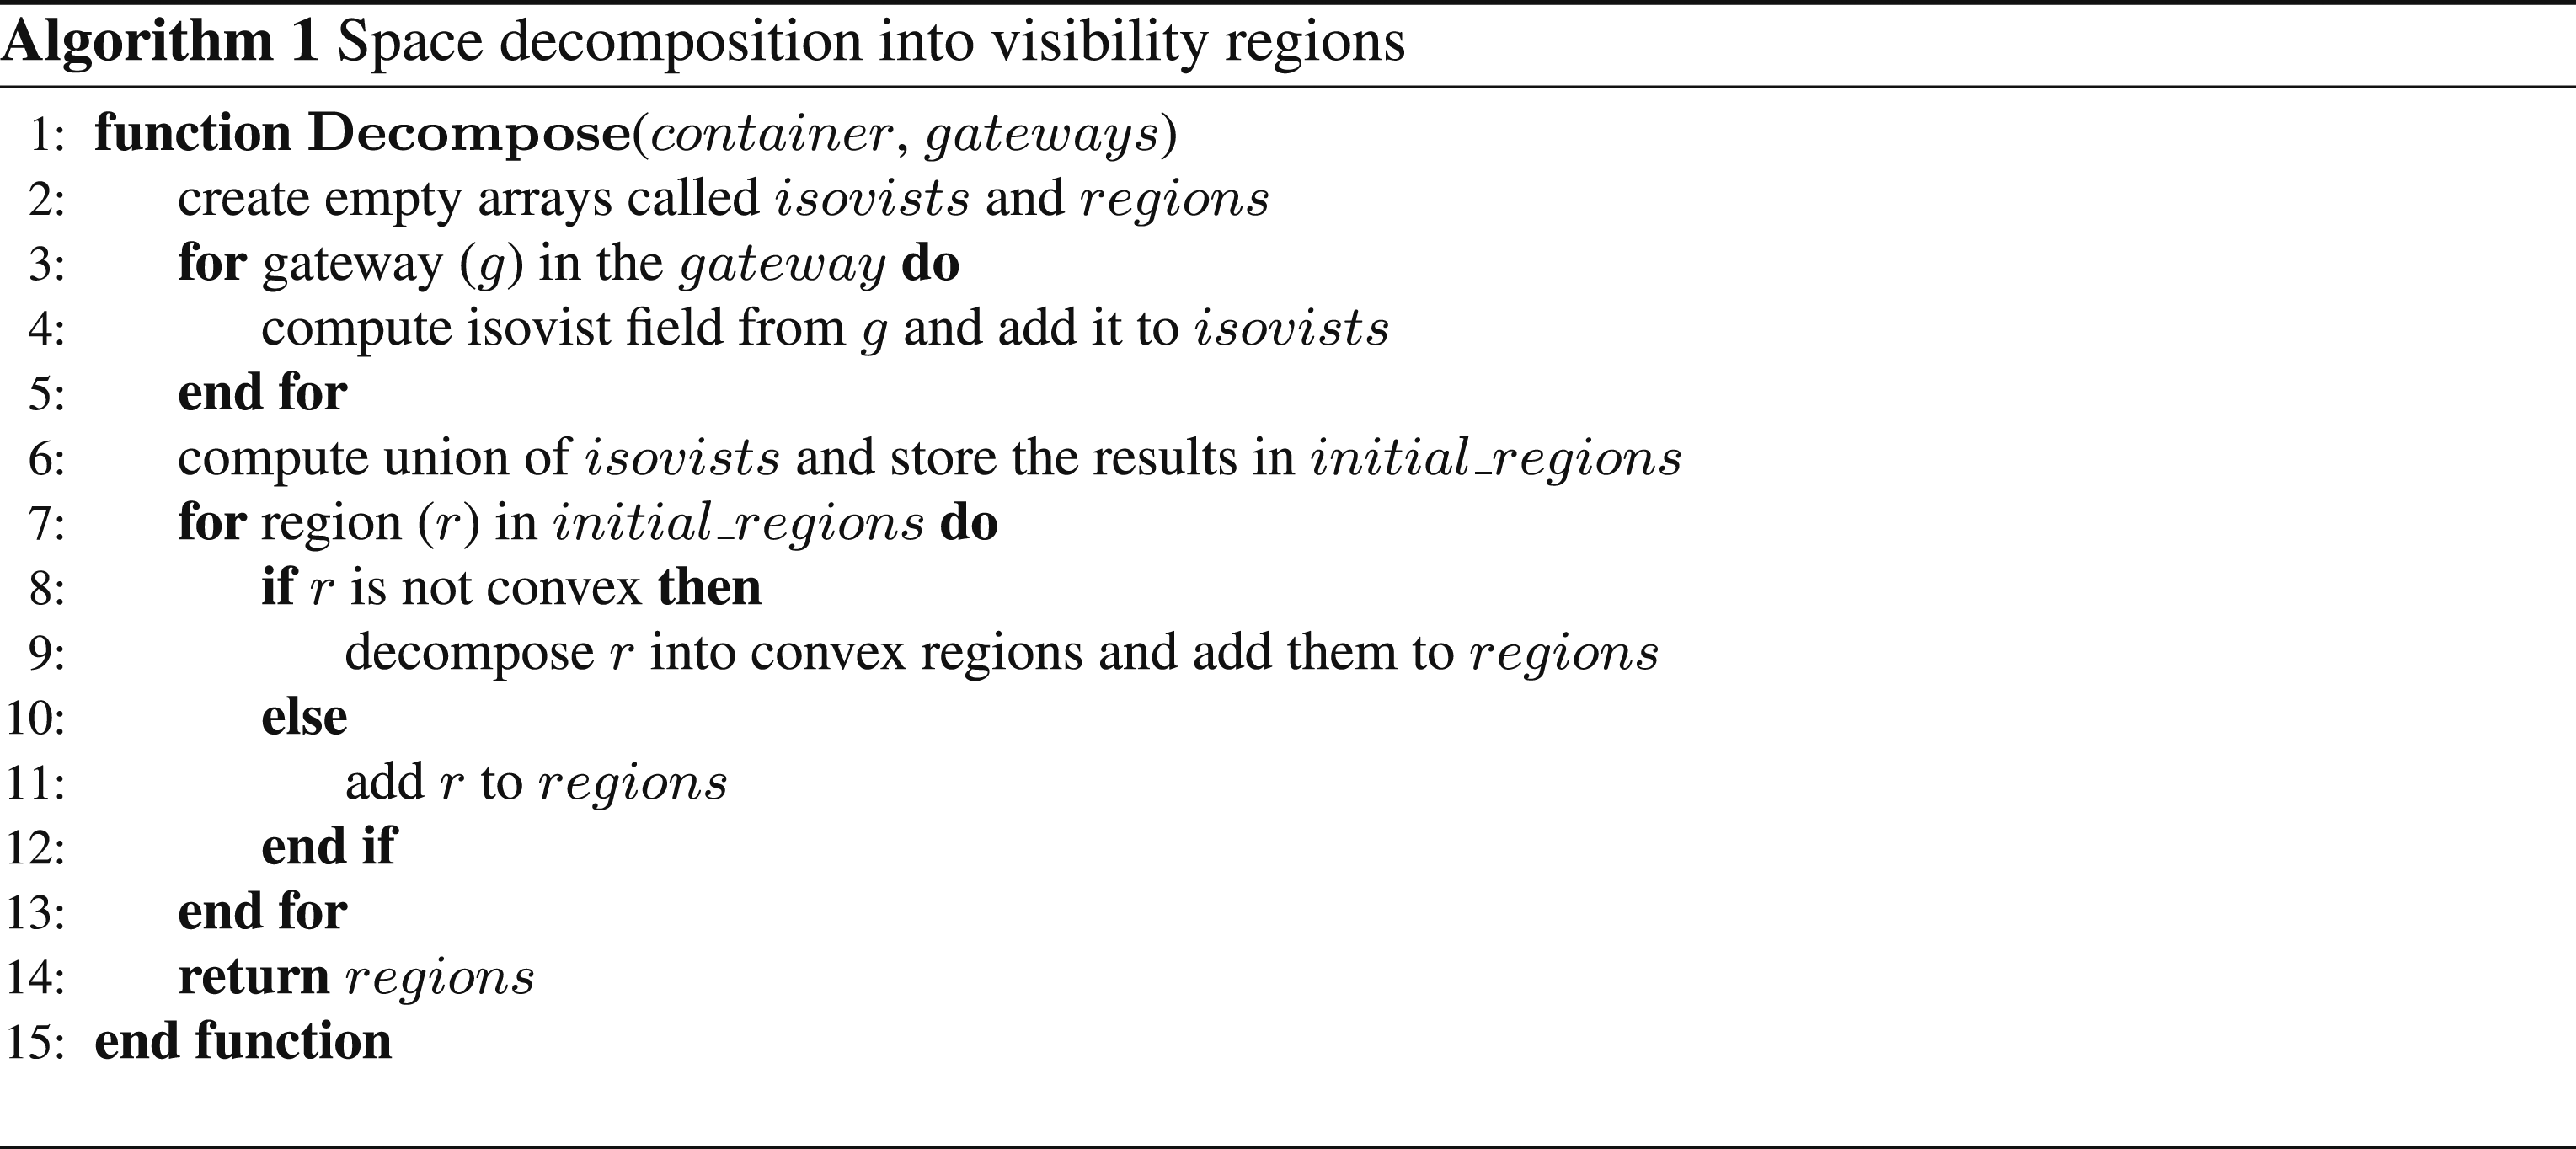
1
Starting from a floorplan representation that includes containers, doors, and landmarks, we first identify decision points in each container. Next, an isovist area of each gateway (i.e., a door or a decision point) is calculated to determine the visibility situation from that gateway. Subsequently, all isovist areas are combined using union operation in vector overlay toolbox to decompose complex indoor spaces into a set of relatively small regions using the approach proposed by Amoozandeh et al. (2022). This method enables the partitioning of the indoor space based on visibility conditions and facilitates the recording of visible gateways from each region by constructing a visibility signature for each region. Proposed workflow to compute view graph for an indoor environment.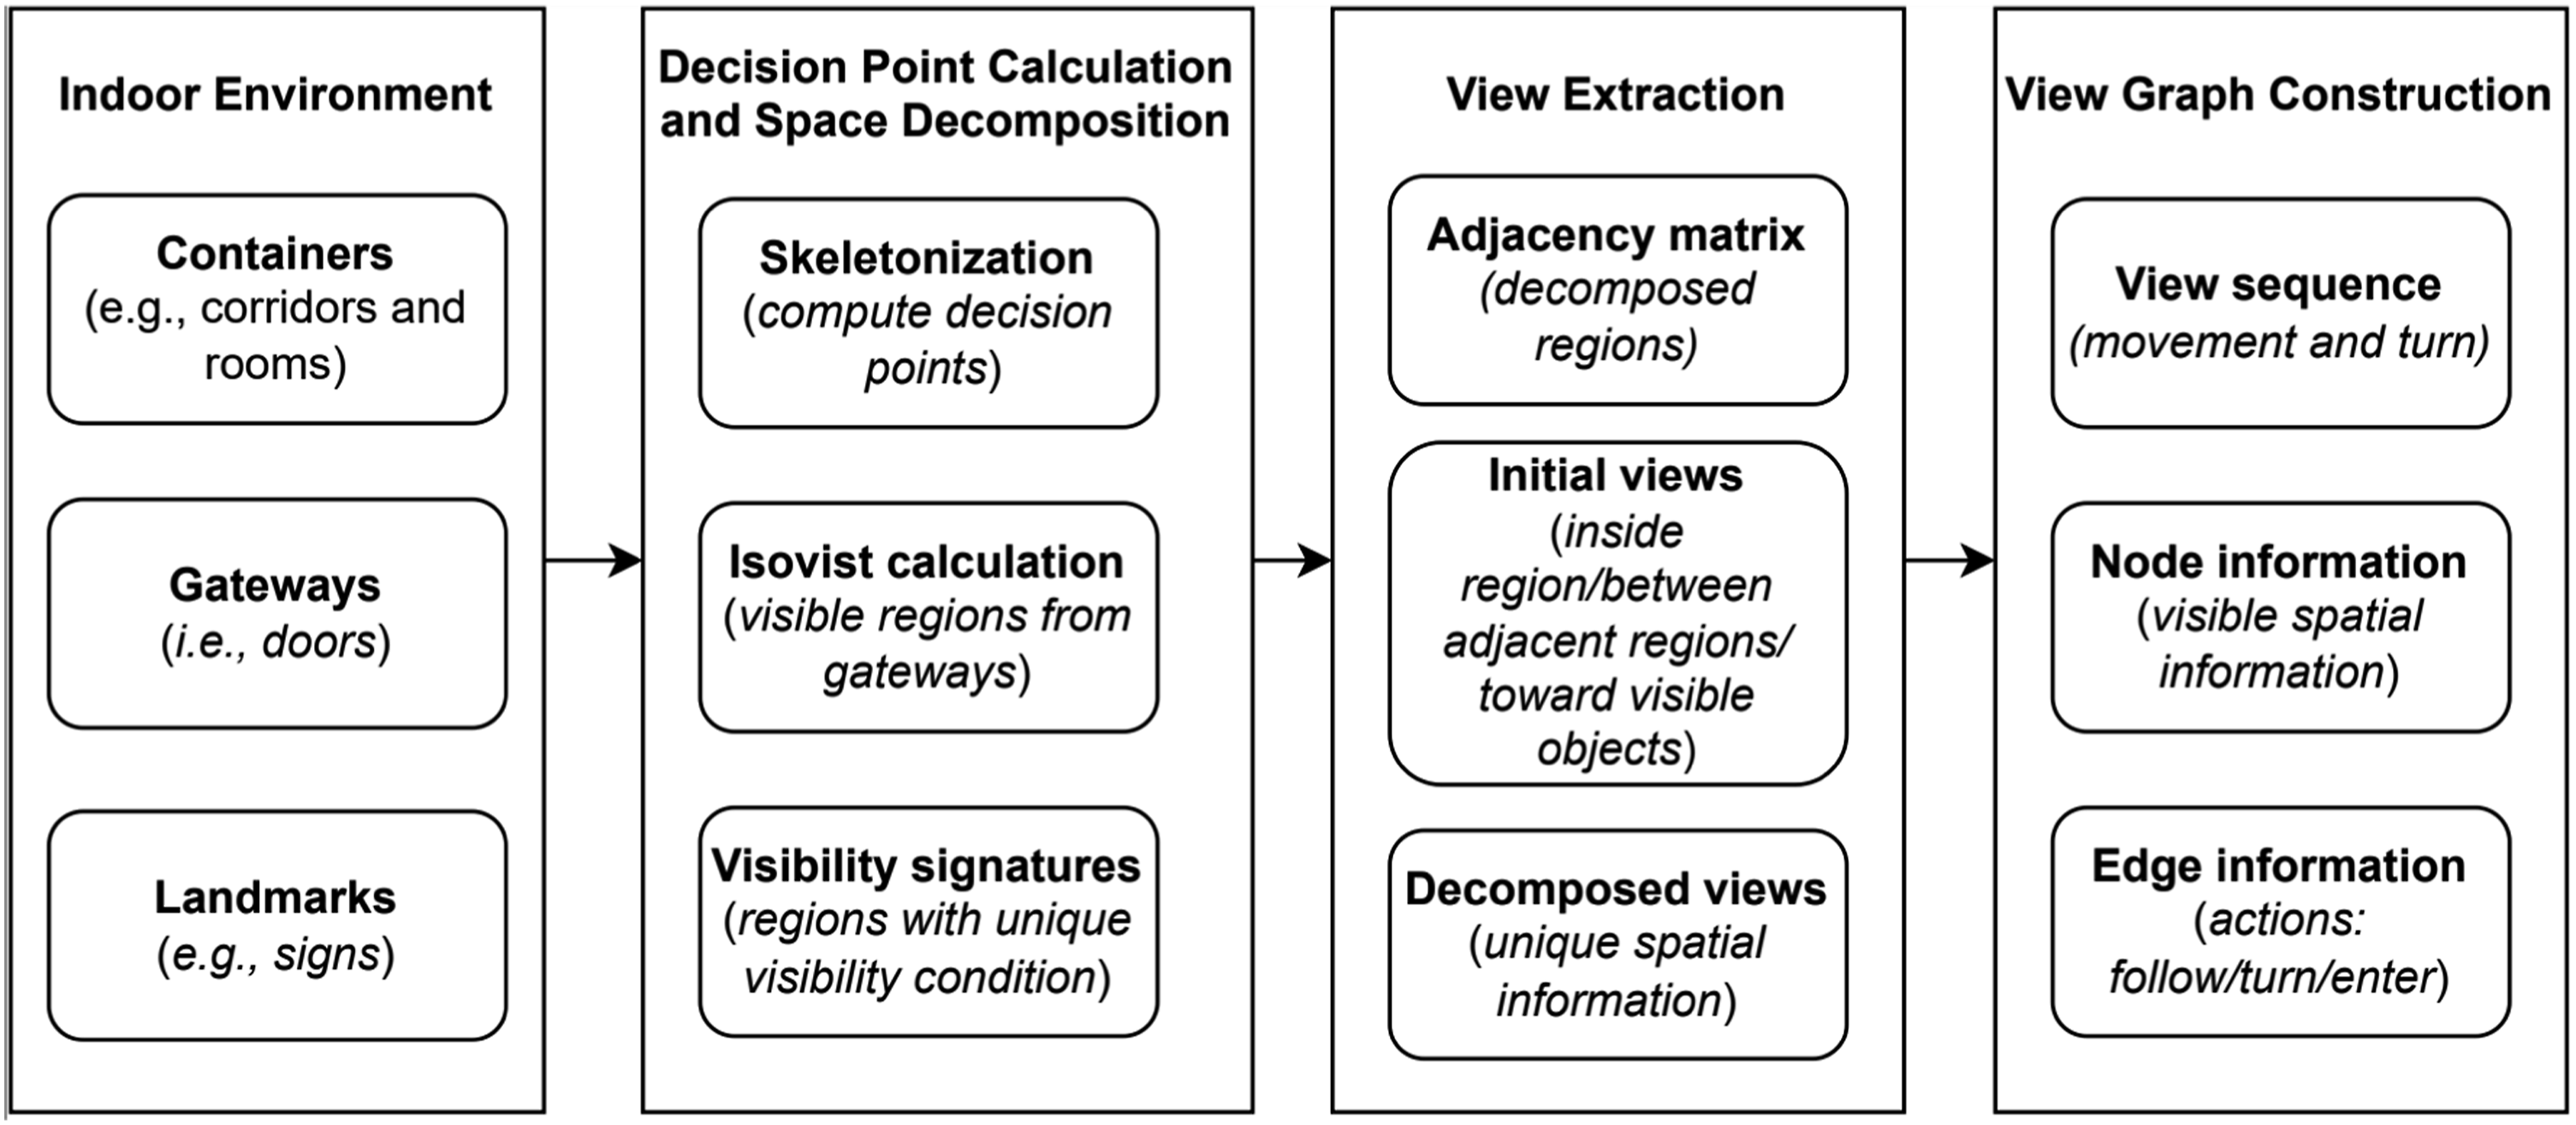
The decomposed regions are further abstracted into point-based representation considering their centroids and possible gateways inside them. Using these point-based representations as possible start and end points for view lines, initial views are constructed between each region and its adjacent regions including its visible gateways. In this step, the initial views are decomposed to ensure that the constant visible information property is preserved. Finally, we use a line graph generation algorithm to derive the graph representation of the views.
Decision point calculation and space decomposition
Prior to calculating isovists and decomposing containers into visibility regions, an essential step in our model is to compute the decision points inside the containers if the decision points are not already provided as input. Decision points play a crucial role as they represent intentional changes in the direction of movement within an indoor space and ensure that the view graph remains connected graph even if doors are not visible in some areas inside concave indoor containers. Their significance lies in two aspects: • First, decision points represent purposeful changes in the direction of movement inside an indoor container and consequently enable view graph to model potential movements inside a container; • Second, decision points enable us to model potential concavities in the environment. In cases where there are zigzag or elongated corridors with doors at the start and end, decision points help capture the concave nature of the indoor space. Without considering decision points, the resulting view graph would become disconnected, hindering its ability to compute the shortest path or generate route descriptions.
One way to compute the decision points is to use skeletonization—that is, the decision points are intersection points in the containers’ skeleton (see Figure 3(a)). This approach is sensitive to even small concavities and may lead to unnecessary numbers of decision points. Hence, nearby decision points can be merged to keep only the minimum number of points that describe possible movement within the containers.
2
We used skeletonization to automate the process of finding decision points. However, finding an optimal solution for decision point identification is beyond the scope of this paper. Linear skeletonization and space decomposition of containers.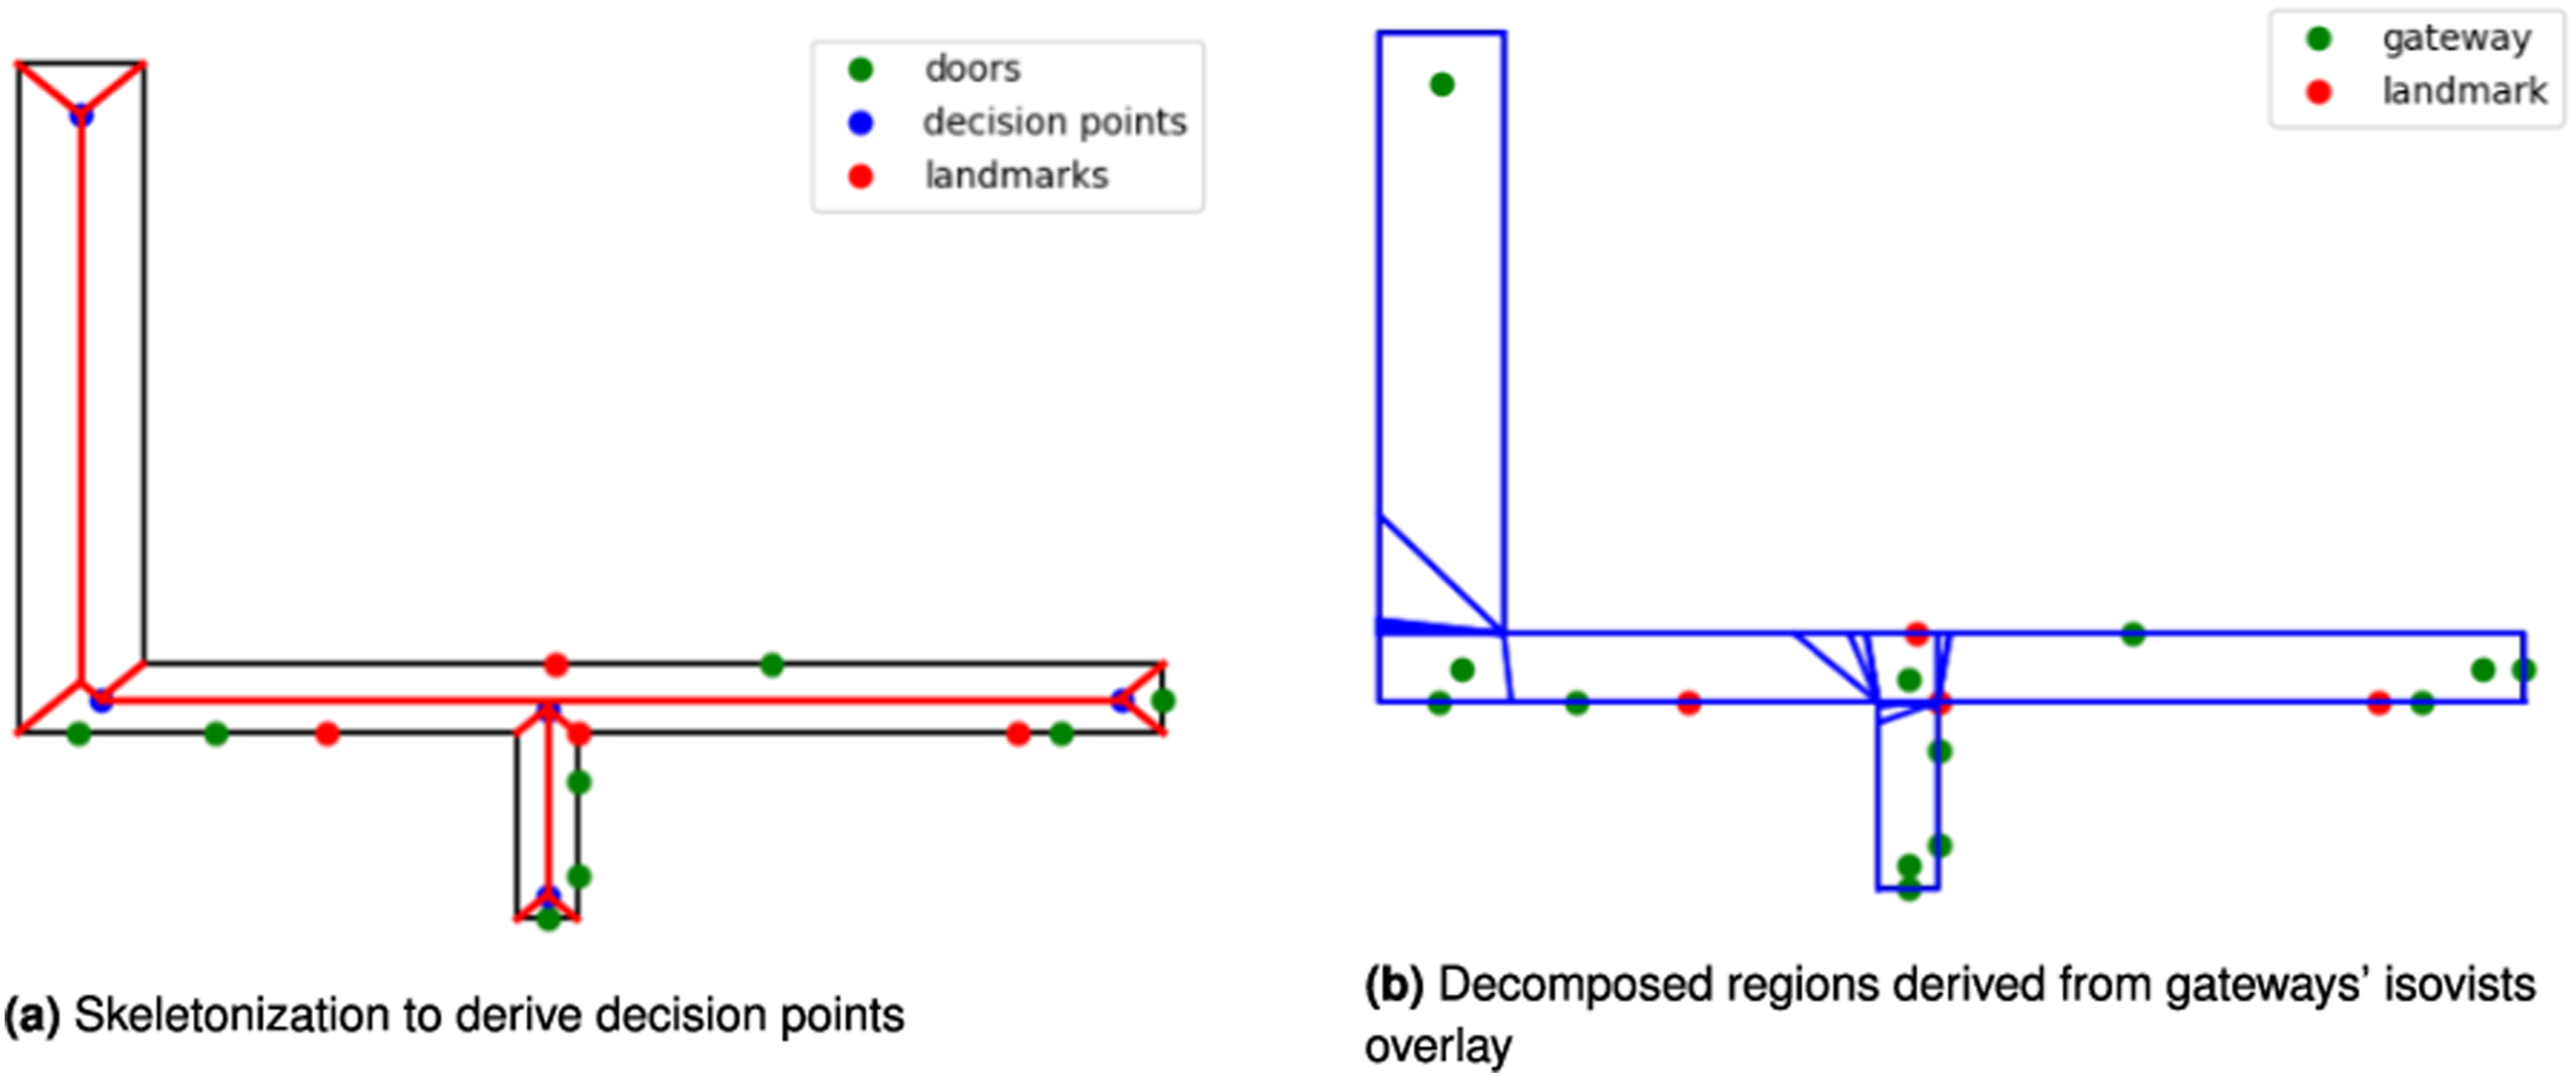
Next, the isovist regions of the gateways (decision points and doors) are calculated. These isovist regions show from where an agent can see a gateway when following a path. By overlaying the isovists, we can calculate the decomposed regions based on their visibility signatures (see Figure 3(b)). The resulting regions are not necessarily convex, hence in the case of concave regions, the minimum convex decomposition approach (Fernández et al., 2008) is used. The results of minimal convex decomposition is not necessarily unique and depending on how the method is implemented multiple ways of decomposition are possible. However, the impact of non-uniqueness on resulted regions would be minimal as the convex decomposition is applied on relatively small regions derived from decomposition of space based on visual access to gateways (Amoozandeh et al., 2022). In short, the result of the decomposition step is a set of regions have the following properties: • Convexity: We can assume that the movement inside the region is trivial as every point inside the region is visible from every other point inside the region; • Consistent visual access: Every point in the region has the same visual access to the objects of interest (i.e., gateways).
Based on these properties, we can abstract the regions into points without oversimplifying movement inside the container or losing information about visible access from different locations.
View extraction
First, we compute the adjacency matrix for the decomposed regions. Then, a point-based representation is used for each region—that is, the centroid of the region. We also include the gateways that are inside or on the boundary of the regions due to their importance for navigation purposes.
Two types of views are constructed in the next step: (1) views from a region to its adjacent regions, (2) views from the region to visible gateways outside the region. Here, the point-based representations are used to construct the views—for example, a view from the centroid/gateways of a region to the centroid of its adjacent region or to visible gateways outside the region. Figure 4(a) shows an initial view constructed from a gateway inside a region to a visible gateway outside the region. Computing initial and decomposed views.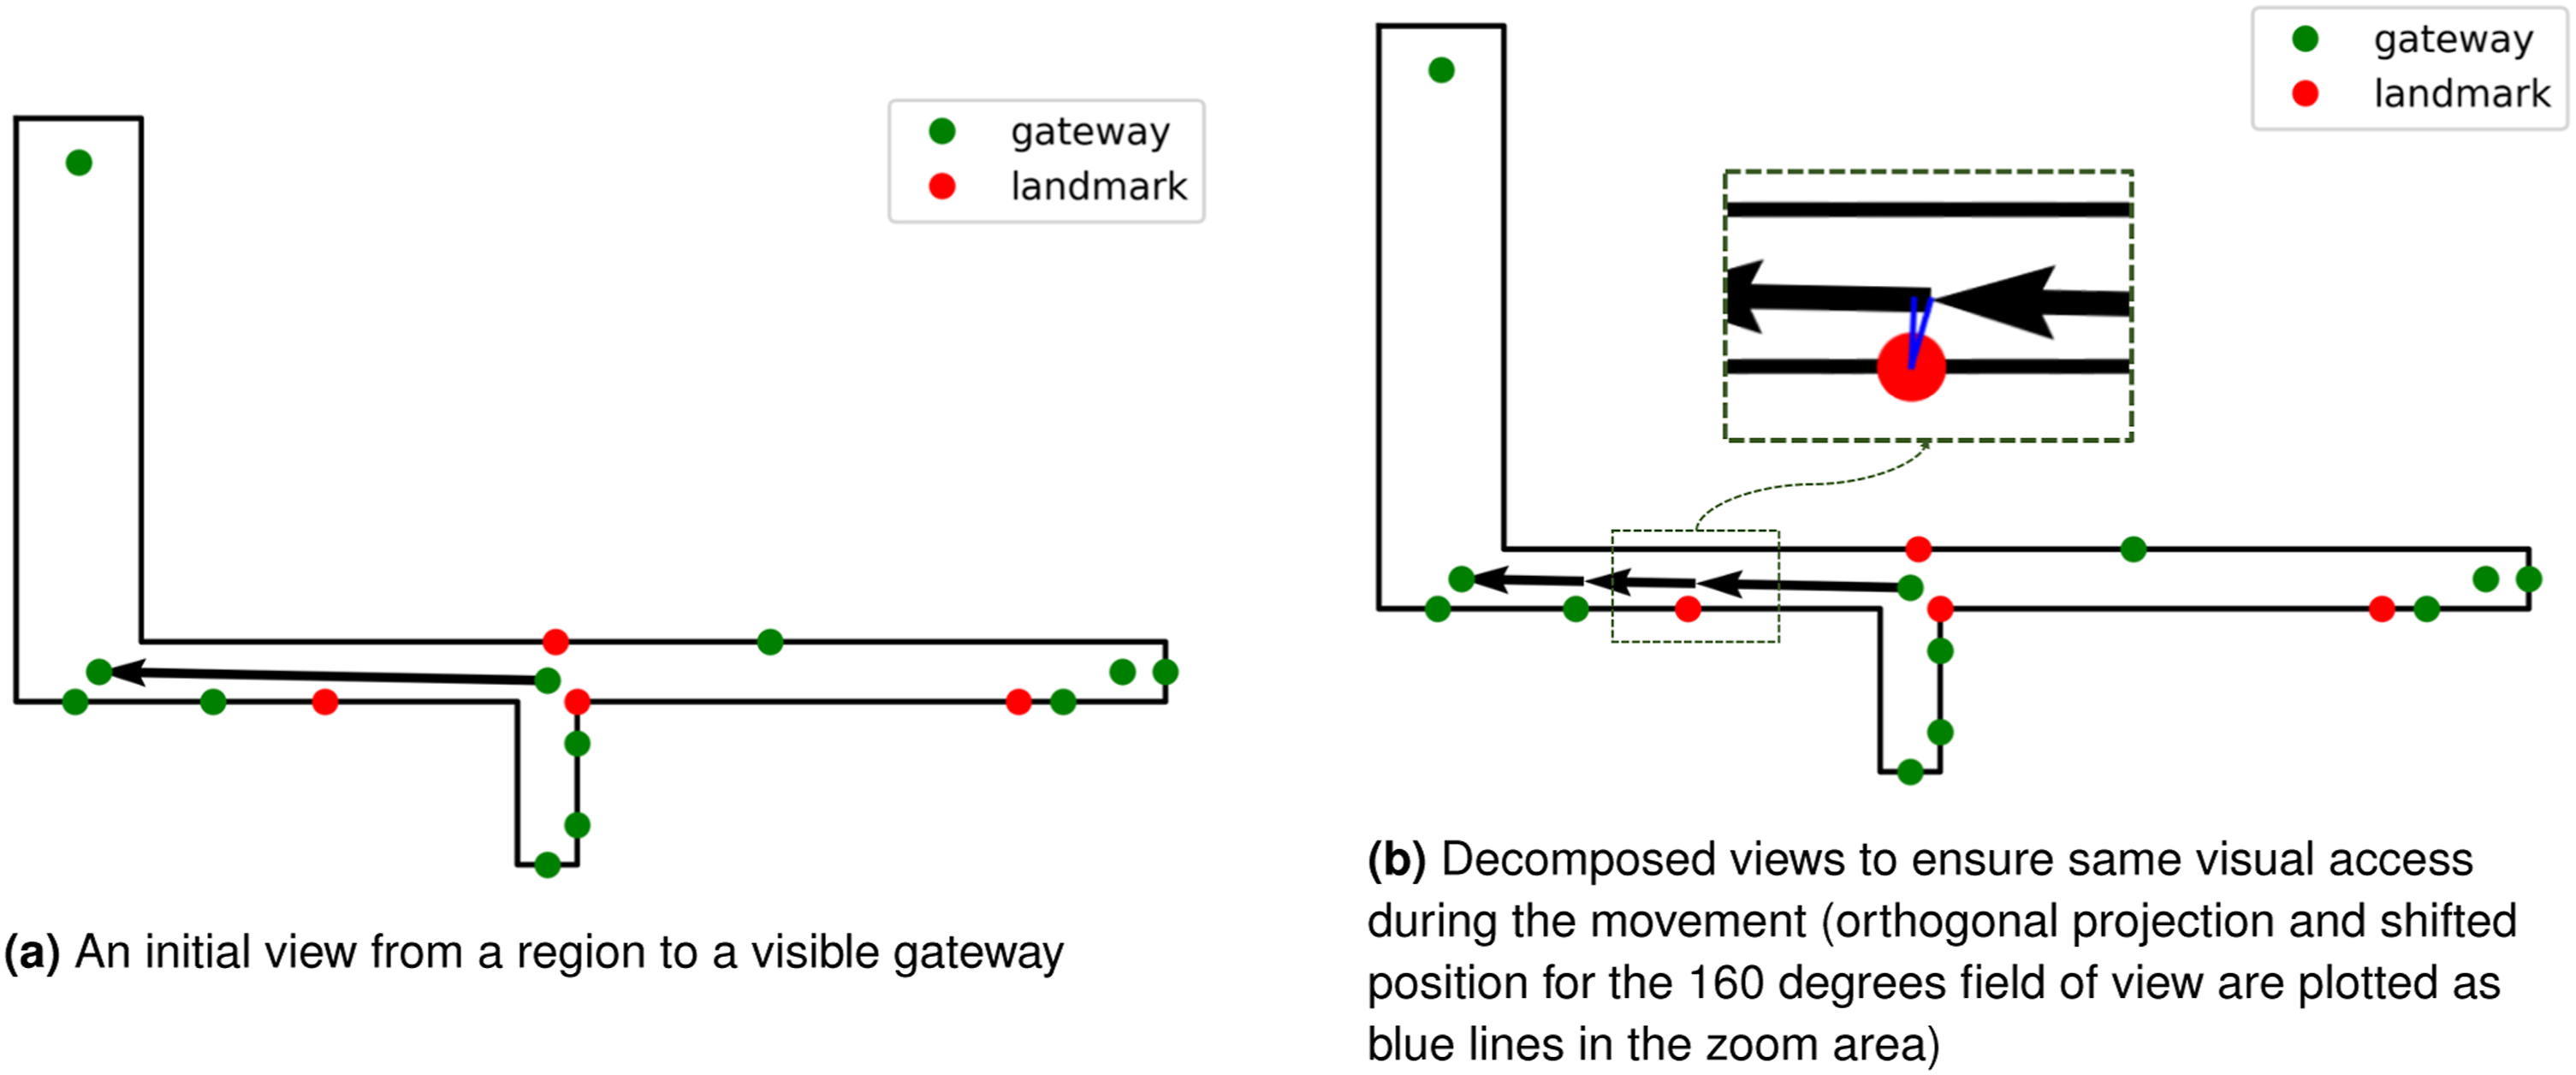
As shown in Figure 4, the initial views do not necessarily have the constant-information property—for example, as an agent moves along the view line, the agent first pass the landmark on the left and then later pass a door in the same side. By passing the landmark and the door, the set of visible information in the agent’s restricted field of view changes, and this violates the constant visible information property. Consequently, we need to decompose the views to preserve this property (see Figure 4(b)).
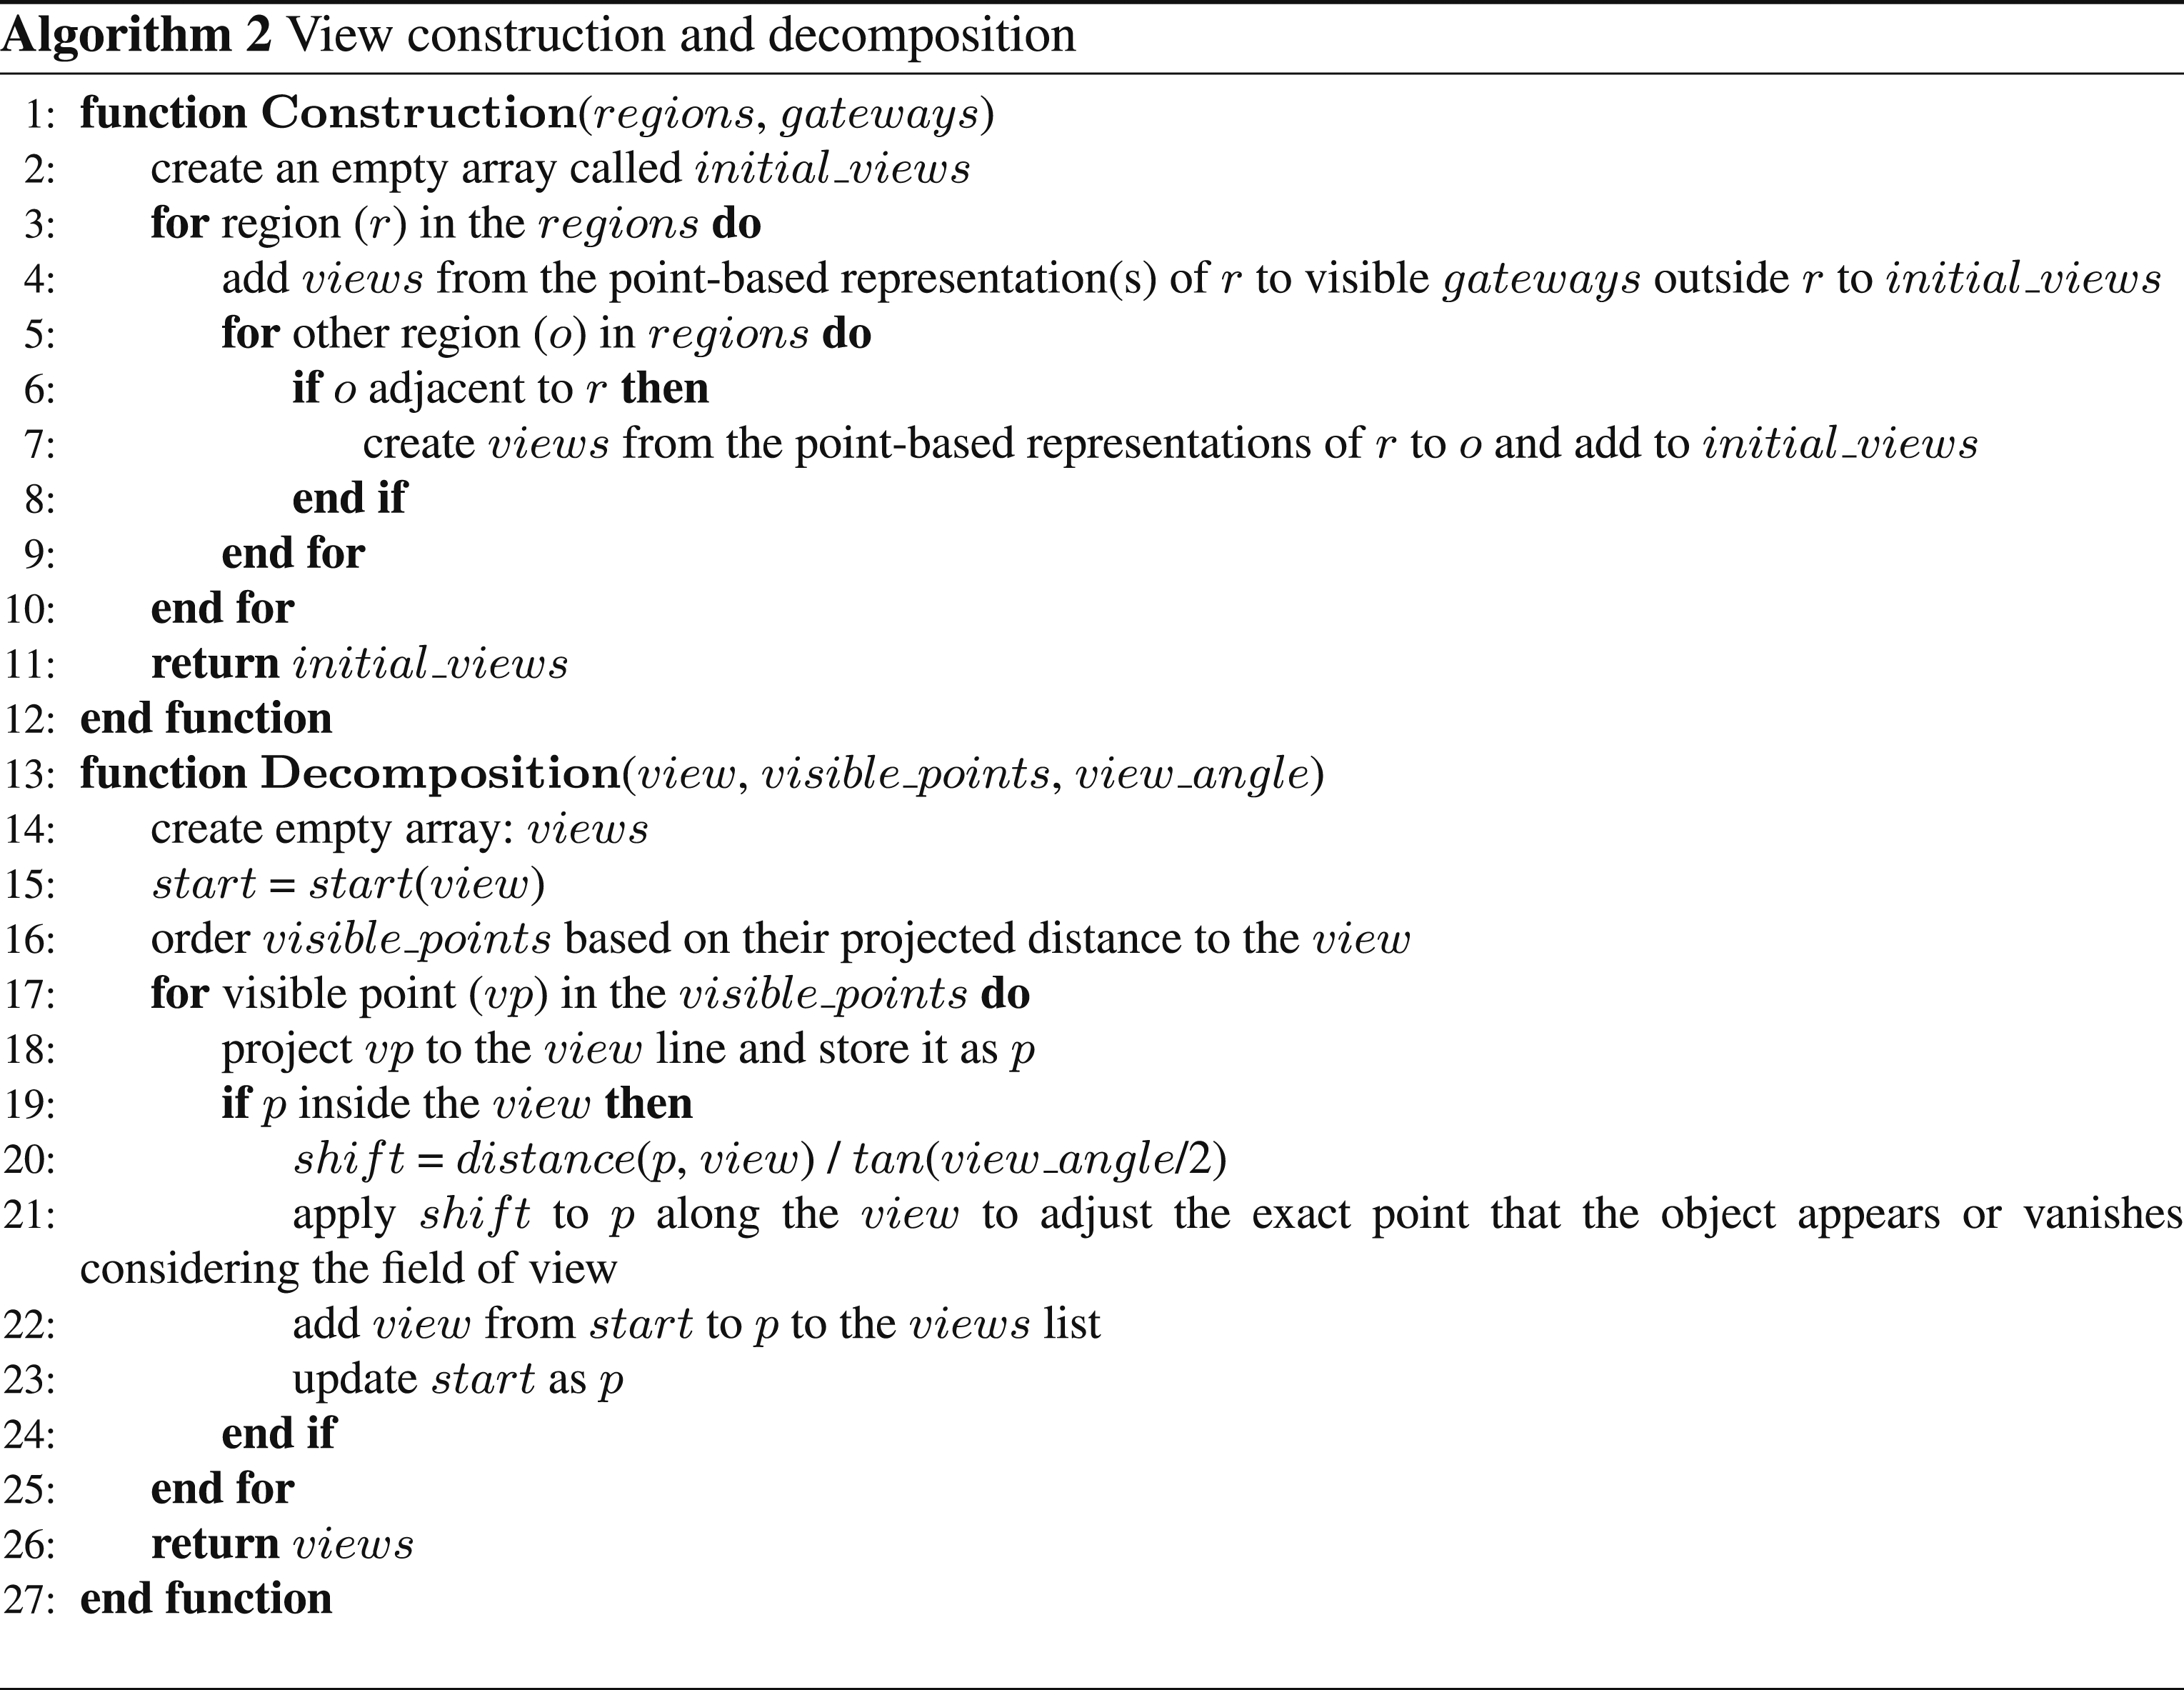
To perform the decomposition, we project potentially visible objects of interest (i.e., landmarks and gateways) onto the view line. The potentially visible objects include the union of the set of objects visible from the starting region and all regions intersecting the view line. Here, the visibility signature of the regions (Amoozandeh et al., 2022) is used to create the list of potentially visible objects. The projected positions of the potentially visible points are adjusted based on the agent’s restricted field of view. The adjustment of position is necessary when the visual angle for agent’s field of view is not equal to 180 or 360°—that is, because of the restricted field of view, in our case less than 180°, the objects of interest disappear earlier than their orthogonally projected positions on the view line. Then, these positions are ordered along the view and form the decomposed views (Figure 4(b)). Algorithm 2 shows how the initial views are computed and decomposed into views with the desired constant information property.
The decomposition process of the view graph may result in an asymmetric graph, which means that the edges of the graph may not have symmetric relationships. However, this asymmetry does not pose a problem for the model’s functionality. The decomposition process preserves the overall geometric properties of the views, as the length of all decomposed views remains equal to the length of the initial view. This preservation of geometric properties allows tasks such as shortest path computation or route description generation to be performed on the view graph without being affected by the decomposition process.
View graph construction
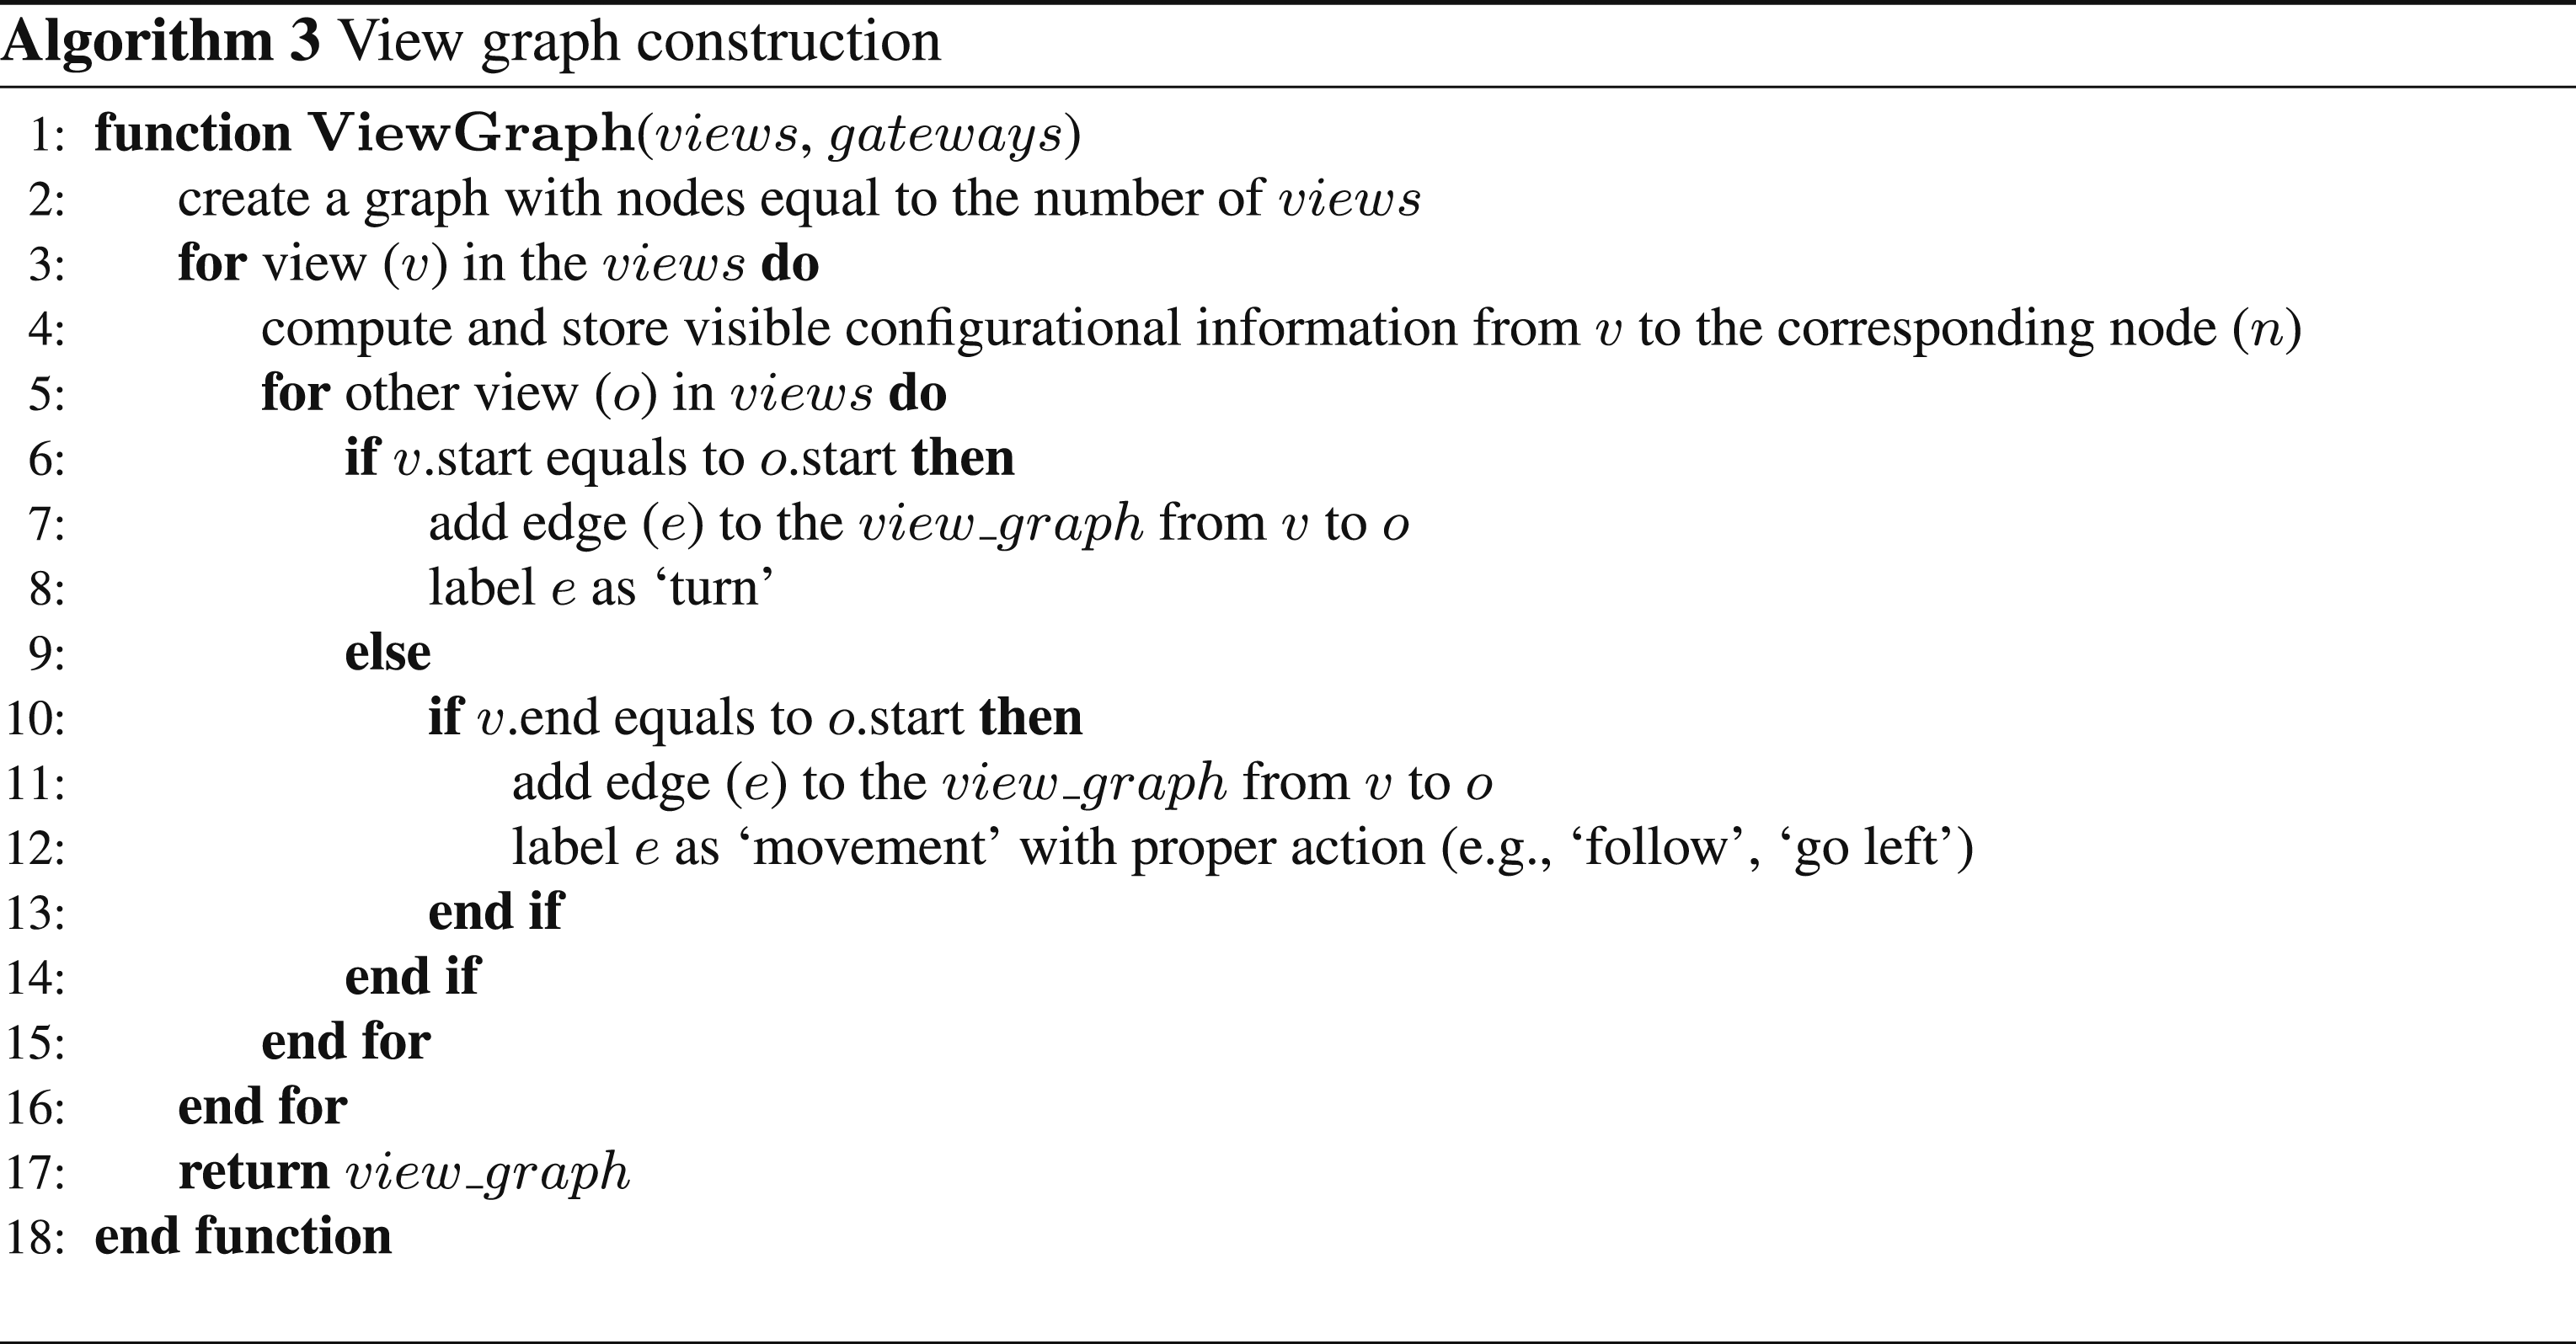
Algorithm 3 shows the process to construct the view graphs from the extracted views. There are two types of connections between a pair of views: (1) turn connection where the start points of the views are the same and (2) movement connection where the end point of the first view is the start point of the second view. The former connection represents the situation when an agent changing the heading without any movement in the environment while the latter captures what would a possible next step when the agent move from the start point of a view to its end point. To construct the view graph, we iterate over the pair of views and check these conditions. If a condition is met, an edge is added to the view graph.
The view graph not only stores views and their connections, but can be augmented with the information visible in each view (i.e., visible objects and their configuration) and actions associated with the connected views (e.g., turn left/right, follow). The augmented information is crucial for several tasks such as generating place graphs, answering questions about the spatial relationships among objects, and generating navigation graphs and route descriptions.
To capture spatial relationships between visible objects, different methods are proposed in the literature depending on the conceptualization of the objects (e.g., points, polygons) and the nature of the spatial relationships (e.g., direction) (see Mohren and Müller, 1992). For example, egocentric, allocentric, or cardinal reference frames can be used to compute directional relationships at different qualitative granularities (e.g., eight directions vs four directions). Here, we conceptualize the objects of interest as points and compute the egocentric direction (i.e., front/left/right), order, and betweenness relationships among the visible objects from each view 3 . Similarly, several methods are available to compute potential actions (e.g., turn-based vs landmark-based) required to follow a trajectory. Here, we use a turn-based approach proposed by Klippel et al. (2004), which includes turn and veer as actions and left, right, sharp left, and sharp right as possible directions.
Demonstration
In this section, we demonstrate how the view graph can be used to compute the shortest paths, generate route instructions, and derive place graphs. For the demonstration, we use a floorplan of an indoor environment with multiple containers (see Figure 5). The purpose of this section is to only show the capabilities of the view graph in performing various tasks that require configurational and route information. Hence, computing optimal paths based on various criteria (e.g., path with least number of turns), generating rich route instructions with mixed grammars and generating place descriptions with similar qualities to human descriptions are beyond the scope of this demonstration. Test environment for the demonstration.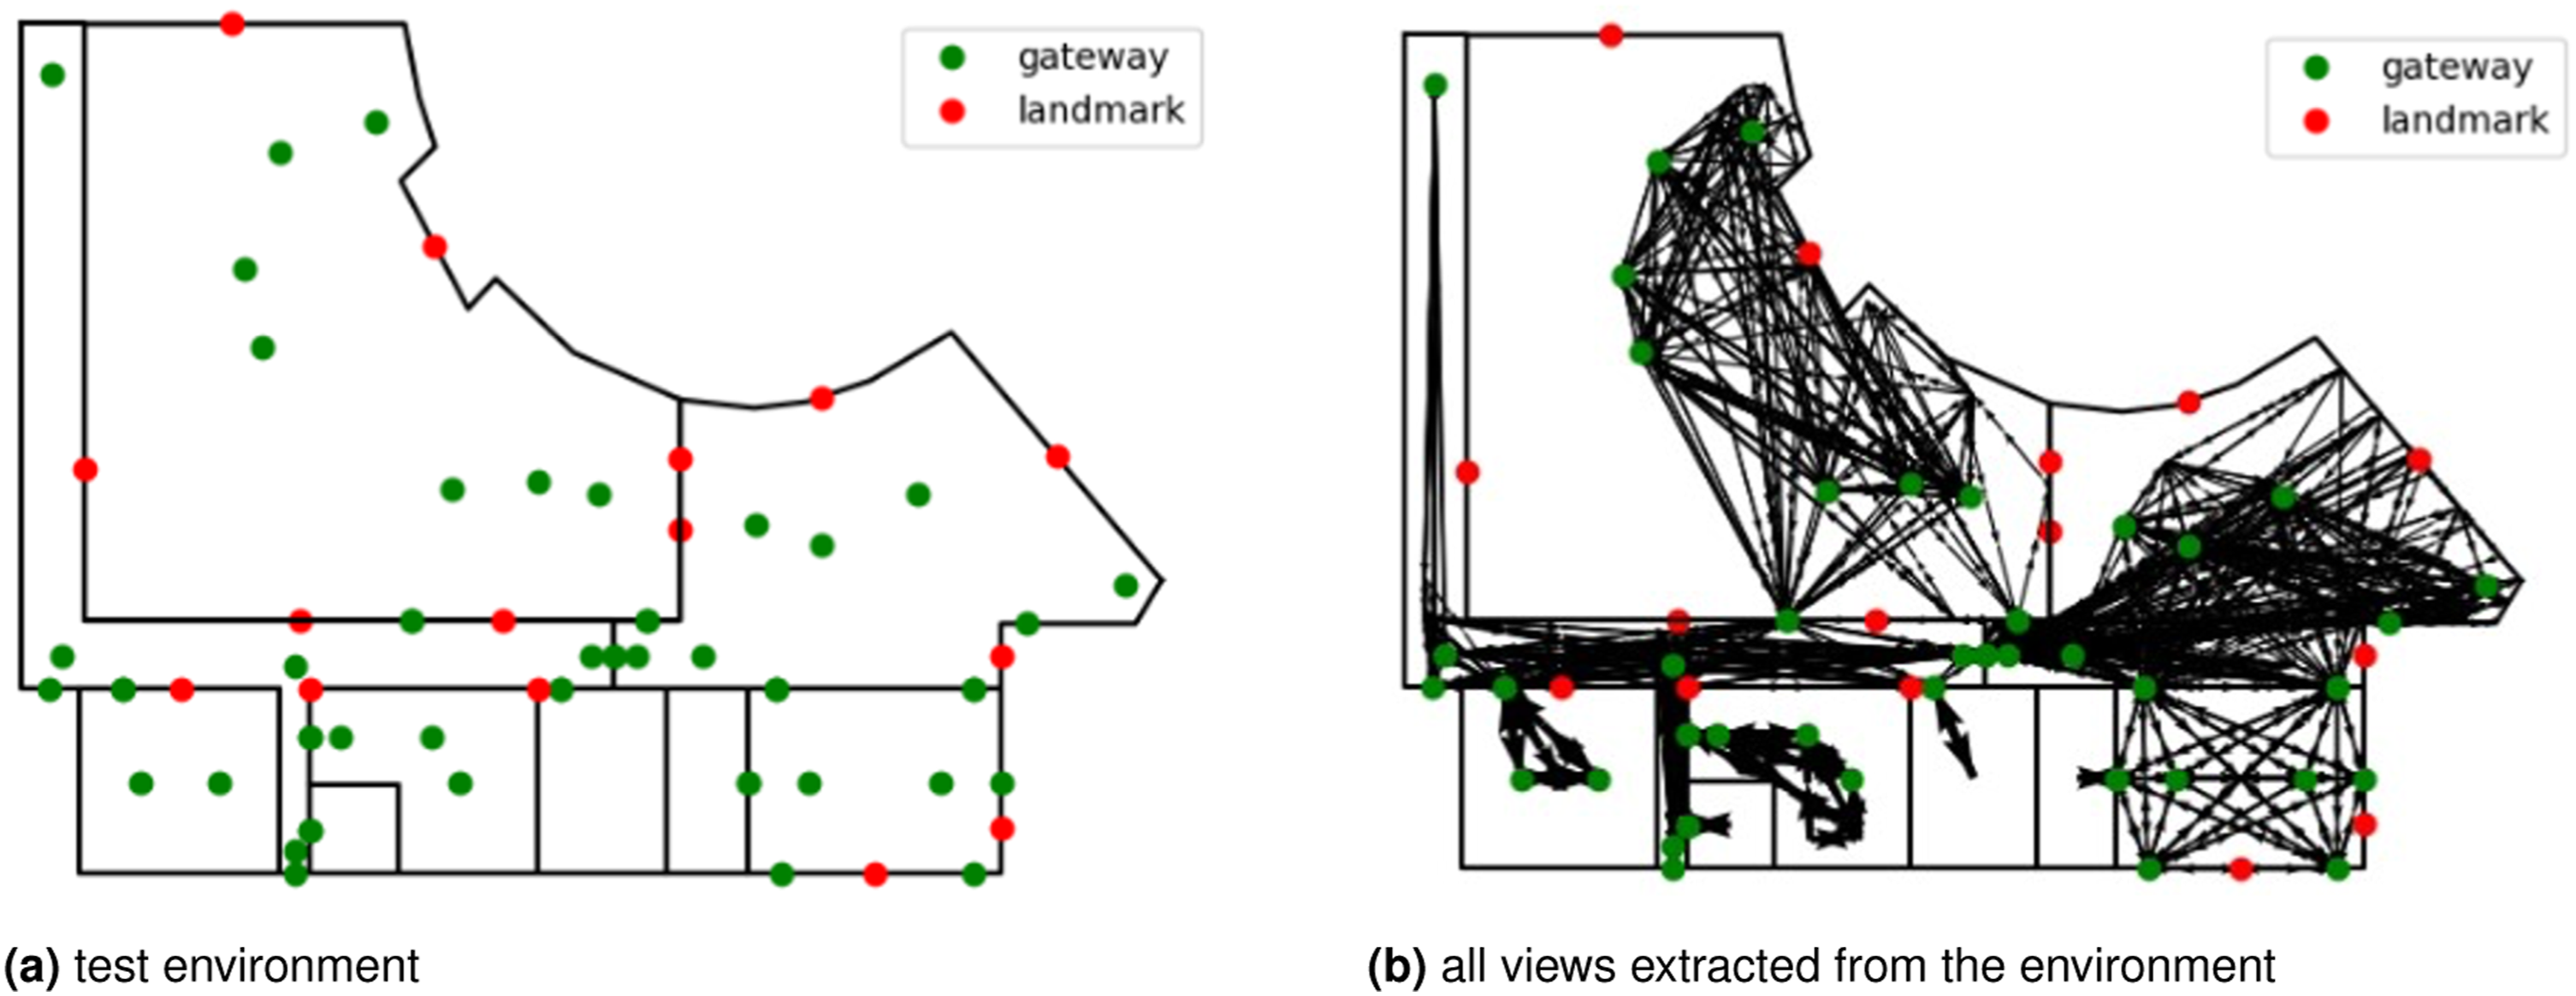
Generating route instructions
To generate route instructions, we use a simple grammar that includes follow/pass, turn left/right, and enter/exit. Follow is an action where the route instruction indicates to continue forward until a specific object is passed. Turn is the action where the orientation needs to be changed at a decision point. Enter and exit are actions related to passing through doors to move from one container to another.
To generate route descriptions, we first compute a path from source to destination. As the views originated from space decomposition, each point in the environment can be easily mapped to the corresponding region (see an example in Figure 6(a)). The region is also directly related to a set of views originating from, passing through, or destined for. To derive the shortest path, the view graph can be augmented with metric weights, and here we consider the weights to be equal to the length of the source views—that is, the length of V1 is the weight for all edges in the view graph starting from V1. Then the shortest path can be derived by considering a random view incident to the source region to a random view starting from the destination region (see Figure 6(b)). Shortest path computation using the dual graph.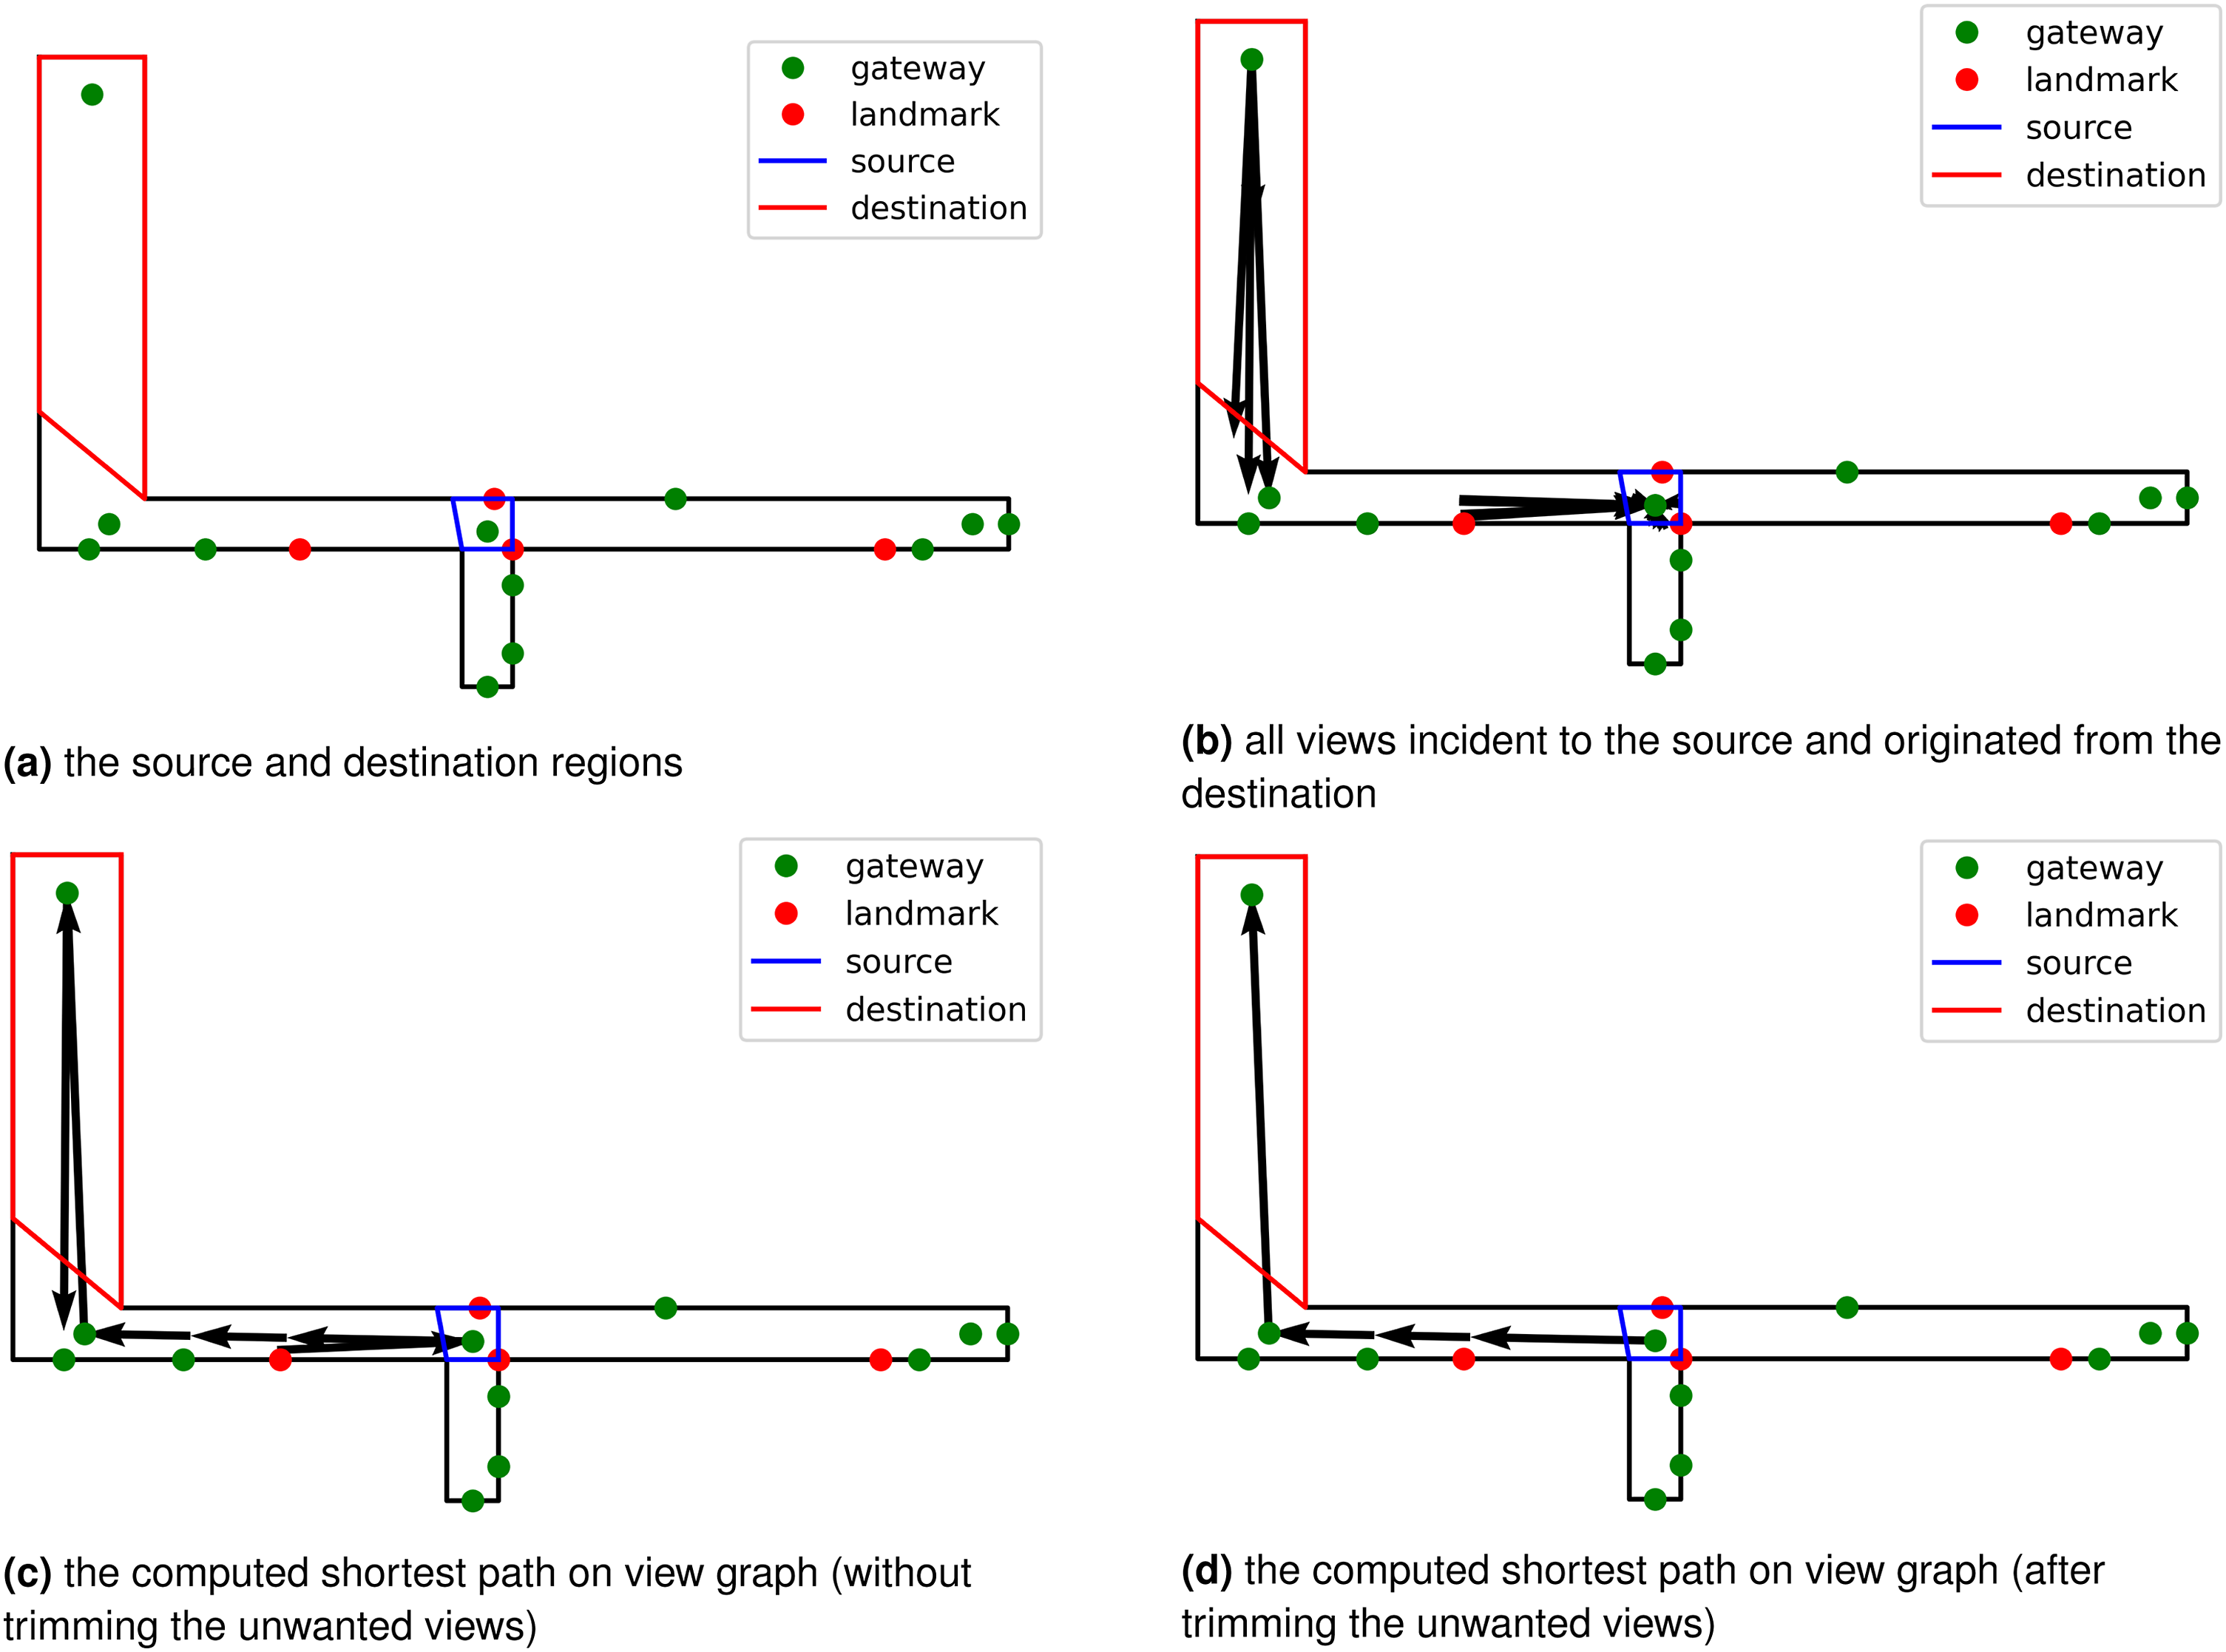
Finally, we trim the results of the shortest path by removing the first and last views (see Figures 6(c) and 6(d)). The removed views are the result of a random selection for the start and end views and do not affect the calculation of the shortest paths since they add a fixed cost to all potential paths between the start and end views.
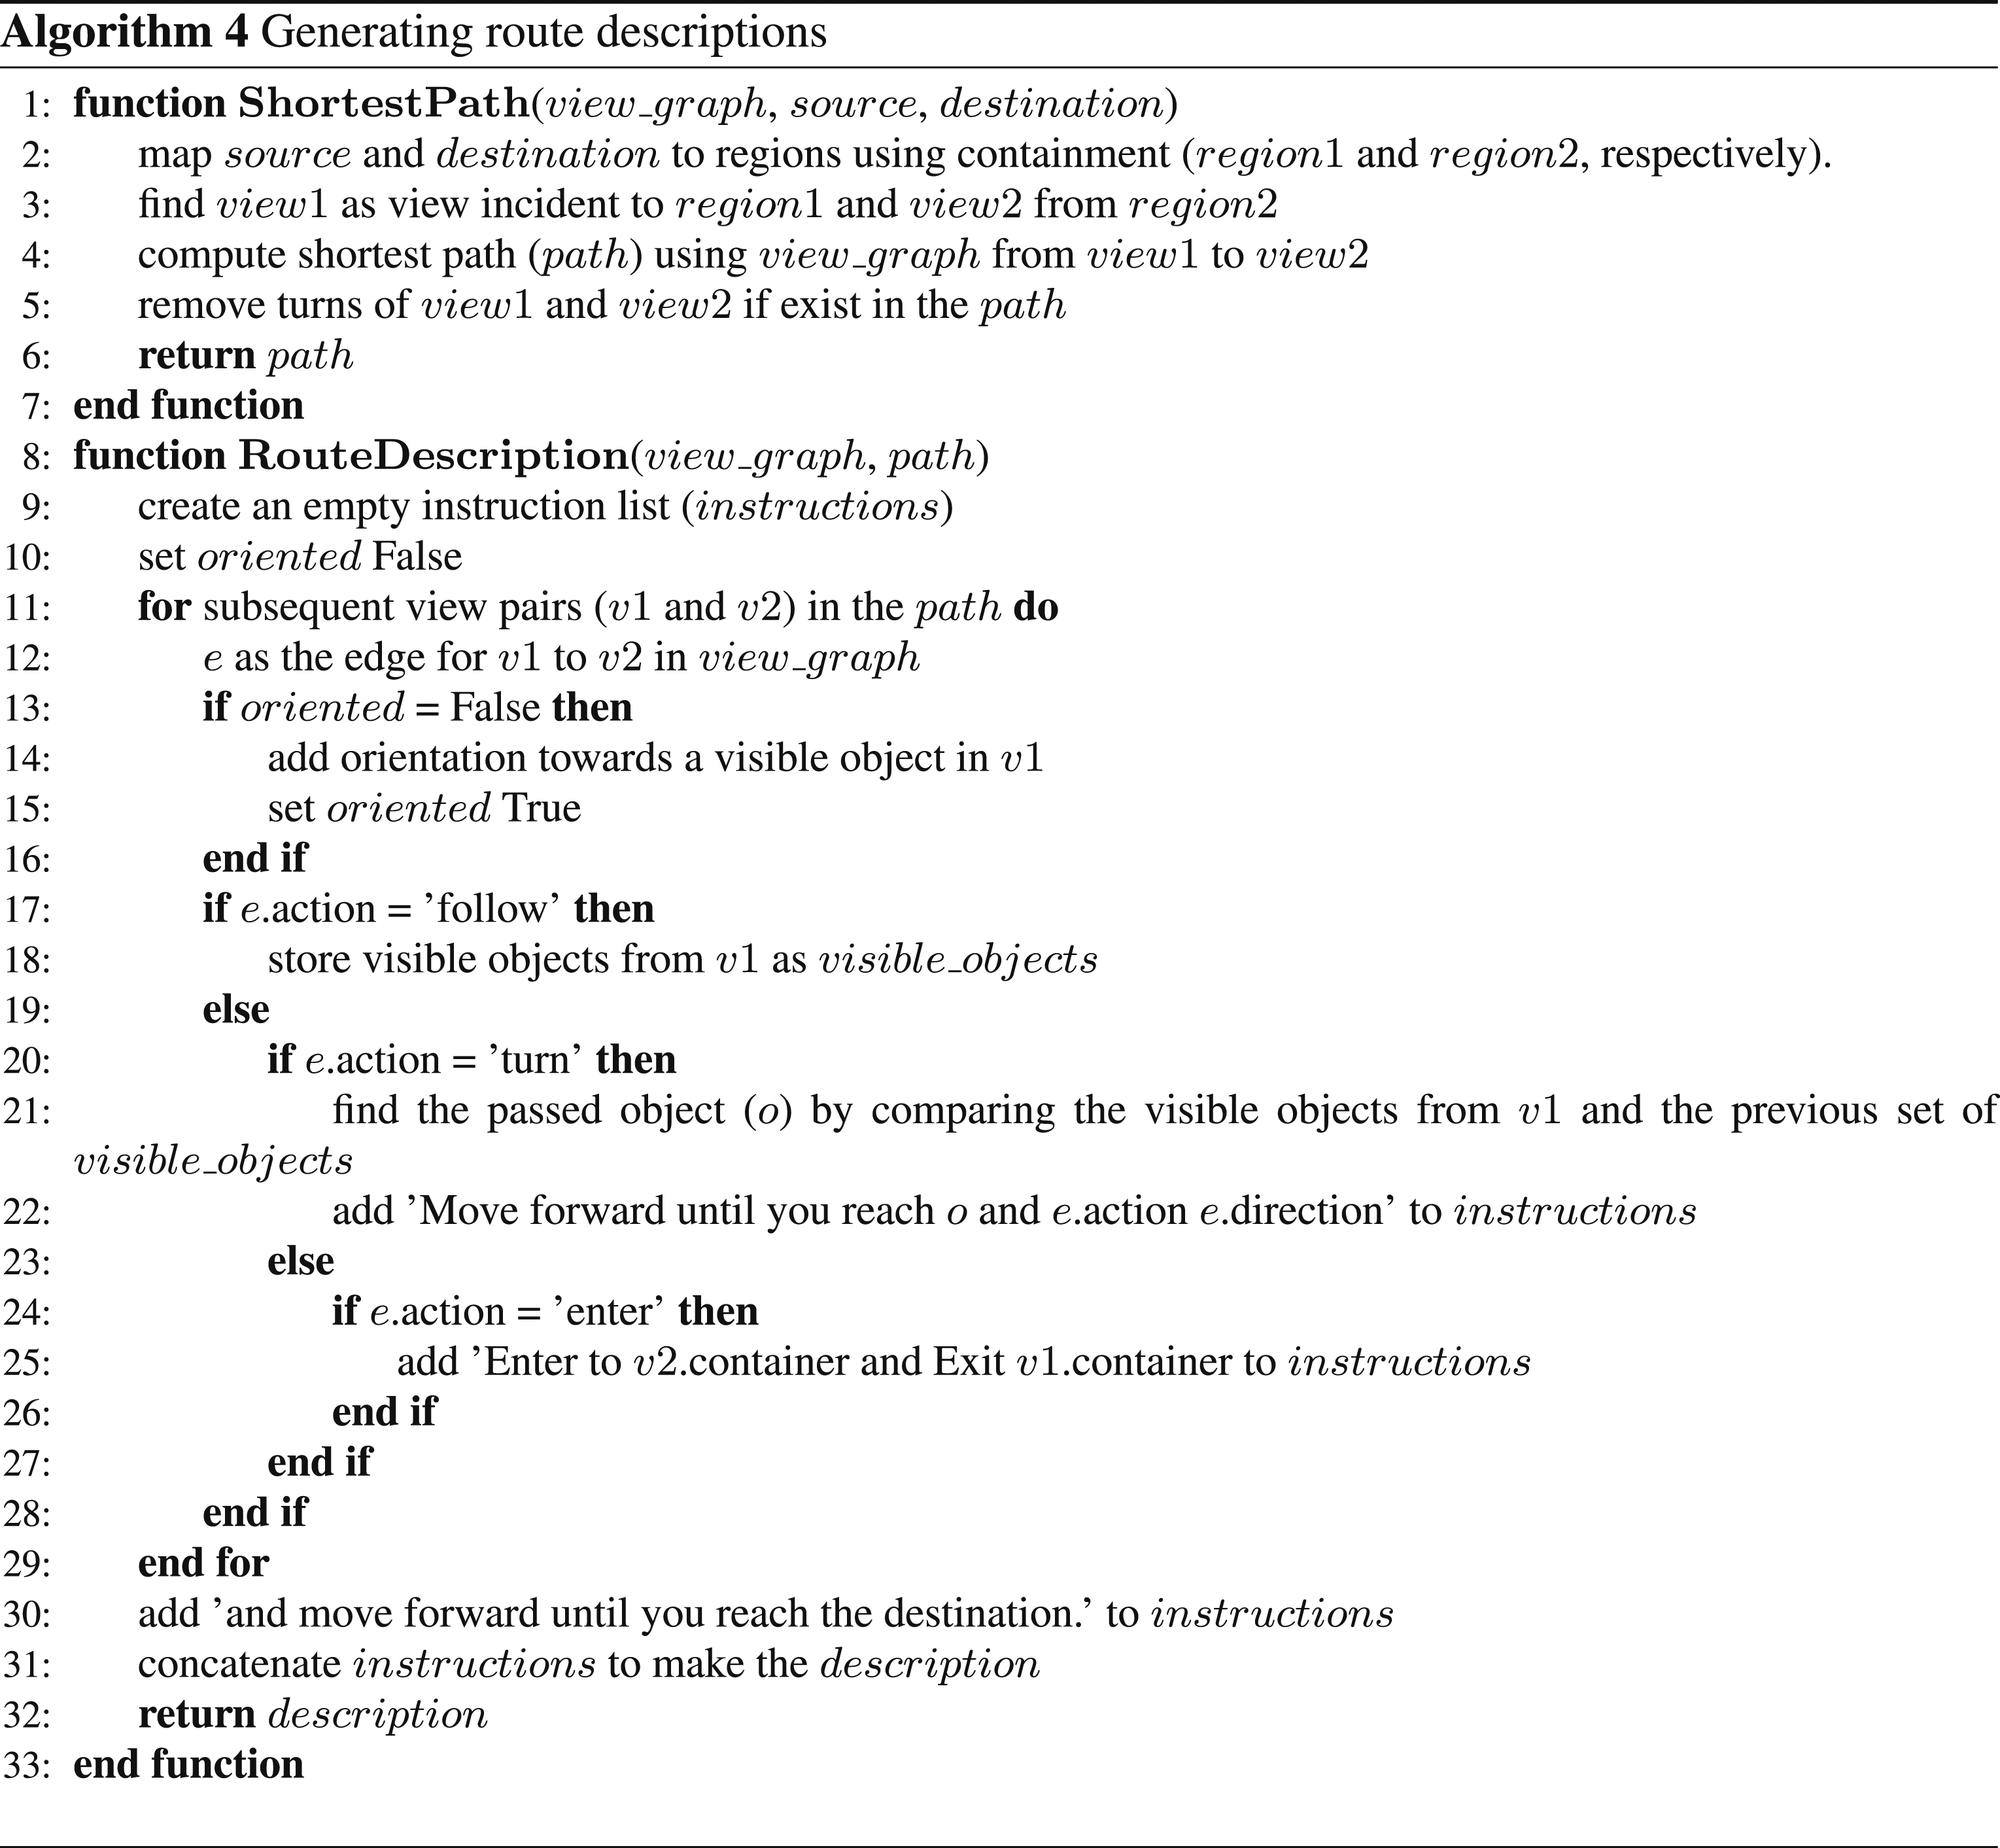
The shortest path (a connected set of views from the view graph) can be translated into a route description. The orientation and pass statements are derived from the node attributes, and the actions (i.e., follow, turn/veer, and enter/exit) are derived directly from the attributes augmented in the edges (see Algorithm 4). The algorithm starts with orienting the wayfinder using visible objects (e.g., landmarks or gateways) preferably at the front, otherwise by objects on the left or right—for example, head towards the [object] or start the path by the [object] on your [left/right]. Next, the sequential views are merged, provided the actions are labeled as follow. In the case of turn/veer, the object that needs to pass before turning is identified to define where the wayfinder needs to turn. In the case of entering a new container, a template is used to describe the new container that the wayfinder needs to enter, and finally, there is a predefined instruction to describe that the desired location is visible and can be reached. Figure 7 shows the generated route description for the example. Finding the shortest path and generating route description.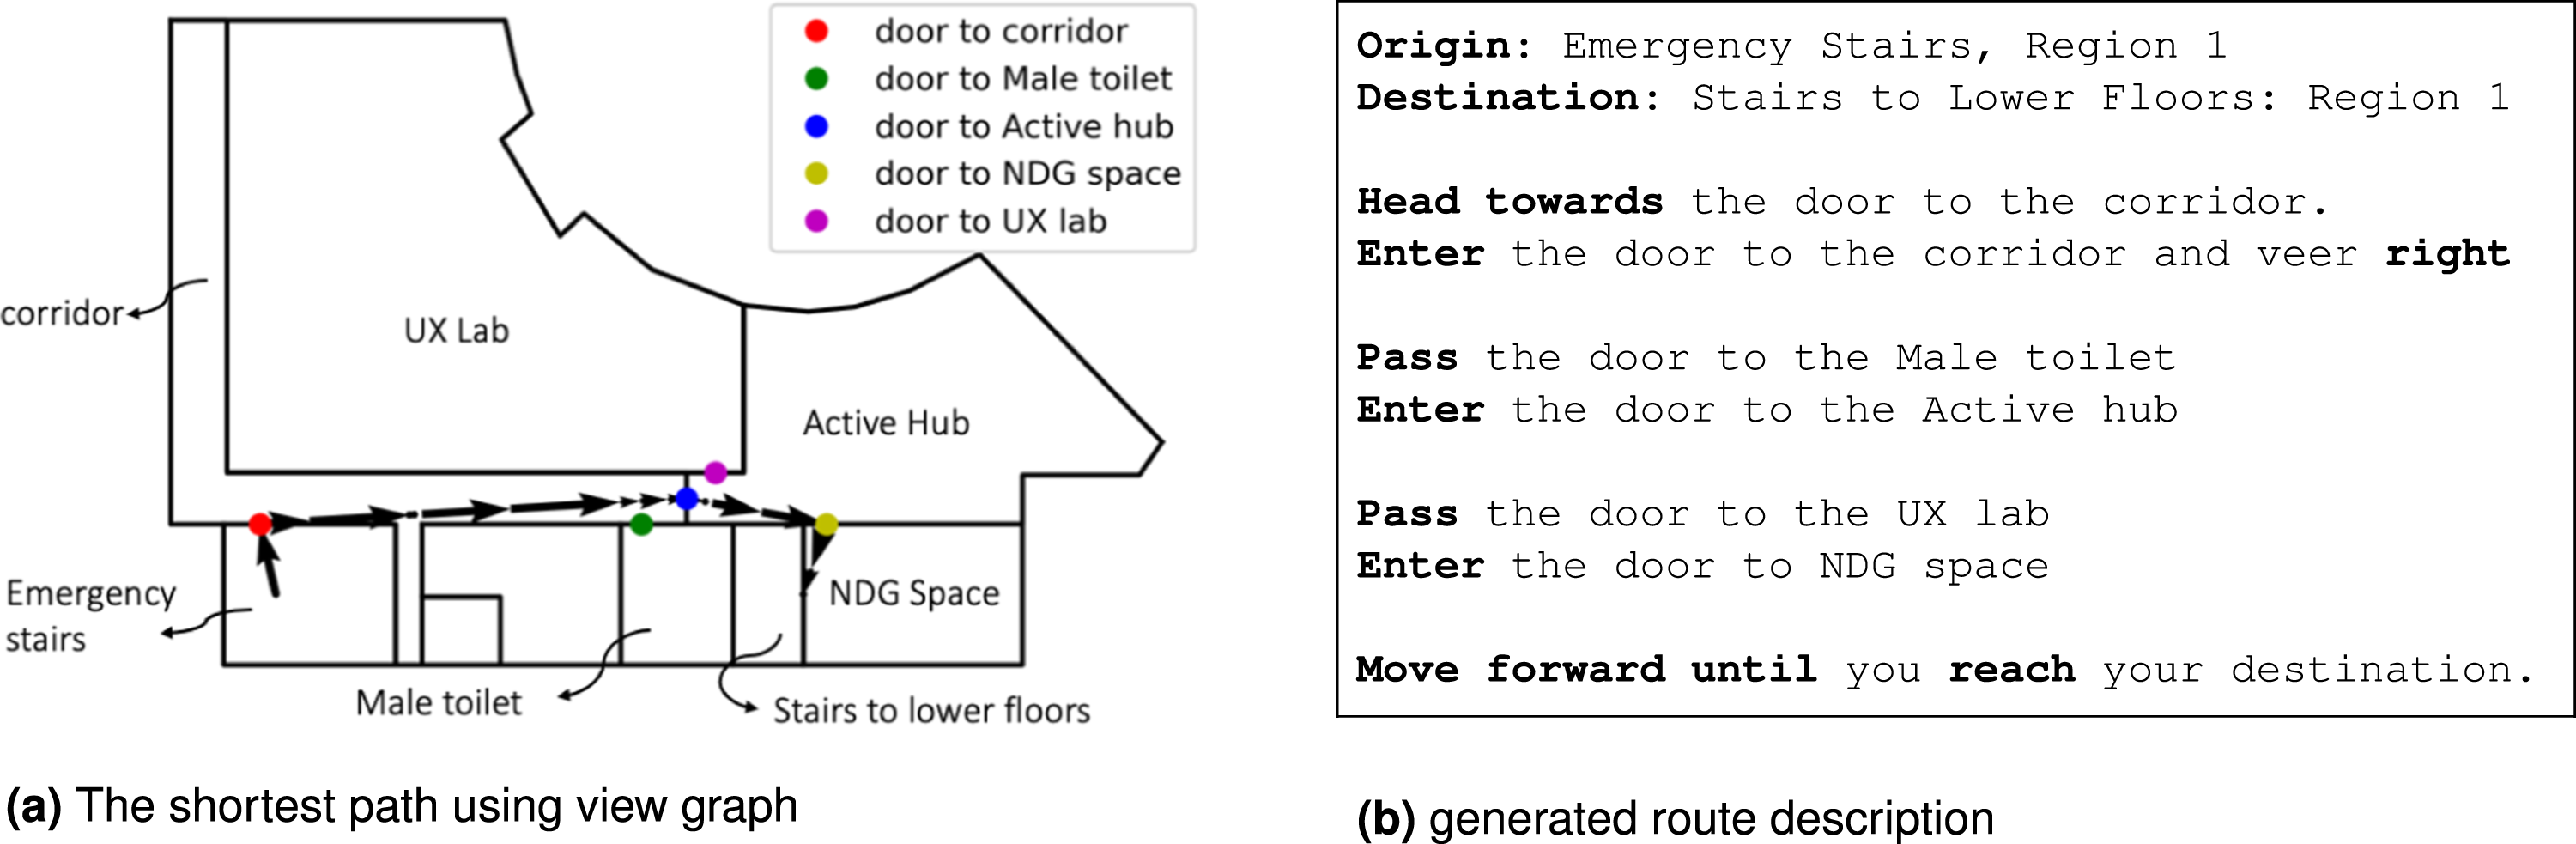
Generating place graphs
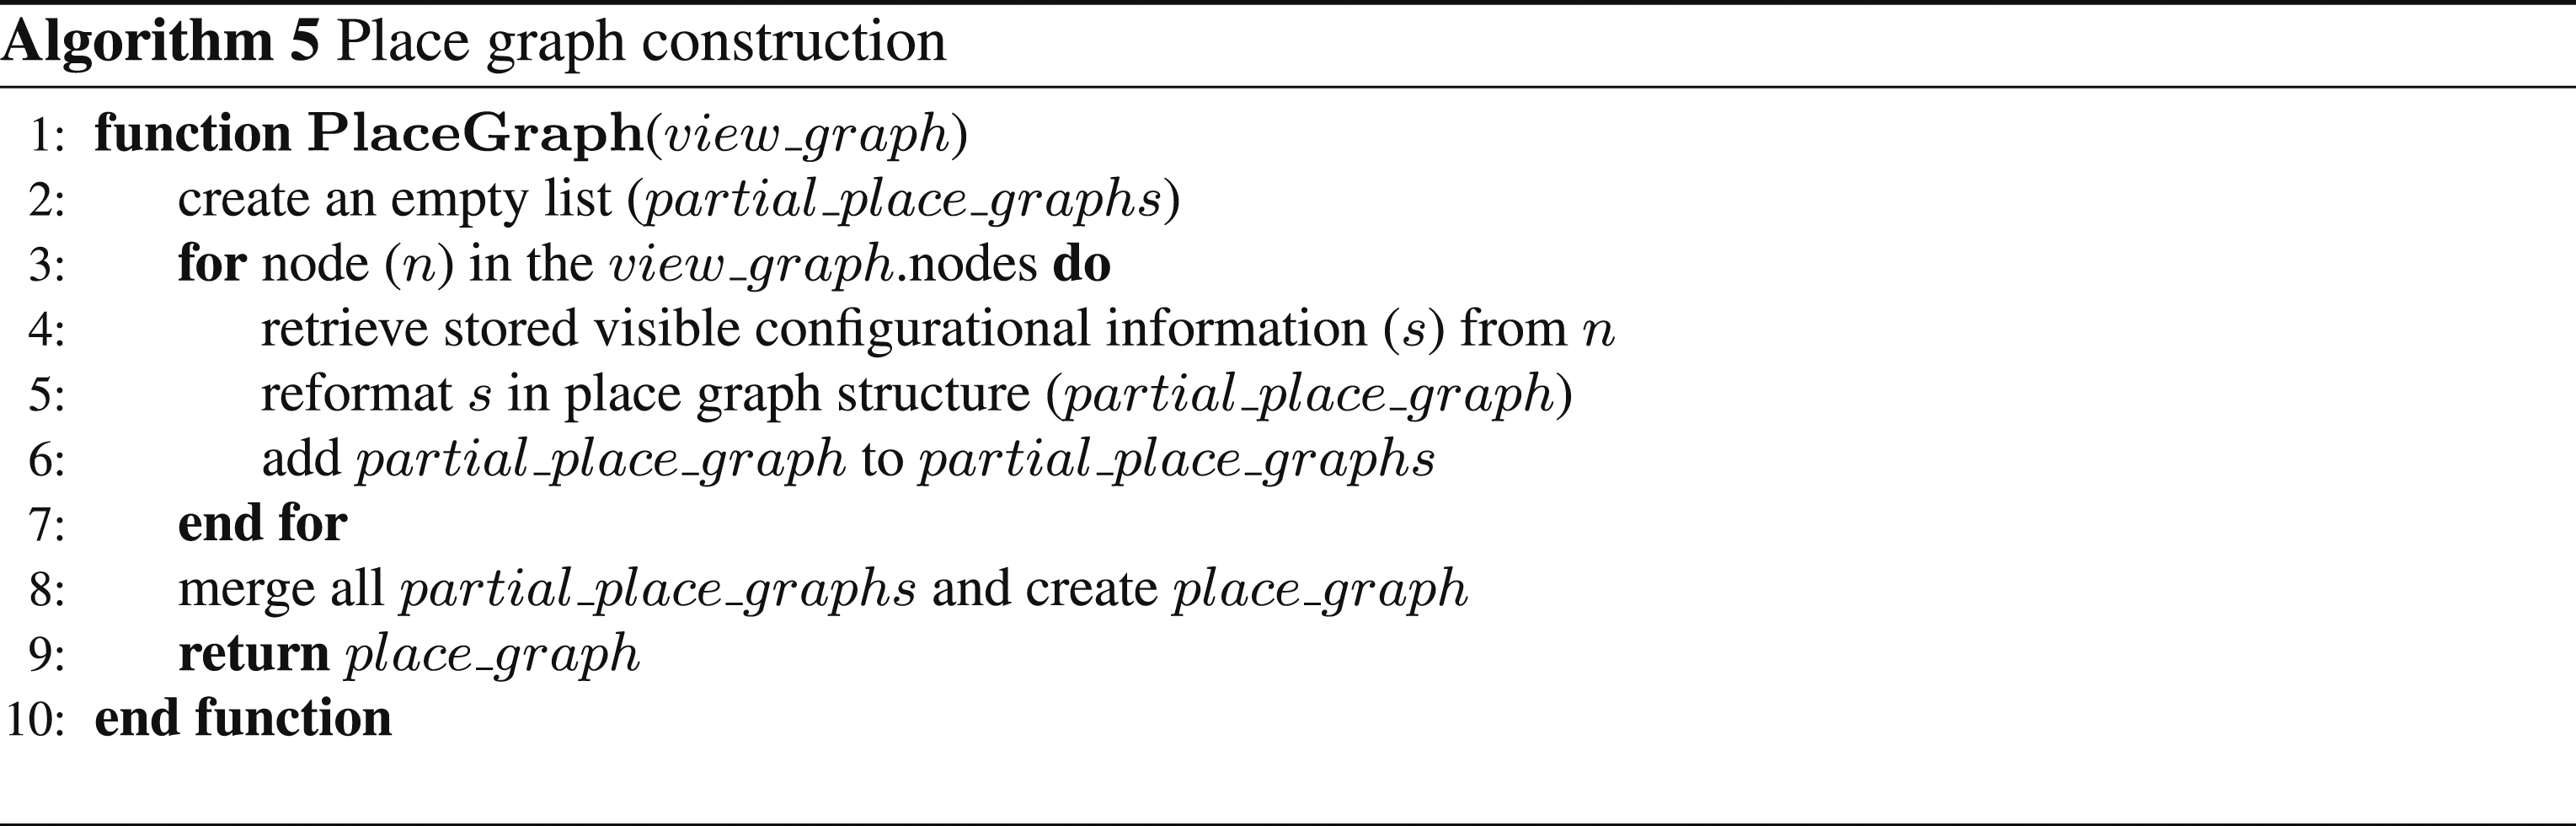
Extracting a place graph from the view graph can be achieved by iterating over the views and creating a partial place graph based on the stored configurational information visible in the field of view. This information is already pre-computed and needs to be reformatted into a place graph data structure. The overall place graph is derived by merging the partial place graphs (using n-plets as defined in Chen et al., 2018a) with each other. Here for demonstration, we precomputed only egocentric directions, betweenness and order. Figure 8 shows an n-plet in the place graph and the geometric representation it describes—for example, The women’s toilet is between the disabled toilet and Landmark 2. Algorithm 5 shows how the computation is achieved to extract the place graph from the view graph. A partial place graph derived from the view graph.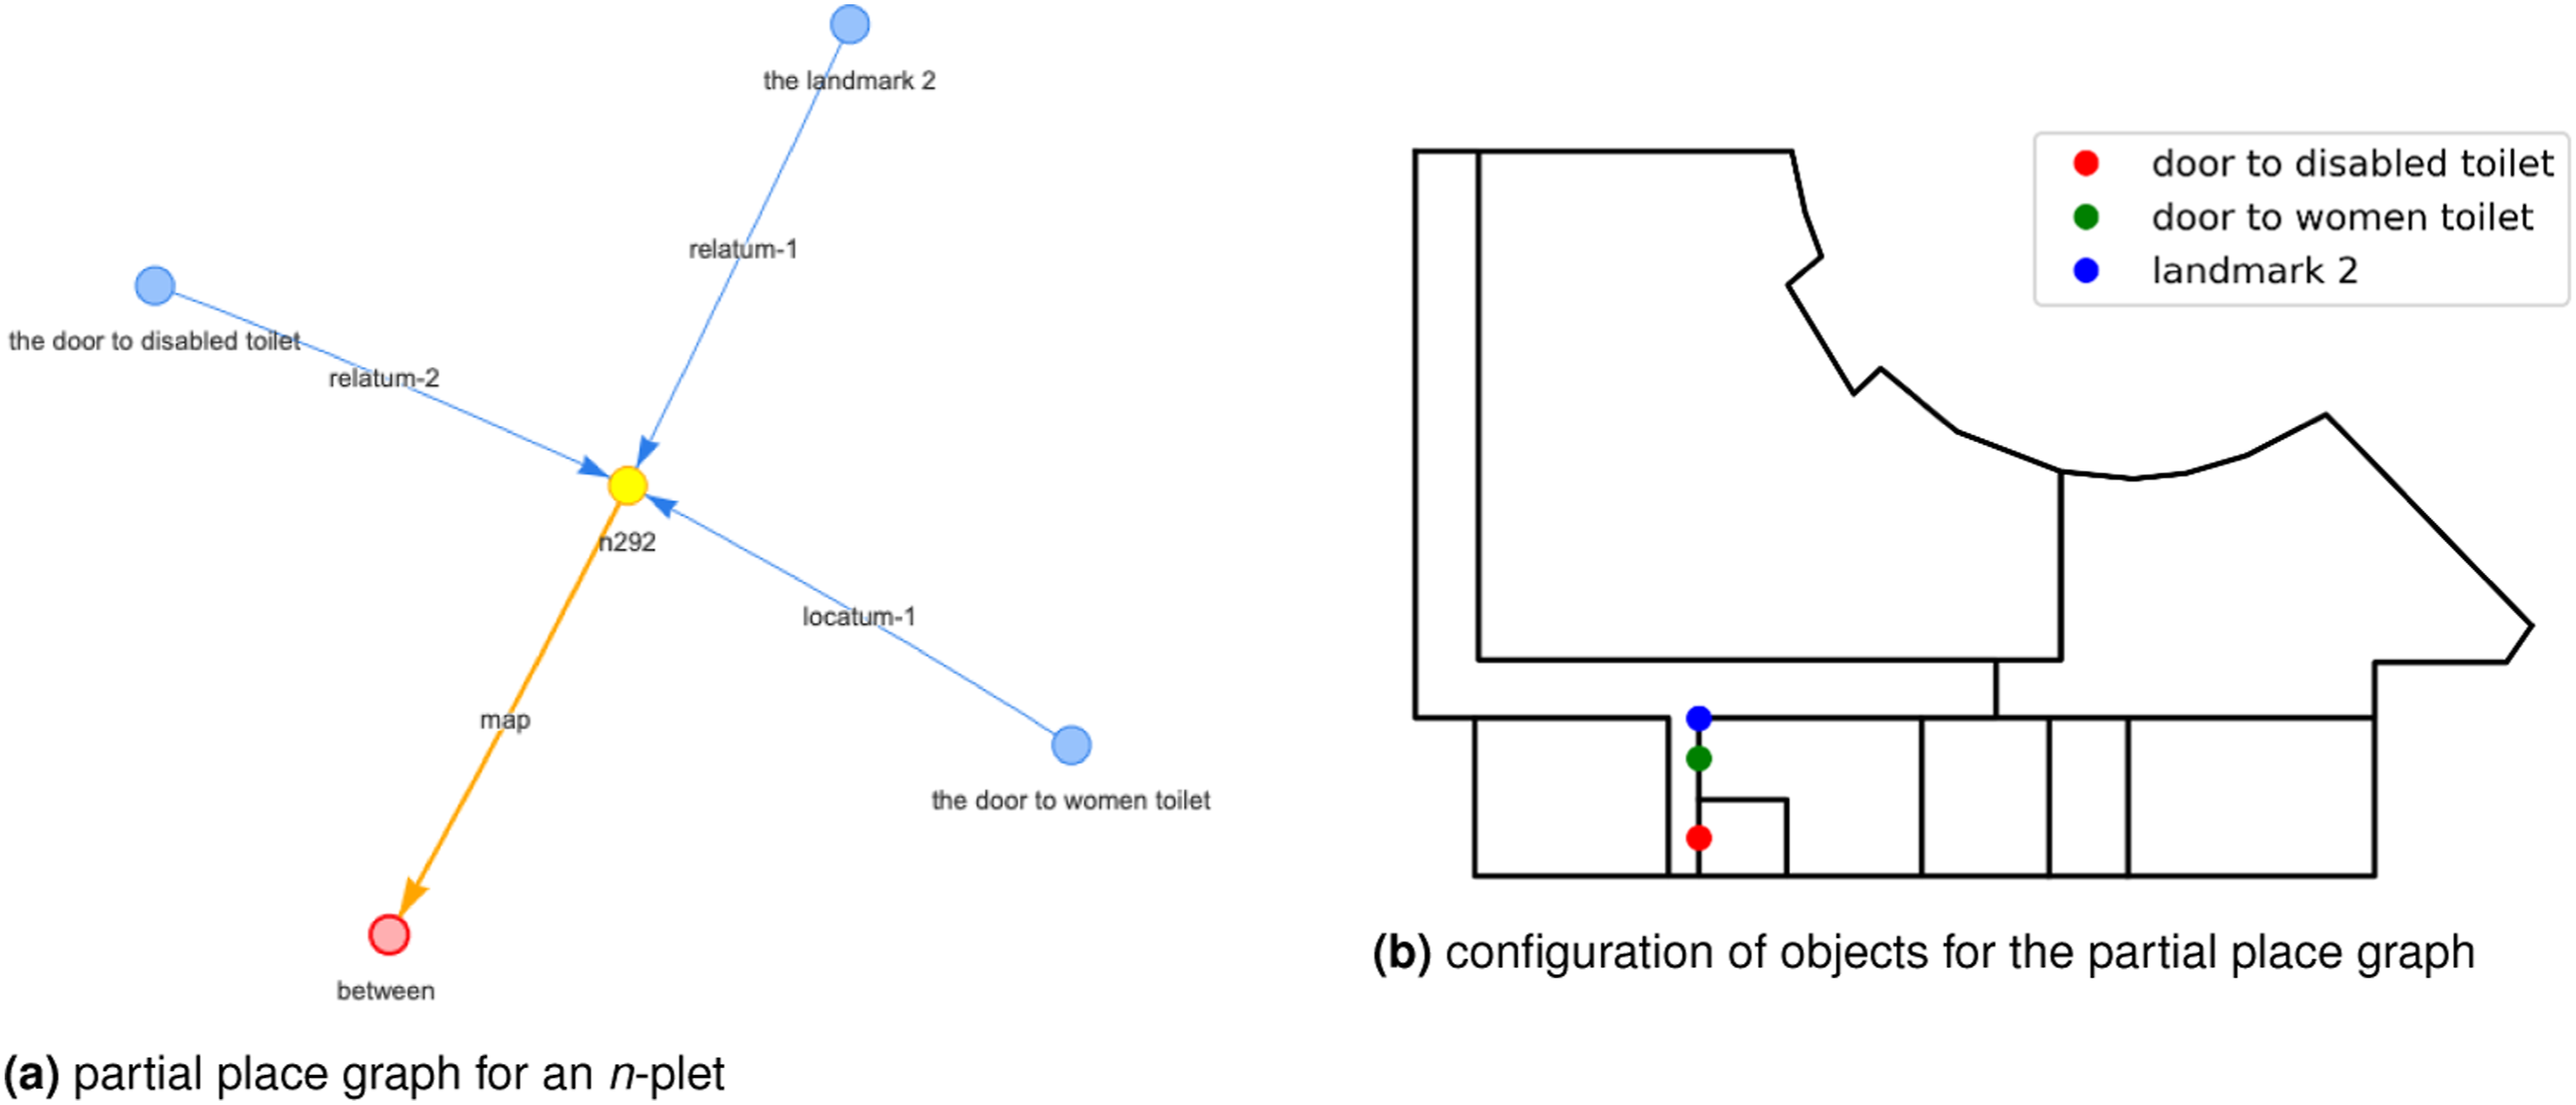
Discussion and conclusion
In this paper, we propose a graph model to capture both route and survey knowledge of an indoor environment. Our model is designed based on views that represent an abstraction of the environment onto a set of directed lines of sight. Each view represents a possible movement in the environment and can capture the partial configurational information, that is, visible from there. The connections between views represent a possible change of direction without any movement (i.e., turn connection) or possible next steps as an agent move from a start of a view to its end point. The model is inspired by the way humans explore and learn the route and survey knowledge, and is capable of computing the shortest path, generating route descriptions, and deriving place graphs.
The assumption for our model is that human movement is towards the gateways. This assumption is valid for goal-oriented movement as the gateways enable movement inside a container (via decision points) and across the containers (via doors). This assumption enables us to design a computational approach to abstract human movements in an indoor environment into a set of views. We also considered the movement from a region to its adjacent regions to capture the continuity of movement in the environment.
To create the view graph, we first partition indoor spaces into regions based on their visual access to gateways. Next, we use minimal convex decomposition for the concave regions. The resulted convex regions can be sufficiently represented as points, and we use these point-based representations as start and end points for creating views. We decompose views based on possible changes in visible configurational information as an agent move along the view and observe the environment. Later, we construct a dual graph for the set of views that are connected through movements (change of location) and turns (change of orientation). Finally, we augmented the view graph with partial configurational information visible in each view and the actions that must be taken to move from a view to its connected views.
The view graph, as proposed in this paper, is the first attempt to use the concept of views for capturing rich configurational information from indoor spaces. There are several limitations that need to be addressed through further research. The major limitation of the model is the assumption that visibility indicates accessibility. This assumption is not valid in real-world applications as the notion of access in indoor spaces is not considered in our proposed model. Consequently, the current model is not able to generate route instructions that consider whether navigators have access to all spaces along their path.
The second limitation of the current view graph is the aim to capture an extensive number of views from indoor spaces. This can lead to a large number of nodes and edges in the view graph of complex indoor environments. To address this limitation, future studies should be conducted to prune the view graph (i.e., minimize the number of nodes and edges) by considering agents’ perceptual capability and usage context. An alternative approach involves developing an efficient algorithm capable of generating a minimal number of decision points to describe potential changes in movement within indoor containers, resulting in a reduced number of decomposed regions and consequently, fewer views.
In this paper, we focus only on single floor indoor spaces, while the notion of views can also be extended to model multi-storey buildings and even outdoor areas. Such an extension of the view graph is required to support complex tasks of pedestrian navigation. However, this requires further research on how views can be derived from 3D indoor and outdoor representations including building information models such as Industry Foundation Classes (IFC), and outdoor 3D city models such as CityGML (Kutzner et al., 2020), as well as how to address the integration of new concepts such as stairs and elevators into the view graph model (Liu and Zlatanova, 2011b).
The demonstrations in this paper only serve to show the capabilities of the proposed model, and further research is required to fully exploit the capabilities of the view graph for generating high-quality route descriptions and deriving ready-to-use place graphs. For instance, generating human-like route descriptions with mixed grammar using the view graph is outside the scope of this demonstration. Generating such descriptions needs a careful extension to the view graph in order to augment more diverse information about the spatial configuration visible from one view and potential actions from one view to another. Moreover, it demands an extensive testing to show the capabilities and limitation of view graph in generating relevant and useful route instructions.
There are also several applications in which the view graph can be used, such as simulating cognitive agents, testing spatial learning in complex indoor spaces, validating route instructions, and constructing trajectories from verbal descriptions. Yet, analyzing the applicability and usefulness of the proposed model for these applications requires future research.
Supplemental Material
Supplemental Material - Indoor view graph: A model to capture route and configurational information
Supplemental Material for Indoor view graph: A model to capture route and configurational information by Ehsan Hamzei, Laure De Cock, Martin Tomko, Nico Van de Weghe and Stephan Winter in Environment and Planning B: Urban Analytics and City Science
Footnotes
Acknowledgements
The support by the Australian Research Council grant DP210101156 is acknowledged.
Declaration of conflicting interests
The author(s) declared no potential conflicts of interest with respect to the research, authorship, and/or publication of this article.
Funding
The author(s) disclosed receipt of the following financial support for the research, authorship, and/or publication of this article: The support by the Australian Research Council grant DP210101156.
Data Availability Statement
Supplemental Material
Supplemental material for this article is available online.
Notes
References
Supplementary Material
Please find the following supplemental material available below.
For Open Access articles published under a Creative Commons License, all supplemental material carries the same license as the article it is associated with.
For non-Open Access articles published, all supplemental material carries a non-exclusive license, and permission requests for re-use of supplemental material or any part of supplemental material shall be sent directly to the copyright owner as specified in the copyright notice associated with the article.