
Abstract
This paper describes the integration of regional navigable networks in France since 1700, using new network connectivity metrics. It shows the progressive integration of the network in the 18th and 19th century and its rapid shrinking in the 20th century.
Introduction
Before the railways, moving heavy or bulky goods over long distances was only economical over water. While coastal areas benefited from maritime trade and some cities enjoyed a relatively large hinterland along navigable rivers, the ‘tyranny of distance’ remained a major obstacle to commercial and French economic integration well into the 19th century. Canal building extends the benefits of inland navigation by linking existing waterways and connecting places of particular economic, political, or military importance. Here we find that: first, the number of disconnected networks fell as the overall size of the network rose (integration phase until the 1890s), followed by the shrinking of the national network in the 20th century (displaced by road and rail infrastructure).
Data
The data presented in this article combine modern vector data (SANDRE-IGN, 2022) matched against a database of links, locks, and tunnels, and combined with temporal attributes (construction dates, opening time) and technical evolution extracted from a variety of historical sources and publicly available compendium on French waterways (Berg, 2007; de La Lande, 1778; Grangez, 1855; Peyronel-Béra, 2022; Pinon, 1995).
Graphic semiology
Since the quality of a network depends on its ability to facilitate circulation over a given territory, representing the waterway network as a graph allows us to measure its circulatory capacity, and hence model qualitative change over time. In this paper, we adopt an approach focusing strictly on infrastructure to measure network connectivity at each decade between 1700 and 2020. A connected network (or component) is a set of points all accessible from each other. At any time, there are therefore as many ‘independent’ sub-networks as there are connected sets of points. The result of this computation is shown on Figure 1 below.
The dates chosen for our visualisation were determined empirically by identifying the inflexions in the number of connected components in the graph, as shown in the thick black line in the middle section of Figure 1. The four dates shown represent the four key phases of the network development since 1700 - selected from the 11 that were produced, for 1730, 1760, 1770, 1800, 1830, 1840, 1860, 1890, 1920, 1930, 1960. Evolution of the French navigable network, 1700 to the present.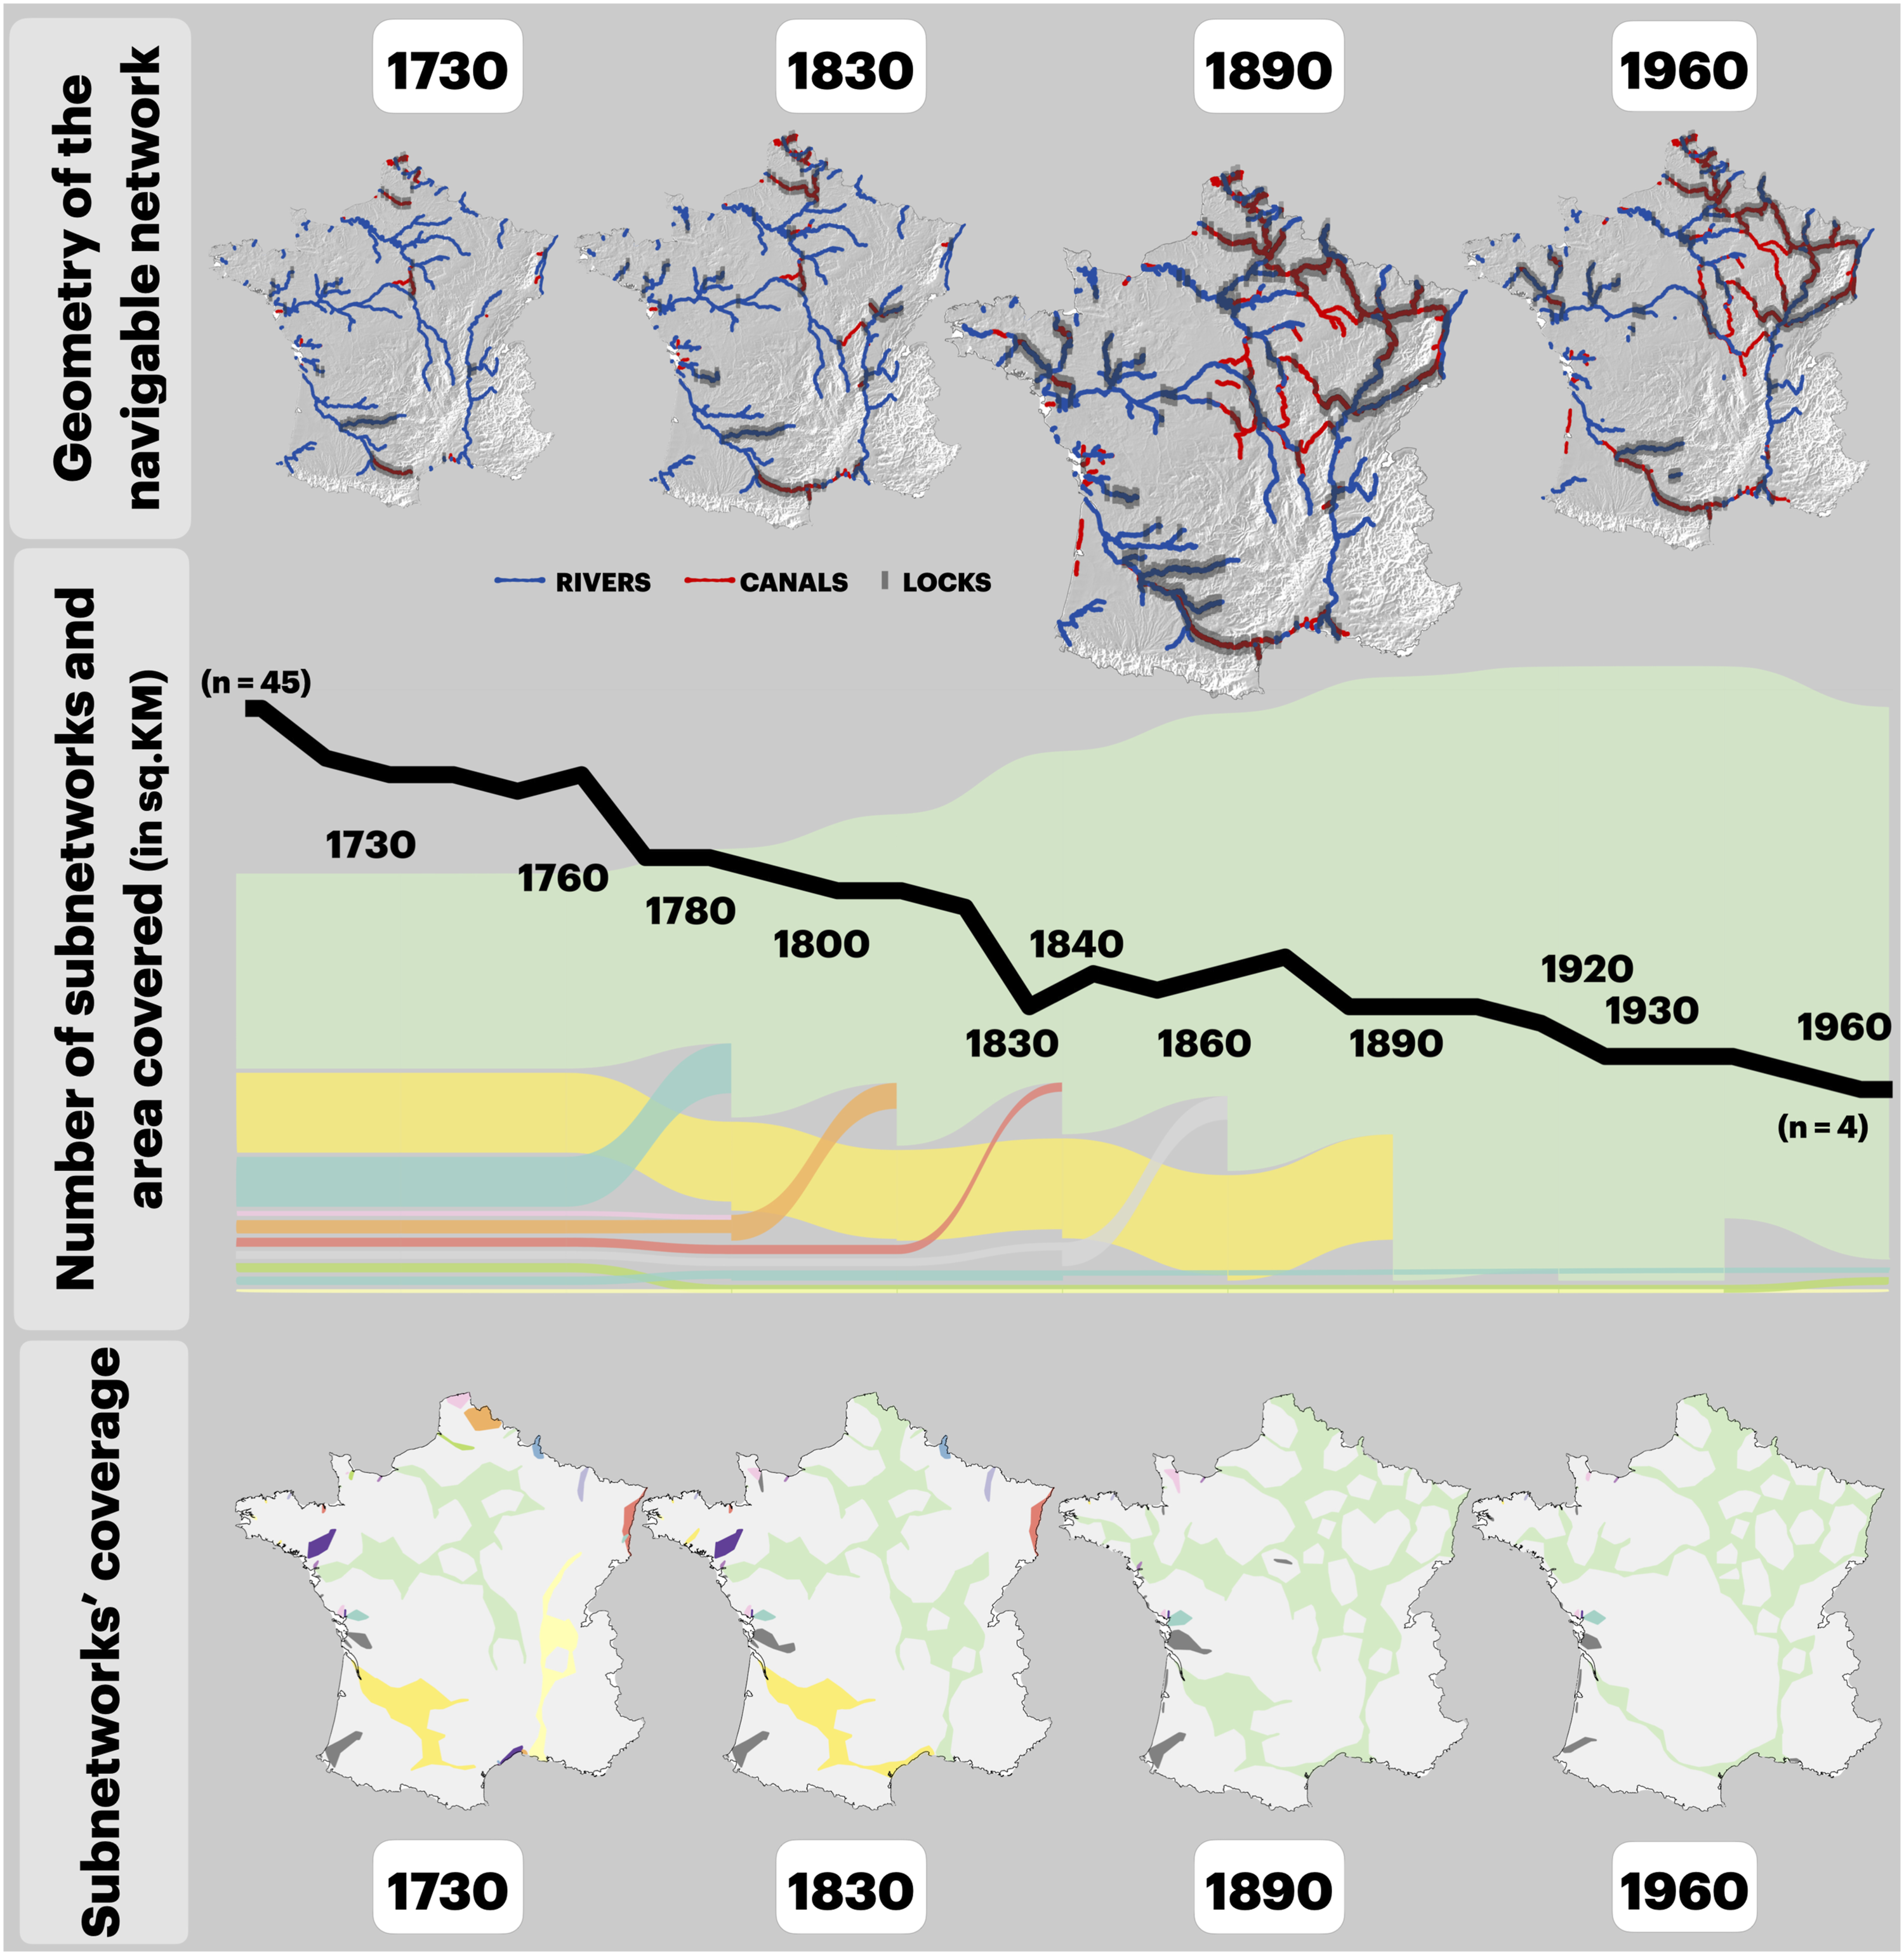
The lower tier shows the area covered by each sub-network. The coverage was calculated by creating a footprint envelope for each sub-network identified. For the purpose of this exercise, we assumed that the area within 50 km of any waterway was deemed covered, except where it would have caused to merge with another non-connected network. Also, it is worth noting that this representation does not take coastal navigation into account. Coastal components are shown as not being connected although inland shipping routes often carried across estuaries and bays.
The upper tier shows the evolution of the network infrastructure (river, canals and locks). The size of the maps is proportional to the extent of the network at each date, showing the minimal extent of the network (1730), the first phase of network integration (1830), the maximum extent of the network (1890), and its shrinking in the second half of the 20th century (1960).
Finally, the Sankey diagram in the middle section of Figure 1 shows the area covered by each sub-network over the period of this study. The colours are consistent with the maps, and the thickness of the line indicates the coverage area of each sub-network. For the sake of intelligibility, only networks covering an aa over 100 sq.km are included on the diagram.
Network evolution
Previous analyses have looked at the evolution of river networks as a series of ‘territorial systems’ based on watersheds. Here, we look again at the chronology and geography of the integration of regional networks, using new connectivity metrics. Our empirical approach confirms partly the periodisation outlined by Beyer (2016): (i) Between 1700 and 1830, the reduction in the number of subsystems reflects the linking of previously ‘closed’ catchment areas. (ii) Between 1830 and 1890, canal digging reached its climax, and for the first time a connected ensemble reached the three maritime fronts (Mediterranean, Atlantic, and English Channel). (iii) Between 1890 and 1960, while Northeastern France benefited from investments to increase network capacity (canalisation of rivers and wider gauges), central and western areas started to decline driven by rail and road competition. (iv) Since 1960, this duality has become even starker. Pan-European connectivity has focused attention and funding on the northeastern waterways, while the rest has continued to shrink.
Economic geography
In terms of economic geography, four key elements can be drawn from the evolution of the waterway coverage over the last three centuries: (i) The eighteenth-century waterway network was characterised by three core elements: first, a sub-network designed to connect Paris to the Atlantic and the Channel, illustrating the key geopolitical and economic balance of the period; second, the Rhone River Basin exclusively connected to the Mediterranean; and third, two transnational waterway systems, in Flanders and Alsace and Lorraine, both disconnected from other French regional sub-networks but integrated into what was then the Austrian Netherlands and the Duchy of Baden along the Rhine. (ii) The early phase of industrialisation in the first third of the 19th century provides a template for the expansion of the network towards the Northern borders, linking the booming industrial heartlands of Lille and Roubaix, and especially the Northern coal fields to the capital and Atlantic ports. (iii) The industrial boom of the second half of the 19th century corresponds to the peak extension of the network and its expansion towards the rapidly growing Alsatian manufacturing sector. After this date, the network stopped growing and even began shrinking in the early 20th century. (iv) Finally, this chronology seems to suggest that the railways had a limited impact on the structure of the inland waterway network in the 19th century. Given the scale of investments required for digging canals, it is unlikely that they would be abandoned in the short term. However, the advent of heavy-goods vehicles in the second half of the 20th century and relatively high ongoing maintenance costs dealt a more visible blow to the canal economy.
Footnotes
Declaration of conflicting interests
The author(s) declared no potential conflicts of interest with respect to the research, authorship, and/or publication of this article.
Funding
The author(s) disclosed receipt of the following financial support for the research, authorship, and/or publication of this article: The research was funded by the Agence Nationale pour la Recherche (grant: 19-CE27-0005-01). The data produced for this research program will be available on Zenodo, as ’French Historical GIS, 1700-2020. Administrative units, Populations, Transports, Economy’, doi. 10.5281/zenodo.3727274