
Abstract
This article presents a model to estimate the impact of geometric and land use elements on citizens’ perception of urban layout pleasantness. An ordinal regression cumulative link mixed model with those elements as regressors is proposed and calibrated using data from an online survey. Results show that landscape building height and density of green areas are the factors that most impact the perception of pleasantness. Based on the model, a methodology to derive pleasantness mean scores for a city is also proposed and applied to a case study. The methodology allows for benchmarking the pleasantness of different cities or comparing neighborhoods within a city. It can be used both as an urban evaluation tool and a decision-aid for city expansion programs.
Introduction
Over the course of history, social movements have led people to cities, making these the prime human habitat they are today. There are many reasons why these movements occur, such as economic factors (e.g. job opportunities), social factors (e.g. urban vibrancy), or accessibility (to have interaction opportunities nearby) (Bruinsma and Rietveld, 1998; Cullen and Levitt, 1999; Handy, 2002; Jacobs, 1961; Maher, 1994; Marantz, 2019; Meng and Xing, 2019; Riffat et al., 2016; Tallen, 1999). Living in an urban environment provides citizens with all these benefits, but the urban landscape may not coincide with what people consider a pleasant physical environment. Therefore, the question arises of knowing which factors affect a person’s perceived pleasantness of the urban layout, in particular, how landscape elements impact that perception. The aim of this research is to try and respond to the latter question in a quantitative manner, based on objective aspects of geometric and land use elements. Note that the term “urban layout” is understood as a synonym for what Lynch (1960) defines as “settlement form” or “physical environment”, that is, the spatial pattern of permanent physical objects in a city.
Research about human perception of the built environment has been the focus of studies in the areas of spatial planning, architecture, and environmental psychology (Alexander et al., 1977; Cullen, 1961; Jacobs, 1995). More recently, research was done focusing on more specific, but subjective aspects, such as the aesthetic of tall buildings on the urban landscape (Yaran, 2016), the aesthetical cognitive perception of urban street form (D’Acci, 2019), the beauty of urban settings considering four different domains: walkability, historical character, size and order, and greenness (Calafiore, 2020), perceptions of the rural–urban fringe (Sullivan, 1994), the relation between perceived environmental aesthetics and walking for exercise (Ball et al., 2001; Humpel et al., 2003), the perception of parks and urban dereliction (Hofmann et al., 2012), and the effect of urban landscape on urban vitality (Zhang et al., 2021). Empirical studies on pleasantness perception in response to geometric and land use elements were presented by Lynch (1960) and Stamps (1998), but only at a qualitative level. Recent quantitative work exists, but at the street level. Examples are Li et al. (2021), who studied the quality of street space using logit models, street views, and expert validation, and Ye et al. (2019), who used machine learning techniques to evaluate the visual quality of streets. Of the quantitative studies, only Calafiore (2020) and Li et al. (2021) used field data to obtain a pleasantness indicator, respectively, a beauty index and a street quality index. Quantitative work exists on the impact of isolated geometric elements on pleasantness (Asgarzadeh et al., 2012; D’Acci, 2014; Lee, 2021; Wang et al., 2021), but none of these works have evaluated the combined landscape at the neighborhood scale. Thus, the literature on quantitative evaluation of layout pleasantness is very much in its infancy.
This article contributes to the state-of-the-art on evaluation of citizen perception of urban layout pleasantness by proposing a quantitative methodology to estimate that perception, based on a statistical model with geometric and land use elements as explanatory variables. The model was calibrated from the results of a worldwide online survey, in which participants looked at images of city neighborhoods from around the globe and were asked to score, on a 1–5 Likert scale, how pleasant it would be for them to live in each neighborhood. To the best of the authors’ knowledge, this is the first time a model is proposed to provide quantitative insights on the impact of landscape elements on the perceived pleasantness of the urban environment. It also fits the research framework of Mouratidis (2021), who advocated for a better understanding of the links between the built environment and subjective well-being.
The model was applied to the mid-size city of Coimbra, Portugal, for which neighborhood pleasantness scores were obtained and used to estimate the global layout pleasantness of the city. This case study demonstrates the usability of the methodology on a large scale and shows that it can be used by local authorities to better plan their urban environment with an aim at citizen pleasantness and overall quality of life. This is especially useful for city expansion programs, as it can help predict the attractiveness of the various urban architectural layouts which may be under consideration.
Methodology
The methodology is based on the premise that different geometric and land use characteristics lead to different perceptions of pleasantness. People may, on average, enjoy, for example, open spaces with lots of green areas more than compact layouts with tall buildings. These perception differences have both objective and subjective aspects and are subject to random fluctuations, coming mostly from the latter aspects. Statistical modeling approaches are designed to deal with this randomness and capture the underlying trends that relate the explanatory and response variables. Such an approach is therefore necessary to relate the landscape elements (explanatory variables) to human perception (response variable), disentangling as much as possible the objective aspects of this relation from the subjective ones. A model of statistical quality can then form the basis for predictive analyses of new contexts.
Geometric and land use elements evaluated
Geometric and land use elements evaluated.
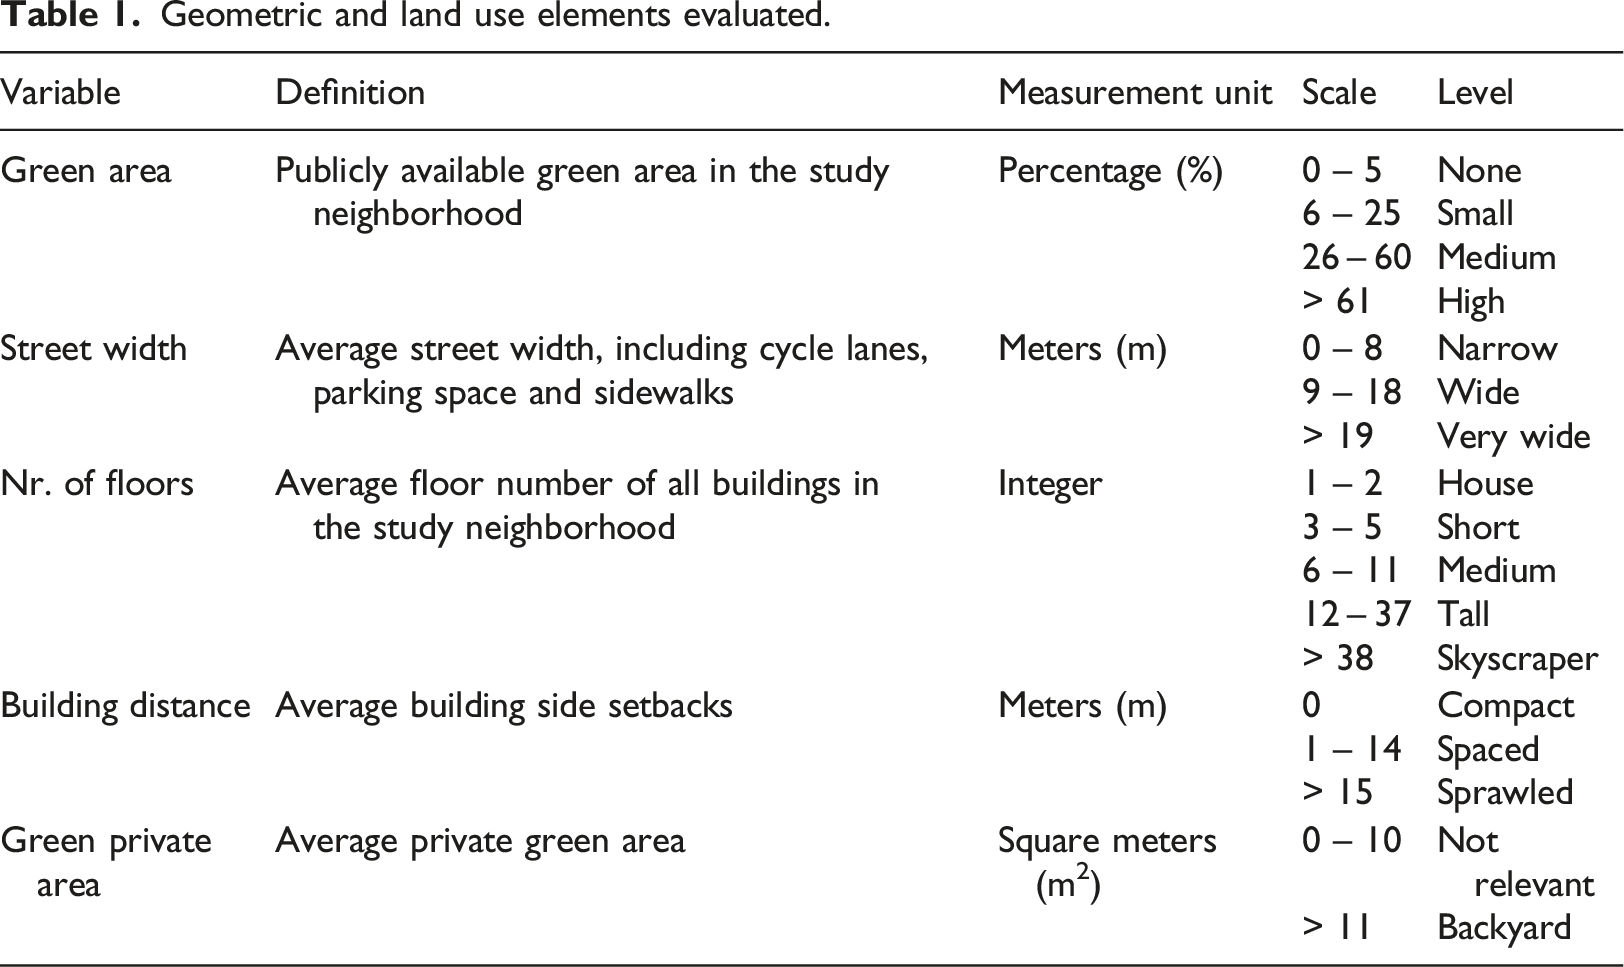
Evaluation of the elements in a neighborhood is made on the measurement unit indicated. When added to the dataset, measured values are transformed into a categorical value using the scale of Table 1. This transformation allows for identification of push-pull effects, such as people preferring, for example, wide streets to narrow or very wide ones, an effect that would not be detectable using the raw measured values. It is also more intuitive and improves the calculational convergence of the statistical models. In defining the scale levels, street width and building distance guidelines of municipal and national authorities were considered (DfT, 2007; GovDC, 2019; IDoTTS, 2013; SDT, 2000). Similar standards for number of floors differ according to city and country (The B1M, 2018). The chosen scale was based on a combination of those standards. For green area and green private area, no standards were found, so the scale was based on the authors’ judgment.
Other landscape elements were considered besides those in Table 1. However, a principal component analysis run on survey image data revealed those extra elements were highly correlated to existing ones and were therefore discarded to avoid perturbations in the statistical models.
Survey design
The survey was carried out on the Lime Survey online platform and consisted of 25 urban landscape images which the subjects rated, a demographic questionnaire and an open question. The survey’s online character allowed for fast dissemination and wide reach over social media, and ease of access. The opportunity to show images from cities all around the world and the diversified participant pool, with people of different backgrounds and cultures, reduces biases and strengthens the universality of the study. The use of images for surveys related to urban planning is well documented in the literature (Candeia et al., 2017; D’Acci, 2019; Hofmann et al., 2012; Li et al., 2021; Rijswijk et al., 2016; Sussman et al., 2021; Weinberger et al., 2021; Wergles and Muhar, 2009). The decision to show only 25 pictures was made to keep completion time to a maximum of 10 min, a time frame recommended by Galesic and Bosnjak (2009) and Revilla and Ochoa (2017).
Demographics
The demographic questionnaire gathered subject age, gender, the type of area where the subject grew up in, and the type of area they currently live in. Possible area types were rural, urban, and rural-urban mix, that is, the fringe between rural and urban zones. Discrimination by area type allows for separate analyses based on subject past and present life experience.
Images
Images from 25 urban neighborhoods from around the world were taken from Google Earth. In the selection, variety was sought-after, from dense skyscraper landscapes to quiet-looking neighborhoods of one-story homes, to have enough representatives of all scale levels of Table 1 variables and a full spectrum of characteristics that would be possible, for most subjects, to find in their own cities and neighborhoods. Images were presented to the subject in a bird’s-eye view, as street views cannot capture full pictures of a neighborhood and its surroundings. All images showed well-cared for neighborhoods, so that subjective factors such as, for example, building or street degradation would not bias the subject towards lower scores. The study area of each settlement represented in the images is circa 80,000 m2, a land plot size chosen having in mind the traditional neighborhood walkability range of a quarter mile (400 m) (Yang and Diez-Roux, 2012). The set of images used and statistics on their geometric and land use elements can be found in the Supplementary Material.
Subjects were asked whether they would like to live in the urban settlements presented on each image and gave their answers on a Likert scale of 1–5, with 1 as “definitely would not like to live here” and 5 “definitely would like to live here.” They were also asked to try and abstain as much as possible from considering building aesthetics or proximity to shops and services (accessibility) from their evaluation. Before the start of the survey, subjects were given the opportunity to view all the pictures at the same time, to both create a sense of comparison and reduce sequence biases from showing similar images in blocks. The geometric and land use elements under scrutiny were not disclosed to the participants.
Open question
The open question was optional and asked each subject to disclose any particular aspects that they took into consideration in their evaluation of the images. This last question was meant to validate whether the geometric and land use elements of Table 1 were actually being looked at by the subjects. The answers were analyzed by a natural language processing machine learning algorithm, translating to English where needed, and in general confirmed the variables’ adequacy (see also section CLMM for geometric and land use elements). Some participants mentioned elements other than those of Table 1, but they were not general enough (e.g. proximity to water fronts) or not suitable for the methodology (e.g. not quantifiable), so none were added.
Statistical model
The choice of a statistical model is dictated by the nature of the explanatory and response variables and the aim of the study. The perception of urban layout pleasantness (response) is assumed to be formed by a combination of the five geometric and land use elements (explanatory variables) modulo a statistical error. The statistical link between a response variable of discrete ordinal nature and explanatory variables of categorical nature can be expressed by a logistic regression model. In addition, the subject introduces a random factor that represents an overall more optimistic or pessimistic view by the person rating the images. A cumulative link mixed model (CLMM) was selected for the approach, with logit link function and unstructured thresholds. This model is defined by Tutz and Hennevogl (1996) with the notation adapted for clarity as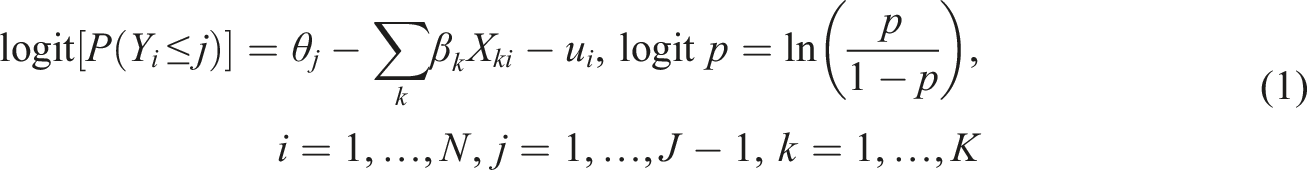
Results and discussion
Demographics statistics.
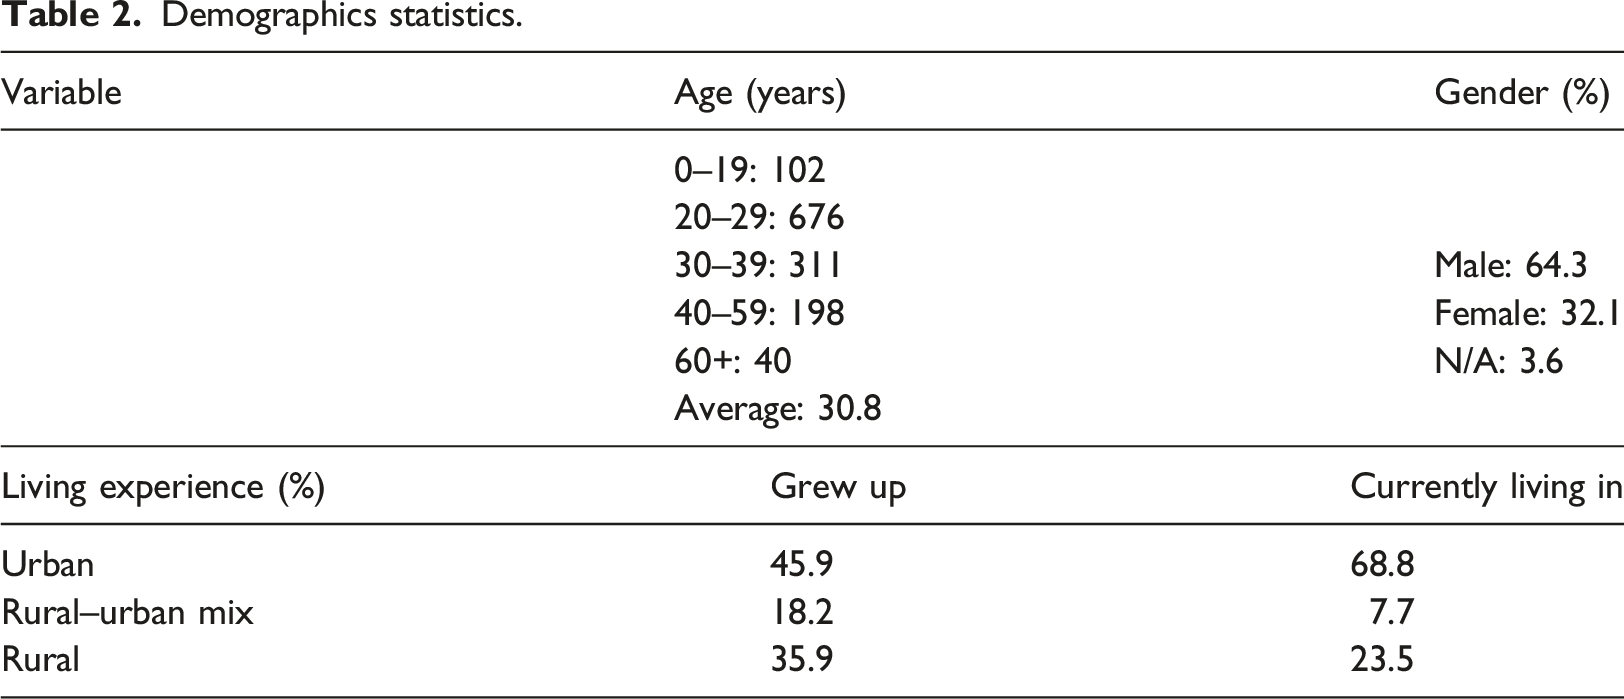
Table 2 shows that older age groups and females may be under-represented in the sample. However, a CLMM with age and gender as explanatory variables reveals that only age is statistically relevant (p-value = 0.02%). Removing gender from the model yields a negative regression coefficient for age of −0.01258 (p-value ≈ 0%). Positive (negative) regression coefficients indicate a tendency towards higher (lower) scores of the response variable. So, per each year of age, the log-odds of equation (1) decrease by 0.01258, hinting that people become more critical of their urban environment as they grow older. However, the explicative power of the age CLMM compared to a threshold-only CLMM is low, having a Nagelkerke pseudo-R2 of just 0.13%.
CLMM for geometric and land use elements
R summary of the CLMM with geometric and land use elements as explanatory variables.
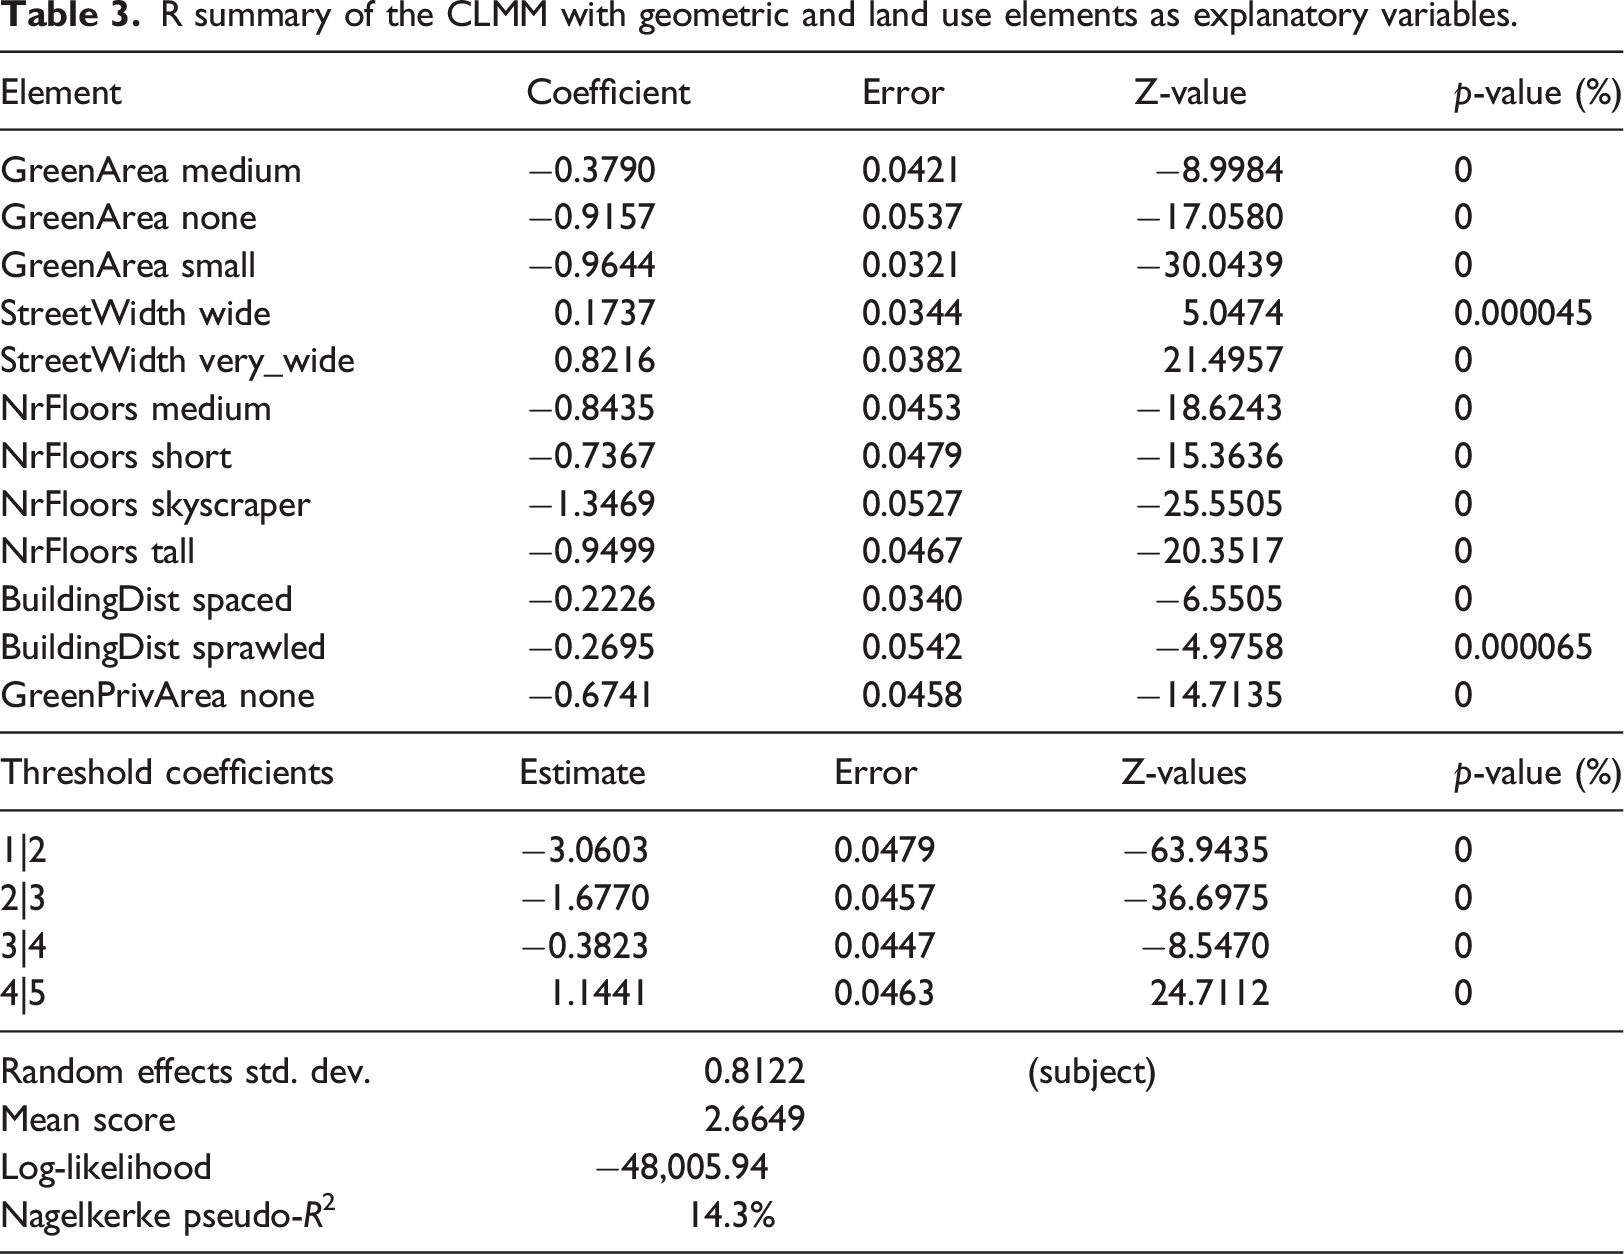
In logistic regression models with categorical explanatory variables, there exists a base, or reference scenario for regressor levels, in relation to which the other levels compare. The choice of base scenario levels is arbitrary and is usually done lexicographically by the software. For the CLMM of Table 3, this is of a neighborhood of high green area, narrow streets, house-like nr. of floors, compact distances, and with backyard. The high absolute value of the log-likelihood indicates a good model fit and the Nagelkerke pseudo-R2 suggests a moderate-to-good explicative power, as logistic regressions usually have low pseudo-R2 values (Hughes et al., 2019; Hemmert et al., 2016). The random effects standard deviation of 0.8122 indicates ratings disperse almost one Likert scale point due to subject judgment. The slightly below-average mean scores of the images (2.665 for a scale mid-point of 3) evidence some displeasure with the urban environments under scrutiny.
The zero p-values for threshold coefficients indicate participants clearly distinguished between all the five Likert levels of scoring. The near-zero p-values for all category levels show that the levels are highly significant in changing the subjects’ ratings with respect to the base scenario. Negative (positive) regression coefficients indicate changes towards lower (higher) neighborhood scores. A closer look at the coefficients’ values reveals the direction and intensity of this change.
Green area
As compared to a neighborhood with a high percentage of green area, the negative regression coefficients show that lower percentages cause a decrease in the subjects’ perception of pleasantness. The coefficient for “medium” percentage (−0.3790) is less negative than that for “small” or “none” (<−0.9000), meaning people penalize the latter more. The coefficient for “none” is slightly higher than that for “small,” so a slight preference for no green area is perceived as better than a few scattered patches of green. However, the effect is small and could perhaps be due to the small image sample size.
Street width
The positive coefficients show that, as compared to narrow streets, the wider the streets are, the more pleasant neighborhoods are perceived to be.
Nr. of floors
The base scenario of a neighborhood made of short houses is highly preferred, as coefficients for other levels are highly negative. Also, coefficients decrease with building height, indicating pleasantness tends to decrease accordingly, with skyscraper neighborhoods being highly disfavored.
Building distance
This element shows slightly negative coefficients for spaced and sprawled neighborhoods, indicating people tend to favor closeness of dwellings. Albeit being the element with the smallest overall impact in the ratings, that impact is nonetheless significant. A possible explanation for this might reside in a feeling of uneasiness due to crime when buildings are far apart.
Green private area
With the base scenario of having a backyard, the negative coefficient for “none” shows that having a private open space is clearly preferred to not having one.
Answers from the survey open question add considerations that help to understand the results. Public and private green areas were the most mentioned element of the five, with participants reporting an overall positive impact of having public gardens and green areas near their homes, as well as having a private backyard. In the opposite direction, building height gathered strong opinions about how it would be unbearable for some to live in buildings with a lot of floors, especially skyscrapers. Even participants who disclosed living in cities where skyscrapers are part of the skyline felt that, given the option, they would choose not to live in such neighborhoods. With respect to street width, some participants (mostly women) found narrow streets to be unsafe, in association with lower traffic, less people, and back alleys. As to building setbacks, some expressed that a compact building is too claustrophobic, but admitted that if buildings were too far away, there would be less socialization and a sense of isolation. This last comment suggests a push-pull effect might occur, with medium-sized distances being preferred. However, that is not what the regression coefficients show.
Summarizing the results, participants declared a preference for urban environments with sizable green areas, wide streets, short but compact buildings, with private green spaces. Some of these tendencies are statistically strong enough to be expected to be general; others may become more precisely defined if more images were considered, such as, for example, the difference between the “small” and “none” green area levels or the possible push-pull effect of building setbacks. Some of the more pronounced tendencies have been identified in the literature, albeit at a qualitative level. The preference for larger urban parks has been identified in relation to various aspects by Giles-Corti et al. (2005), Gozalo et al. (2019), Kaczynski et al. (2008), and Nordh et al. (2009). Aversion to tall buildings has been recognized by Ali and Al-Kodmany (2012) and Sundrani (2012), while Mohsenin and Sevtusk (2013) found wider streets are better remembered. Day (2000) concluded that the lack of a backyard was a factor of discontent. This research adds statistical power to these findings, enabling the possibility to evaluate and predict pleasantness levels beyond qualitative considerations.
Influence of present and past experiences
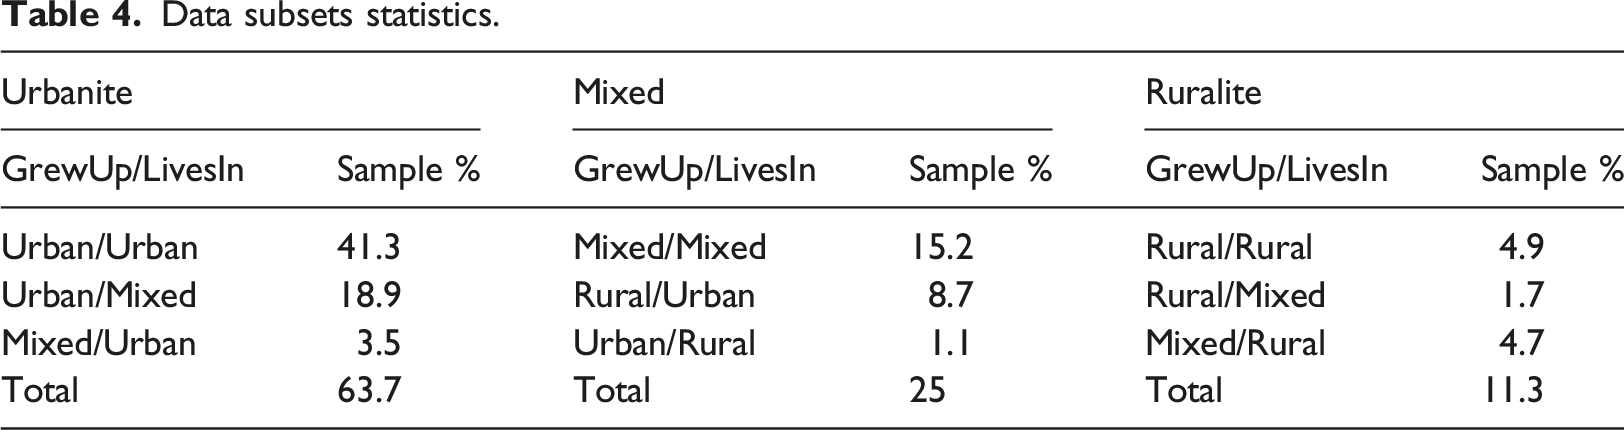
Present and past experiences shape the human mind, and the perception of urban layout pleasantness should be no exception. To better understand the effect of present and past experiences, the CLMM was rerun on two subsets of the data, namely, urbanite and ruralite subjects. Urbanites are defined as people who grew up or currently live in an urban environment and never lived in a rural environment. Similarly, ruralites are people who grew up or currently live in a rural environment and never lived in an urban one. People outside these definitions were deemed mixed subjects. Table 3 summarizes sample statistical data on those subsets.
Data subsets statistics.
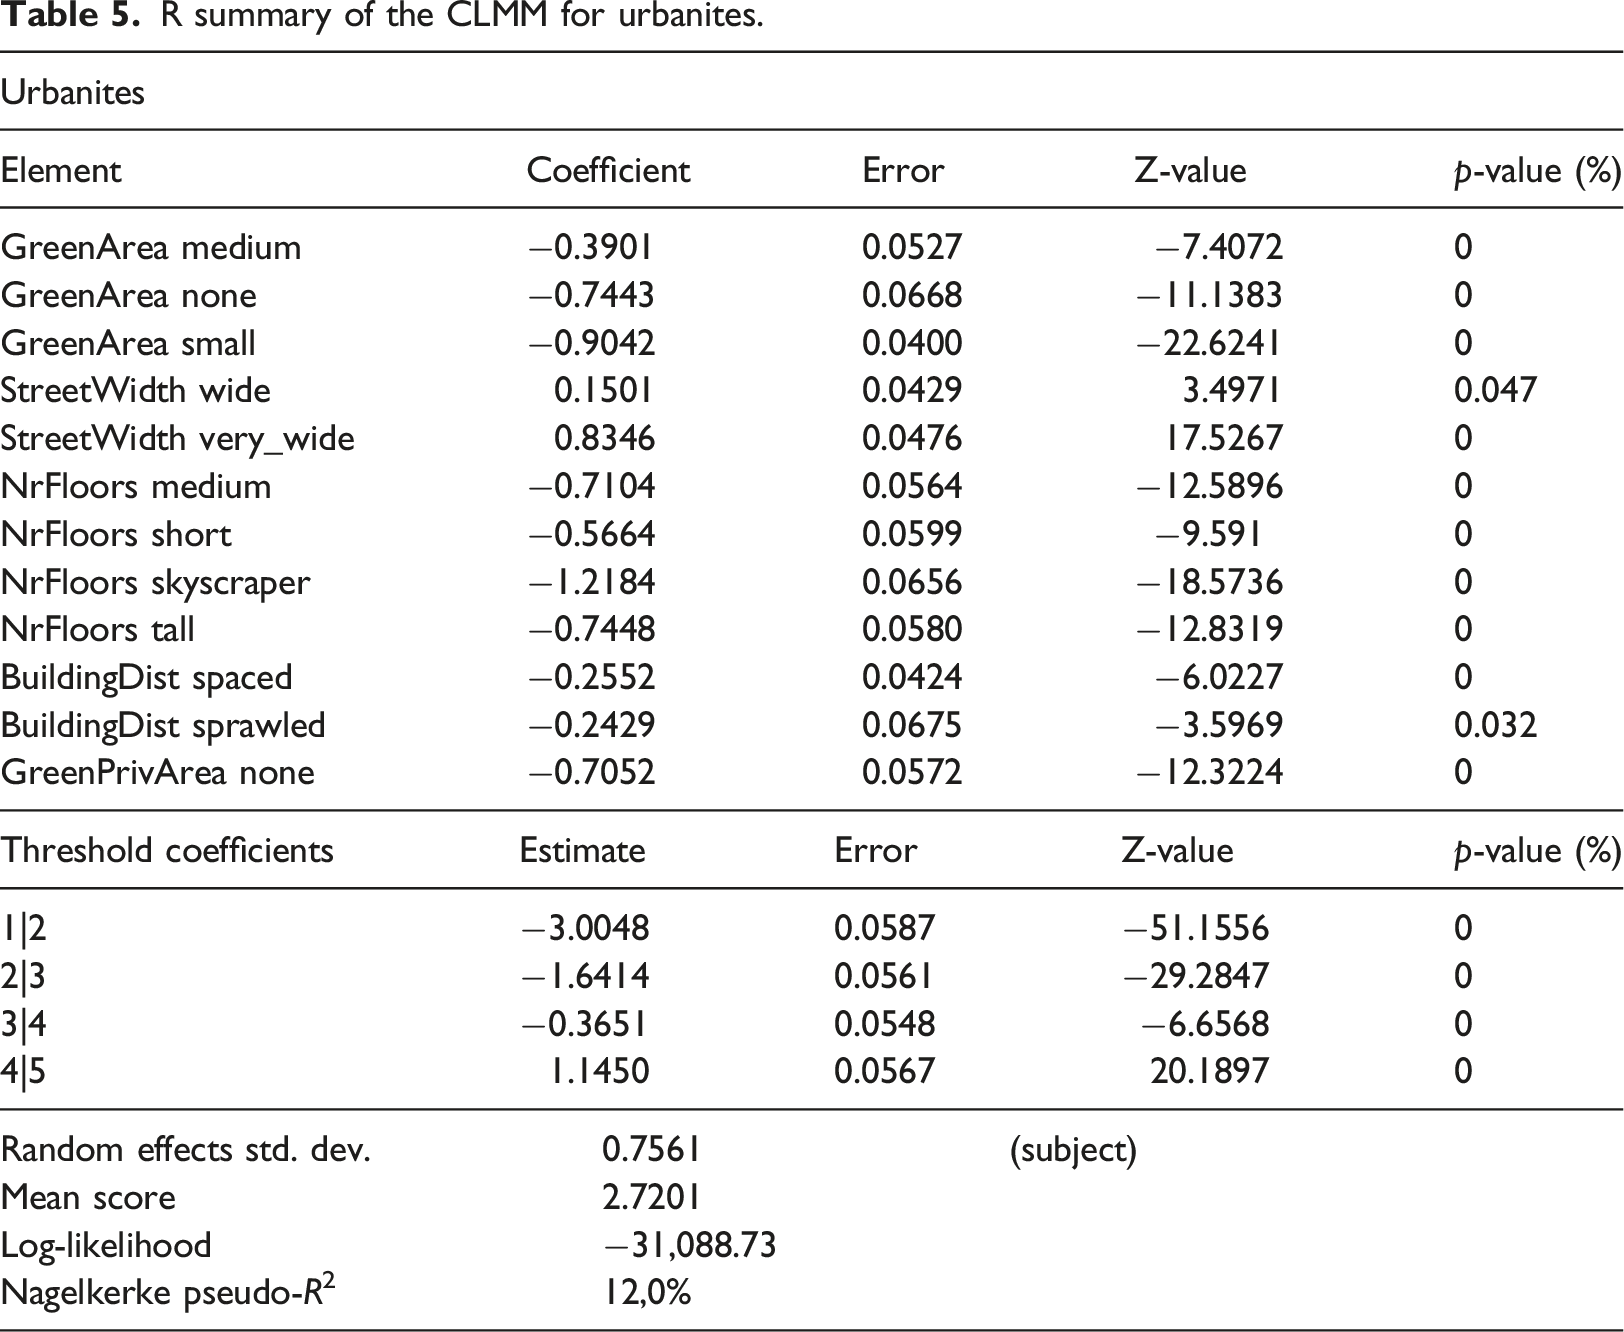
Urbanites
R summary of the CLMM for urbanites.
Ruralites
R summary of the CLMM for ruralites.
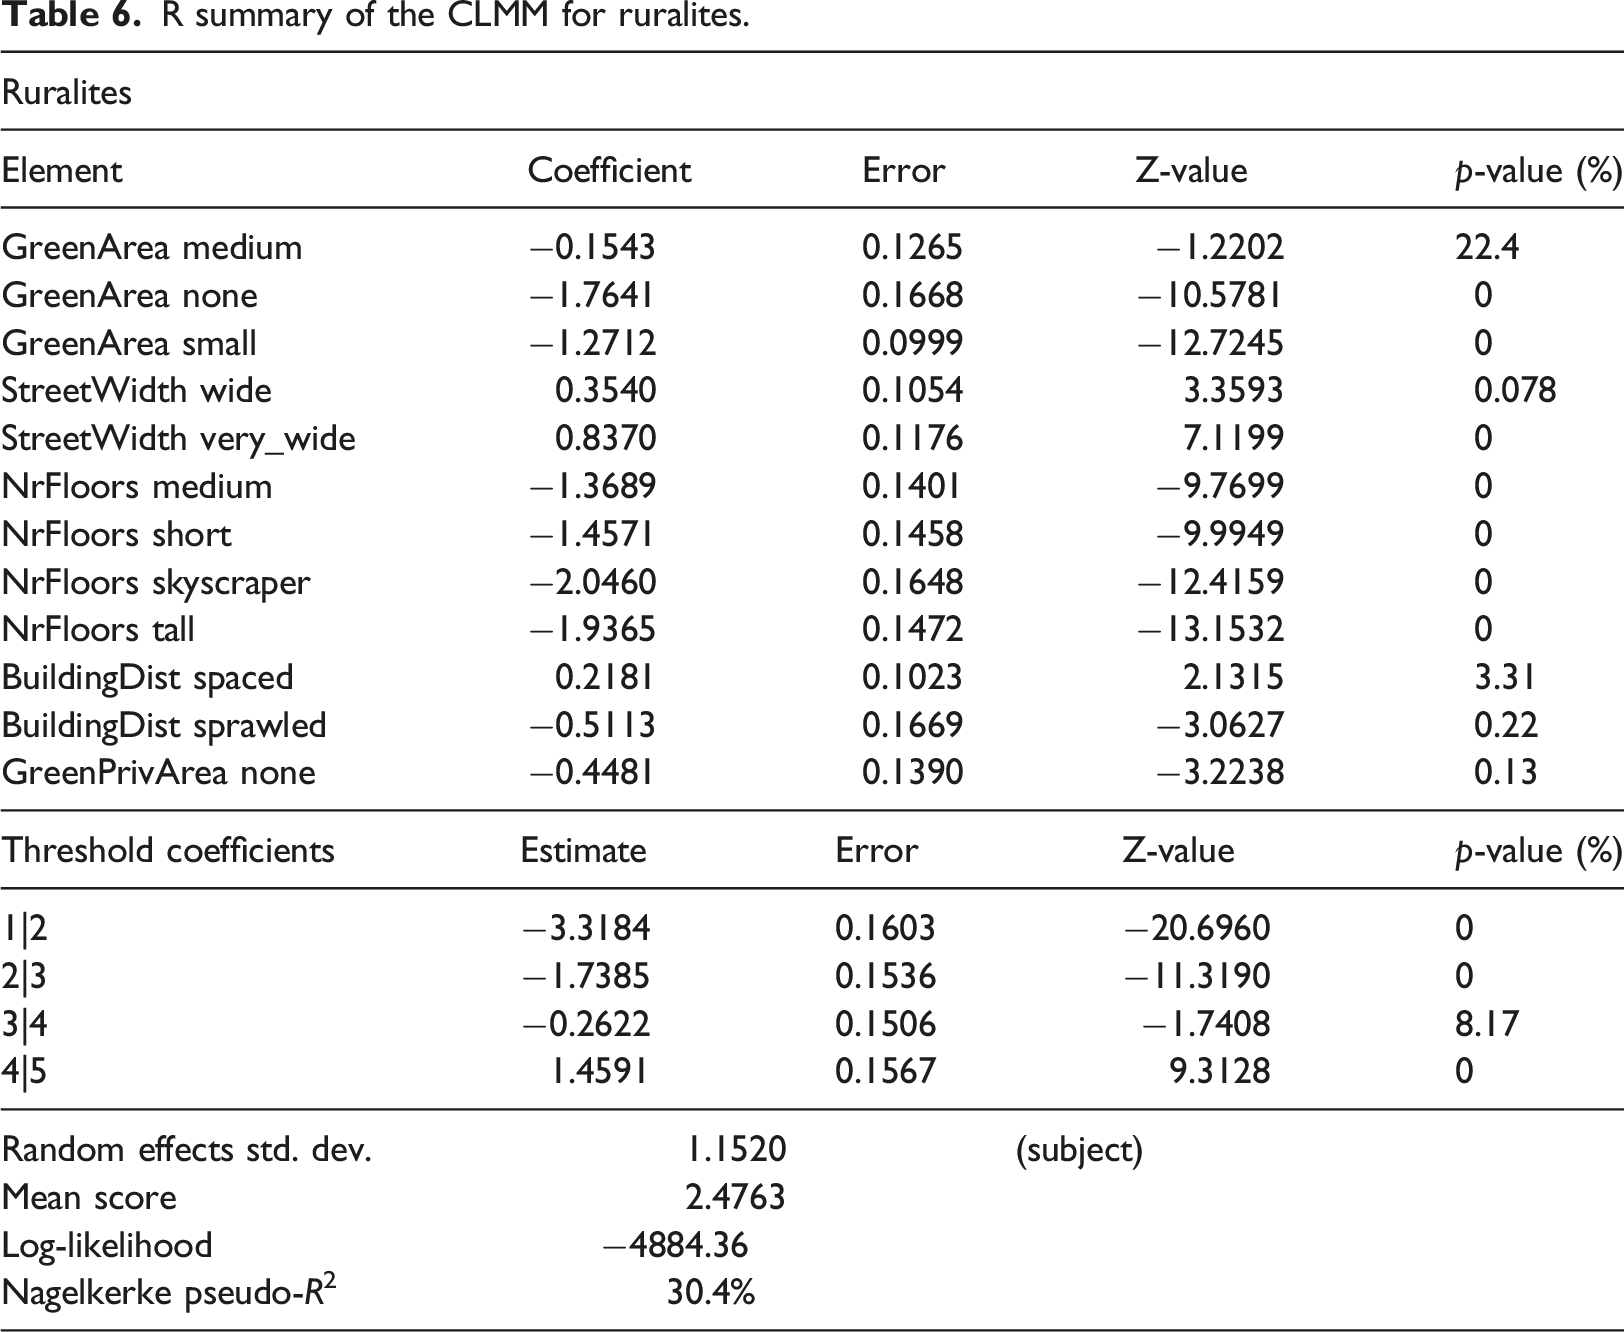
In short, people used to living in urban areas are more receptive to typical urban elements, such as higher buildings, compact real estate development or less green areas, while ruralite people apparently find it hard to accept those urban characteristics. While these analyses are in line with what might be expected given the subjects’ experiences and sociological characteristics, it is nevertheless interesting to see how pronounced the effects are and their direction.
Case study: application to the city of Coimbra
The CLMM makes it possible to analyze pleasantness on a city scale, giving urban planners and municipal authorities a better understanding of how their citizens may be perceiving the city’s layout pleasantness. The case study focuses on Coimbra, Portugal, a mid-size city with circa 100,000 inhabitants located in the center region of Portugal. Founded in the Roman age, Coimbra has over a millennium of history of occupation by different cultures who left their mark on the city’s layout. Currently, Coimbra is a typical European city, with an historical center of narrow cobblestone streets with low-rise commercial and residential buildings, modern compact neighborhoods with wide streets and tall residential and services buildings, and suburban neighborhoods consisting mainly of houses with gardens. It exhibits a variety of urban landscapes.
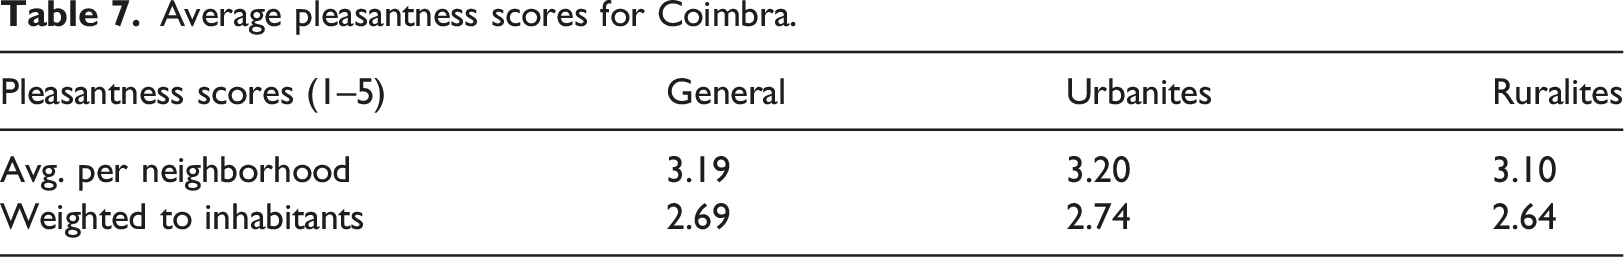
Average pleasantness scores for Coimbra.
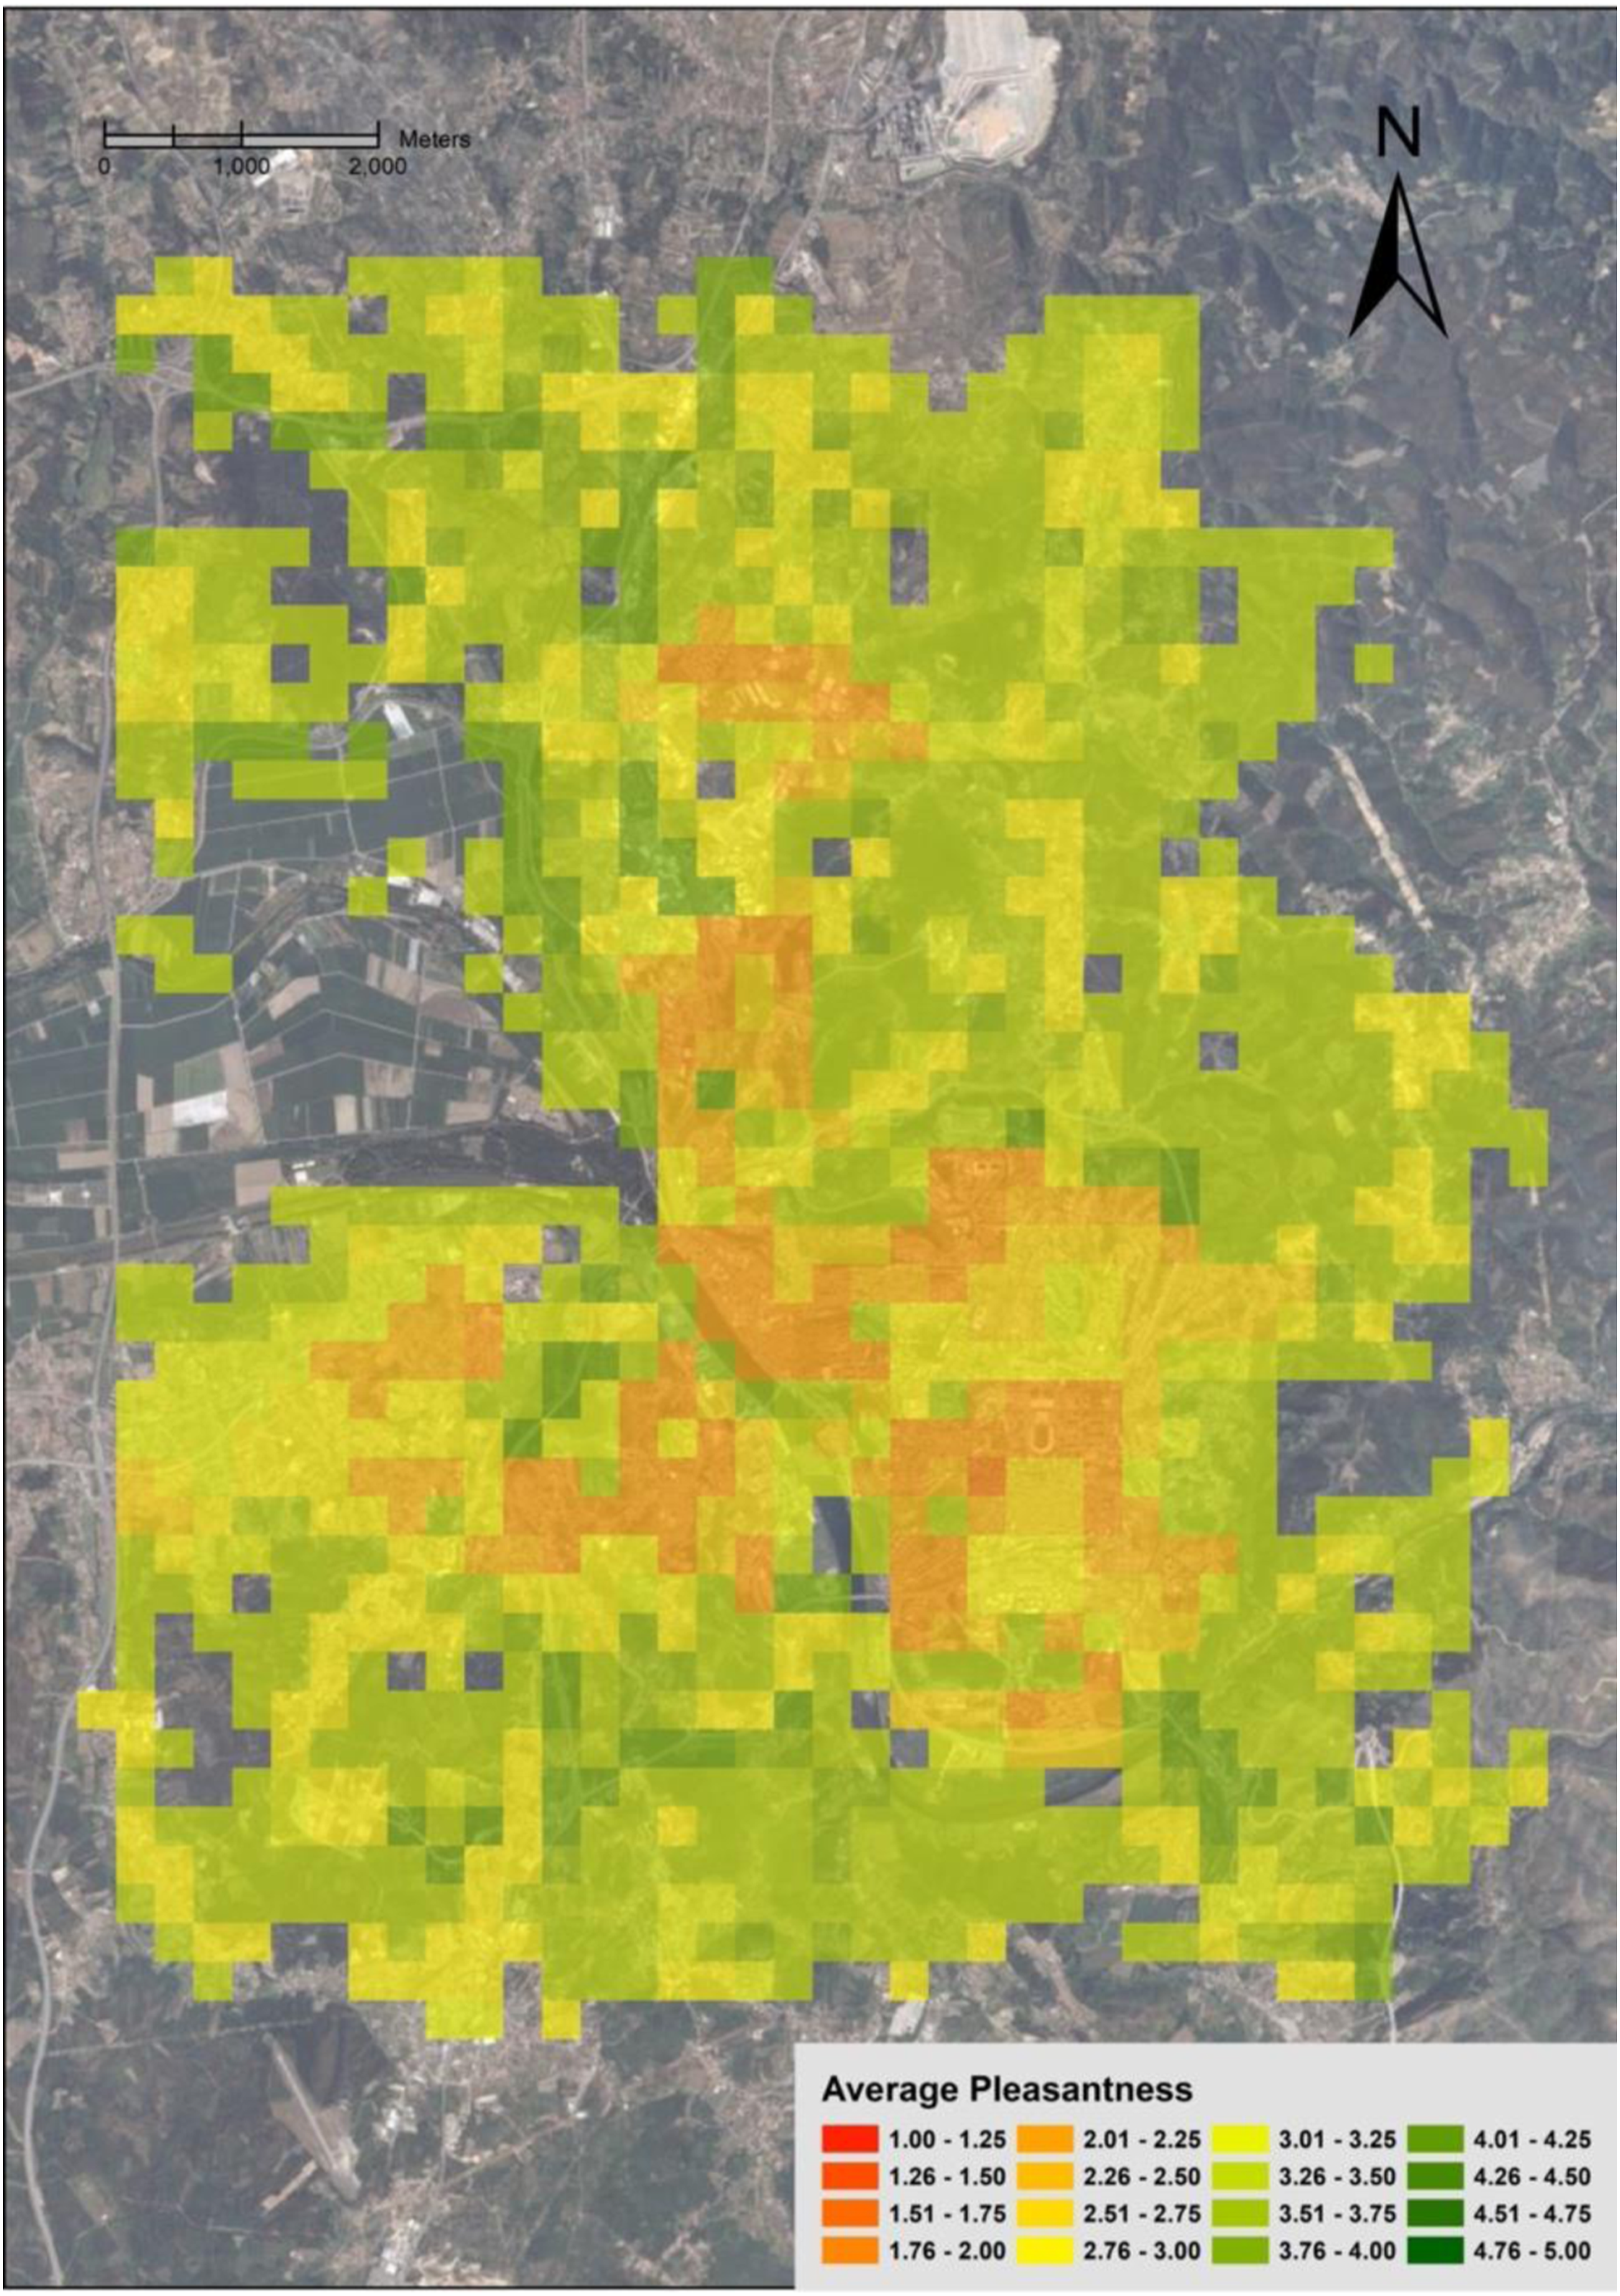
Coimbra pleasantness scores per neighborhood.
The non-weighted general average of 3.19 sits slightly above the Likert scale mid-point. However, the population-weighted average is more meaningful, and this is 2.69, below the mid-point. This is due to the less desirable neighborhoods (orange) having more people living in them, which is natural since zones of taller buildings and lower green area percentages are associated with denser urbanization and more inhabitants. Interestingly, there is close to no difference between the general, urbanite, and ruralite results, suggesting that Coimbra is viewed the same way despite the different backgrounds.
Application to planning
The CLMM methodology was constructed to estimate pleasantness in an abstract way, based on objective landscape elements that are quick to collect. It can be used to evaluate existing neighborhoods, but it can also be applied when new settlements are built, or existing ones regenerated. A city pleasantness score can be used as a standard for improvement. Municipal authorities can use it, for example, to evaluate new neighborhoods or urban regeneration projects, subsequently selecting the ones that have pleasantness scores higher than the city average or attain a certain threshold. This planning strategy provides a clear path to improving city pleasantness, with each new neighborhood or regeneration action raising the standard or guaranteeing a minimum one. A pleasantness score can also provide information to compare different cities. This can be done, for example, by applying the methodology used in Coimbra to other cities and deriving information such as that of Table 7 for the cities under scrutiny. For the private sector, real estate companies can use a pleasantness score to their advantage, by providing extra information about the surrounding areas of dwellings.
Neighborhood pleasantness is, however, far from the only criterium in urban planning. Other aspects are often taken into consideration as well, and in this respect, unpleasant elements such as, for example, tall buildings, have compensating plus-values such as better energy efficiency, accessibility, and housing availability. What this research adds is a tool to quantify the urban layout pleasantness aspects and put them on an equal footing with other aspects, such as those mentioned above, which are frequently treated by decision-makers in terms of numerical figures. The existence of quantitative scales for all evaluation criteria is the first step towards the application of multicriteria decision-making methods, which thus becomes feasible. Quality of life remains nonetheless an important benchmarking indicator to evaluate neighborhoods and cities, and in this respect, this research provides a means to quantify that benchmark.
Discussion and conclusions
This article presented a logistic regression model for estimating citizen perception of urban layout pleasantness, based on geometric and land use elements, and calibrated with data from a worldwide online survey. Results showed that it was possible to find common ground among participants, who declared statistically significant preferences for smaller buildings, plentiful green areas, wider streets, and dwellings with private backyards and close to each other. The preference for these features was also shown to be stronger for people with experience of living in rural areas, whereas people with experience of living in urban areas were more tolerant towards the lack of those features.
Most of the statistical tendencies identified in this study are in line with other findings in the literature and strengthen these by providing quantitative support. Those findings, mentioned in section CLMM for geometric and land use elements, were mostly qualitative. Recently, quantitative research surfaced which added further support for three of the tendencies found by the present article. Tall buildings and skylines can be statistically traced back to oppressive sensations for the viewer (Asgarzadeh et al., 2012) and smaller scenic beauty (Wang et al., 2021). Those authors also found that higher proportions of vegetation and the presence of trees mitigate the aforementioned negative effects. Trees were also seen by Basu et al. (2022) to contribute to a more pleasant walking experience, while Lee (2021) argued, via a structural equation model, that large urban parks contribute to urban satisfaction. D’Acci (2014) approached pleasantness from a financial perspective, having found that more green areas and wider open spaces lead to higher real estate values. The present research brings together all the above isolated evidence under a unifying statistical model and adds further explanatory variables. This model is, to the best of the authors’ knowledge, one of the first contributions to the literature on perception of urban layout pleasantness based on quantitative methods. Furthermore, it provides municipal decision-makers with an evaluation tool that can be used for planning purposes alongside other aspects of urban planning. The case study of Coimbra proved its applicability at the city scale, helping municipal authorities to better understand the impact of urbanization projects on the quality of life.
Some of the tendencies found in this research are worth exploring deeper, such as the push-pull effect of building distance, that is, people preferring homes that are not too close to each other nor too far apart, an effect that is only seen for the subset of people with life experience in rural areas. This could require rerunning the survey with more images. Another interesting line of research would be to include subjective elements in the analysis, such as, for example, building aesthetics or landscape-architectural beauty, weigh the impact of these factors on overall scores when compared to the objective geometric and land use elements, and confront the results with the recent findings on urban aesthetics mentioned in the introduction. We hope to address some of these issues in the near future.
Supplemental Material
Supplemental Material - The impact of geometric and land use elements on the perceived pleasantness of urban layouts
Supplemental Material for The impact of geometric and land use elements on the perceived pleasantness of urban layouts by Nuno Sousa, João Monteiro, Eduardo Natividade-Jesus, João Coutinho-Rodrigues in Environment and Planning B: Urban Analytics and City Science
Footnotes
Acknowledgments
Authors would like to thank Prof. M.a do Rosário Ramos (Universidade Aberta) for discussions on the statistical modeling, Prof. Vítor Rocio (Universidade Aberta) for helping with the natural language analysis, and Prof. Sandra Xavier (Universidade de Coimbra) for discussions on anthropological and sociological aspects of urban pleasantness.
Declaration of conflicting interests
The author(s) declared no potential conflicts of interest with respect to the research, authorship, and/or publication of this article.
Funding
The author(s) disclosed receipt of the following financial support for the research, authorship, and/or publication of this article: This work was supported by the Portuguese Foundation for Science and Technology under project grants UIDB/00308/2020 and PD/BD/150589/2020.
Supplemental Material
Supplemental material for this article is available online.
Author Biographies
References
Supplementary Material
Please find the following supplemental material available below.
For Open Access articles published under a Creative Commons License, all supplemental material carries the same license as the article it is associated with.
For non-Open Access articles published, all supplemental material carries a non-exclusive license, and permission requests for re-use of supplemental material or any part of supplemental material shall be sent directly to the copyright owner as specified in the copyright notice associated with the article.