
Abstract
Cities in developing countries have been struggling to deal with the pressures of urbanization on infrastructure, basic services, land, and housing that often manifest as poor living conditions found in slums and informal settlements. One of the key challenges to effectively target policy interventions and meet Sustainable Development Goals (SDGs) for improving lives of people living in slums is the lack of data on their housing condition. Furthermore, the slum/non-slum dichotomy is inadequate in identifying specific deprivations that prevents effective policymaking and implementation. To this end, we propose a methodological framework to predict multidimensional housing deprivation with slums of Dhaka, Bangladesh as our case study. Our framework predicts multidimensional housing deprivation using geospatial and remote sensing variables. Several indicators, including distance to the central business district, arterial roads, major road junctions, railroads, average dwelling size, and street type within slums were related to increased risk of overall deprivation whereas proximity to heavy industry and shoreline, building density, informal street pattern, the low-level connectivity and proximity to social amenities were related to lower risk of housing deprivation. The results from the statistical models indicate their potential to predict the extent and type of housing deprivation, which could in turn support planning and policy interventions for achieving SDGs for the most vulnerable populations in slums of developing countries.
Introduction
One in three urban residents live in slums globally, which are characterized by poor housing quality, lack of basic services and secured tenure. A key challenge in designing effective slum policies is the lack of reliable and updated data. International development agencies as well as national and municipal governments rarely have access to up-to-date, reliable information on the number and characteristics of slums (Lucci et al., 2018), which makes it difficult for them to formulate effective interventions, programs, and policies. For example, Briggs (2018) showed that aid from the World Bank and the African Development Bank did not accurately target the poorest populations across Africa and went to the relatively affluent areas. It is, therefore, critical to identify the most deprived populations in a reliable and timely manner in resource scarce settings such as those found in the slums of developing countries.
This paper develops one such approach to identify, prioritize, and target deprived slums for effective and equitable policy interventions. The traditional source of information on slums is either resource intensive surveys or population Censuses that tend to be at lower frequency and often conducted irregularaly in developing countries. To complement these sources, we build on the potential of very-high resolution (VHR) as well as open-source Earth Observation (EO) data to predict various housing conditions in slums, namely, access to water, sanitation, electricity, permanent structure, tenure security, and adequate living space.
The structure of the paper is as follows: first we review empirical applications of slum mapping and situates this study at the intersection of the theory and epistemology of housing deprivation. Next, we describe the case study, data, measurements, and the analytic methods, followed by the results of the regression analyses. Finally, we discuss the significance of this work in the context of the science of slum mapping as well as for slum policies in the global South and conclude with a brief summary and directions for future research.
Literature review
Remote sensing (RS) and satellite imagery have been considered important sources of information to understand and analyze the ecological aspects of urbanization (Nichol and Wong, 2006; Pham et al., 2011; Rajasekar and Weng, 2009; Rashed et al., 2001; Weber and Hirsch, 1991). VHR satellite images have also been used to identify pockets of urban poverty in several cities around the world (Emmanuel, 1997; Jenerette et al., 2007; Kit et al., 2012). Importantly, Lo (1997), Li and Weng (2007), and Weeks et al. (2007), among others, have extracted environmental characteristics such as vegetation cover, impervious surfaces, and the amount of bare soil from satellite images and showed that these Land Use/Land Cover (LULC) features could predict socio-economic conditions of residential areas that were traditionally collected with surveys and censuses. These relationships are grounded in the reasonable assumption that the physical conditions of the lived environment are good indicators of the socio-economic characteristics of the residents of that settlement. This is not to suggest that remotely sensed data, as an empirical tool to estimate poverty, obviates the need for field-based methods such as surveys and censuses. Rather, VHR imagery can provide quicker identification of areas that are deficient in urban infrastructure and services and can aid in the estimation of urban growth (e.g. mapping population growth and changes in LULC) and future demand for public services without the delays associated with time-intensive ground surveys and infrequently and irregularly administered censuses.
More relevant still, researchers have identified and delineated slums and informal settlements within those urban areas using RS data. For example, Rhinane et al. (2011) used an object-oriented classification approach to map slums in Casablanca, Morocco with an accuracy of 85%. Several RS approaches have also been utilized to obtain up-to-date and quick information on the location and growth of slums. Kit et al. (2012) proposed using a lacunarity method to extract slum pockets from QuickBird satellite images for the case of Hyderabad, India. RS can also play a key role in analyzing space-time dynamics such as monitoring densification and expansion of settlements or assisting with the implementation of slum improvement policies (Patino and Duque, 2013). Kuffer et al. (2016) have provided a comprehensive review of these and other RS based slum-mapping studies over the period of 2000–2015 and emphasized the need for exploring the systematic relationship between image elements and slum characteristics observed on the ground.
There has been number of studies focusing on morphological aspects of slums, that is, identifying, and delineating slum boundaries within urban areas. For example, Duque et al. (2017) developed a machine learning approach for the automatic identification of slums from VHR imagery in three cities of Latin America; Kuffer et al. (2016) analyzed VHR imagery to not only identify slums but also to capture the diversity of slum types in Mumbai; Mboga et al. (2017) used neural networks to identify slums in Dar es Salaam; Wurm et al. (2017) used a random forest classifier to map slums in Mumbai; Leonita et al. (2018) used Machine Learning methods to identify slums in Bandung City; Prabhu and Raja (2018) used feature extraction techniques to map slums in Madurai; Pratomo et al. (2018) showed the temporal dynamics of slums in Jakarta using RS data from multiple time periods; Taubenböck, Kraff, and Wurm (2018) provided evidence from 44 cities to show that slums have similar physical features and open the possibility of universal models for slum identification. A review of studies that use VHR for slum mapping has also been undertaken by Mahabir et al. (2018). More recently, slum-mapping studies have focused on methodological advancements to develop models with increasing accuracy. For example, Stark et al. (2019) and Wurm et al. (2019) have explored the potential of fully convolutional neural networks, Stark et al. (2020) developed a transfer-learned fully convolutional exception network while Fisher et al. (2022) developed a convolutional deep learning model. However, these studies have focused on the morphological and geographic aspects of slum identification and delineation, but they have not considered living conditions of the people living in those slums.
Importantly, Duque et al. (2015) and Hofmann (2001) have argued that poverty measures such as individual level income and consumption require a heavy investment in time and money to conduct large-scale surveys; hence, there is a need to devise alternative methods. There is growing interest among researchers to devise methods for time- and cost-efficient estimation of social and spatial indicators such as the extent of poverty and locations of the hotspots of deprivation to facilitate targeted investments by practitioners and policymakers. To this end, only a handful of studies have attempted to predict outcome indicators obtained from a pre-existing census or survey as a function of variables derived from RS (Duque et al., 2015; Stoler et al., 2012; Taubenböck and Kraff, 2014). Taubenböck and Kraff (2014) delineated and defined slum areas using remotely sensed data while Duque et al. (2015) and Stoler et al. (2012) modeled a Slum Index (computed from survey and census data, respectively) that measures various degrees of household deprivation in slums. Our study builds on these works and contributes to this growing field by developing a model that could be used to predict various housing deprivations within slums.
Specifically builds on the pioneering work by Duque et al. (2015), which explores the potential of RS imagery to measure variability in poverty within a city by predicting multiple deprivations using a value-focused slum index. Similar to Duque et al.’s approach, here we use EO data on urban land use and land cover to estimate multidimensional housing deprivation. In an important departure, we predict multiple types of deprivation using household level data. We utilize the Slum Severity Index (SSI) developed by Patel et al. (2014, 2019, 2020) that measures multidimensional deprivation scores. The SSI aggregates the five measures of housing deprivation that are used to define a slum and are proposed by the UN-HABITAT (2010). These five measures include lack of access to adequate water, sanitation, tenure security, durable housing structure, and sufficient living space. In this study, we add a sixth variable of deprivation—access to electricity—to the original SSI for a more comprehensive measurement of housing deprivation. Second, in addition to the RS indicators, we incorporate geospatial variables such as distance to commercial centers, major road junctions, and social amenities to predict multiple housing deprivation. Thus, the purpose of this study is not only to identify a set of spatial variables for image-based identification of various types of housing deprivation within slum areas but also to contribute to a global inventory of slum indicators and extraction methods for slum mapping (Kuffer et al., 2016: 5) that in turn, can facilitate knowledge-sharing among scholars and policymakers for targeted policy interventions for achieving the SDGs, in particular SDG 11, which aims to make cities and settlements inclusive.
Location variables like distance to a central business district (CBD) or zones of industrial activity have been found to be good predictors of average housing values in a neighborhood. Hence, we expect that proximity to the CBD, major transit nodes, paved roads, and social amenities like schools and hospitals will be likely predictors of better housing conditions. Following Patino and Duque (2013: 7) advice on incorporating RS variables in slum detection that are broadly applicable to slums worldwide, we used OpenStreetMap (OSM) to map road networks. We created several indicators that characterize the nature of road networks including a winding index, the typology of the road network, the distance to paved roads, and the connectivity of the road network to transit nodes and social amenities (Hofmann., 2001; Siluzas and Kuffer, 2008). A high winding index reflects informal street patterns that are likely to be associated with poor living conditions especially due to lack of piped networks for water and sanitation that are typically found along planned streets.
Other physical attributes of the neighborhood’s structure included in this study are built-up homogeneity and density, density of continuous residential urban fabric, and the presence of water bodies and green space (Barros and Sobreira, 2008; Taubenböck et al., 2018). Based on these studies, higher density is expected to be correlated with deprivation while the lower built-up homogeneity in size and materials is less likely to have deprivation. We also expect that the presence of green space within slums will be associated with lower deprivation, and the presence of water bodies within slums will be associated with greater deprivation. This combination of internal and external characteristics of a neighborhood to identify slums and predict the variability of deprivation among them allows us to address some of the challenges highlighted by Kohli et al. (2012) in relying solely on building density measures for mapping slums and predicting deprivation. In addition to these pre-tested variables, we also consider that mean dwelling size, dwelling separation, and estimated dwelling height and age might relate to housing deprivation. We expect that mean dwelling size and the mean distance between two dwellings can help us predict the overcrowding indicator.
Data and methods
This section provides a brief overview of Dhaka, our case study city, a description of the datasets and indicators, and analytical strategies. We used two types of data: household survey data and EO data, which form the dependent and independent variables, respectively, for the regression models. We describe both data followed by a discussion of the analytical methods.
Case study
We developed our models for Dhaka Metropolitan Area in Bangladesh as our case study. Dhaka represents an example of a large city in a developing country that is characterized by rapid population growth and high concentrations of poverty in their slums (Ahmed, 2014; Banks et al., 2011). According to the most recent slum census by the Bangladesh Bureau of Statistics (BBS), over 70% of the country’s urban poor resides in the slums of Dhaka, with inadequate access to water, sanitation, and adequate living space (BBS, 2015). The availability of two relevant data sources that are critical to developing our model—the Bangladesh Urban Informal Settlements Baseline (BUISB) survey and Very-High Resolution multi-spectral satellite images of the metropolitan area—was another consideration in selecting our case study city.
BUISB household survey data
We used the BUISB household survey conducted by the World Bank Group in May of 2016 as our primary source of information on household level deprivation to test how accurately remotely sensed EO and open-source GIS data could predict these deprivations. The survey collected data on housing conditions from 600 slum households in 63 slum communities of Dhaka (Figure 1). Sampled slum communities (shown in orange) in Dhaka, Bangladesh.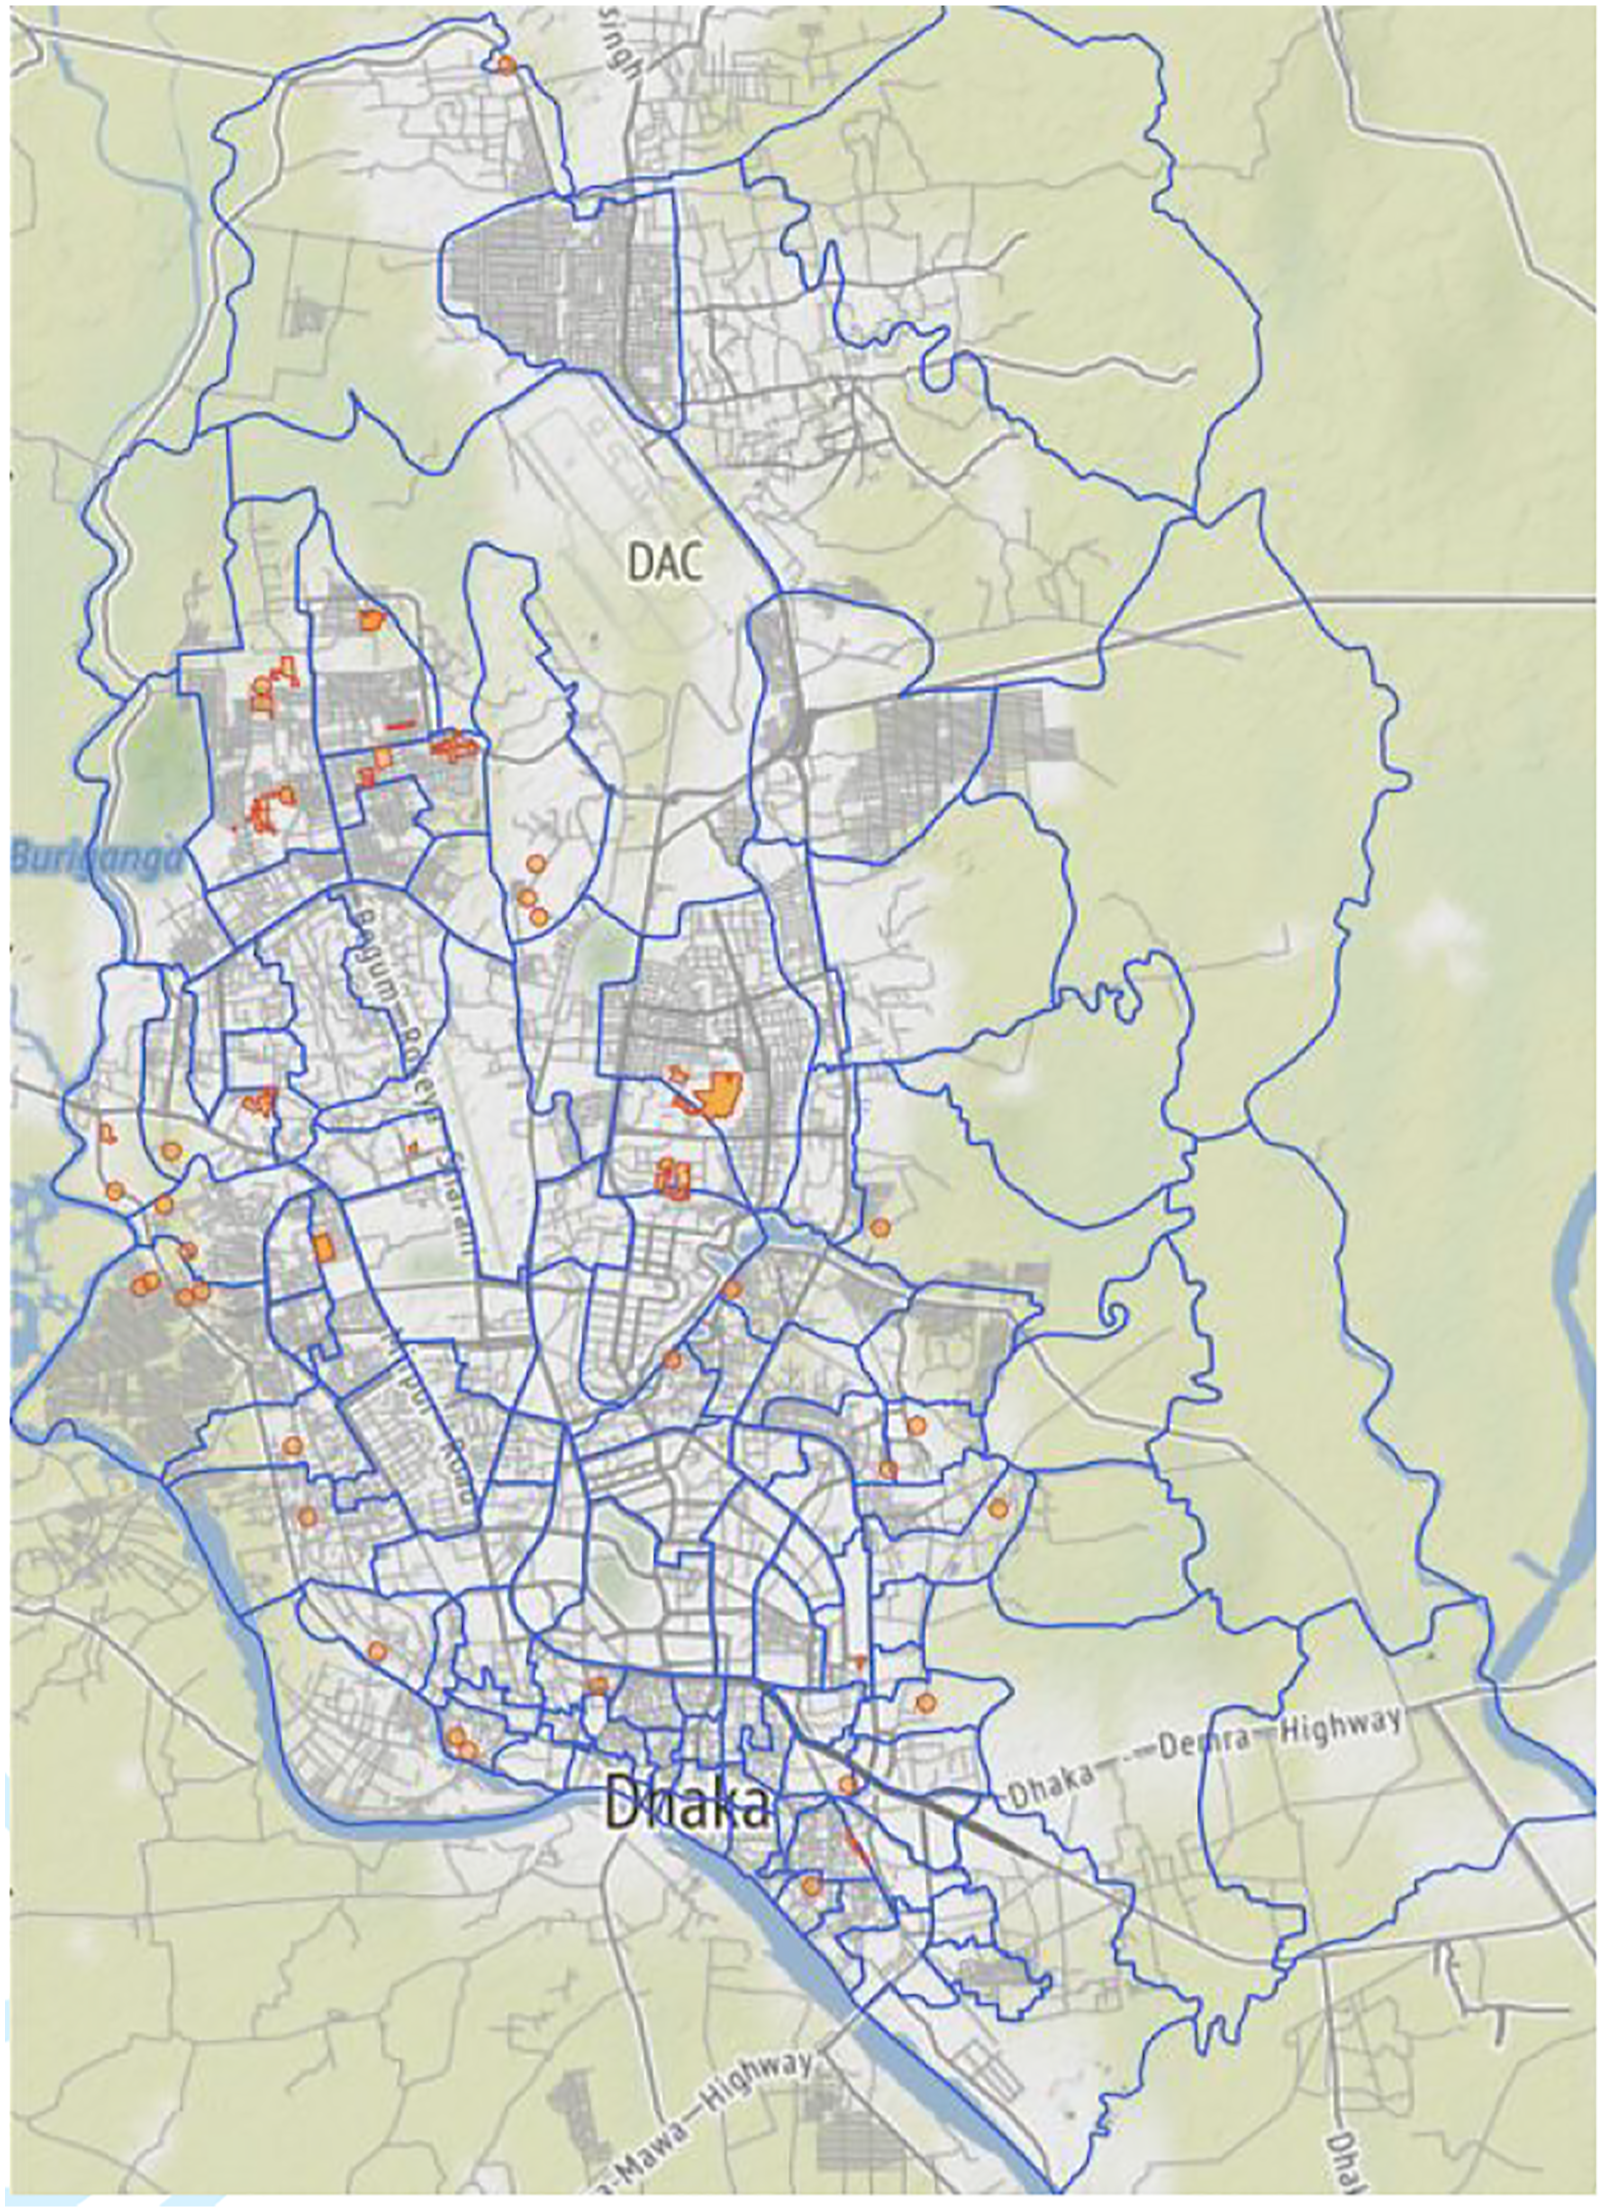
Sampling frame and sample size for the BUISB household survey.
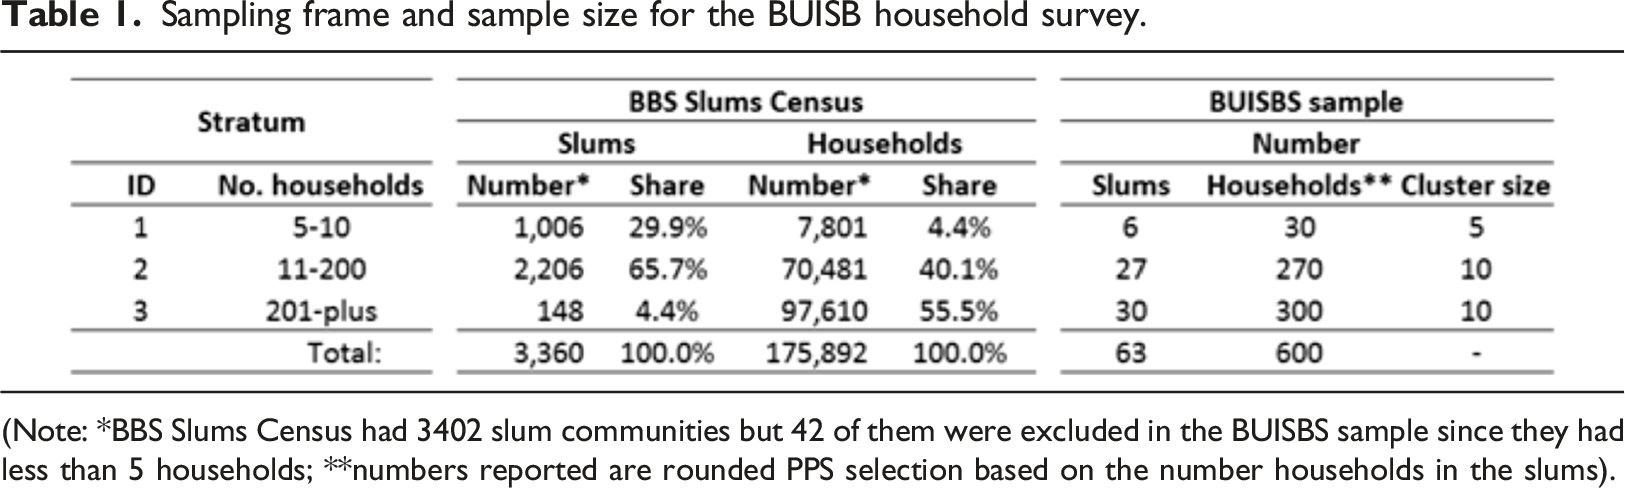
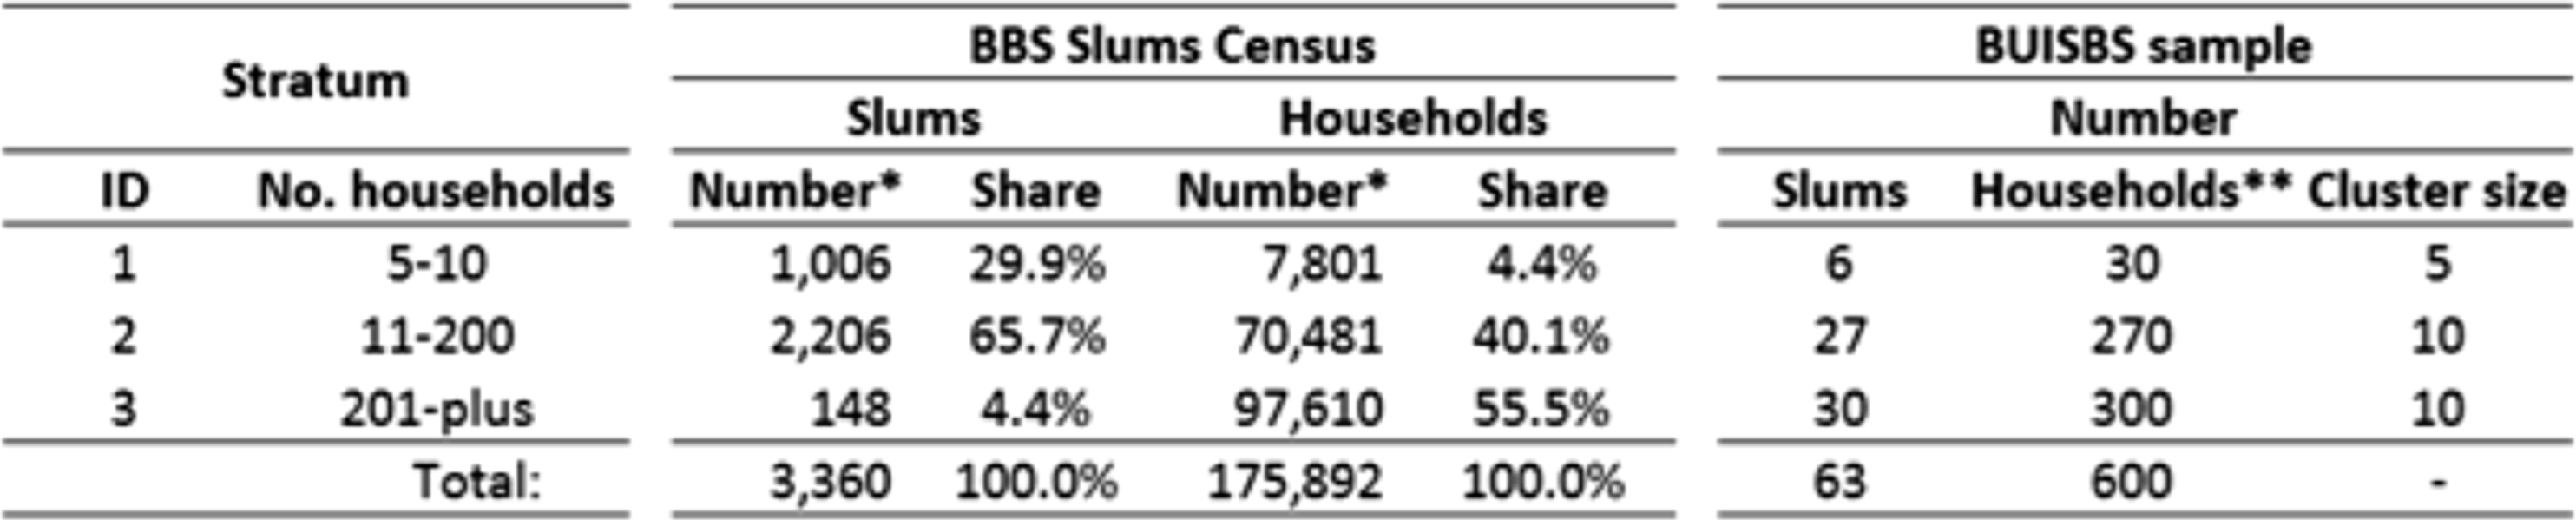
(Note: *BBS Slums Census had 3402 slum communities but 42 of them were excluded in the BUISBS sample since they had less than 5 households; **numbers reported are rounded PPS selection based on the number households in the slums).
The data were collected over a period of 16 days between May 12 and 28 May 2016, with 30 teams of two interviewers each, and the survey administered to 600 slum households yielded a response rate of 98%. The final study sample was comprised of 588 slum households: 30 from small slums, 259 from medium slums, and 299 from large slums.
EO and OSM data
The spatial features of these specific slum settlements were obtained from EO and OSM on a semi-automated basis and comprised the independent variables for the regression model in this study. Since the original household survey did not include the geographic locations of the individual households, the central location of the slum was captured in June of 2017 with a handheld GPS device by the survey team. The initial identification and delineation of slum boundaries were created with VHR satellite images of Quickbird from 2006 and verified with the historical datasets available at Columbia University (see Gruebner et al., 2014). These slum boundaries were used with VHR images of Pleiades from 2017 (with pixel spacing in the range of 0.5–0.6 m) for developing the RS indicators.
Dependent variables
Six binary variables from the BUISB household survey were used as measures of deprivation: (i) access to drinking water, (ii) access to sanitation, (iii) adequate living space, (iv) permanent structure, (v) tenure security, and (vi) access to electricity. All the individual outcome variables were negatively coded and dichotomized: 1 for lack of access and 0 otherwise. The dependent variables were comprised of these six individual deprivation indicators as well as the composite SSI that aggregates all six of them into a single index. The original SSI is an aggregate measure of housing deprivation across five aspects of housing as proposed by the UN-Habitat (2010) definition of slums. In this paper, we added access to electricity as the sixth housing dimension. The SSI ranges from 0 to 6: a score of 0 indicates the household is not deprived on any of the measures described above, and a score of 6 indicates the household is deprived on all six measures.
Independent variables
The set of independent variables was comprised of three types of neighborhood-level variables and two types of settlement-level variables. A complete list of EO and GIS-based indicators are presented in the Supplementary Material (S1). Polygon-based indicators (e.g. average distance between dwellings) are delineated as ring buffers at 300m from the slum centroid. There are seven indicators of neighborhood location in the dataset that were obtained from OSM and LULC features from EO data and were analyzed using GIS proximity analysis.
Four indicators of the slum’s internal characteristics (density) in the dataset are built-up area, mean dwelling size, mean dwelling separation, and built-up homogeneity, and were identified by RS image analysis. Built-up area was calculated based on the LULC classification derived from the EO imagery for the entire neighborhood block. Mean dwelling size was calculated as the average of the area of all/house objects within the built-up block, the mean dwelling separation was calculated as the average distance between centroids of the dwellings for a given neighborhood, and the built-up homogeneity captured the overall similarity of shape and characteristics between dwellings in a neighborhood. Three indicators of neighborhood connectivity were also included in the dataset: distance to the nearest hospital, place of worship, and school/university.
Four indicators of LULC structures in slum surroundings were calculated and delineated by 300m buffers from the slum centroid: (i) high-density continuous urban residential fabric; (ii) continuous commercial and non-residential urban fabric; (iii) density of urban green space; and (iv) water bodies. These features were calculated as proportions. We expect greater residential and non-residential density to be associated with lower slum deprivation because these developed areas are more likely to have pre-existing services infrastructure. On the other hand, a greater proportion of green space and water bodies within a neighborhood are expected to be associated with greater slum deprivation because of the absence of, or difficulty in installing, infrastructure in/around these areas.
Finally, we used OSM to extract four indicators of street patterns within slums. The first indicator is a count of the total number of nodes (road junctions). For the second indicator, we used a weighted measure of junction nodes for road networks to determine the connectedness of slum settlements to the surroundings. Weights were calculated for each junction node as the sum of all connected roads/street segments, with the expectation that greater connectivity to the surroundings will be associated with lower deprivation due to spillover of essential public services from the larger neighborhood. The third indicator is the structure of the road network typology, which is calculated as the length of roads proportional to the total length of roads in that same category (e.g. informal streets, highway, primary/secondary/tertiary roads). Here, we expected that the greater the percentage of informal streets, the greater will be the deprivation. Finally, we include a fourth indicator, the winding index, where straight road segments have a value of 0 and crooked roads have a value of 1. The index was calculated from the line shape as a ratio of the width to the length of the road segment’s bounding box.
Analytic methods
Slum level models were created using dependent variables aggregated from household observations within each slum. Since aggregate measures can be treated as count variables (e.g. the total number of households lacking a housing element in a slum), Poisson regression was used. Only in the case of overcrowding, assumptions for Poisson regression did not hold and hence an Ordinary Least Square (OLS) regression model was constructed using the percent of overcrowded households as an outcome measure. There are seven models in total (six for each of the measures of deprivation in housing and basic services, and the seventh for the aggregate SSI); six of them used Poisson regression and one of them (overcrowding) used OLS regression.
Equation (1) presents a generic equation for all six Poisson regression models
Equation (2) presents the equation for the OLS regression model
Explanatory variables were selected using the standard stepwise regression procedure that involved selecting the variables that minimize the model’s Akaike Information Criterion (AIC). Overdispersion in count data was verified and the likelihood ratio test of alpha was used to check if the Poisson regression was appropriate, or the negative binomial regression should be considered to tackle potential overdispersion. In all six cases, Poisson regression was appropriate.
Analysis and results
Descriptive statistics
The BUISB household survey reveals that a typical slum household has 4.3 members, household heads are on average 39 years old and have been living in the slum for around 8.6 years, suggesting that deprived living conditions for a typical family are not short-term. Overcrowding, poor housing conditions, and fear of eviction are salient features of lives in slums. One room is normally shared by three people and rooms are on average 12 square meters in area. Housing structures are either temporary, largely constructed using low quality materials including tin-sheds (59% of housing structures) or semi-permanent (29% of housing structures). Only 12% of the housing units are constructed with permanent construction materials. Over half of the slum households reported living under fear of eviction. About 70% of slum residents were renters.
Types of housing deprivation in Dhaka slums in 2016 according to the BUISBS.
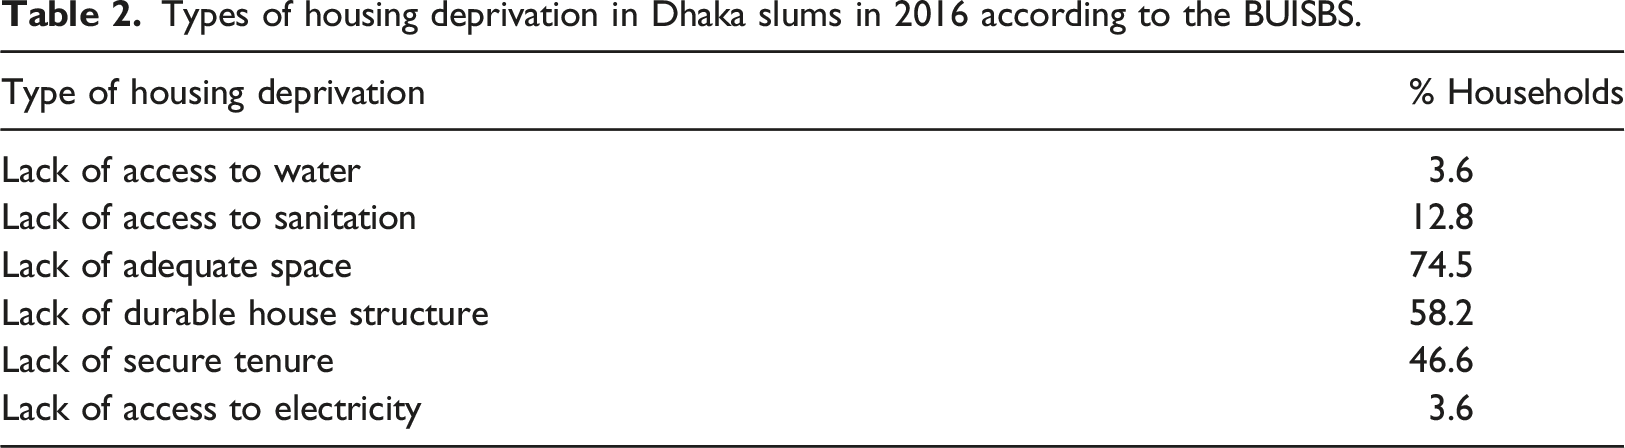
Analysis of the aggregate SSI indicates that while no households in the surveyed sample lack all six elements of housing and basic services, one quarter are deprived in three or more areas. Interestingly, seven percent of households are not deprived of any of the six elements despite being in a slum neighborhood.
Regression results
Summary of the multivariate regression results for deprivation measures as a function of RS and spatial indicators.
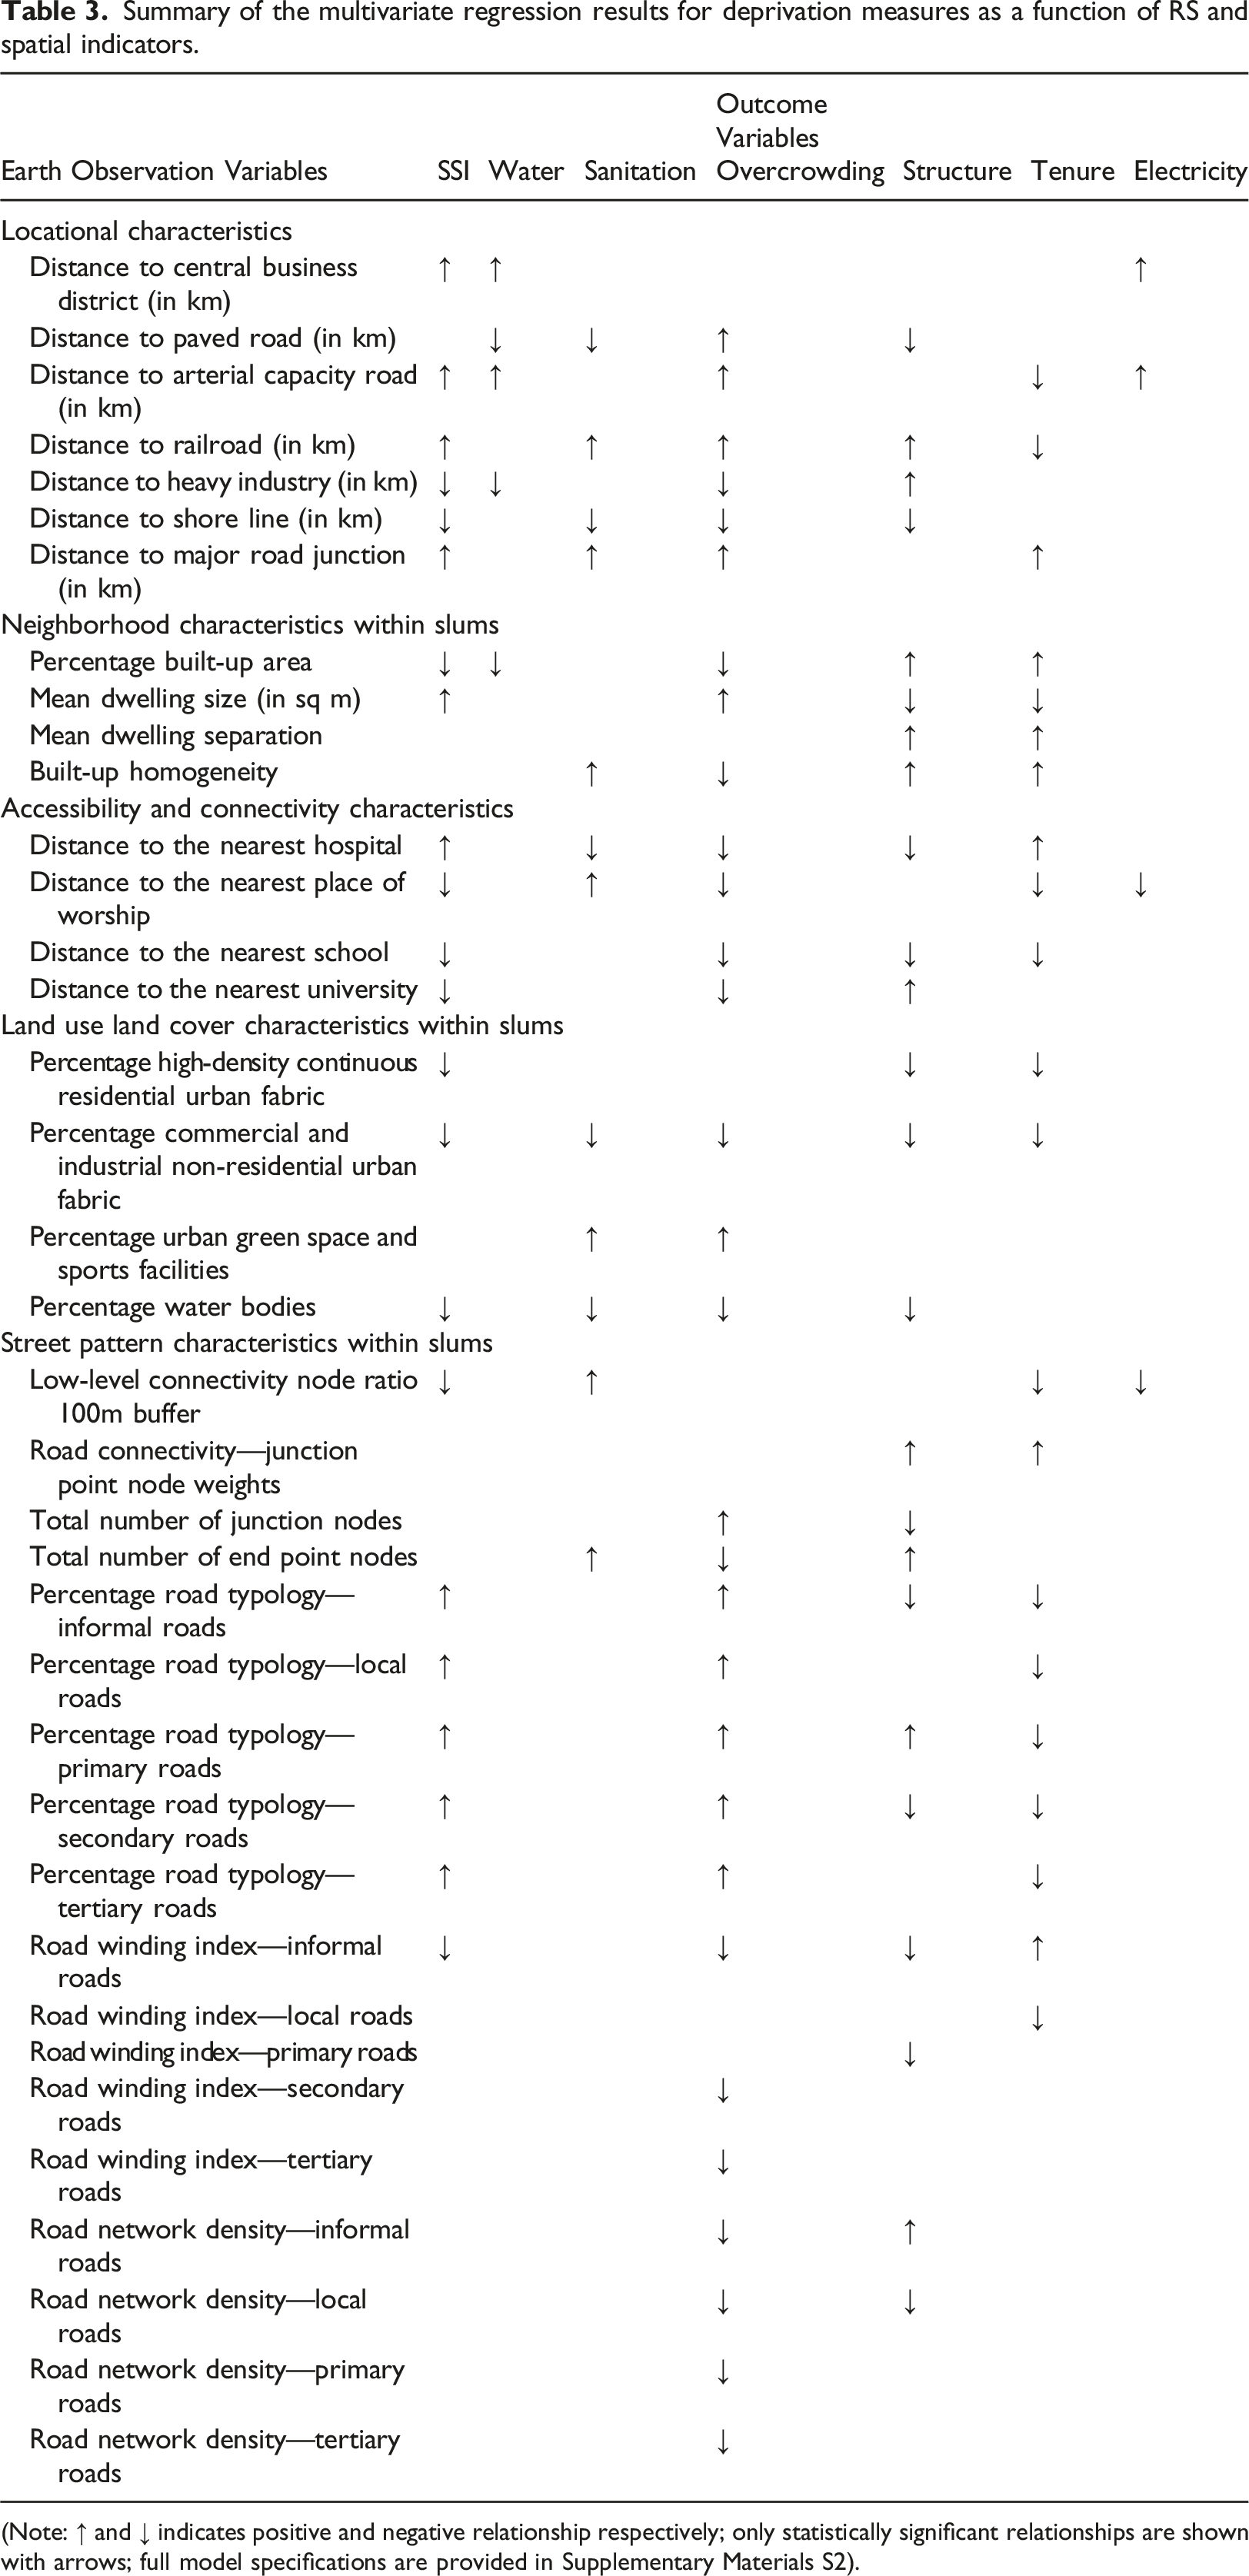
(Note:
Multiple locational characteristics of slums derived from EO data were statistically significant predictors of housing and basic services deprivation. Of note is the distance to the CBD. With increasing distance, slums were more likely to be deprived of water and electricity, whereas it had no association with sanitation, overcrowding, or structure. Except for sanitation, this finding concurs with what is generally referred to as peripheralization of slums, indicating decreasing access to services as new slums form in the peripheries of a city where municipal services are not yet developed.
Another interesting set of indicators was related to proximity to transportation networks and employment opportunities. Generally, deprivation was lower for slums close to roads. Those that were closer to arterial roads had access to water and electricity. For slums farther away from railroads or major road junctions, probability of housing deprivation increased. Proximity to heavy industry also resulted in higher housing and services deprivation indicating a potential trade-off between residing near a workplace at the cost of lower quality housing, a phenomenon that is generally observed for labor migrants working in such industries.
All indicators of density were associated with an increase in housing and basic services deprivation. Average dwelling size and average distance between two dwellings essentially measure housing density. In addition, the percentage of built-up area in any slum neighborhood is another direct measure of overall density. Effectively, the more crowded the slums were, the more deprived they were. This is not surprising since residential density is often a signature manifestation of living conditions in slums.
Distance to social amenities such as schools, universities, hospitals, and places of worship could be important predictors of housing conditions. We expected that proximity to social amenities is a desirable characteristic and hence it might be associated with improved housing conditions, yet the results were mixed. As the distance from amenities increased, some housing conditions improved while others worsened.
Various land use and land cover characteristics were significant predictors of housing and service deprivations in expected directions. For example, as the percentage of high-density residential urban fabric increased for a slum, housing deprivation decreased. Similarly, commercial, and industrial land use and the percentage of water bodies also reduced housing and basic service deprivation. Finally, housing deprivation also decreased with an increasing percentage of green space.
Several measures of street patterns within slums were associated with housing and basic services deprivation. As expected, higher percentages of informal roads and winding roads were associated with higher service deprivations. Slums with road networks that had lower-level accessibility were also more deprived in terms of services. There were some mixed results in this category that may require further investigation with larger datasets.
Discussion
As discussed in the literature review section, accurately identifying, and delineating slums as geographic and morphological features in cities have been the subject of research in the last two decades or so. This focus on slum mapping is very useful for place-based slum policies but they cannot support household-based policy interventions such as aiding a family for constructing a toilet. Similarly, geographically identifying a slum does not automatically lead to an actionable planning intervention because such delineation does not provide any information on the type of housing deprivation experienced by people living in them. In place-based identification approaches, a slum without access to water and a slum without access to sanitation are not differentiated. Since planners cannot “un-slum” a place but they can provide access to water or sanitation, it is important that the science of slum mapping considers predicting household living conditions rather than only mapping a slum as a place.
This paper has shown one way of using RS and GIS data to predict such deprivation as experienced by people living in slums. As Kuffer et al. (2016) have argued, combining “image-based information with socio economic characteristics may ultimately lead to a better targeting of pro-poor policy interventions” (p. 474). To this end, policy makers and city planners need the appropriate tools and evidence to provide basic services in constantly changing environments of urban settings, especially in slums. Current planning and policy approaches rely on household surveys to estimate demand for urban services such as water and sanitation. However, these surveys are often expensive and time-consuming. Consequently, they are not conducted on a regular basis. On the other hand, resolution, availability, and affordability of EO data have improved drastically in the last two decades. Our framework thus provides a pathway to estimate demands for urban services by leveraging such readily available EO data. Since EO data are available at a much higher frequency than population censuses, our approach could provide near real-time estimates that could be especially useful given that slums in the developing world are rapidly growing and living conditions are constantly changing. It should be noted that while the technology is making such data increasingly affordable, they may still be expensive for local governments. However, international development agencies could include access to EO data as part of their technical and financial assistance to cities in developing countries. Initiatives such as Earth Observation for Sustainable Development Goals (https://eo4sdg.org/) are steps in this direction.
For national governments, this methodology provides an efficient and cost-effective way to estimate various types of housing deprivation and demand for urban services nationwide. Given that RS images could be available for all the cities in a nation at once, there is far less time lag between data acquisition and their use in decision-making than traditional survey-based methods of data collection and analysis that could take multiple years to cover all the cities. Additionally, due to the growing availability of technologies like OpenStreetMap that allow residents to contribute data, geospatial analysis can also take place in real-time using updated information from the community. International development organizations, likewise, can also use EO-based approach to inform both national and global interventions by estimating global housing deprivation in real-time without conducting large-scale surveys.
Additionally, although this study covered a single city, Dhaka, the approach could be adapted and tested for its universality in future studies since similar surveys are routinely collected around the world and remote sensing data are increasingly becoming available for cities. While a survey alone cannot support citywide program implementation, this approach provides a framework that could also be applied to predict citywide deprivation once a model is constructed. Decision-making should neither be driven by data availability nor by statistical techniques. It is important to first develop a clear model. Data on deprivation could be collected and statistical techniques applied only after a clear model is established. To this end, this study contributes to the development of such a model in the context of measuring housing and basic services deprivation from space, which could also precede data collection on deprivation at the household level with surveys and censuses in any city where slums are prevalent.
While the results presented here are promising, there are several limitations that are worth noting. Most of these arose from the lack of an enhanced dataset limiting the benefits that could be derived from the proposed framework. We note four limitations. First, while the original sample was a sizeable 588 households, location data were only available at the slum level, which reduced the aggregated sample to 63 slums. Future research should collect household level locational data combined with housing conditions to predict household level deprivations.
Second, only five to ten households had been surveyed in each slum and as a result, aggregate measures (e.g. percentage of households with water deprivation) suffered from generalizations because of the small sample size within a slum. As a result of the aggregation and subsequent smaller sample size, Poisson regression was employed. However, any regression specification that is meant for count data such as Poisson regression requires a much larger sample size. While the results may not be inaccurate with a sample size of 63, they will be much more robust with a sample size greater than 100. Ideally, a sample size over 500 is desirable for Poisson regressions.
Third, the actual deprivation indicated in our models may be underrepresented owing to narrow definitions and inherent assumptions used when measuring deprivation. The UN-Habitat (2010) definition of slums is conservative in the sense that it underestimates the deprivation of slum households. This is primarily because the definition is restricted to the physical and legal characteristics of slums and eschews the social dimensions (e.g. concentrated poverty) that are often difficult to measure (Davis, 2006). Nonetheless, we can expect that the underestimation is partially corrected as physical deprivation is highly correlated to social and economic marginalization (Arimah, 2001; Begum and Moinuddin, 2010). In addition, when a slum dweller responds “yes” to a water availability question, it may not accurately capture access to water since the question does not focus on quantity or quality of water, or time spent collecting water, for example.
Fourth, we did not analyze the impact of incremental and vertical growth on slum deprivation in detail. Some slums (especially in Eastern Dhaka and Southern Dhaka near the river) underwent transformation from homogeneous low-rise structures to a mix of low-rise and high-rise structures (visible differences between 2006 and 2017 images). For example, a substantial proportion of multi-story high-rise buildings were built within the original slum neighborhoods in a scattered, spatially inconsistent, and organic manner between 2006 and 2017. Rather than reflecting a change in soil sealing (imperviousness) or structural patterns (which could be reflected by standard variables derived from optical EO data), this process is attributed to a change in 3D. Our framework does not fully reflect this internal process in slum areas.
Despite these limitations, our paper demonstrates that indicators derived from EO data could predict multiple housing deprivation (e.g. multidimensional SSI) as well as the individual deprivation indicator (e.g. water and sanitation). This promising approach could provide useful insights for planning and policymaking when ground level surveys are not possible.
Conclusions
In an era of increasing urbanization, this study, and the use of EO data for exploring housing deprivation, has relevance and life-changing implications for residents of slums and informal settlements. Given that it has been traditionally challenging to chart even the location and growth of slums due to their transient nature, our suggested method could greatly increase the efficiency in designing and implementing, prioritizing, or even expanding, basic services in impoverished informal settlements. The process of implementing a slum upgrading project or expansion of basic services, such as water and sanitation, depends on the quality of information supporting such policy implementation.
The suggested approach ultimately contributes to further strengthen urban monitoring systems that are important for achieving SDG 11. They should not be seen only as a slum-mapping exercise but rather as slum characterization, which is useful to identify pockets of poverty, spaces where development is lagging and areas with scarce provision of basic services. EO data offer a distinctive source of commensurable information that can be further combined with administrative, social, and economic information at multiple scales for in-depth policy analysis. Continued advancement of EO-based technology and research using the methodologies such as the one developed in this paper will, in the long-term, open new doors to improving the quality of life for over a quarter of the world’s urban population that live in slums today.
Supplemental Material
Supplemental Material - Predicting housing deprivation from space in the slums of Dhaka
Supplemental Material for Predicting housing deprivation from space in the slums of Dhaka by Amit Patel, Christian Borja-Vega, Luisa M Mimmi, Tomas Soukup, Jan Kolomaznik, Tanushree Bhan, Marcia D Mundt, and Hyunjung Lee in Environment and Planning B: Urban Analytics and City Science
Footnotes
Declaration of Conflicting Interests
The author(s) declared no potential conflicts of interest with respect to the research, authorship, and/or publication of this article.
Funding
The author(s) disclosed receipt of the following financial support for the research, authorship, and/or publication of this article: This work was supported by the World Bank Group [7183318].
Supplemental Material
Supplemental material for this article is available online.
Amit Patel is Associate Professor of Public Policy and Public Affairs at University of Massachusetts Boston’s McCormack Graduate School for Policy and Global Studies. Amit’s research focuses on housing and health conditions of urban poor in developing countries. Amit received his PhD in Public Policy from George Mason University and has prior training in management, urban and regional planning, and architecture.
Christian Borja-Vega is a Senior Economist with the World Bank and has 15 years of experience in development organizations including Interamerican Development Bank, Social Development Secretary in Mexico and Mexican Health Foundation. His work focuses on water infrastructure and systems’ research and economic analysis. As a program coordinator of the Strategic Impact Evaluation Fund, Christian managed Water Supply, Sanitation and Hygiene Impact Evaluations in Africa, Latin America and East Asia. Christian has B.A. of Economics at ITESM in Mexico, Master in Public Policy at the University of Chicago, and PhD in Civil Engineering at the University of Leeds.
Luisa Maria Mimmi is a Policy Analyst based in Italy where she works as a consultant for the Ministry of Finance and other think tanks on sustainable infrastructure policies and regulation of energy and water utilities. Prior to that, she worked for over 10 years in Washington, DC, at the World Bank and the Inter-American Development Bank. Luisa has conducted several studies on innovative policies to secure equitable and sustainable access to housing and infrastructure services in underserved settings. She holds a Master of Public Policy from Georgetown University and an undergraduate degree in Economics from the University of Pavia.
Tomas Soukup is a project manager, senior consultant and Earth observation enthusiast in GISAT - geoinformation company located in Prague, Czech Republic. Tomas has more than 20 years of global experience in leadership, excellence and innovation in Earth observation services, framing a novel operational information solutions. Tomas led numerous projects mainly focused on urban/land management and environmental domains, bridging Earth observation (EO) and other information sources in sustainable development support context.
Jan Kolomaznik is a senior remote sensing consultant in GISAT, Czech Republic. Jan holds MSc. in geoinformatics and remote sensing, and he has a sound technical background in satellite data and geospatial analysis as well as in product design and development of operational Earth Observation applications. As production manager, Jan has been in charge of implementing EO services and production team coordination. Since 2011 he has been involved in projects funded by the European Space Agency to support sustainable urban development initiatives of international financial institutions, including the World Bank, Asian Development Bank and Inter-American Development Bank.
Tanushree Bhan is Research Fellow at LEAD at Krea University, India. Her research interest lies in the politics of poverty in framing the content and design of welfare policy and public service delivery, particularly in India. She is also interested in studying the feedback effects of these policy designs on political attitudes and participation among the poor. She engages mixed method approaches in her research to explore these interests. Tanushree holds a PhD in public policy from University of Massachusetts, Boston.
Dr. Marcia D. Mundt is the Director of Research, Evaluation, and Learning at the Consortium for Elections and Political Process Strengthening, which is comprised of three premier international nonprofit, nonpartisan, and nongovernmental organizations dedicated to democratic development. Her research focuses on democracy promotion in fragile and post-conflict contexts to promote development, social justice, and more peaceful and prosperous communities worldwide. Dr. Mundt received her BA in Government, Communication Studies, and Spanish from New Mexico State University, a MA in Peace Studies from the University of Bradford, and a MSPP and PhD in Public Policy from the University of Massachusetts Boston.
Dr. Hyunjung Lee is a postdoctoral research fellow at the Office of Health Equity, Health Resources and Services Administration (HRSA)- Oak Ridge Institute for Science and Education (ORISE). She received her Ph.D. in Public Policy from the University of Massachusetts Boston, her master’s degree in Public Policy from George Mason University, and an executive MBA from Helsinki School of Economics. Her research interests include health disparities among underserved population, social determinants of health, including sociodemographic characteristics and built environments, health policy, and health care system.
References
Supplementary Material
Please find the following supplemental material available below.
For Open Access articles published under a Creative Commons License, all supplemental material carries the same license as the article it is associated with.
For non-Open Access articles published, all supplemental material carries a non-exclusive license, and permission requests for re-use of supplemental material or any part of supplemental material shall be sent directly to the copyright owner as specified in the copyright notice associated with the article.