
Abstract
Remote sensing technologies are integral to monitoring the mountain cryosphere in a warming world. Satellite missions and field-based platforms have transformed understanding of the processes driving changes in mountain glacier dynamics, snow cover, lake evolution, and the associated emergence of hazards (e.g. avalanches, floods, landslides). Sensors and platforms are becoming more bespoke, with innovation being driven by the commercial sector, and image repositories are more frequently open access, leading to the democratisation of data analysis and interpretation. Cloud computing, artificial intelligence, and machine learning are rapidly transforming our ability to handle this exponential increase in data. This review therefore provides a timely opportunity to synthesise current capabilities in remote sensing of the mountain cryosphere. Scientific and commercial applications were critically examined, recognising the technologies that have most advanced the discipline. Low-cost sensors can also be deployed in the field, using microprocessors and telecommunications equipment to connect mountain glaciers to stakeholders for real-time monitoring. The potential for novel automated pipelines that can process vast volumes of data is also discussed, from reimagining historical aerial imagery to produce elevation models, to automatically delineating glacier boundaries. Finally, the applications of these emerging techniques that will benefit scientific research avenues and real-world societal programmes are discussed.
I Introduction
The mountain cryosphere, which we define as areas within mountainous environments that are frozen during part or all of the year, including glaciers, snow, permafrost, and lake ice, represents a source of fresh water for 1.9 billion people worldwide (Immerzeel et al., 2019). Yet, mountain areas are increasingly threatened by climate warming, posing a threat to future water security (Hock et al., 2019; Shugar et al., 2021). For communities living in mountain environments, such climate warming also poses an increased threat of natural hazards from the cryosphere, such as glacial lake outburst floods (GLOFs) (Carrivick and Tweed, 2016; Harrison et al., 2018), avalanches (Ballesteros-Cánovas et al., 2018; Fischer et al., 2012), slope failures (Huggel et al., 2012), debris flows (Perov et al., 2017), or a combination of one or more hazards in a cascading chain (Kirschbaum et al., 2019). Given the significance of the mountain cryosphere in water resource and hazard management, it is imperative to be able to track its rapid change, with the goal of being able to develop predictive capacity. Earth observation (EO) and field-based techniques are increasingly viewed as being able to play a key role in securing the sustainable development of mountain communities (e.g. Murthy et al., 2014; Veettil and Kamp, 2019). However, there often remains a disconnect between monitoring from afar and local co-operation (Nussbaumer et al., 2017).
Remote sensing has advanced rapidly in recent years, both in the physical hardware of the sensors and in the software used to subsequently process the data. However, the challenges associated with imaging areas of high relief are great, and the success of techniques that are now routinely applied over ice sheets (e.g. altimetry, gravimetry) has been limited (Berthier et al., 2006; Kääb et al., 2005; Prinz et al., 2018; Racoviteanu et al., 2008). Optical satellite sensors are particularly hampered by persistent cloud, frequent and extensive snow cover, and accessibility of output data. Radar sensors can penetrate cloud and quantify centimetric deformation rates (Joughin et al., 2010), but are often affected by radar shadow and layover from steep topography, and signal decorrelation due to the highly dynamic environment, which reorganises matching features. Field-based remote sensing techniques overcome such problems and can offer very high spatiotemporal resolution and bespoke data, but only from individual sites and with more challenging logistical obstacles, and many areas remain inaccessible for safety or geopolitical reasons.
Recent innovations in sensor technology and processing techniques can be applied to remote observations of the mountain cryosphere. Upcoming satellite missions, in particular satellite constellations, will increase acquisition rates over mountain glaciers at an ever improving spatial, spectral, and radiometric resolution. Private–public partnerships are becoming increasingly common, which has seen an associated rise in commercial data being incorporated into research publications (Figure 1). Field-based techniques are also changing rapidly, as bespoke unoccupied aerial vehicles (UAVs) and low-cost micro-sensors increasingly become part of a glaciologist’s toolkit (Bhardwaj et al., 2016). Artificial intelligence (AI) and cloud computing, with the vast increase in availability of free and open access data, are beginning to improve the processing of these new data.
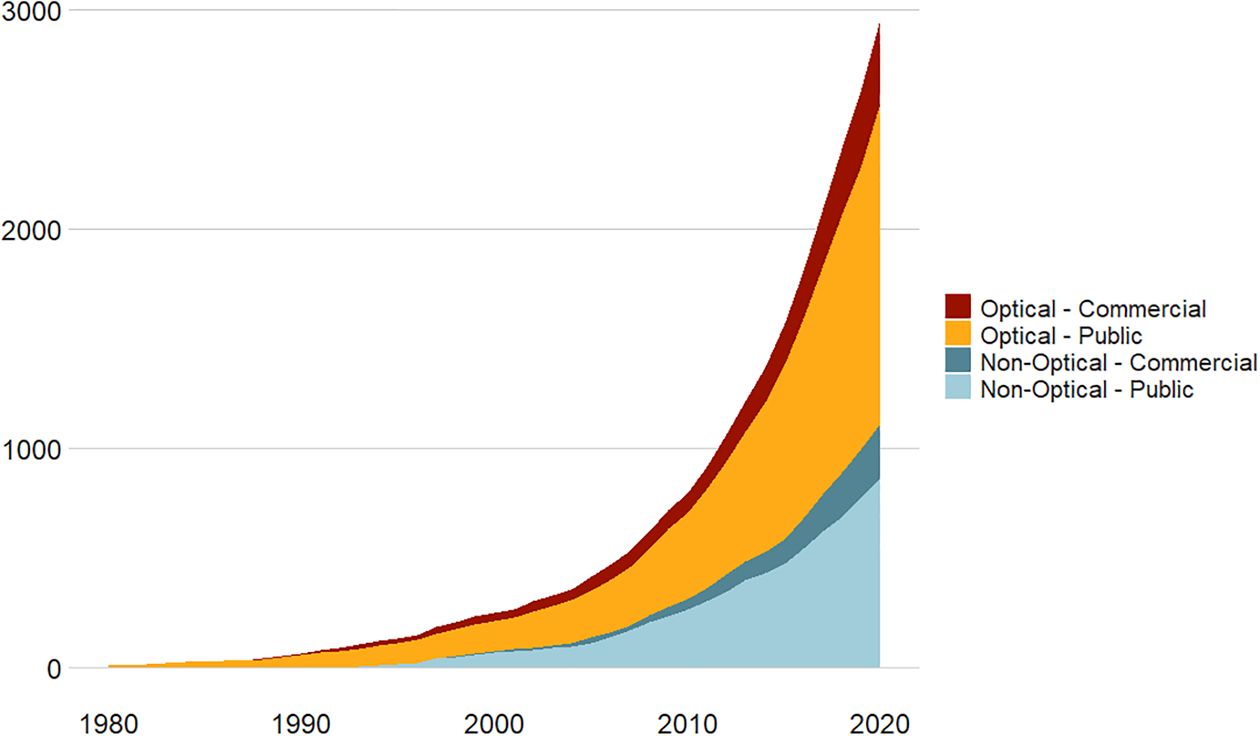
Scopus searches for the use of earth observation satellites in mountain glacier studies. These data were generated from a systematic review of available literature from missions described in this manuscript (given in Appendix A) and then subsequently merged into commercial or public missions.
We are therefore in a period of rapid remote sensing, and consequently modelling, of the mountain cryosphere, presenting a timely opportunity to review the accomplishments to date and explore future directions for this discipline. The aim of this review was to critically evaluate the performance of current remote sensing methods, identify limitations and gaps in current delivery, and discuss what emerging technologies could offer this research area in the future.
II Current monitoring of the mountain cryosphere
There are a number of measurable parameters that can be used to chart the response of glacierised environments to climatic changes. Some parameters indicate changes in process rates (e.g. accumulation, ablation, ice deformation and sliding, sediment dynamics), while others are more pertinent to identifying features that may threaten downstream communities (e.g. glacial lakes, oversteepened and thawing slopes). In this section, we review the methods currently available for monitoring the mountain cryosphere, reflect on the key sensors available to researchers, and consider selected services available to local authorities.
2.1 Surface mass balance
Surface mass balance, the net sum of accumulation and ablation over a period, often 1 year, is perhaps the clearest indicator of how a glacier is responding to a warming climate (Dyurgerov and Meier, 2000). The overwhelming majority of remote sensing studies now calculate glacier-specific and region-wide mass balances using the geodetic approach.
The geodetic approach describes the process of differencing time-separated digital elevation models (DEMs) and summing the glacier-wide elevation changes, before converting the resulting volume to mass (Bamber and Rivera, 2007; Huss, 2013). It emerged during the late 1990s as an efficient means of deriving surface elevation measurements across broad areas within a single analysis (e.g. Wingham, 1998). Both the Shuttle Radar Topography Mission (SRTM; 2000), and ASTER Global Digital Elevation Model (GDEM; 2009) are typically used as ‘baseline’ datasets to establish the first elevation epoch (Wu et al., 2018; Zhou et al., 2017). The second epoch is usually then established by constructing a DEM from stereo imagery (e.g. SPOT, ASTER) acquired some years later (Braun et al., 2019; Rabatel et al., 2016). However, many data sources appropriate for such analysis remain restricted in access. In particular, the SPOT family of satellites provides one of the longest and highest resolution archives for constructing glacier mass balance, but as a commercial mission the imagery is costly for the majority of researchers without a data grant; ALOS PRISM (2.5 m spatial resolution) and TerraSAR-X/TanDEM-X data (3 m StripMap mode and 12 m respectively; Rizzoli et al., 2017) are similarly only available to classified users under licence. ASTER imagery provides stereo DEMs at no-cost, but at medium spatial resolution (15 m; GDEM 30 m), often with errors that exceed the magnitude of the change being detected (Bolch et al., 2008), and is planned to retire in 2023. Protocols for automating DEM production (such as fitting a regression through an ASTER DEM chain to robustly separate signal from noise) represent a major step forward, by providing data redundancy in the form of multiple datasets (Brun et al., 2017).
Longer records of glacier mass change have exploited archives of aerial imagery or declassified stereo imagery from US reconnaissance missions (e.g. HEXAGON and Corona), to produce baseline DEMs, giving rise to 50+ year estimations of glacier mass balance in mountainous regions (Bolch et al., 2008; Falaschi et al., 2019; Kjeldsen et al., 2015; Pieczonka et al., 2013; Surazakov et al., 2007). Coupled with contemporary assessments of glacier evolution these historical records can provide valuable information on rates of change (King et al., 2019; Maurer et al., 2019). After initial processing challenges brought about by non-conventional frame characteristics and missing location data, these declassified images are now also routinely fed into automated processing pipelines to derive elevation snapshots at multiple epochs (Maurer and Rupper, 2015) (see Figure 2).
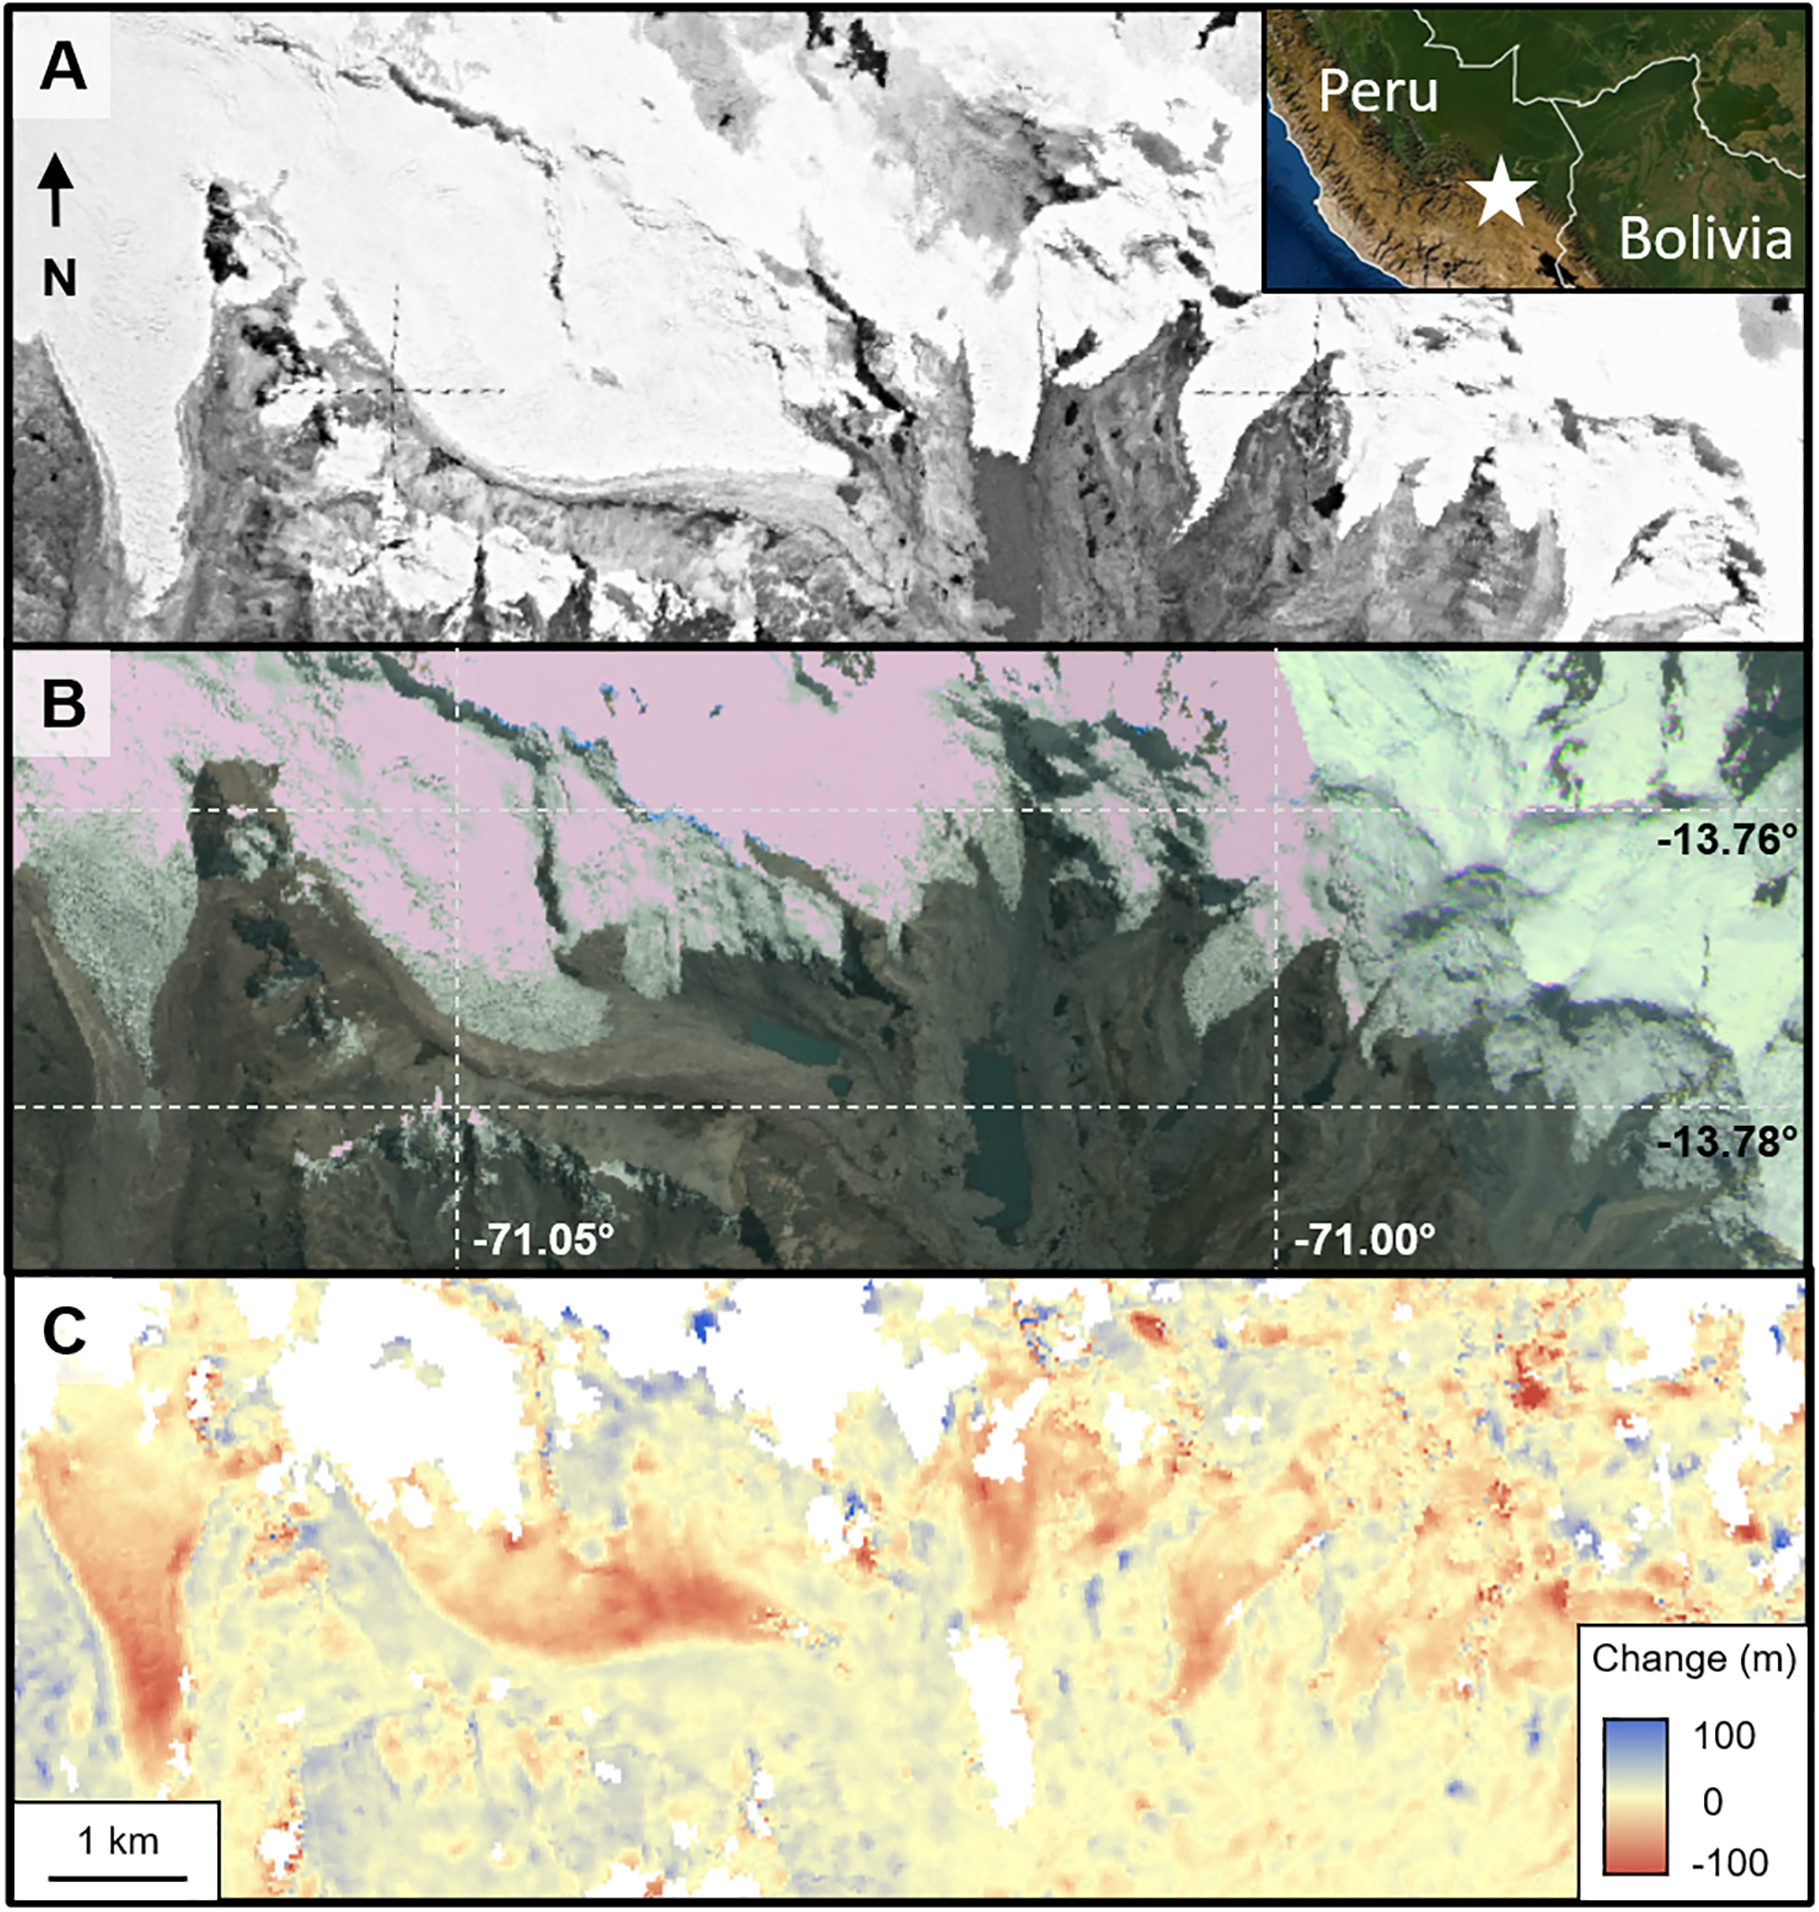
Historic and contemporary images can be used to quantify mass change across the Cordillera Vilcanota, Peru (−13.76°N, −71.03°E). (a) KH-9 HEXAGON image from 3rd August 1980, georeferenced and overlain on a DEM generated using HEXIMAP (Maurer and Rupper, 2015); (b) Planet imagery from May 2020 as a visual reference for glacier position today; and (c) DEM differencing the KH-9 HEXAGON elevation model against a TanDEM-X DEM from July 2015. Positive values surrounding the glacier are likely to be due to georeferencing error of the HEXAGON image on very steep slopes.
Regional estimates of mass balance are often more robust indicators of glacier response to climate change than those focussing on a small subset. The Gravity Recovery and Climate Experiment (GRACE) satellites (2002–2017), and their successor (GRACE-FO; launched in 2018), offer the possibility to calculate regional estimations of net mass change and the subsequent contributions to sea level rise (Chen et al., 2013). However, their coarse spatial resolution (∼300 km), and inability to disaggregate individual contributions of change, mean that signals of ice loss cannot be separated from signals from groundwater storage depletion or surface lake drainage (Song et al., 2015; Yi and Sun, 2014). Satellite altimetry from ICESat (2003–2010) and CryoSat-2 (2010–) has also been used to produce estimates of glacier mass loss, but only over the largest glaciers where observations were regularly repeated (Kaab, 2008; Ke et al., 2015; Neckel et al., 2014; Trantow and Herzfeld, 2016). Altimeters are frequently used as a comparison for the accuracy of other DEMs (e.g. Liu et al., 2019), or as ground control points for stereo DEMs; yet, there remains a gap in the current satellite delivery for highly precise elevation measurements over mountain glaciers from altimeters that may yet be fulfilled by ICESat-2 (2018–) as it builds an archive of repeat observations.
At a smaller scale, UAVs are important in the creation of centimetre-scale (cm-scale) elevation models for monitoring surface mass balance through structure-from-motion photogrammetry. Repeat surveys can be used to monitor short-term surface melt through differencing point clouds (Bash et al., 2018; Dall’Asta et al., 2017). This is particularly important where melting dynamics are drastically different across the year (Che et al., 2020; Rossini et al., 2018). The cm-scale DEMs can also be used to measure the microtopography of glacier surfaces – an important component in the surface energy balance of glaciers (Bash and Moorman, 2020; Bonekamp et al., 2020; Chambers et al., 2019).
2.2 Ice velocity
Glacier velocity products are important for determining the long-term response of a glacier or a region to climate warming (Dehecq et al., 2019), as well as for assessing likely locations for emerging hazards and those developing in the future (Quincey et al., 2007). Generating distributed velocity fields for mountain glaciers usually requires one of two approaches: feature tracking or interferometric synthetic aperture radar (InSAR). Feature tracking requires two images separated in time, captured within an optimal time window such that the features have moved sufficient distance to be detectable, but not such that they have deformed beyond recognition. Most algorithms employ normalised cross-correlation for matching features (e.g. Berthier et al., 2005; Copland et al., 2009), but frequency-based approaches can also yield robust results (Leprince et al., 2007; Scherler et al., 2008); see Heid and Kääb (2012) for a comprehensive review. InSAR requires much shorter temporal baselines, such that the coherence of the radar signals between the two successive images is maintained (Rabus and Fatland, 2000), dependent therefore on periods of calm weather and geomorphic stability, neither of which are common in mountain environments. Where InSAR is successful, it can detect cm-scale displacements, at high precision, as well as performing well over relatively featureless (clean-ice or snow-covered) areas where feature tracking fails (Luckman et al., 2007).
Traditionally, radar imaging sensors have been used for velocity tracking as radar speckle results in an image rich in texture over optically featureless surfaces, and their ability to penetrate clouds allows for images to be captured regardless of weather conditions. Today, the European Space Agency’s Sentinel-1 satellite provides such imagery on a 6-day repeat cycle for deriving glacier velocity, building upon its predecessors ERS-1/2 (1991 and 1995) (Luckman et al., 2007; Quincey et al., 2007) and Envisat (2002) (Quincey et al., 2009). Images collected by commercial satellites, such as RADARSAT and TerraSAR-X, are also used to derive glacier velocity fields at high temporal frequency and spatial resolution (Abdel Jaber et al., 2012; Waechter et al., 2015), though these data are generally only available through licencing agreements or at great financial cost.
Where successive cloud-free images can be acquired, velocity products can also be derived from optical imagery. Medium-resolution imagery (10–30 m) such as ASTER provides broad coverage for regional assessments (Redpath et al., 2013), while the long Landsat archive offers a window into past glacier dynamics and their current response to changes in climate (Dehecq et al., 2019). The Operational Land Imager on board Landsat-8 is particularly well-suited to this task, offering improved radiometric resolution and geometric fidelity compared with its predecessors, making it possible to produce glacier velocity products that are comparable in terms of accuracy to InSAR (Fahnestock et al., 2016; Roy et al., 2014). Applications such as Cosi-CORR (Leprince et al., 2007), IMCORR (Scambos et al., 1992), and auto-RIFT (Gardner et al., 2020) are used routinely to produce glacier velocity products from radar and optical data. However, given the cloudy and steep conditions of mountain glaciers, outputs from a range of correlation applications and sensors are often required for robust and complete coverage (Heid and Kääb, 2012).
2.3 Glacial lakes
The growth of lakes as glaciers recede is one of the most visible reminders of climate warming impacting the mountain cryosphere (Shugar et al., 2020). Lakes present opportunities in hydropower and tourism, but also additional risk from the threat of larger and more frequent outburst floods to downstream populations (Bajracharya and Mool, 2009; Carrivick and Tweed, 2016; Drenkhan et al., 2019; Haeberli et al., 2016). Existing glacial lakes can be located using a Normalised Difference Water Index (NDWI) from medium-resolution optical imagery such as Sentinel-2 or the Landsat archive (Drenkhan et al., 2018; Watson et al., 2018). DEMs can also be used to identify glacial lakes from stereo optical imagery (Ukita et al., 2011) or higher-resolution synthetic aperture radar (SAR) (Strozzi et al., 2012).
Establishing lake volume requires bathymetry measurements to capture the bed, and therefore an in situ component (Fujita et al., 2009). In the absence of these data, empirical scaling of the lake area with mean depth (from bathymetric maps and published data to avoid auto-correlation) can be used to provide a first-order assessment, though high uncertainty may suggest a mixed-model approach is most appropriate for datasets containing varying lake sizes (Cook and Quincey, 2015; Shugar et al., 2020). Estimates of glacial lake volume can also be determined from a depth-reflectance (Fitzpatrick et al., 2014) or depth-area relationship, but in the case of the latter approach, significant variability exists between sites depending on their style of formation (Cook and Quincey, 2015; Drenkhan et al., 2018). The recently launched ICESat-2 (2018) altimeter can obtain photon returns from both the lake surface and bed (accounting for refraction) to depths of around 40 m (Parrish et al., 2019), including from supraglacial lakes (Fair et al., 2020), though this is as yet untested in mountainous environments (Figure 3). Monitoring the changing lake surface height is theoretically possible from satellite altimeters or a continuous series of stereo DEMs. However, the archive for such measurements, at an appropriate accuracy to detect change through time, is not long. With extensive processing, data have been extracted from the Envisat era (2002–2012), with notable additions from ICESat (Neckel et al., 2014) and CryoSat-2 (Crétaux et al., 2016).
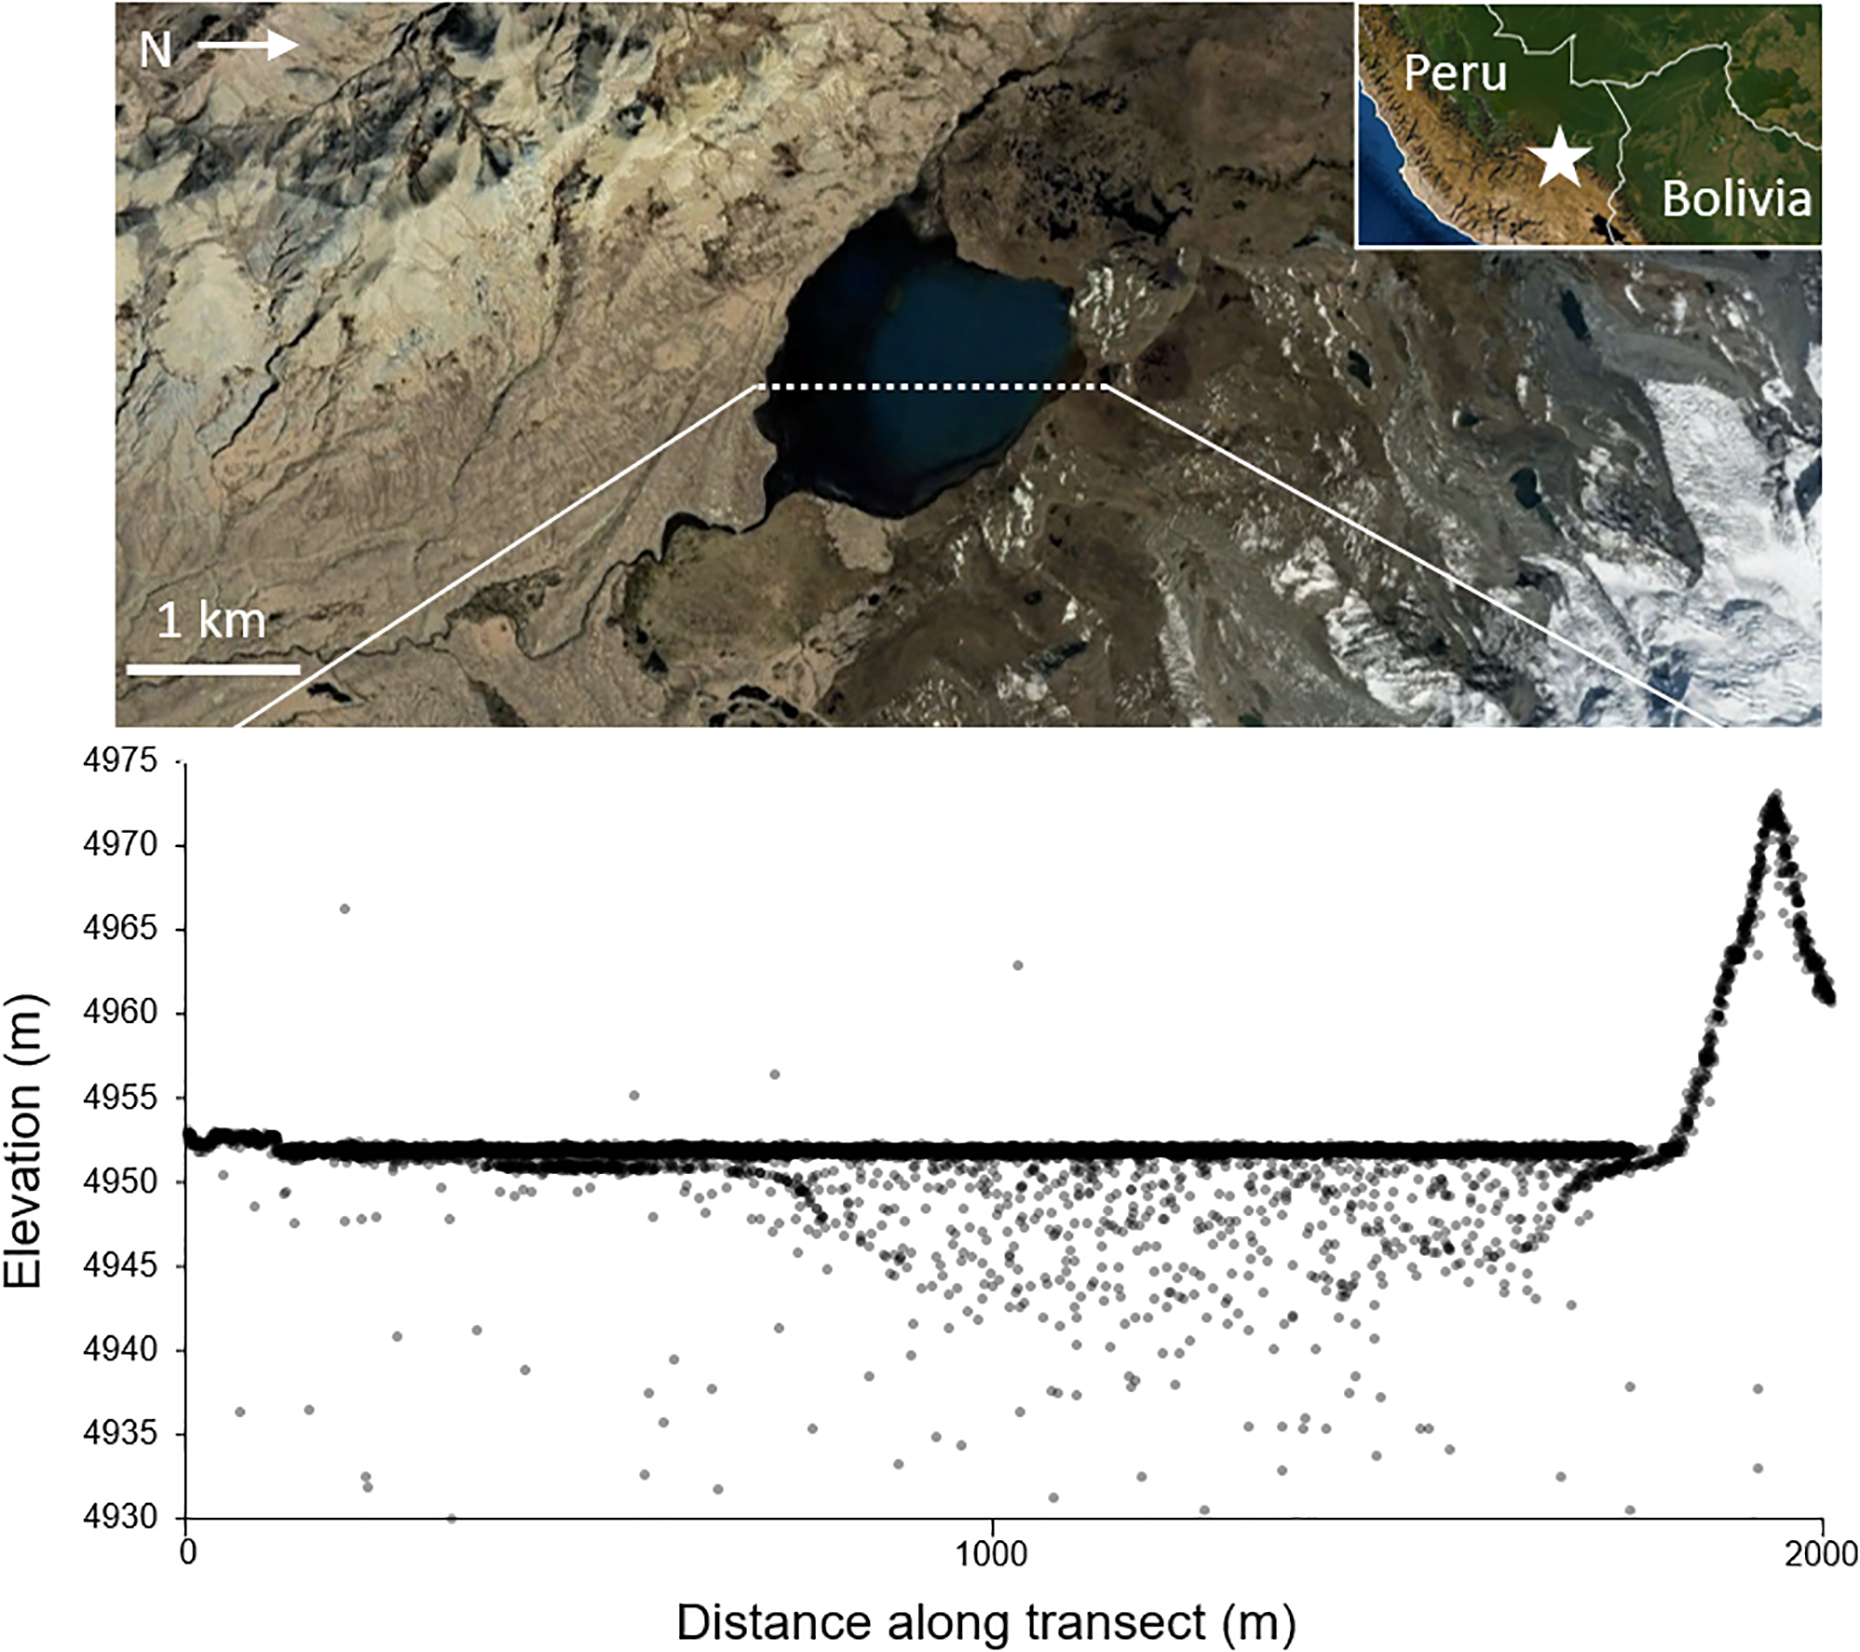
ICESat-2 Track 567 ATL03 product from 4 August 2019 across Laguna Amayuni (−13.81°N, −70.99°E) in the Cordillera Vilcanota, Peru. Sediment intrusion in the glacial lake clouds limits the penetration of photons to the bed, which limits its applicability in deriving lake volume to a high confidence in this environment. Top image from Google Earth and CNES/Airbus, 2020.
Remote sensing of glacier lakes now begins long before their formation, with bed topography data and modelling able to indicate their future extent and volume (Drenkhan et al., 2019) to provide an early indication that mitigation of an emerging hazard may be necessary. New lakes are likely to form in the overdeepenings carved from the erosive force of glaciers, and so can be located with high confidence using contemporary DEMs and the perfect plasticity approach to estimating ice thickness (Kapitsa et al., 2017; Linsbauer et al., 2012; Rounce et al., 2017; Viani et al., 2020). However, the timing of their evolution still requires numerical modelling of future rates of ice melt.
2.4 Supraglacial ponds and ice cliffs
Glaciers have highly complex and dynamic surfaces, and features such as ponds and cliffs contribute to the surface energy balance and overall hydrological regime of mountain glaciers ( Brun et al., 2016; Brun et al., 2018; Miles et al., 2016; Miles et al., 2018a). Medium-resolution (10–30 m) optical satellite data can classify supraglacial lakes (with Sentinel-2 outperforming Landsat-8 in spectral contrast between debris and water; Watson et al., 2018) on a regional scale (Veettil, 2018) and repeat imagery can be used to follow drainage events to identify associated changes in velocity and surface elevation (Miles et al., 2018b). However, sub-metre resolution data are essential to accurately assess the dynamics, and classify features, of complex glacier surfaces. Sub-metre resolution imagery and DEMs are paramount to being able to delineate features such as ice cliffs, which can contribute to increased rates of ablation (Buri et al., 2016). In lieu of satellite sensors being able to resolve such small-scale features, field-based remote sensing is frequently deployed. Airborne sensors (Light Detection and Ranging (LiDAR), photogrammetry) have conducted such surveys (e.g. Arnold et al., 2006; Baltsavias et al., 2001; Janke, 2013; Reid and Brock, 2014), but are sparsely used given the financial cost of mounting such a campaign.
UAVs have rapidly become the most appropriate tool for very high resolution mapping of glacier surfaces. They are relatively low cost, yet rival the precision of traditional field-based surveying methods (e.g. ground mapping with GPS) (Gaffey and Bhardwaj, 2020), over an entire glacier surface in a fraction of the time (Figure 4). Repeat UAV surveys have shown that the development of ponds and cliffs can accelerate ice velocity (Immerzeel et al., 2014), and imagery has been used to produce quantitative measurements of cliff geometry to better understand their formation and evolution (Buri et al., 2016; Kraaijenbrink et al., 2016). A particular advantage of UAVs is their flexibility to observe rapidly changing vertical features, such as underhanging cliffs, that are obscured from space and may not be accessible for fixed time-lapse cameras (Scaioni et al., 2019). The vast quantity of data that are gathered from UAV surveys opens up the opportunity for intelligent learning algorithms to speed up data processing as well as acquisition. AI has primarily been used in remote sensing to classify surface features (Kraaijenbrink et al., 2016), but embedding AI within UAV systems has streamlined data processing in other disciplines (Gonzalez et al., 2016; Ramirez-Atencia et al., 2017; Vasuki et al., 2014; Xu et al., 2018).
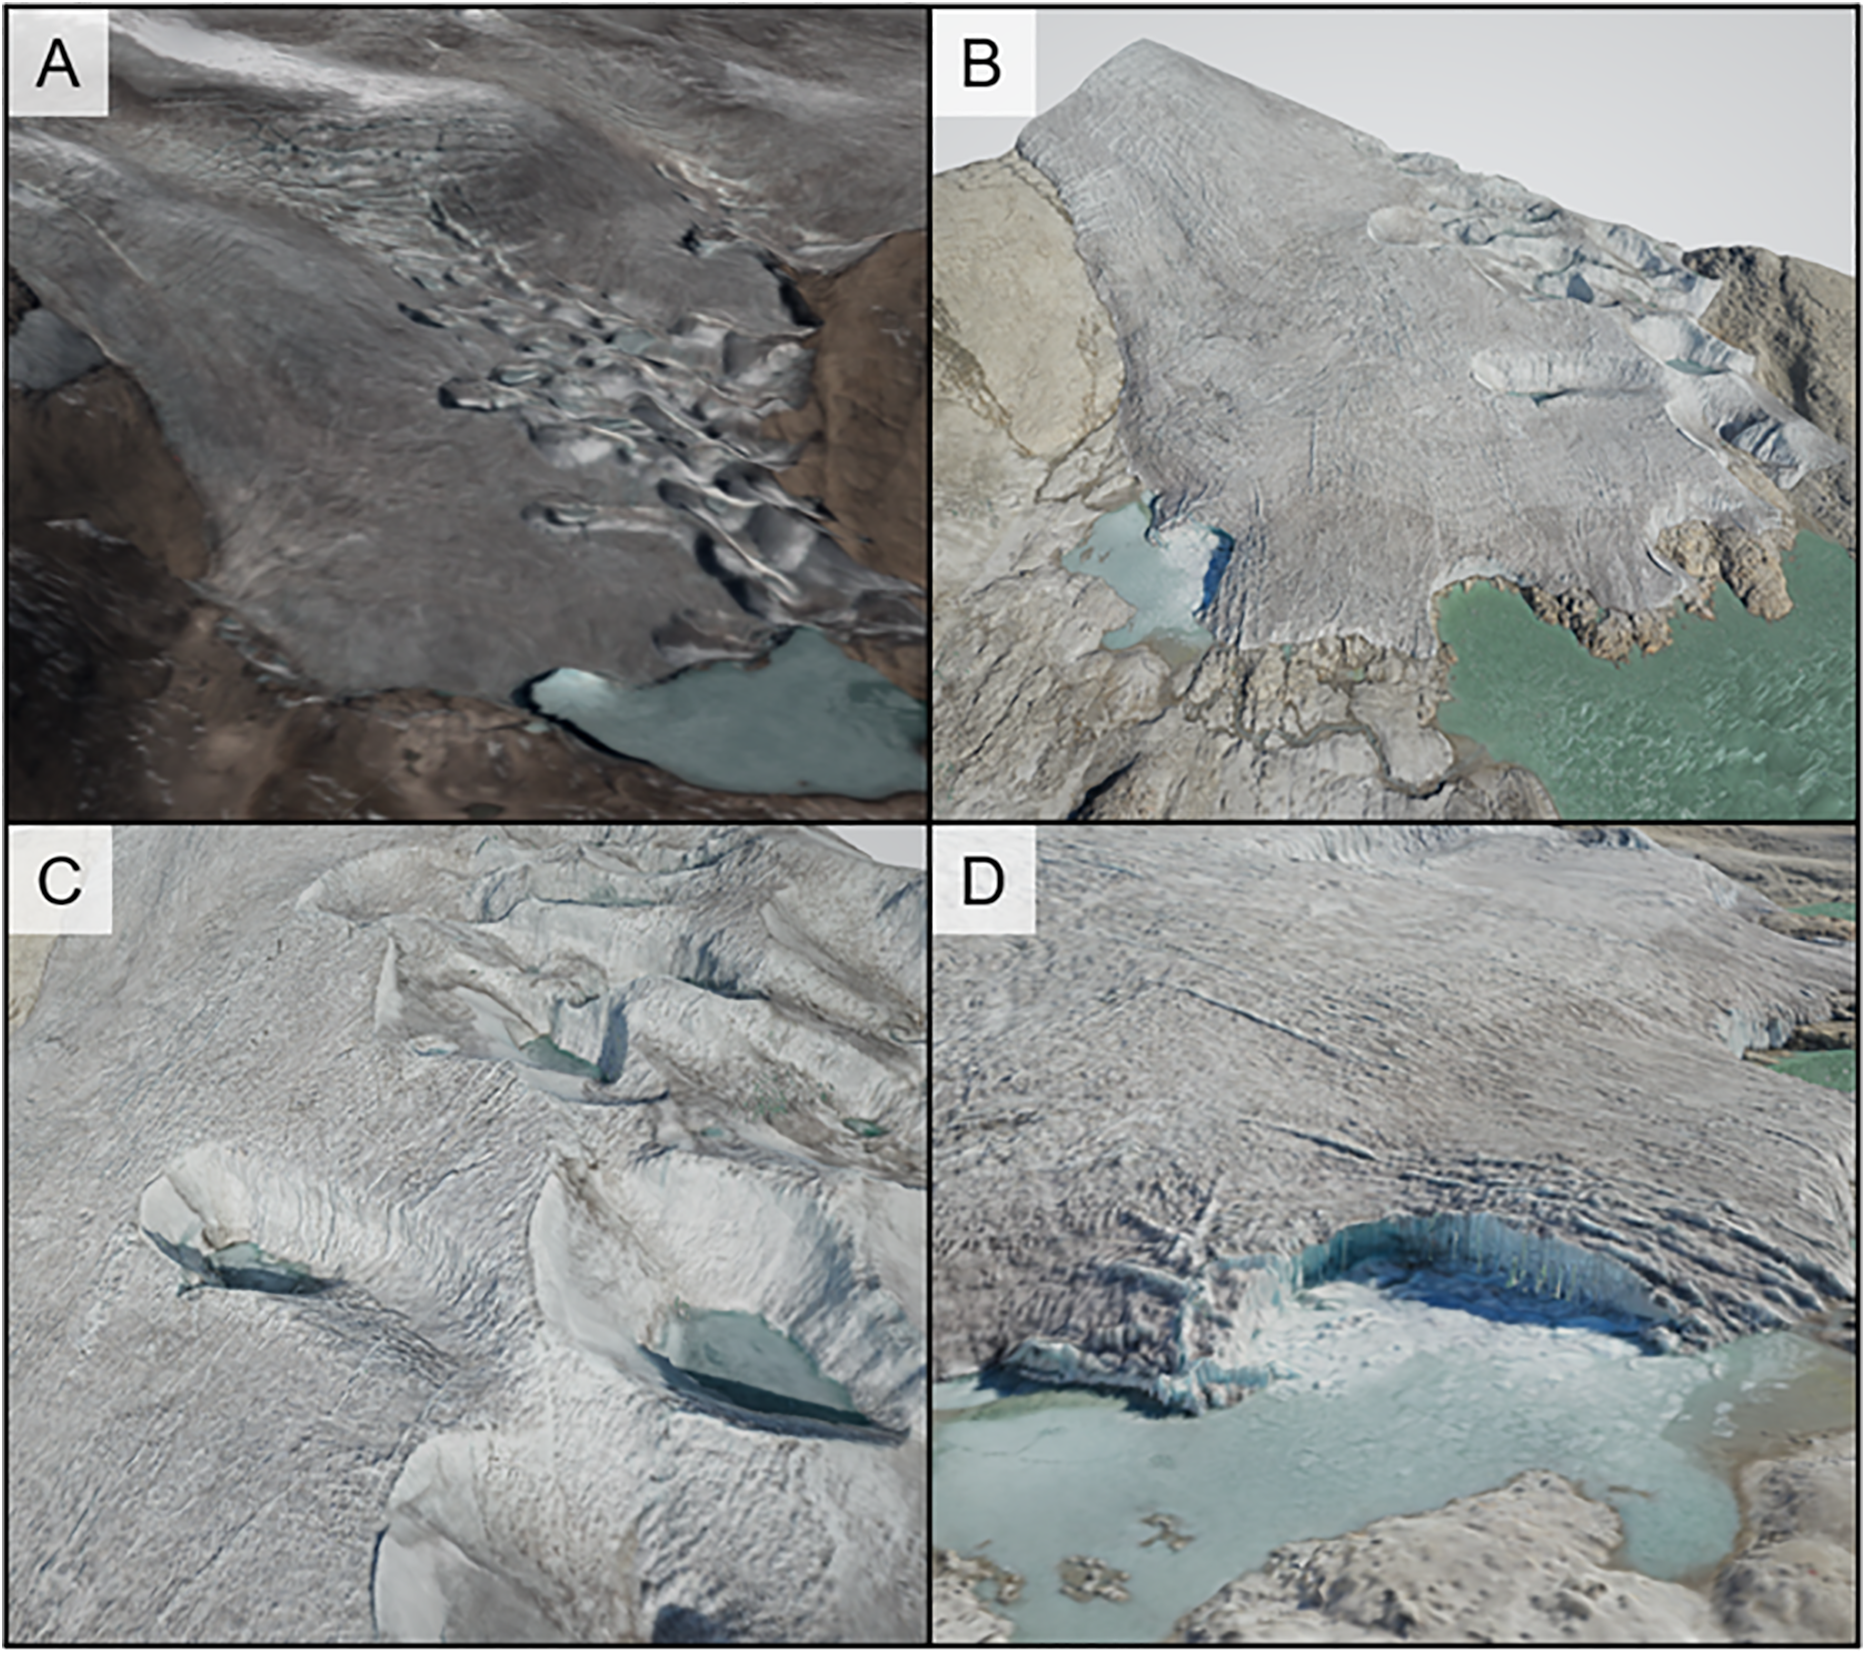
UAVs offer a much sharper view of mountain glaciers compared with 3D alternatives from satellites, allowing a more accurate view of the ice surface, presented here from the western margin of the Quelccaya ice cap, Peru. (a) Pleiades multispectral image layered over a 3D reconstruction from tri-stereo images acquired in August 2016; (b) structure-from-motion reconstruction from 528 images of a UAV flight over the same glacier in September 2019; (c) and (d) show closer views of the UAV-derived structure-from-motion model to highlight the primary advantages of using UAVs for 3D reconstruction of mountain glaciers.
2.5 Snow
Snow cover in mountainous regions is important for hydropower, tourism, irrigation, and water resource management and can represent a natural hazard for surrounding communities (Hock et al., 2019; Xiao et al., 2015). Detecting snow with optical satellites is long established using band ratioing (Lopez et al., 2008; Rastner et al., 2014) and the Normalised Difference Snow Index (NDSI) (Gascoin et al., 2019; Salomonson and Appel, 2004). With these data in cloud computing platforms, global-scale snow cover maps are now being produced regularly at a medium spatial resolution (Dietz et al., 2015; Gascoin et al., 2019; Mityók et al., 2018). Snow cover on glaciers can be indicative of equilibrium line altitude (Rabatel et al., 2012). With the addition of a DEM, optical imagery can be autonomously processed to detect the snow-line altitude to an 80% accuracy, though clouds, shadows, and significant fresh snow remain key limitations (Rastner et al., 2019). Daily PlanetScope imagery could be used to detect snow-line altitude at a much higher temporal resolution (Racoviteanu et al., 2019).
Accurate quantification of snow depth is important for water resource management, to enable planning on short to medium timescales. Typically these data come from in situ snow gauges (Egli and Jonas, 2009) or terrestrial laser scanners (Prokop, 2008). Digital photogrammetry can measure snow depth to avoid potentially dangerous field excursions to gather data using UAVs (Bühler et al., 2016) and even high resolution stereo satellite imagery by comparison to snow-free images (Marti et al., 2016) – a method that can offer sub-metre root mean squared error when compared with airborne LiDAR measurements (Deschamps-Berger et al., 2020). Passive microwave satellites can quantify snow water equivalent (SWE) and indicate melting of snow on large glaciers (Smith and Bookhagen, 2018), but wide sensor footprints (tens of kilometres squared) can limit this over smaller glaciers (Clifford, 2010). SAR sensors have commonly been used for monitoring snow in the mountain cryosphere to identify wet snow (and thus indicate melt), from SeaSat (Rott, 1984) to Sentinel-1 (Tsai et al., 2019a). A comprehensive review of the role of SAR sensors in monitoring snow is available from Tsai et al. (2019b).
III Upcoming innovations in sensor technology
Current trends and future forecasts both point towards a rapid rise in the launch of EO satellites, particularly from the commercial sector, over the next decade. Innovations will also have a positive impact on field-based remote sensing as UAVs become increasingly accessible and interdisciplinary research leads to searching for solutions from outside of the mountain cryosphere. In this section, we review some of the upcoming planned missions that could address research gaps in observing the mountain cryosphere, and identify where gaps still remain.
3.1 Optical sensors
Established civilian programmes (Landsat, Copernicus) are facing increased competition in a world where innovation is being rapidly driven by the commercial sector. Landsat-9 (launching 2021) is designed with virtually identical sensors to its predecessor as a data continuity mission (Markham et al., 2016). Landsat-9 will acquire imagery at 14-bit depth resolution, which allows for a quadrupled radiometric sensitivity (and thus better feature depiction) over bright targets such as snow and ice when compared with 12-bit sensors on board Landsat-8, Sentinel-2, and Planet Labs’ Dove satellites. This unbroken series of 50+ years from Landsat is particularly vital to the mountain cryosphere, where year-to-year changes in ice extent, surface albedo or lake growth can be observed. Looking to the future, user demands of Landsat-10 include greater spectral range, narrower bands, and higher spatial resolution to retain relevance (beyond its long record) as competition grows from constellations and SmallSats (spacecraft with a mass less than 180 kg) (Wu et al., 2019; Wulder et al., 2019).
Satellite constellations designed for near real-time imaging (data distribution within hours of acquisition) are becoming more popular and promise to shape the coming decade of EO (Table 1). Having multiple satellites working together clearly offers numerous advantages over single satellite missions, but the trade-off may be in terms of uneven instrument degradation. Although Planet Labs’ Doves are radiometrically calibrated against Landsat-8, RapidEye, and monthly lunar acquisitions, image quality and signal-to-noise ratio still varies between sensors (Leach et al., 2019). Noise within optical data usually arises from atmospheric interference (Daniel Jorge et al., 2017), which is typically corrected with shortwave infrared (SWIR) bands that SmallSats are lacking (Vanhellemont and Ruddick, 2018). These missing SWIR bands are also critical in distinguishing between the spectral signatures of ice and water (Dozier, 1989). Day-to-day changes observed by constellation imagery should therefore be approached cautiously, as they may reflect differences between satellites rather than on-the-ground change (Cooley et al., 2017; Poursanidis et al., 2019). Landsat and Sentinel may have medium spatiotemporal resolution, but they compensate for this with their consistent data quality.
Overview of key specifications of future optical satellites that plays an important role in monitoring the mountain cryosphere, compared with Landsat-8 and Sentinel-2.
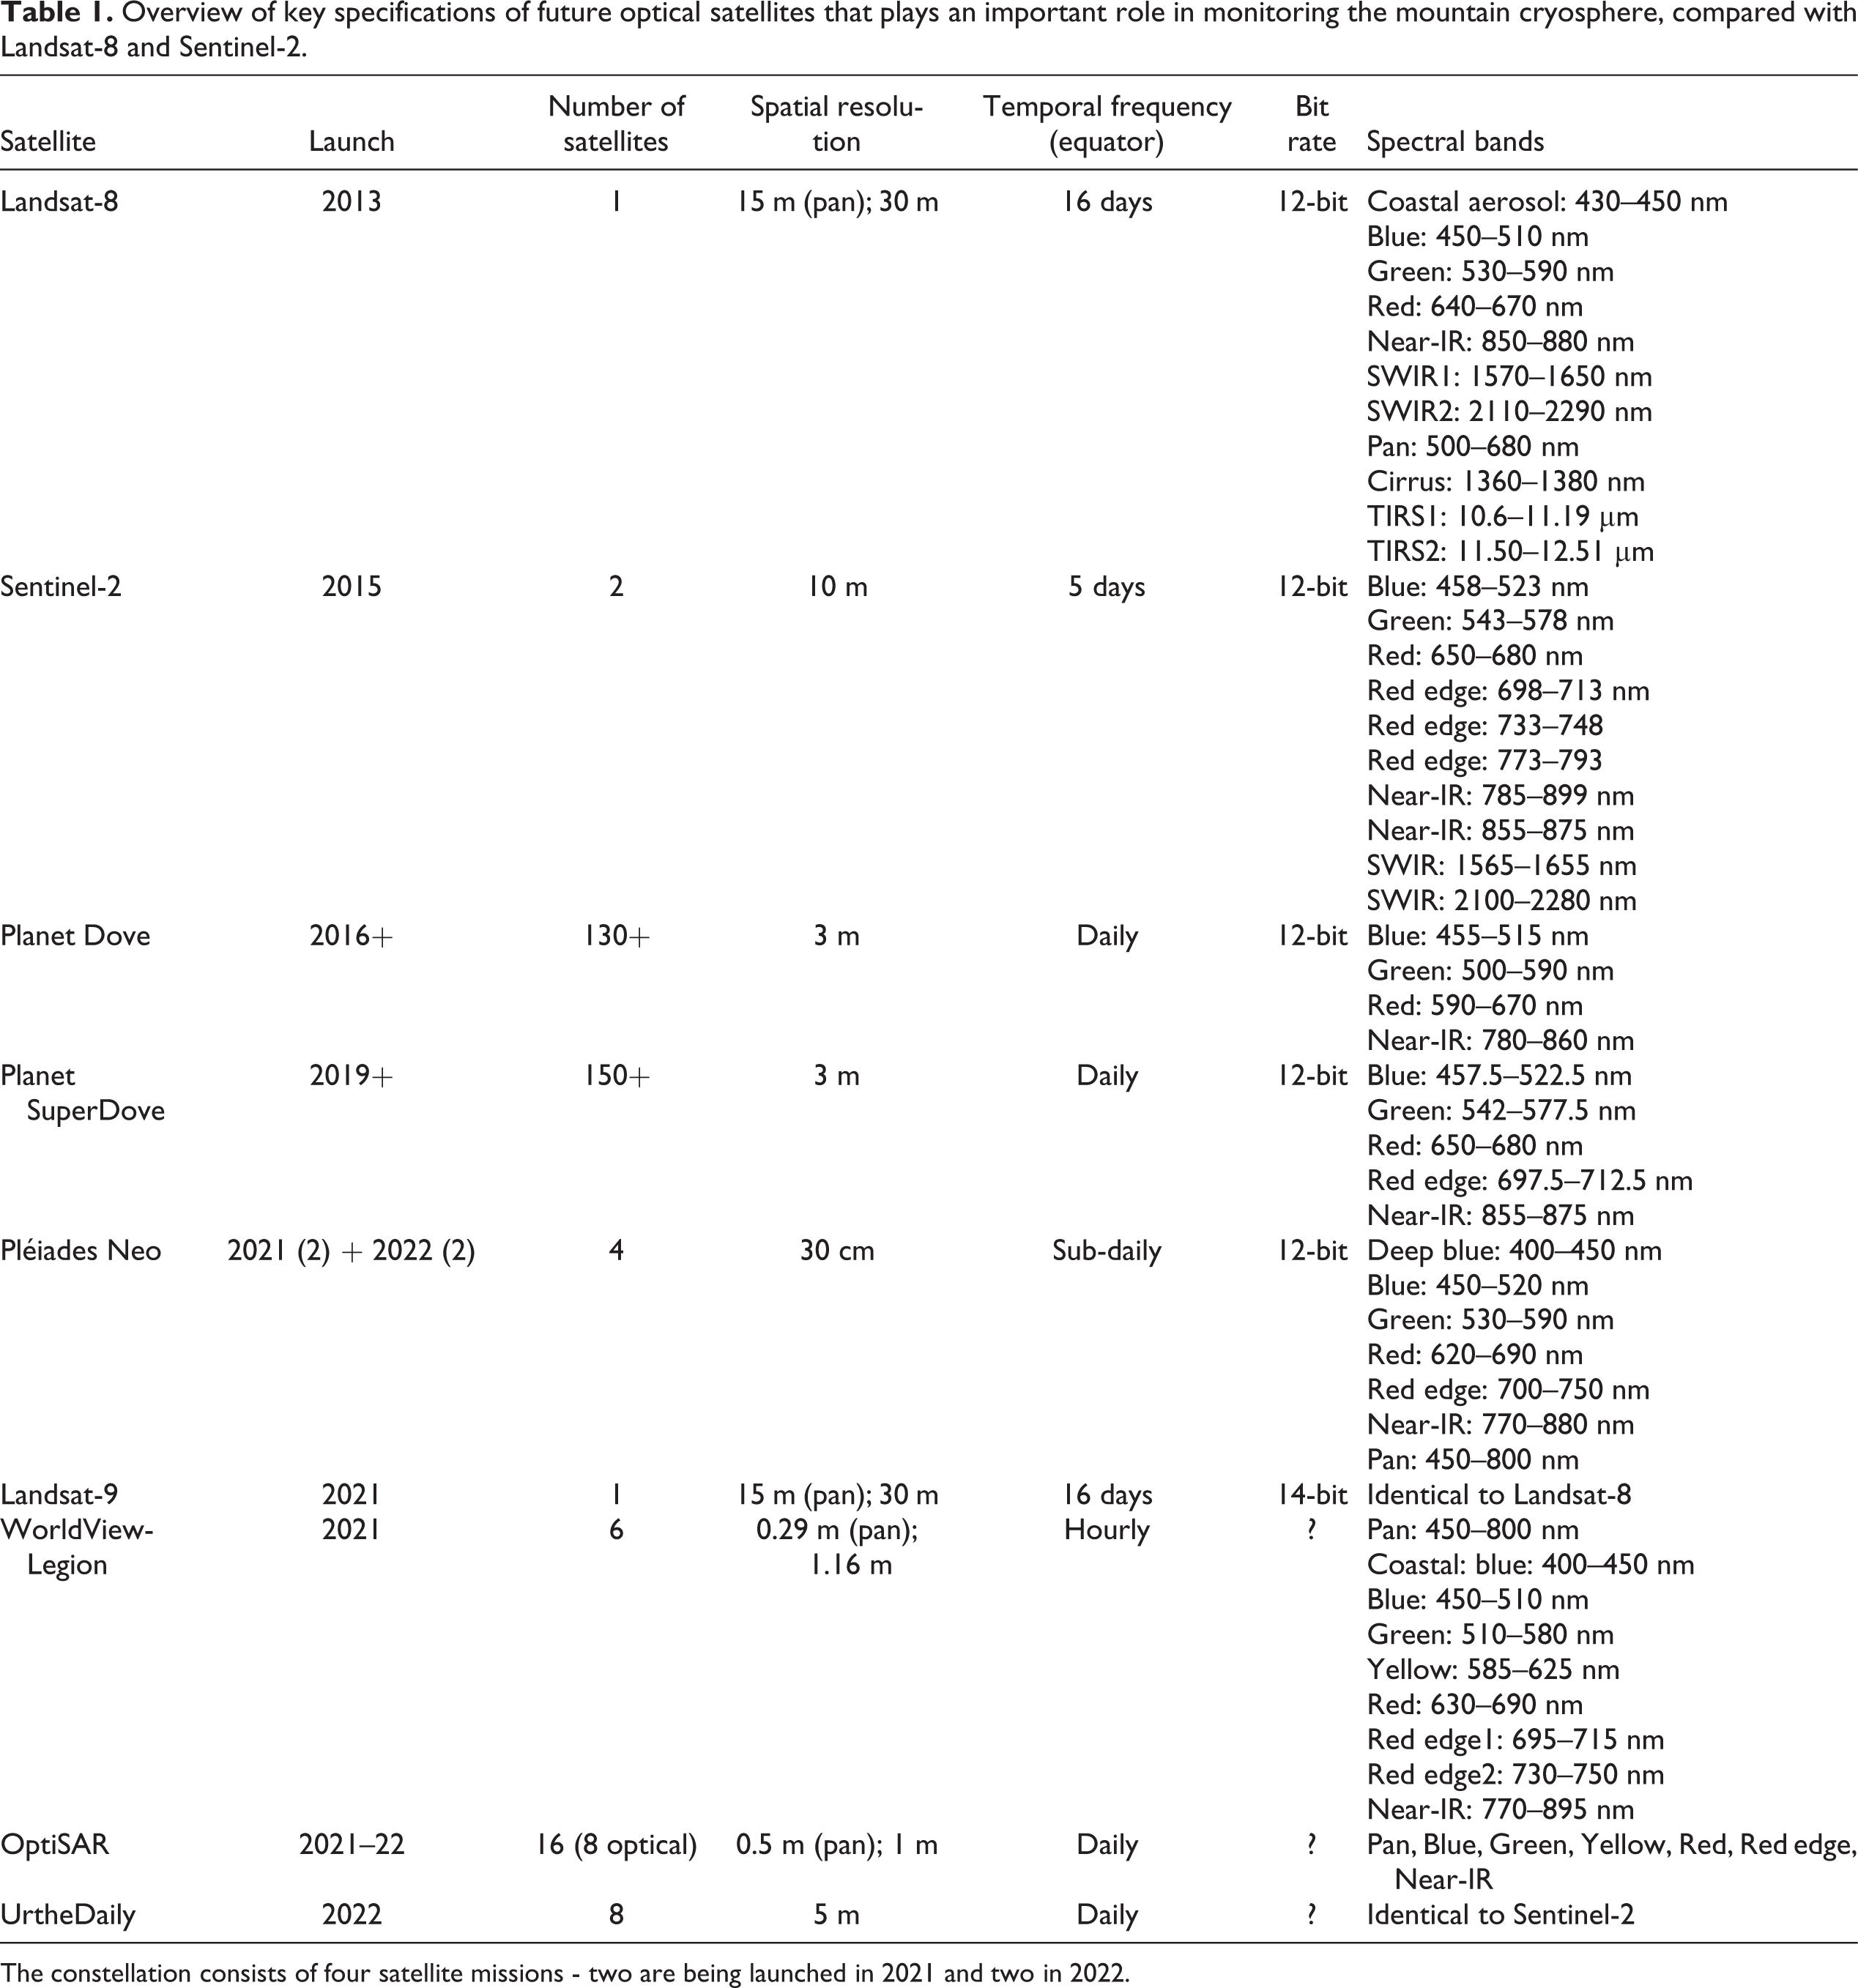
The constellation consists of four satellite missions - two are being launched in 2021 and two in 2022.
Compared with long-standing satellite sensors such as Landsat and Sentinel, SmallSat constellations offer reduced radiometric resolution, geometric fidelity, and spectral resolution, but the trade-off can be found in the vast volume of data they acquire. Planet Labs were one of the first organisations to mass produce multispectral SmallSats with their Dove satellites, which today provide global daily sub-3 m imagery. Since the first launch of their Doves in 2016, Planet Labs have expanded their market niche to releasing over 300 SmallSats at varying altitudes for improved spatiotemporal resolution. This has obvious benefits for hazard management where events can be sudden in their onset (such as lake outburst events (Miles et al., 2018b) or glacier surges (Rashid et al., 2020)), and where weather windows for successful observations may be short-lived. Studies of short-term (diurnal) variations in ice surface albedo (e.g. Naeimi et al., 2018) will also benefit from more frequent data capture (Altena and Kääb, 2017). Future optical satellites will improve both timeliness and flexibility of imaging – Pléiades Neo (planned launch in 2021) will revisit the same mid-latitude area up to 15 times per day (Airbus, 2020), while WorldView-Legion (2021) claims to be able to provide data to the user within an hour of the satellite being tasked (Maxar Technologies, 2020). Other upcoming constellations, such as UrtheDaily (planned for launch in 2022), promise to reconcile the long-standing trade-off between data quality and quantity, by producing sensors similar in radiometric resolution and fidelity to Sentinel-2 and capable of delivering daily, 5 m resolution imagery, for better forecasting of glacier hazards (Yan et al., 2017). These satellites are predominantly for-profit commercial missions, as opposed to open-source civilian missions (Copernicus, Landsat), and the data access to researchers or civilians for studies of the mountain cryosphere is as yet unknown.
Similar advances are being made with multisensor missions. OptiSAR is an upcoming constellation from UrtheCast that will launch eight optical and eight SAR satellites in tandem orbit pairs, capturing image pairs seconds apart (Fox et al., 2017). Onboard intelligence, with communication from the leading SAR satellite, will enable the optical satellite to only acquire over cloud-free areas to improve satellite efficiency (Beckett et al., 2017). Multisensor approaches such as this have already overcome inherent limitations of a single-sensor mission (Markert et al., 2018), providing further insights into surface mass balance (such as using SAR backscatter to monitor snowlines, glacier facies, and firn development) (Winsvold et al., 2018), as well as having the potential for maintaining coherence between image pairs by reducing their temporal baseline.
3.2 Radar sensors
The weight and power requirements of radar sensors have thus far limited the emergence of small SAR satellites, at least when compared with the rapid evolution of optical sensor constellations (Sandau et al., 2010). Micro-SAR satellites are often forced to compromise on antenna size and power output, resulting in lower overall quality (Seguin and Geudtner, 2018), and aperture widths that are ∼10% that of larger single satellites (Rosen et al., 2017). Indeed, small satellites are frequently ‘tasked’ to preserve power, meaning sudden-onset events such as avalanches, landslides, or GLOFs, may not be captured, and imagery showing conditions immediately preceding the event may need to be filled by alternative freely available data sources (Higman et al., 2018). Nevertheless, the next decade will deliver commercial constellations such as ICEYE, Capella Space, and SAR-XL, which promise to provide imagery at sub-daily repeat time, albeit with a possible compromise on image quality. Table 2 outlines upcoming radar sensors, in the context of other (current) satellite missions.
Radar satellites and their applications to monitoring the mountain cryosphere. *Denotes confirmed future mission not yet launched as of June 2021; †denotes mission that is no longer in operation.
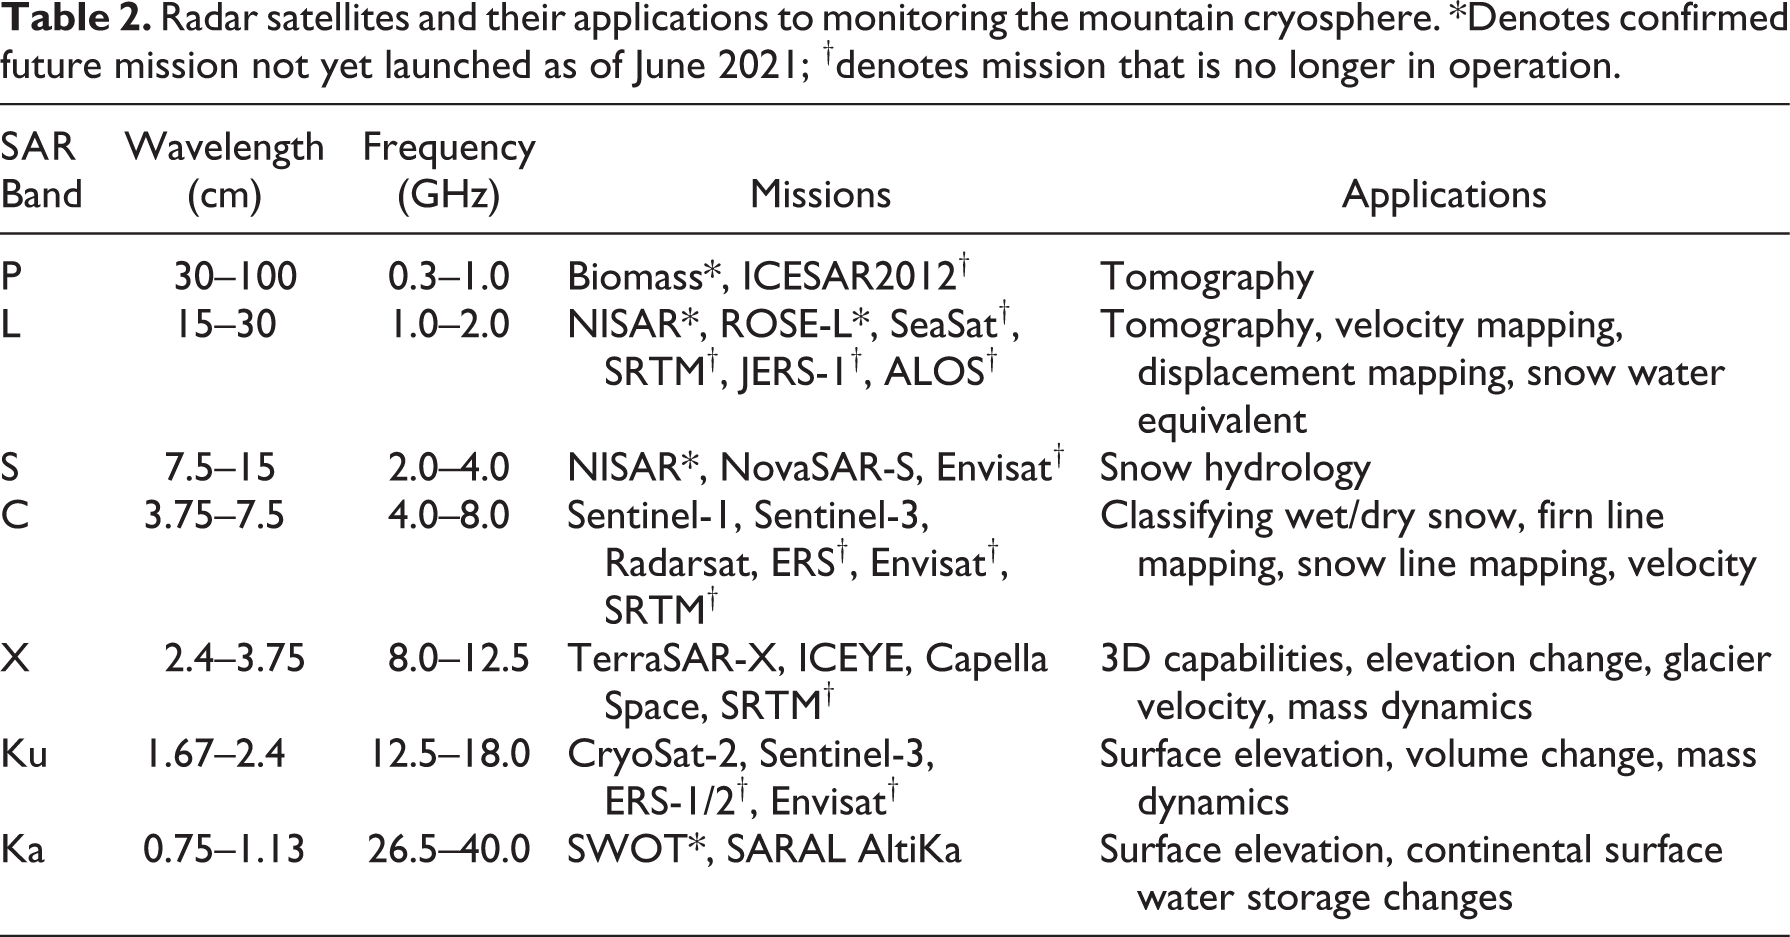
Proposed candidate missions to expand the Copernicus mission show that ESA will continue to focus on the cryosphere, but with dual-frequency missions (e.g. CRISTAL) designed for polar regions rather than mountain glaciers (Kern et al., 2020). In satellite-based radar systems, two upcoming L-band missions look to reintroduce subsurface imaging to the forefront of glacier remote sensing. ESA’s ROSE-L (Pierdicca et al., 2019) and NASA’s NISAR (Rosen et al., 2017) will complement existing radar missions by offering the ability to examine surface velocity and glacier mass balance with reduced temporal decorrelation from deeper penetration into the ice (Strozzi et al., 2008), as well as permafrost displacement and SWE. ROSE-L will work in association with other Copernicus missions (e.g. Sentinel-1) to offer new insights into the mountain cryosphere. For example, Sentinel-1 could delineate wet and dry snow, then ROSE-L could quantify the SWE of the dry snow (Davidson et al., 2019). The synergy of L-band and S-band sensors on board NISAR will allow for a more holistic view of glacier dynamics, focussing on glacier velocity and snow hydrology simultaneously. In a break from convention, these satellite sensors are being designed explicitly with mountain glaciology in mind and, as civilian missions, data will be freely available.
Developments in satellite altimetry have thus far mostly benefitted routine monitoring of ice-sheet surface elevations, where large measurement footprints and non-uniform repeat tracks can be compensated for, in contrast to mountain regions where the highly variable surface topography precludes robust interpolation between observations. The upcoming launches of Sentinel-3C and -3D, which will complete the Sentinel-3 constellation, include plans for higher resolution onboard tracking commands to capture meaningful data over mountain glaciers. With six laser beams to reduce the distance between ground tracks and a rapid pulse rate to measure elevation up to every 90 cm on the ground, ICESat-2 offers vastly more data than its predecessor. It will be challenged in mountainous environments with its 91-day repeat time and inability to penetrate clouds – potentially leaving significant data gaps. Initial data from ICESat-2 show that the satellite performs well over mountain glaciers (Figure 5), with high precision elevation measurements of the glacier surface. The upcoming Surface Water and Ocean Topography (SWOT) mission (2022) seeks to further innovate radar altimetry, but for the mountain cryosphere its application will likely be limited to low-resolution products (Biancamaria et al., 2016).
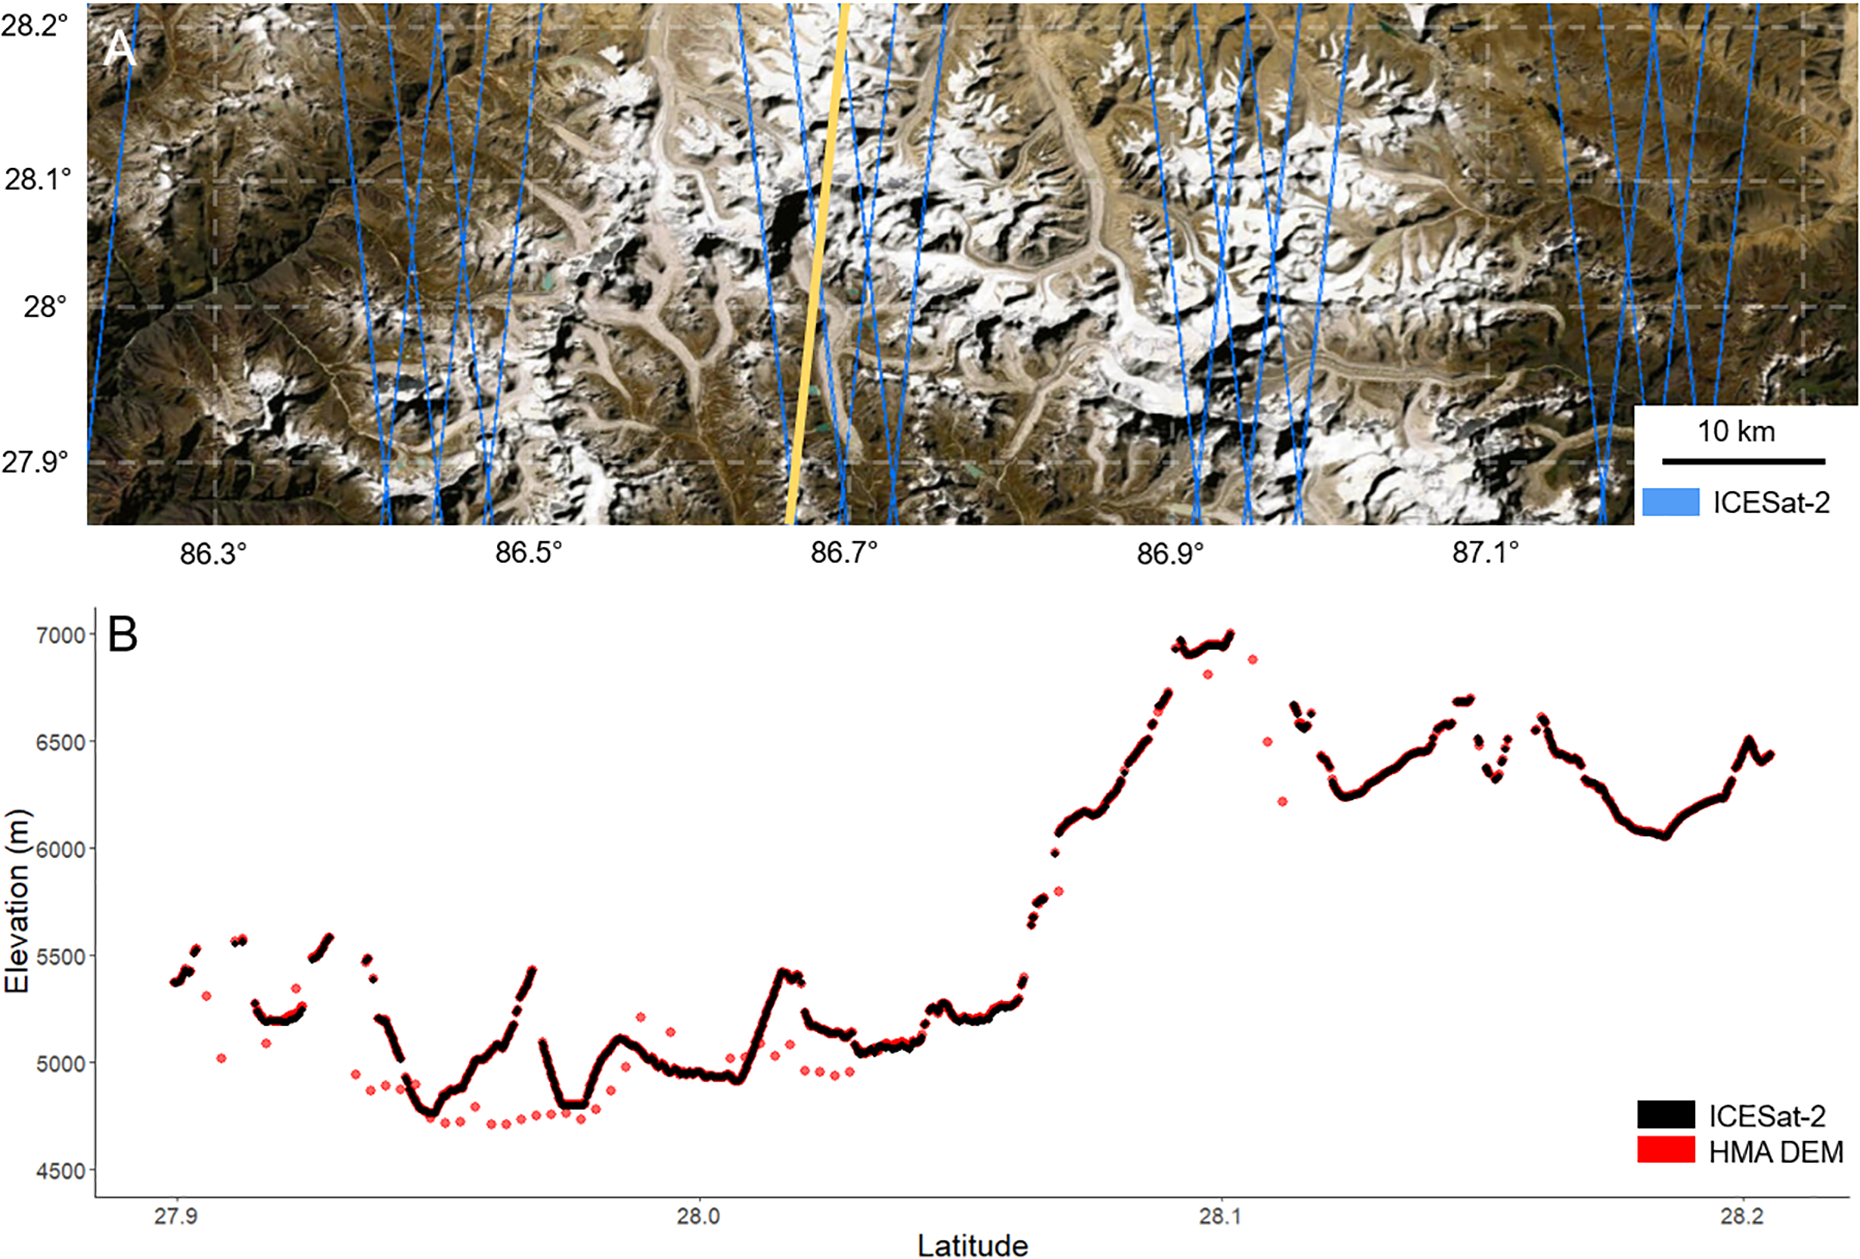
Comparison of elevation retrievals from ICESat-2 with those of the HMA-2 DEM (Shean et al., 2020) over the Everest region of Nepal: (a) available ground tracks of ICESat-2 data for the region, with the yellow track indicating data selected in below panel. Image from Google Earth and Maxar technologies 2020. (b) Comparison of ICESAT-2 ATL06 product relative to the High Mountain Asia 8 m DEM.
3.3 UAVs
The flexible nature of UAVs allows for custom-built mountable sensors to address site-specific research questions. Hyperspectral imaging from UAVs in other geoscience disciplines have shown success in producing structure-from-motion 3D models in over 100 spectral bands (Honkavaara et al., 2017). Over mountain glaciers, hyperspectral imagers on UAVs could be used to study contaminants and pollutants at a much higher resolution than has hitherto been possible. For example identifying the components of cryoconite (Di Mauro et al., 2017), the presence of organic matter, or the origin and impact of dust on albedo (Di Mauro et al., 2015) in a more efficient way than can be achieved from spot measurements. In landmine detection, ground penetrating SAR instruments have been mounted on UAVs to accelerate clearance (Schartel et al., 2018), which could be applied to measuring snow depth or characterising englacial conditions.
In theory, there are no technical limitations to the deployment of regularly repeating autonomous UAV surveys. UAVs have already been designed to return ‘home’ to a wireless charging pad when their battery runs low (Campi et al., 2019; Junaid et al., 2016; Junaid et al., 2017), and solar panels could keep a constant energy supply to a battery pad, with autonomous de-icing (Sorensen et al., 2015). With an onboard microcontroller to detect weather patterns, control flight paths, data acquisition, and transmission, UAVs could potentially be designed to conduct surveys completely independent of any pilot or physically present operator. Such an autonomous system would have obvious benefits where change is rapid and early warning of a developing hazard would be beneficial, although the legal obstacles to uncrewed flights in this way may become problematic as most countries look to tighten, rather than relax, their UAV regulations (Stöcker et al., 2017).
3.4 Other field-based innovations
The principles and main applications of photogrammetry are now well-established within the geosciences (Smith et al., 2016), allowing the reconstruction of 3D models from an array of 2D images, and the production of very high-resolution models (cm-scale) from off-the-shelf cameras (Giordan et al., 2020; James and Robson, 2012; Mallalieu et al., 2017). We envisage that the future of this technique will be in sensors built with low-cost microprocessors (Figure 6), and in its autonomy: from capture to subsequent processing for real-time 3D of the mountain cryosphere.
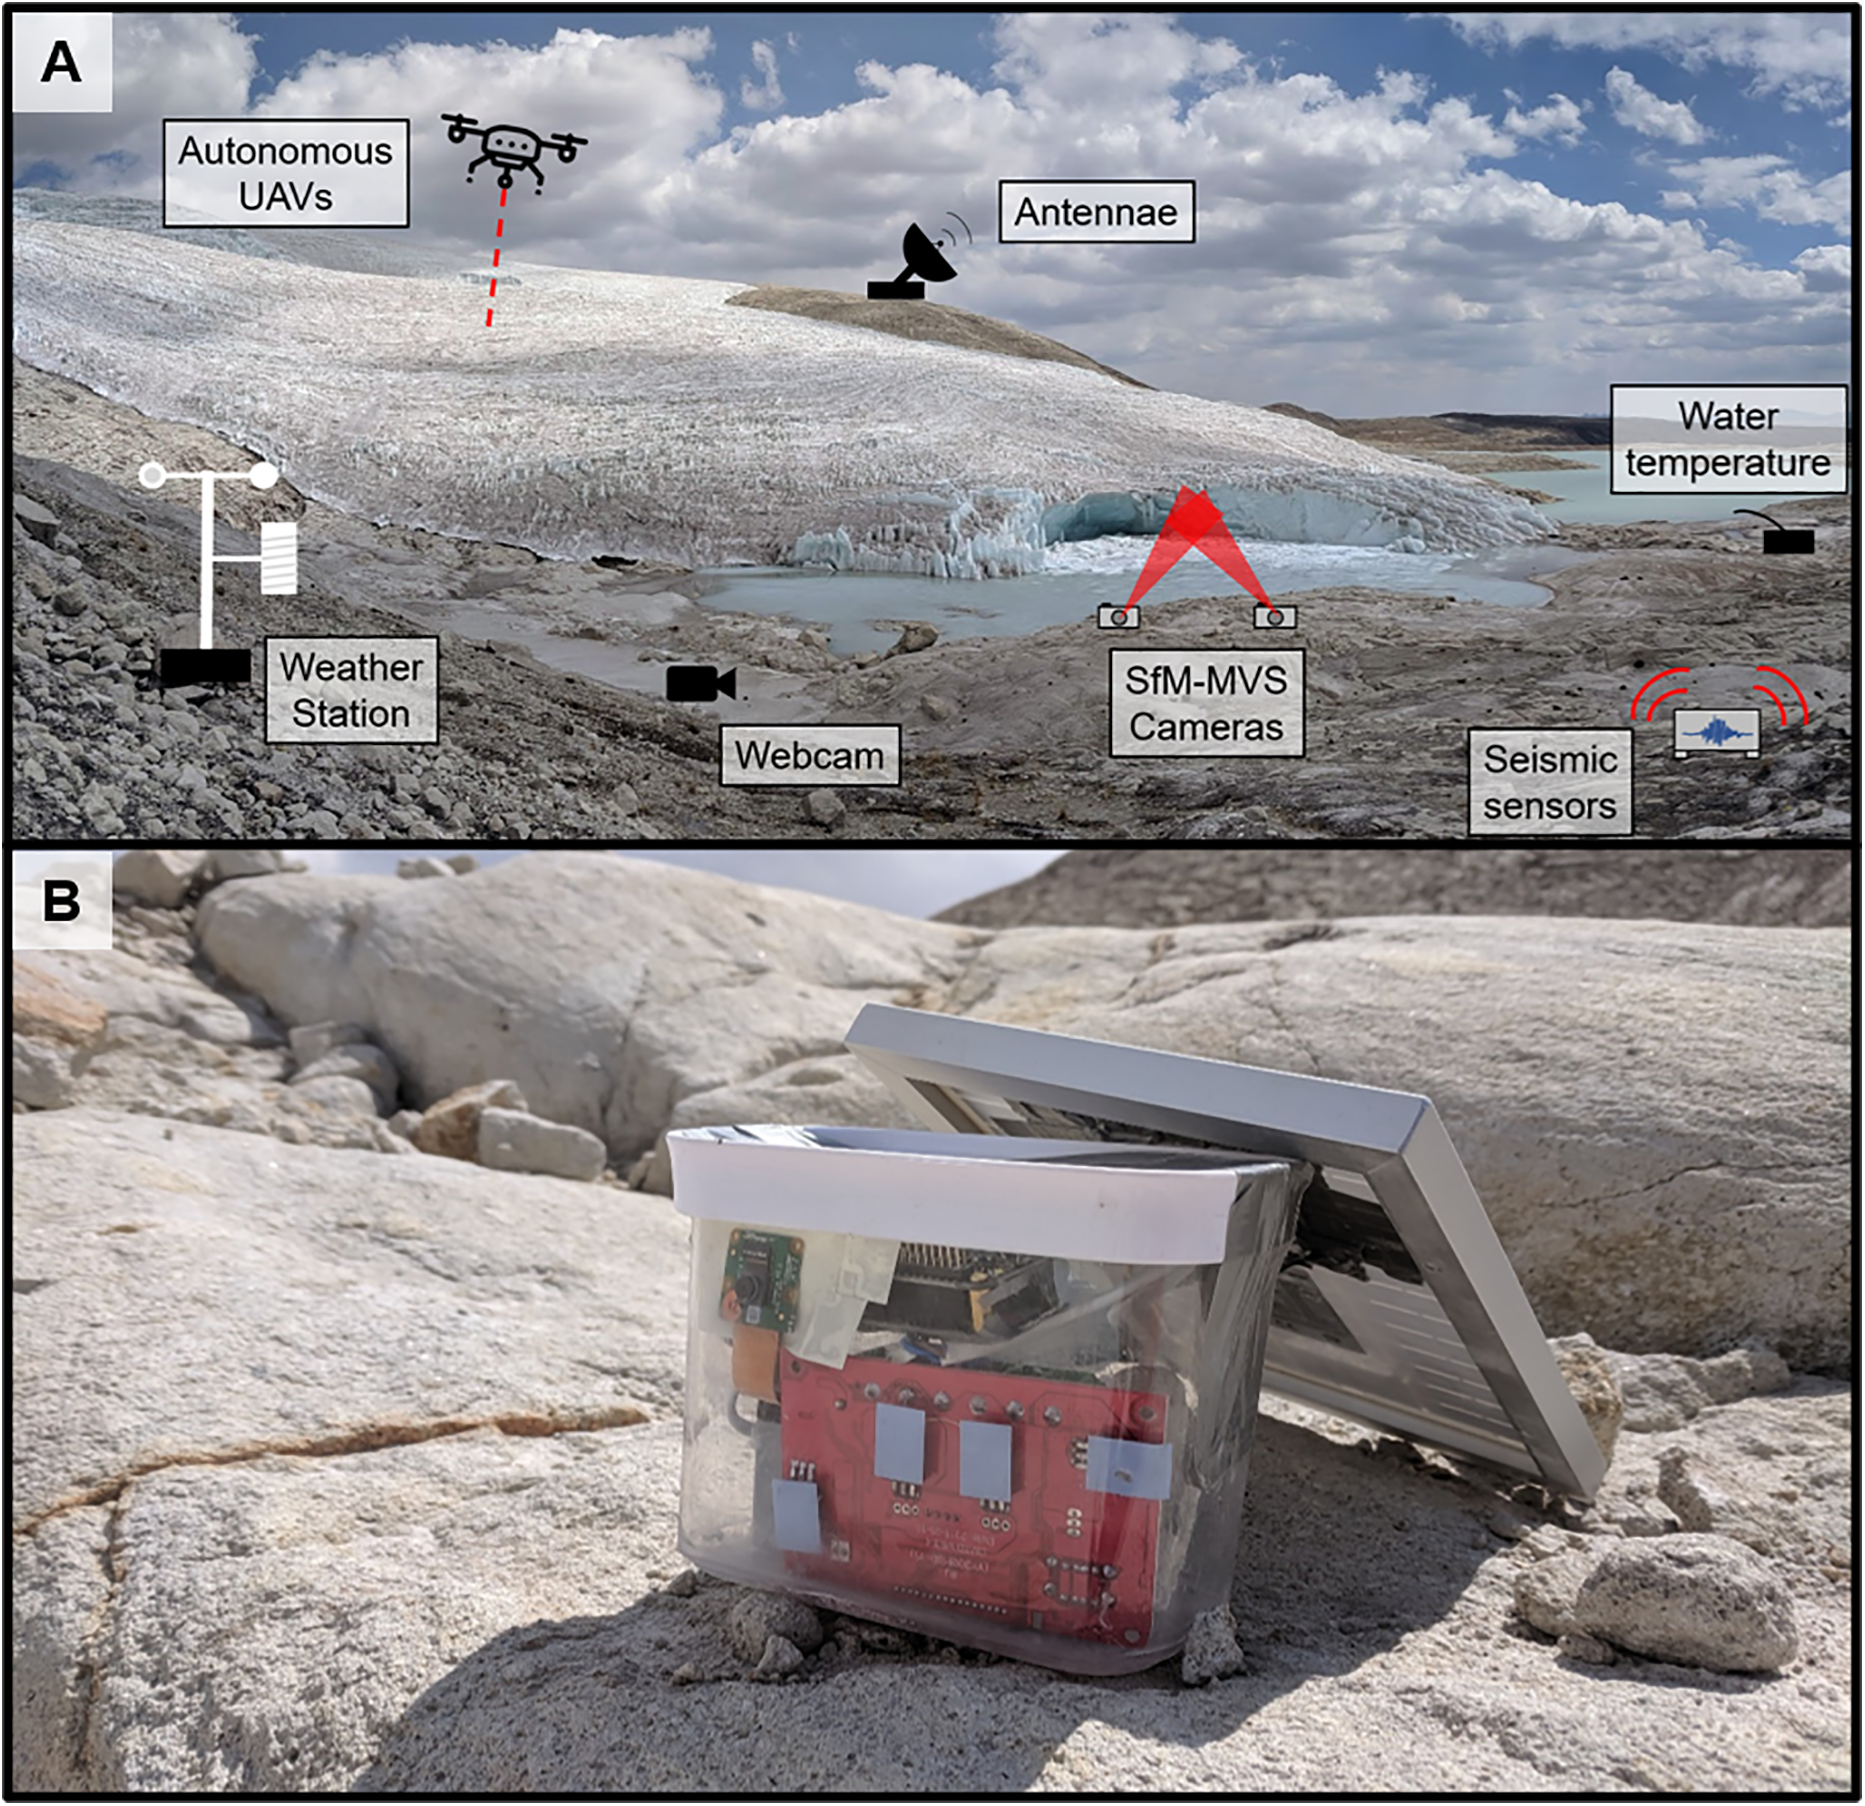
The potential of small low-cost sensors in mountain glaciology: (a) low-cost in-field remote sensing could be expanded with the use of low-cost sensors to include camera networks, weather stations, seismic stations, acoustic sensors and more communicating in a local network or connected to the internet through 4G/5G networks or satellite internet; (b) Raspberry Pi camera setup costing less than $USD 50 at a glacial margin at the Quelccaya ice cap, Peru.
As satellite internet expands coverage and connectivity in remote regions, and decreases in cost through the launch of constellations such as Starlink (SpaceX) and OneWeb, sensors that are left in situ will become routinely programmable such that they transmit recorded data autonomously for subsequent cloud storage and/or processing over satellite internet. Such technology already exists over cellular connections, but the lack of a suitable infrastructure in much of the mountain cryosphere currently makes this an unfeasible option. Autonomous structure-from-motion photogrammetry has been proven in studies of soil displacement (Eltner et al., 2017), landslides (Kromer et al., 2017) and rockfalls (Blanch et al., 2019), which indicates it could also be a lucrative line of investigation for glaciology. In a similar vein, webcam images from ski resorts have been used to create snow cover classification maps in the Alps (Portenier et al., 2020), removing the need for physical visits by researchers altogether.
Advances in robotics and robot design may offer insights into mountain glaciers that could open a significant new sub-branch of the discipline. Presently, the englacial system of a glacier remains somewhat of an enigma, with access limited to conduits that are safe and accessible enough for physical exploration (Gulley and Benn, 2007), using ground penetrating radar (Church et al., 2019) or the drilling of boreholes (Miles et al., 2019a; Miles et al., 2021). In the mining industry, robots and automated UAVs have been used to explore and map underground conduits (Mitchell and Marshall, 2017) – similar to the englacial systems of a glacier. Systems that make use of relay and ‘sacrifice’ robots enable constant communication, regardless of the complexity of the underground system (Cesare et al., 2015). While this technology is still in its infancy (Mitchell and Marshall, 2020), its adaptation for subsurface glacier exploration would make significant steps towards answering questions on the characteristics, dynamics and evolution of the hydrological networks that influence ice flow as well as the timing and magnitude of proglacial discharge (Miles, et al., 2019b). Sensors embedded in the ice via boreholes can also indicate surface melting, ice velocity, water pressure (Hart et al., 2019a) and (when reaching the bed) till deformation and basal icequakes (Hart et al., 2019b). Similarly, sensors deployed around an ice-dammed lake in Canada were used to infer its englacial hydrology (Bigelow et al., 2020).
IV Computational innovations to address research gaps
In many cases, knowledge gaps can be addressed using one or more of the data sources currently available to researchers and stakeholders. Here, we argue that computational innovations may create the biggest difference in the next decade of observing the mountain cryosphere (Gomes et al., 2020). We introduce some of the computational innovations that have driven the discipline in the last 5 years in order to assess their future trajectory. We explore how research gaps could be addressed with techniques, such as deep learning and cloud computing, and offer suggestions on future directions.
4.1 Cloud computing and big data
Cloud computing platforms, which allow for wide area geospatial analysis, offer a step-change in processing potential for the discipline as processing moves to the area of data storage. While cloud computing is not ‘new’, as high performance computing (clustering hardware together to boost computational power) has been used in remote sensing for decades (Lee et al., 2011), the differentiator of cloud computing shifts the financial burden of the hardware for such power. Freely available cloud computing interfaces, such as Google Earth Engine (Gorelick et al., 2017), Climate Engine (Huntington et al., 2017), pipsCloud (Wang et al., 2018), and Sentinel Hub (Sinergise, Ltd.) allow for batch processing and regional-scale investigations without compromising on the spatial resolution being studied (Figure 7). The platforms allow for spectral investigations, such as NDSI and NDWI (e.g. Kraaijenbrink et al., 2017; Zhang et al., 2018; Shugar et al., 2020), and tap into freely available archives such as Landsat, Sentinel, and SRTM, as well as user-imported data. Most importantly, the interfaces are designed to be user-friendly to appeal to the growing EO market (Denis et al., 2017) while also providing scope for complex analysis to suit a broad array of applications.
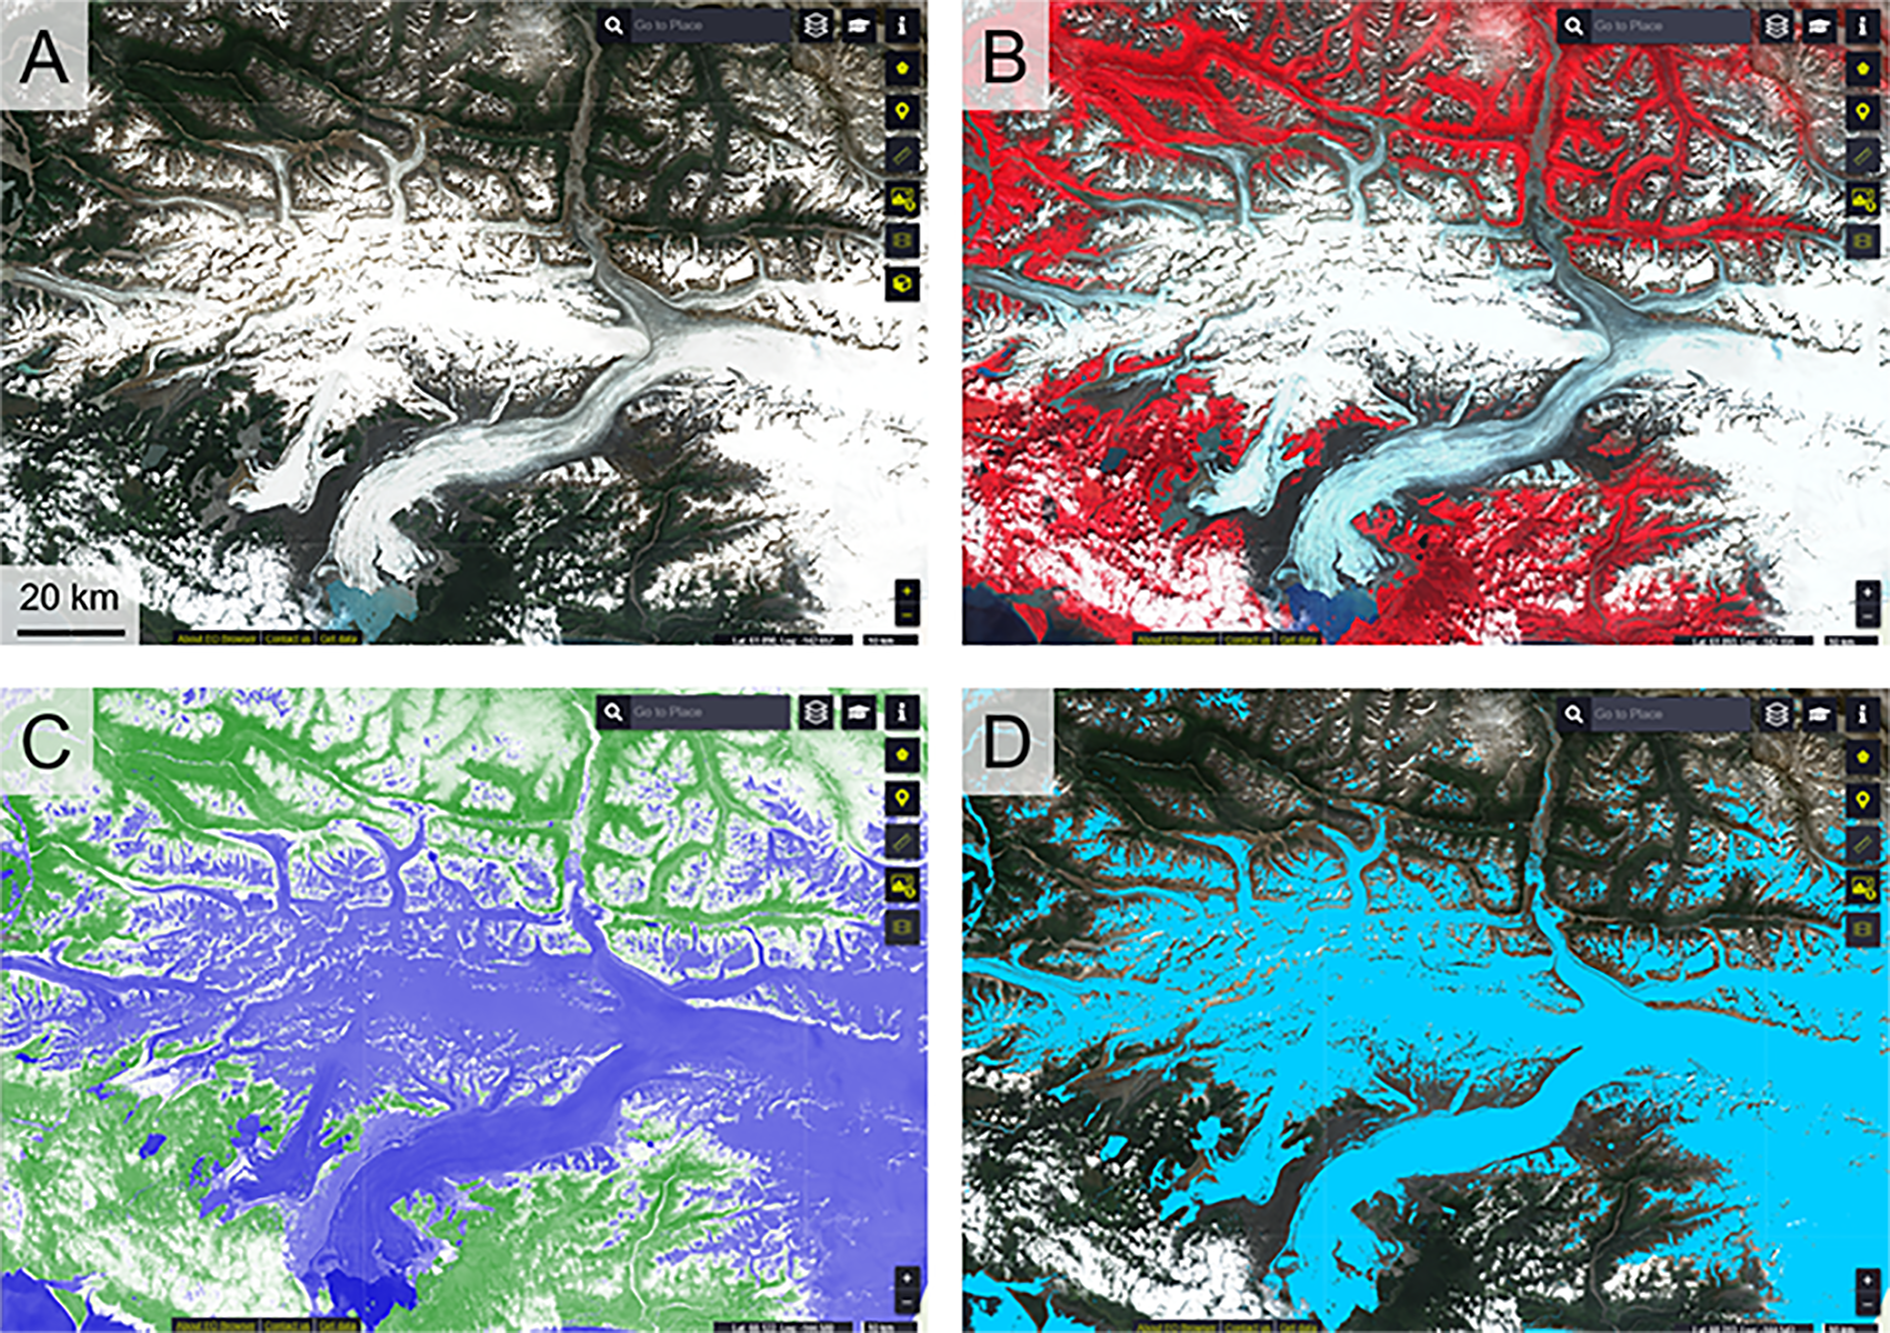
The EO Browser (https://apps.sentinel-hub.com/eo-browser/) allows analytical cloud computing of sentinel data in a user-friendly interface that can display (a) true-colour imagery, (b) false colour composites, (c) Normalised Difference Water Index, and (d) Normalised Difference Snow Index, and other analytical analyses. In this figure, sentinel-2 data are displayed over Bering Glacier, Alaska. Such platforms open remote sensing of the high mountain cryosphere to stakeholders, non-governmental organisations and mountain communities with little prior experience.
The potential applications of cloud computing to accelerate research in the mountain cryosphere are vast. Autonomously, and rapidly, large volumes of near real-time satellite data can be downloaded and processed into a user-friendly output for management, stakeholders and communities to digest. Research can be conducted at a regional scale benefiting from petabytes of data to inform international policy by combining multispectral imagery, elevation data, climate modelling and ice thickness data. For example, in the Himalayas, this approach has been used to predict the future of all glaciers under a 1.5°C warmer climate (Kraaijenbrink et al., 2017). Conventional computing infrastructure is inefficient at storing, processing and transferring such large volumes of data. A particular benefit for the mountain cryosphere is that cloud masking and mountain shadowing of optical imagery is easily incorporated into the analysis flow chain for accurate digitisation of glacial lakes (Chen et al., 2017; Shugar et al., 2020) and calving fronts (Lea, 2018) at a global scale. Vast quantities of Sentinel-1 SAR imagery can be ingested for change-over-time studies, for example, to map glacial lakes across the Tibetan Plateau (Zhang et al., 2020) or assess snowmelt across the Alps and Iceland (Nagler et al., 2016) every 6 days. Furthermore, the advent of freely available cloud computing, together with public data and extensive documentation, means processing does not have to be limited to funded scientists or highly trained specialists.
Increased synchronisation between EO data can benefit mountain glaciology via open-source pipelines and packages that can be embedded into coding platforms and linked to cloud computing for performance. While these packages and pipelines may lack a user-friendly interface, they have the potential to answer unique research questions. The AMES Stereo Pipeline by NASA (Beyer et al., 2018), for example, is now widely used to produce 3D stereo data from thousands of ASTER images for regional glacial mass balance reconstructions (Brun et al., 2017; Dussaillant et al., 2019; Menounos et al., 2019; Shean et al., 2020). Over the next few years, similar free packages will provide greater accessibility to satellite data. For example, sPyMicMac (McNabb et al., 2020) will automate the pre-processing of nuances from the HEXAGON US reconnaissance mission from the 1970s, providing easier access to these historic data for quantifying the regional mass balance over 50 years ago. PyTrx (How et al., 2020) will ingest terrestrial time-lapse data and perform calibration, registration, georectification, feature tracking and change detection to speed up monotonous pre-processing of in situ camera data. ITS_LIVE (NASA; Gardner et al., 2018) will continue to create glacier velocity products, as it has done from the 1980s to present day, at high temporal frequency by collating measurements from multiple sensors (e.g. data from the Landsat and Sentinel-1 missions are all used). Each of these freely available packages either performs their analysis using cloud computing, or supports adaptation into a cloud computing environment in order to efficiently process vast volumes of data. Over the mountain cryosphere, cloud computing could therefore lead to near real-time processing of ice surface dynamics or detection of hazardous events.
4.2 Artificial intelligence and machine learning
The broad field of AI includes machine learning (ML) (whereby systems autonomously learn from themselves without prior programming), which is a powerful tool in solving the various challenges of EO. Deep learning (DL) algorithms are a subset of ML, using multiple layers of neural networks to increase their complexity and accuracy (Hoeser and Kuenzer, 2020; Zhu et al., 2017). For the mountain cryosphere, ML and DL models can be applied to classification, feature spotting, automatic mapping, and visual interpretation tasks as well as time series reconstruction and simulation (Bolibar et al., 2020; Brenning, 2009; Lary et al., 2016; Paul et al., 2004; Zhu et al., 2017). The application of DL algorithms for the cryosphere is still scarce. Only 2% of studies dealing with DL-based image segmentation and object detection have investigated cryosphere-related topics (Hoeser and Kuenzer, 2020). This highlights the unused potential of DL-based applications on the mountain cryosphere (Figure 8).
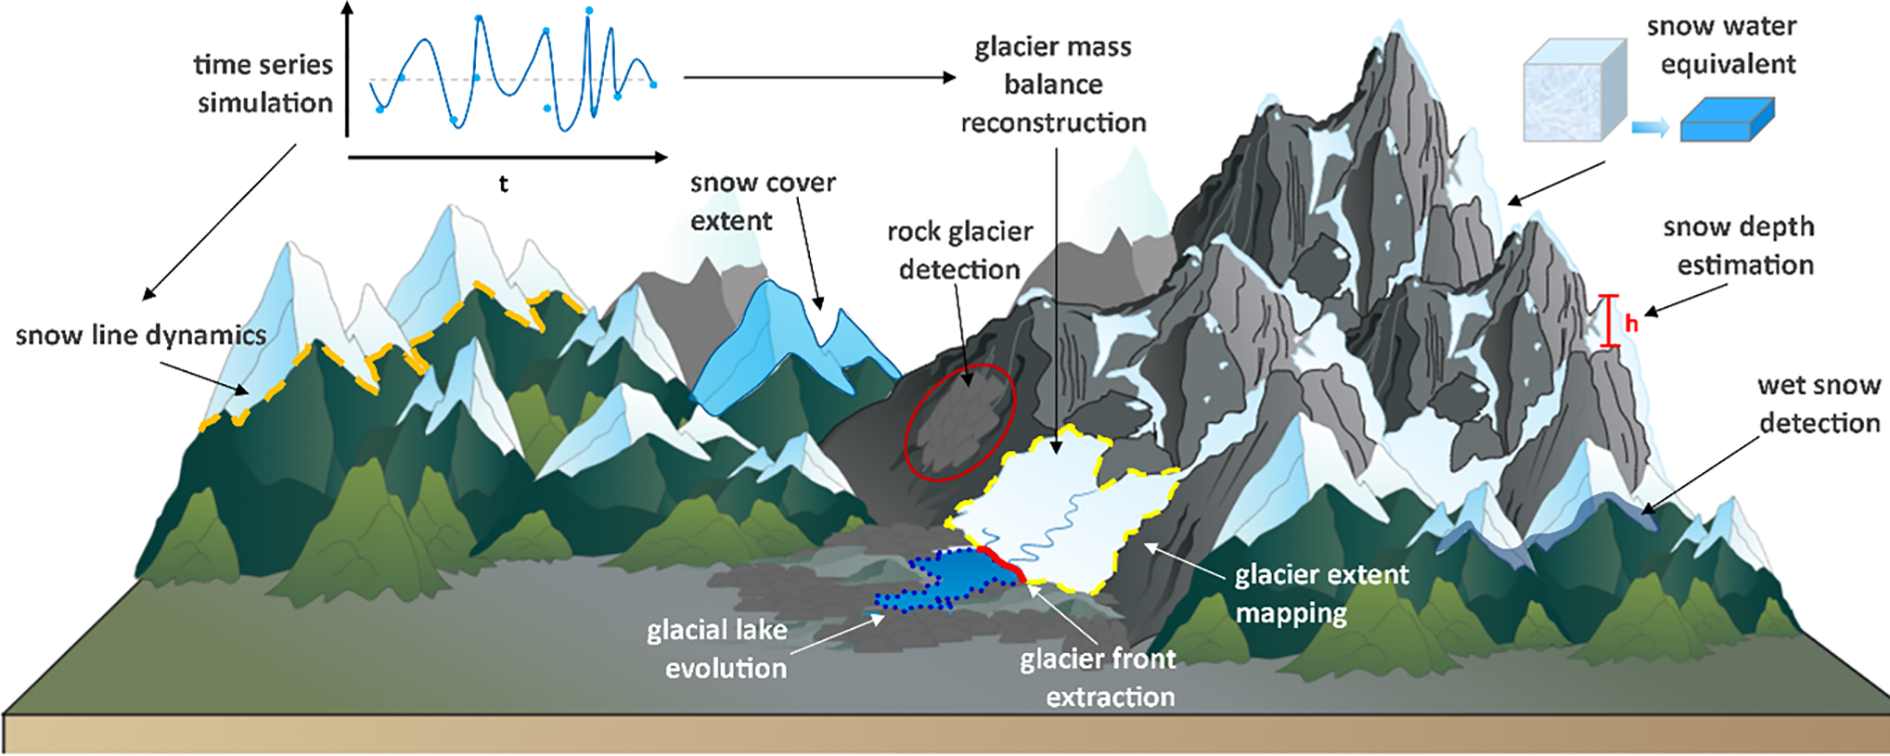
Potential artificial intelligence applications to the mountain cryosphere.
For the first time, ML has allowed classifying wet and dry snow in SAR data by applying a random forest classifier. High classification accuracies (F1-score over 90%) in mountainous areas were achieved regardless of underlying land cover (Tsai et al., 2019b). Snow cover mapping was improved by creating a hybrid model including DL (Alex-Net), ML (random forest) and hand-crafted (manually designed) features. Classification accuracies of 98% were reached based on medium-resolution optical and radar Sentinel-1/2 images when combined with a DEM (Nijhawan et al., 2019). Mapping snow cover extent from high-resolution optical imagery was performed by Guo et al. (2020). They used pre-trained weights of a DeepLabv3+ model for Landsat-8 true-colour imagery to create accurate results with a small dataset of GaoFen-2 imagery. In addition to classification tasks, a random forest regressor can be applied to reconstruct incomplete time series. Current challenges for snow-related AI applications include quantifying the SWE and estimating the snow depth (Kopp et al., 2019; Odry et al., 2020).
ML applications on mountain glaciers focus on the determination of the glacier extent by either extracting the calving front (Baumhoer et al., 2019; Cheng et al., 2020; Mohajerani et al., 2019) or detecting the glacier boundary of debris covered glaciers (Khan et al., 2020; Nijhawan et al., 2018; Xie et al., 2020). In addition, DL algorithms can be used to simulate time series. For example, Bolibar et al. (2020) modelled glacier evolution by simulating glacier-wide surface mass balance time series by an artificial neutral network. However, even common and simple ML algorithms (e.g. random forest) can yield better results than DL-based approaches, emphasising the importance of choosing the right AI model for each specific task. In glaciology, the potential that DL can offer, in automation, efficient processing, and removal of traditionally laborious manual tasks, is slowly being realised and still has unexploited potential.
Intelligent learning does not have to be solely analytical. Embedding AI into sensor design could create powerful tools for in-field glacier monitoring. With data transmission via high-gain antennae (e.g. Carvallo et al., 2017) or satellite internet, we hypothesise that low-cost sensors, embedded within an AI framework, could revolutionise mountain glacier monitoring, as it has done in many other geoscience disciplines (Chan et al., 2020). For example, such sensors could include Arduinos or Raspberry Pis (Vujovic and Maksimovic, 2014) that could act as a webcam, capture infrared images at night, detect thermal signatures, record acoustic events, detect ground displacement or tremors from calving, track velocity with GPS, or communicate with satellites for real-time ground-truthing. Each bespoke sensor can ‘talk’ intelligently to another, such the network could respond to real-time changes such as calving events, surges, or supraglacial pond drainage. In the wider literature, these intelligent systems have been called the ‘Internet of Things’ (Alzahrani, 2017; Gubbi et al., 2013; Khalil et al., 2014). There are vastly more complex logistical challenges in the mountain cryosphere, but none of these individual ideas are new. The interconnectedness, intelligent design, and autonomy that can be offered by such an approach marks a step-change in our understanding of the geomorphic processes currently shaping the world’s mountain environments.
4.3 Open science
One of the most limiting factors in the use of remote sensing data over mountain glaciers is data availability and, even where data are available, they are not necessarily accessible (Pope et al., 2014). Hazard assessment plans produced for the mountain cryosphere require routine and open information on landslides, slope stability and future glacial lake expansion (Ambrosi et al., 2018; Emmer and Vilímek, 2013; Kirschbaum et al., 2019; Linsbauer et al., 2016; Schaub et al., 2013). Such data can provide a critical role in informing planning decisions being made by stakeholders in mountain regions. An increasing number of research programmes are committing to making their outputs open access, such as NASA’s High Mountain Asia Program, which combines a variety of remotely sensed derivatives (DEMs, glacier thickness, landslide inventories, mass balance) with in situ data (wind, precipitation, temperature, irradiance) for free download through an open access portal (https://nsidc.org/data/highmountainasia). This follows a precedent set by civilian programmes (e.g. Landsat and Copernicus) that public funded missions should be open source at delivery.
Citizen science programmes have great potential to radically transform remote sensing of the mountain cryosphere (Carey et al., 2016). Strengthening local collaborations is vital for the successful mitigation of hazard risks and adaptation to the impacts of climate change in mountains (Huggel et al., 2020; Nussbaumer et al., 2017). Knowledge should be co-produced to better understand the concerns and identifying adaptation solutions that work best for each community (Klenk et al., 2017). This is particularly true of remote sensing work, where it is easy to perform and publish data analysis without ever entering the place we study. There is a dearth of studies that combine remote sensing data over mountain glaciers with local knowledge, and we should learn from where this has proved effective in other disciplines – such as landslide risk management (Holcombe et al., 2021), land degradation analysis (Yiran et al., 2012) and ecology (Eddy et al., 2017).
Remote sensing data require in situ calibration and can lead to erroneous results and damaging policy suggestions if relied upon in isolation (such as NASA’s infamous false reporting of imminent danger at Lake Palcacocha, Peru; Kaser and Georges, 2003). At the same time, many DL algorithms require a large training set (Zhang et al., 2019), which is often produced manually. Engaging citizens to classify features works well in disaster management projects such as Missing Maps (Scholz et al., 2018). Geotagged photos from social media can also be harvested for damage assessment following flood events (Cervone et al., 2016), identifying tourism and the popularity of protected sites (Walden-Schreiner et al., 2018), assessing land cover change (Xing et al., 2017) and reconstructing 3D structures (Themistocleous, 2017), each of which could be applied to the mountain cryosphere. In mountain glaciology, local communities are working alongside researchers in setting up basic equipment such as webcams (Portenier et al., 2020), and mountaineers are increasingly collecting data and observations to report on changes (Watson and King, 2018) as well as to assess the true risk of hazards observed from space (Carey et al., 2016).
Interactive data viewing portals can be an effective way to showcase research outputs, rather than static scientific figures that may alienate non-specialists. Initiatives such as the GLIMS Glacier Viewer (http://www.glims.org/maps/glims), ArcGIS Living Atlas (https://livingatlas.arcgis.com/en/home/), Sentinel Hub (https://apps.sentinel-hub.com/eo-browser/), or NASA ITS_LIVE (https://nsidc.org/apps/itslive/; Gardner et al., 2018) are easy to access, understand and extract information from. When this is the case, data are more readily used (Pope et al., 2014) and offer an effective conduit for engaging stakeholders outside of academia.
V Summary
In this review, we sought to provide an assessment of the current capabilities of remote sensing over the mountain cryosphere, with a view to identifying future avenues of research. Remote sensing has been crucial to understanding and monitoring the mountain cryosphere. Satellite missions have been used to monitor lakes, quantify ice melt, classify snow and detect natural hazards. Civilian missions offer science-grade sensors with long archives, while newer commercial constellations offer rapid revisit time at a higher spatial resolution. In the rapidly expanding sector of EO satellites, innovation in sensor design over the next decade will produce higher quality data, expand the offering of complementary sensor technology, and create sub-daily repeat periods. Such vast quantities of data require cloud computing infrastructure to efficiently process, and AI will shape the next decade of processing as monotonous tasks are replaced by automation. DL will further the potential of AI by drawing upon the expanding pool of data available to address outstanding research questions in glaciology. The expanding breadth of sensor options available to UAVs is also now beginning to be realised in mountain glaciology. Furthermore, low-cost sensors could create affordable science for community monitoring systems. It is imperative that data and processing capabilities continue along the road to becoming freely available, so that communities who will be adversely affected by future changes to the mountain cryosphere can use remote sensing as an effective tool in planning their response.
Supplemental Material
Supplemental Material, sj-xlsx-1-ppg-10.1177_03091333211023690 - Remote sensing of the mountain cryosphere: Current capabilities and future opportunities for research
Supplemental Material, sj-xlsx-1-ppg-10.1177_03091333211023690 for Remote sensing of the mountain cryosphere: Current capabilities and future opportunities for research by Liam S Taylor, Duncan J Quincey, Mark W Smith, Celia A Baumhoer, Malcolm McMillan and Damien T Mansell in Progress in Physical Geography: Earth and Environment
Footnotes
Declaration of conflicting interests
The author(s) declared no potential conflicts of interest with respect to the research, authorship, and/or publication of this article.
Funding
The author(s) disclosed receipt of the following financial support for the research, authorship, and/or publication of this article: LST was funded by the NERC SPHERES Doctoral Training Partnership (NE/L002574/1).
Supplemental Material
Supplemental material for this article is available online.
References
Supplementary Material
Please find the following supplemental material available below.
For Open Access articles published under a Creative Commons License, all supplemental material carries the same license as the article it is associated with.
For non-Open Access articles published, all supplemental material carries a non-exclusive license, and permission requests for re-use of supplemental material or any part of supplemental material shall be sent directly to the copyright owner as specified in the copyright notice associated with the article.