
Abstract
Social housing across Western Europe has become significantly more residualised as governments concentrate on helping vulnerable households. Many countries are trying to reduce the concentrations of deprivation by building for a wider range of households and tenures. In England this policy has two main strands: (1) including other tenures when regenerating areas originally built as mono-tenure social housing estates and (2) introducing social rented and low-cost homeownership into new private market developments through planning obligations. By examining where new social housing and low-cost home ownership homes have been built and who moves into them, this paper examines whether these policies achieve social mix and reduce spatial concentrations of deprivation. The evidence suggests that new housing association development has enabled some vulnerable households to live in areas which are not deprived, while some better-off households have moved into more deprived areas. But these trends have not been sufficient to stem increases in deprivation in the most deprived areas.
Introduction: Social housing and social deprivation
For at least three decades after 1945, governments in much of Western Europe built large public-sector housing estates to alleviate housing shortages and accommodate broad groups of society including full time working households. These estates, while mono-tenure, were initially what today we call mixed communities (Whitehead, 2003). However across Europe, as housing shortages were overcome, incomes rose, private-sector opportunities expanded and political systems changed, the emphasis moved to accommodating more vulnerable, lower income households less able to obtain adequate market housing (Harloe, 1995; Malpass, 2014; Scanlon and Whitehead, 2008; Whitehead and Scanlon, 2007). The result has been concentrations of deprivation and social exclusion in social housing areas (Rowlands et al., 2009; Scanlon et al., 2014; van Kempen et al., 2005). These trends exist in countries where policy has continued to provide for a full range of households, such as the Netherlands and Sweden, and those where local and management pressures tend to favour secure households, as well as in countries where the emphasis is on housing the poorest. This suggests that the trends are not just a matter of policy but also an outcome of demand, with those able to pay increasingly opting for market housing.
Across Europe there has been concern about these concentrations of deprivation in social housing, especially as the housing stock is often deteriorating and poorly serviced and sometimes in inaccessible areas. However there are only two ways to reverse this trend – either allocate to less deprived households, or separate tenure and spatial deprivation by creating mixed tenure developments meeting a wider range of needs. Even so, as Meen and colleagues (2005) suggest, using tenure effectively to offset the strong trends towards segregation depends on achieving a threshold high enough to sustain the more dynamic environment and providing services and infrastructure to retain more economically active households.
A number of European countries have introduced policies to generate more mixed populations in regeneration areas at the same time as improving economic opportunities in these areas. Germany, France and the Netherlands have placed great emphasis on this, partly because their large-scale post-war developments need redeveloping to achieve contemporary standards. Ensuring more mixed-income communities has often been seen as a prerequisite for the success of this new investment (Scanlon et al., 2014).
Some countries have also introduced planning legislation to ensure that new market developments include affordable housing. In Germany and the Netherlands this has often been achieved by public acquisition of development land, providing the infrastructure and then disposing of the serviced land to developers with specific requirements about what can be built, including social housing (Crook and Monk, 2015).
England as a case study
The development of post-war social housing in England has been no exception to this European pattern. However, policy which is more centralised and prioritises accommodating poorer households has been more entrenched than in much of continental Europe.
Until the 1980s, local authority tenants were a broad cross-section of English households, so concentrations of social housing did not generally mean concentrations of low-income and deprived households (Benthan, 1986; Holmans, 1970). But over time the tenure became increasingly residualised, as better-off households moved into owner-occupation, and policy emphasised meeting priority needs (Forrest and Murie, 1983, 1990; Hills, 2007; Pearce and Vine, 2014). And while the Right to Buy meant greater tenure mix in many social housing areas, the population mix, especially in poorer quality urban areas, was often not significantly modified.
More recently, successive governments have acted on the understanding that areas of concentrated deprivation negatively affect people’s life chances and that one way forward is to build more mixed-income communities that can attract and retain a wider range of household types, avoiding segregation by mixing dwelling types and tenures (Cabinet Office, 2005; Glossop, 2008; Monk and Whitehead, 2010).
There have been two main policy approaches, one aimed at reducing existing concentrations of deprivation and social housing and the other at building new mixed tenure developments. The first involves regenerating existing estates, generally following experience in Europe quite closely to create mixed tenure and use. The second, which aims to mix tenures in new developments, requires private developers to provide some affordable homes. In both approaches housing associations are critical to success because their investment and allocation decisions determine the outcomes with respect to the provision of social and other affordable housing.
With respect to the first approach, local authority dwellings in regeneration areas have been demolished and replaced with new social rented homes together with low-cost homes for sale, market housing and commercial development. Beginning in the early 1990s, this policy was initiated by local authorities, but subsequent central government policy endorsed it (DCLG (Department of Communities and Local Government) 2010, 2014; DETR, 2000; ODPM, 2003). More recently greater emphasis has been placed on economic growth by increasing the linkages with welfare and employment support and securing more jobs (DCLG, 2011a, 2012). Ownership and finance are critical. Local authorities and their partners are the landowners but need finance to make schemes viable. Introducing private development increases projects’ overall value and cross-subsidises the affordable housing and other community infrastructure. Higher replacement densities ensure at least the same level of social rental provision as before and a different mix of dwelling types and sizes (usually more small flats), and therefore the likely mix of occupants. The introduction of commercial activity makes it more attractive to better-off households (Ferrari, 2007).
The second approach involves local planning authorities negotiating S106 planning agreements with private developers to provide some homes for social rent and low-cost home ownership (LCHO) on market sale sites, thus bringing lower income households into more affluent areas. Government policy from the late 1980s endorsed this way of securing more affordable homes with less government grant and creating more mixed communities (Crook and Whitehead, 2010; DCLG, 2011b). Agreements reduce site profitability and land value and implicitly enable cross-subsidy to affordable housing and infrastructure. Agreements are usually specified in numbers terms and tend to favour lower-subsidy LCHO and smaller units. They may also modify the types and sizes of new market housing that developers provide.
By 2006–2007, provision through S106 had become the main way of securing affordable housing in England, accounting for 65% of newly completed affordable homes. The LCHO proportion had by then increased to over 40% (Crook and Monk, 2011) and subsequently to 48% by 2013–2014. 1 Thus a high proportion of new affordable homes are now in areas where there is demand for new market housing.
The main government objective with respect to these policy strands has not been to ensure mixed communities, although both approaches assume that a wider range of tenures and income groups would lead to lower concentrations of deprivation (Livingston et al., 2013; Sautkina et al., 2012). In the regeneration approach, the core reason for the policy is financial – market housing and commercial activity are necessary to make the projects viable. In new developments the core rationale has been to achieve greater value for money from government grants and to increase the quantity of affordable housing that can be achieved.
Potential outcomes from the two approaches
The regeneration approach relies on four main factors: increasing densities; generating a mix of unit types to attract a wider range of households; encouraging businesses on the basis of a larger and somewhat more affluent consumer base and improved infrastructure; and, most importantly, making enough from selling land to market players to make the project work and cross-subsidise the social housing. The affordable housing element helps to provide up-front money but also requires the housing associations to take risks that they will be able to sell the LCHO element and recycle funds to support further development. Most importantly, success depends on the economic environment and many regeneration schemes run into trouble when the economic cycle turns against them.
The new-build model is based on a much more straightforward model in which planning constraints and S106 agreements generate ‘planning gain’. This value can then be transferred from the landowner to other uses, notably local infrastructure and affordable housing, as long as clear planning policy enables developers to bid lower prices for the land to reflect the costs of the planning requirements. The process is market led – so it is up to developers to decide whether they are able to sell the market housing and to negotiate agreements that maintain scheme viability.
Success in housing terms is defined first by introducing social and low-cost home ownership alongside market provision in new developments and market and low-cost home ownership alongside social rented housing in regeneration schemes. Second, it is defined by a significant mix of household and income groups gaining access to this housing. Evidence of decreasing deprivation in areas of traditional concentrations of social housing and deprivation would be a further indicator of success.
The research
The questions
Our research questions follow directly from the measures of success identified above. They include:
Where were new housing association homes being built and have the locations changed over time?
Were a range of tenures made available in areas where new and regeneration developments took place?
What types of household gained access to social and LCHO housing in these areas?
Is there any evidence of changes in deprivation in these areas?
The evidence base
We gathered data about the location and types of new developments, who moved into the new homes and changes to deprivation in the areas. The spatial evidence was collected at the small geographical scale of 100 m grids (i.e. hectare cells). This is because housing associations’ individual developments tend to be small (on average 20 dwellings) and our core questions are about how that new investment modifies the specific localities. The alternative of larger scale census tracts would often contain several neighbourhoods with different socioeconomic make up. There were five stages in our evidence gathering and analysis (Crook et al., 2011).
Stage 1: Spatial scale for analysis
While census lower super output areas (LSOAs) with average populations of 1000 are the de facto statistical geography in England, they are too variable in scale for our purposes. Where densities are lower, such as peri-urban and rural areas, they cover large geographical areas. Fringe areas of cities with very sharp ‘edges’ (e.g. Birmingham and Sheffield) and housing schemes bordering industrial areas tend also to have large LSOAs. Because these are often the areas with S106 agreements and regeneration projects, it was important to control for the ‘bigness’ of LSOAs so that we could better understand where the deprivation and new housing was located. Equally, the statistical problems of using a system of arbitrary zones such as LSOAs (i.e. the Modifiable Areal Unit Problem) are not trivial (Openshaw, 1983). To mitigate these problems we interpolated data produced at the LSOA level within the LSOAs using information on the precise locations of all residential dwellings, to generate equal-sized hectare-square areas which then formed the basis of our analysis.
Stage 2: An index of deprivation
A bespoke deprivation index was constructed drawn from the last four population censuses (1981, 1991, 2001 and 2011).
There were two challenges in constructing the index. First, the overall level of deprivation in England has declined so that the base against which areas can be benchmarked is itself constantly shifting. To address this, we used a composite definition of deprivation similar to that developed in 1983 based on the 1981 Census (DoE, 1983). More recent developments in the measurement of deprivation such as those reflected in the 2010 English Indices of Deprivation (DCLG, 2011c) take account of a wider range of spatial measures such as access to services, as well as administrative micro data that permit the estimation of more nuanced proxies for household income. However, such indices cannot be compared over time and therefore are of comparatively limited value in tracking changes in the spatial pattern of deprivation. In contrast, our approach was to combine a range of standard scores from the census data 2 to generate a composite z-score 3 taking account of the spatial coincidence of relevant individual components and thus a composite index on the same base. This allows changes in deprivation to be measured over the three decades. 4 Hectare cells were scored relative to the mean calculated over all the years together. Thus a score of 0 would indicate that the cell was average across space and also across time, i.e. it was ‘average’ in England across the three decades. As average real income increases over time deprivation scores generally fall and the index improves – although not everywhere. However, the average of all cells in any given year is not zero, because they are scaled with reference to the pooled data.
The second challenge is that the geographic definitions of the census tracts 5 used in each of four censuses were different. To address this, we assigned the composite measures to the hectare cell grid which remained invariant through time and calculated deprivation scores for each cell on the grid for 1981, 1991, 2001 and 2011 assuming that the distribution of deprivation simply reflected the distribution of all households. The allocation of composite scores to hectare cells used a dasymetric areal interpolation (see Eicher and Brewer, 2013 for a review), which reflected information on the underlying spatial distribution of households within census tracts, as proxied by using the Postcode Address File (PAF) at the 100 m resolution. Alternative assumptions (e.g. that it was distributed in accordance with the location of social rented units), by contrast, made no material difference to the results.
Stage 3: The location of new housing association homes
To find where new homes were built by housing associations we used the Homes and Communities Agency’s (HCA) 6 Investment Management System (IMS), which provides detailed site-specific information about all new affordable homes built since 1998. We included all new dwellings completed between 1998 and 2008 for social rented and LCHO housing. All were plotted onto the hectare cells, enabling us to link the pattern of new investment with patterns of deprivation and housing tenure at the same geographical scale.
To locate housing association buildings constructed before 1998 we combined census data with the PAF to identify net change in dwellings at the hectare grid level, used Land Use Change Statistics to identify changes to vacant as well as built land (identifying where there had been demolition followed by replacement housing), and used HM Land Registry data to identify transfers of title of these dwellings, enabling separate identification of new owner occupied from other (mainly social rented) dwellings.
Stage 4: Relating new build to existing concentrations of social housing
The next stage was to relate the location of new housing association dwellings to the proportions of social housing already in place before they were built and the levels of deprivation in the hectare cells. An important finding is that just over one in three new social rented dwellings built after 1998 (37%) were located in new residential areas: that is hectare cells that had not previously been developed for housing. More than three-quarters (78%) of housing association dwellings built in these ‘new’ locations were on brownfield sites, such as former hospitals or factories. These locations were generally subject to planning agreements that required developers to provide a mix of private and affordable homes.
We wanted to see how housing association investment between 1998 and 2008 in the existing residential areas was related to deprivation in areas which had different concentrations of social housing at the beginning of this period. The nearest date to 1998 for which we could measure concentrations was 2001 and we used census and PAF data to categorise the areas into three groups by the amount of social housing in the hectare cell itself and in its immediate vicinity: (1) some social housing in 2001 (at least six social rented dwellings per hectare for 300 m around a dwelling); (2) concentrated social housing – as (1) but where at least half of the dwellings within a 300 m radius belonging to a social landlord; and (3) elsewhere – cells with fewer than six dwellings per hectare, including none at all.
Stage 5: Who lives in the new housing provided by housing associations?
Data on the first occupants of the housing were available from the Tenant Services Authority’s (TSA) 7 CORE (Continuous Recording) database on households moving into the first lettings of new rented homes and the first sales of LCHO homes. CORE data are available from 1989 but IMS data only since 1998, so it is only possible to link data on the location of new construction with that on first lettings and sales only since 1998. We therefore concentrate on this period.
The findings: The location of new housing association homes
The pattern of deprivation over time
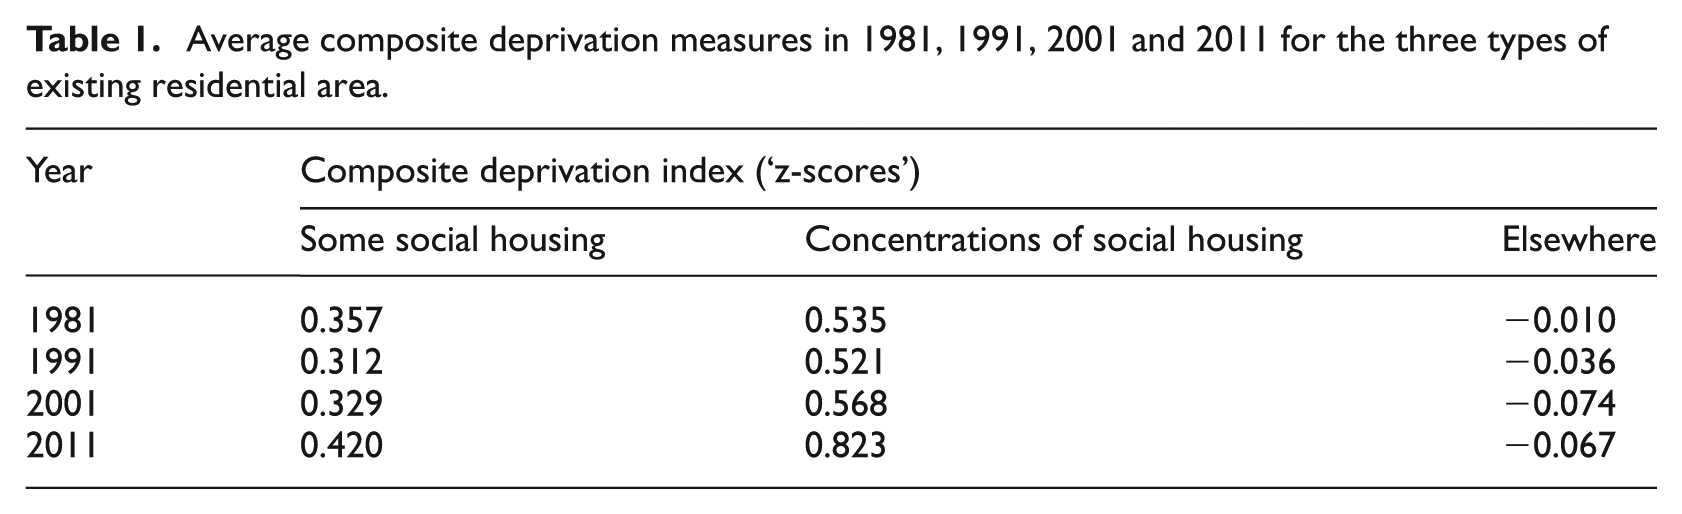
In the four tables that follow, we show the average composite deprivation scores of the relevant hectare cells which have social rented homes and those where new housing association homes were built for the years in question. Table 1 shows that the average score in 2001 of those hectares which had some social housing in that year was 0.329, less than those with concentrations of social housing in the same year, but much more than those with little or no social housing. Average scores declined for all types of existing areas with social housing between 1981 and 1991 but then increased substantially between 1991 and 2011. Elsewhere, although average deprivation scores were much lower, they rose marginally between 1981 and 2011. Thus there is a clear picture of increasing differentiation between areas dominated by social housing, those with a significant proportion and those with little or no social housing. In part this reflects the allocation policies of social landlords and to be expected.
Average composite deprivation measures in 1981, 1991, 2001 and 2011 for the three types of existing residential area.
The location of new housing association construction in existing residential areas
The next stage is to look at the deprivation scores in both 2001 and 2011 in the existing residential areas where housing associations constructed new social rented homes up to 2008. Table 2 shows that scores for the areas where construction occurred before 1991 were much lower than in the areas with some existing social housing or with concentrations of such housing (as shown in Table 1). Moreover the areas where new dwellings were built between 1991 and 2000 had much lower average 2001 and 2011 scores than the areas where housing associations had previously built new homes. This suggests that, up to 2000, housing associations were increasingly building in areas which did not have the greatest average deprivation.
Average composite deprivation measure in 2001 and 2011 for existing residential areas where new housing association social rented dwellings were constructed in different periods.
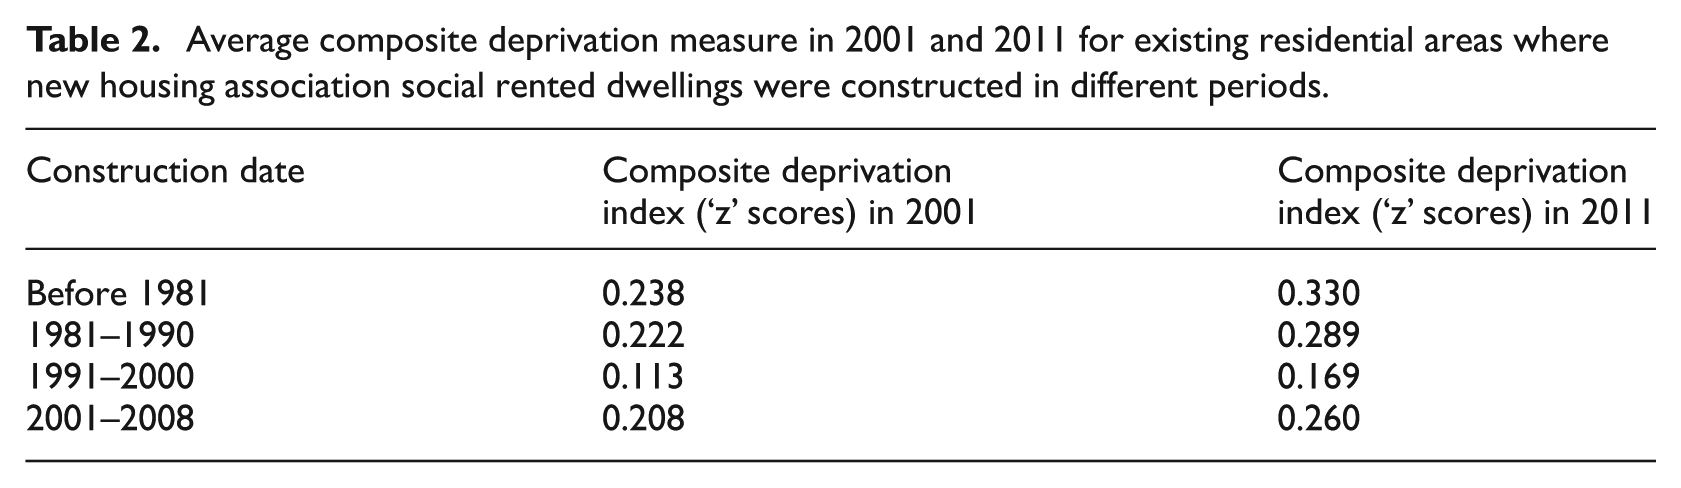
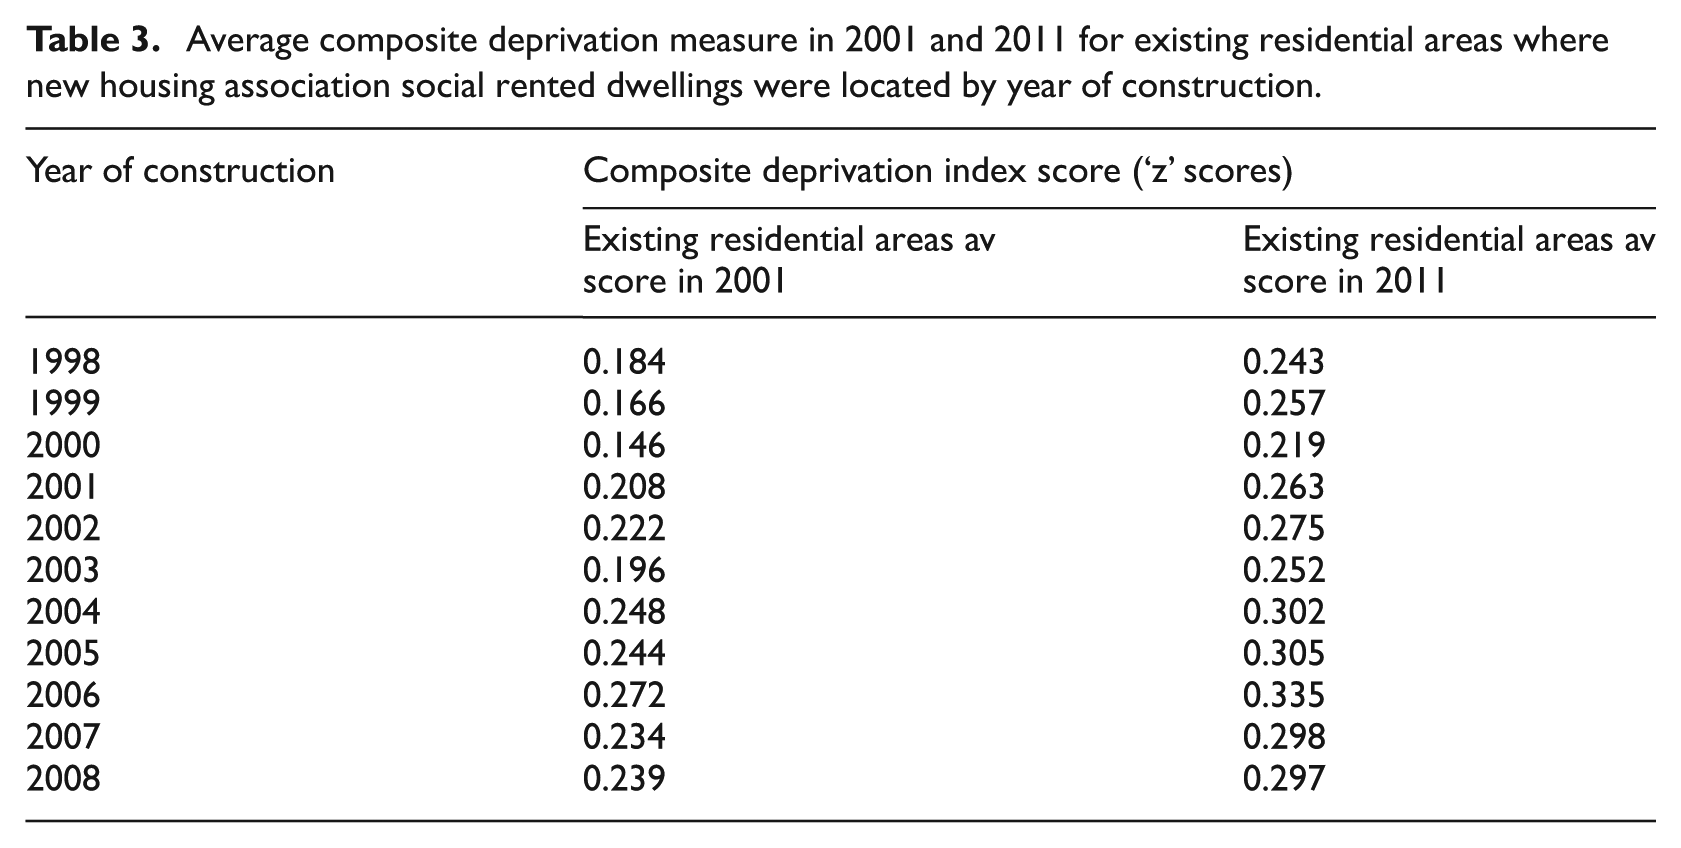
As Table 2 also shows, since the turn of the century this trend has reversed and new construction has become more concentrated in areas with higher deprivation measured on both 2001 and 2011 scores. Table 3 provides more detail of this later period, showing the deprivation scores in the hectares where new homes were built in each year between 1998 and 2008. It shows that the average 2001 deprivation scores of the areas where new homes were built generally increased over the period, indicating that investment was increasingly taking place in areas which were more deprived in 2001. Further, by comparing the 2001 and 2011 scores for each year of construction, we can see that deprivation worsened in the areas after the dwellings were completed. This partly reflects the shift in using new construction to alter the character of existing deprived estates discussed above as well as housing association allocation policies continuing to give priority to the most deprived.
Average composite deprivation measure in 2001 and 2011 for existing residential areas where new housing association social rented dwellings were located by year of construction.
The initial conclusion with respect to existing residential areas is therefore that investment policy in the 2000s steered some new housing association investment into more deprived areas.
The location of new social rented homes in ‘new’ residential areas
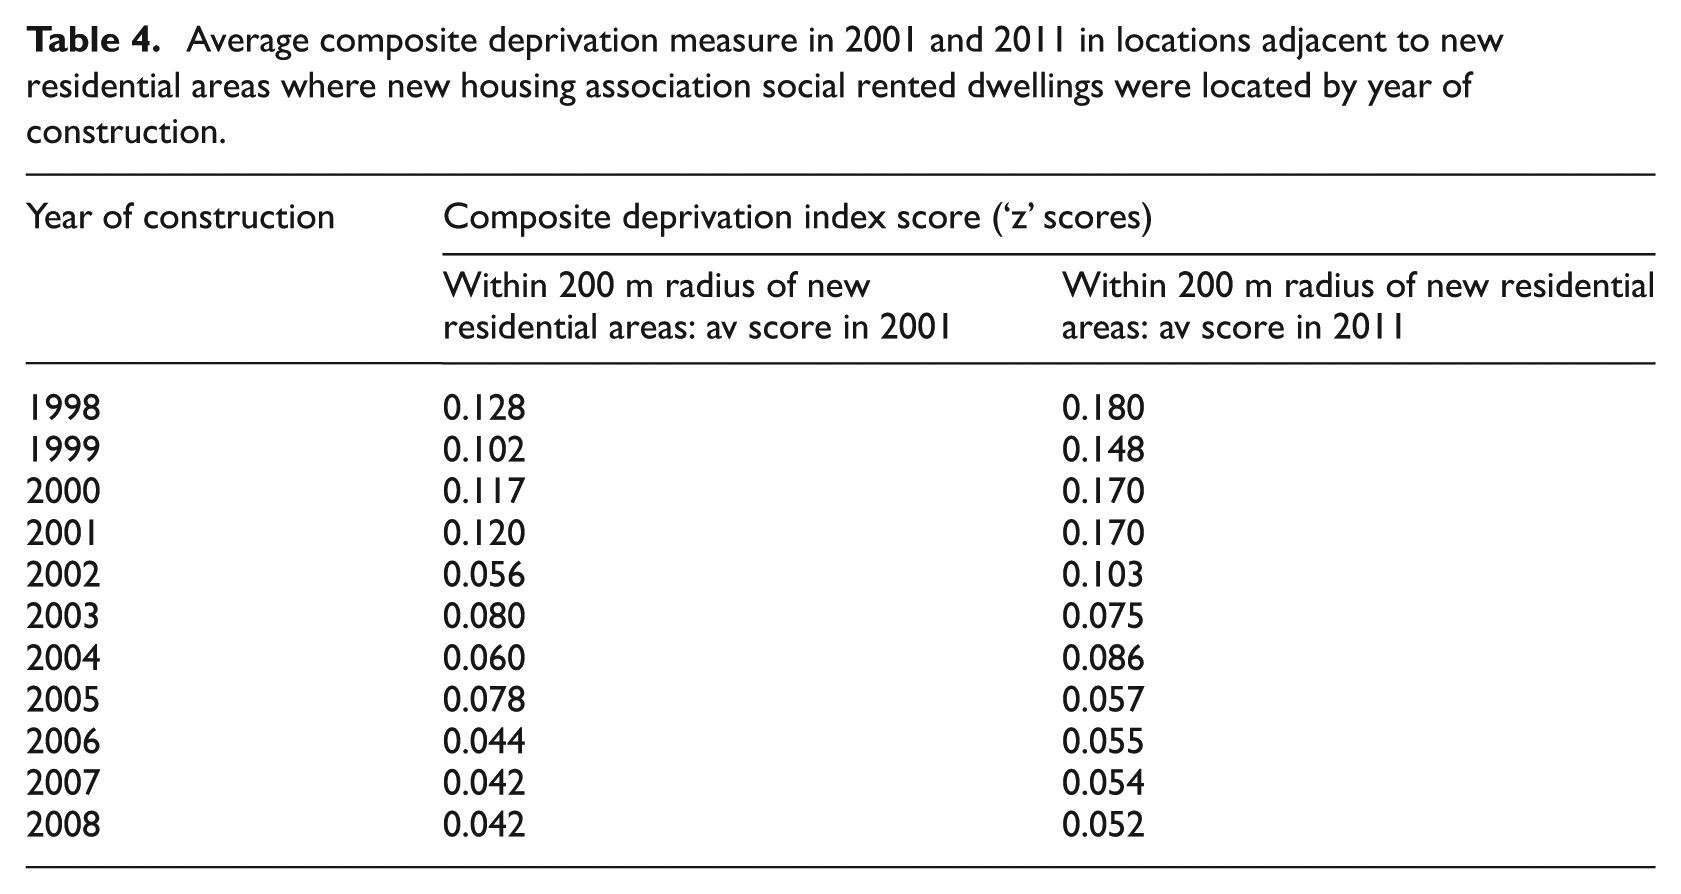
‘New’ residential areas, where more than one-third of new housing association social rented dwellings were built, were very different to existing residential areas. Table 4 shows the average 2001 and 2011 deprivation scores for residential areas lying within 200 m of the new areas where housing associations built homes in each of the years between 1998 and 2008. Comparing the scores in both these columns with those in Table 3 above for the existing areas shows clearly that these new areas have much lower average deprivation scores. Indeed, the deprivation scores for the areas close to these new developments were similar to those for residential areas with little social housing or none at all (Table 1). Moreover, the average 2001 and 2011 scores declined over the period, suggesting that S106 agreements were being put in place across a wider range of area types. Simply put, new residential areas with new housing association provision are adjacent to areas that are far more like areas with little or no social rented housing. This is because these new social rented homes are parts of market development sites whose developers have agreed to provide some of the site as new affordable homes under S106 planning agreements.
Average composite deprivation measure in 2001 and 2011 in locations adjacent to new residential areas where new housing association social rented dwellings were located by year of construction.
The location of new social rented dwellings since 1998: Summary
Figure 1 looks at trends between 1998 and 2008 in the proportions of all new social rented housing built in new residential and existing residential areas, the latter divided into quartiles reflecting their relative 2001 deprivation index. It shows that the big changes are in the increased proportion of new social rented dwellings built in new residential areas and the smaller numbers being built in the existing more affluent areas. This national picture is broadly repeated across regions, although there were higher proportions of new social rented housing being built in new residential areas in southern England than elsewhere.
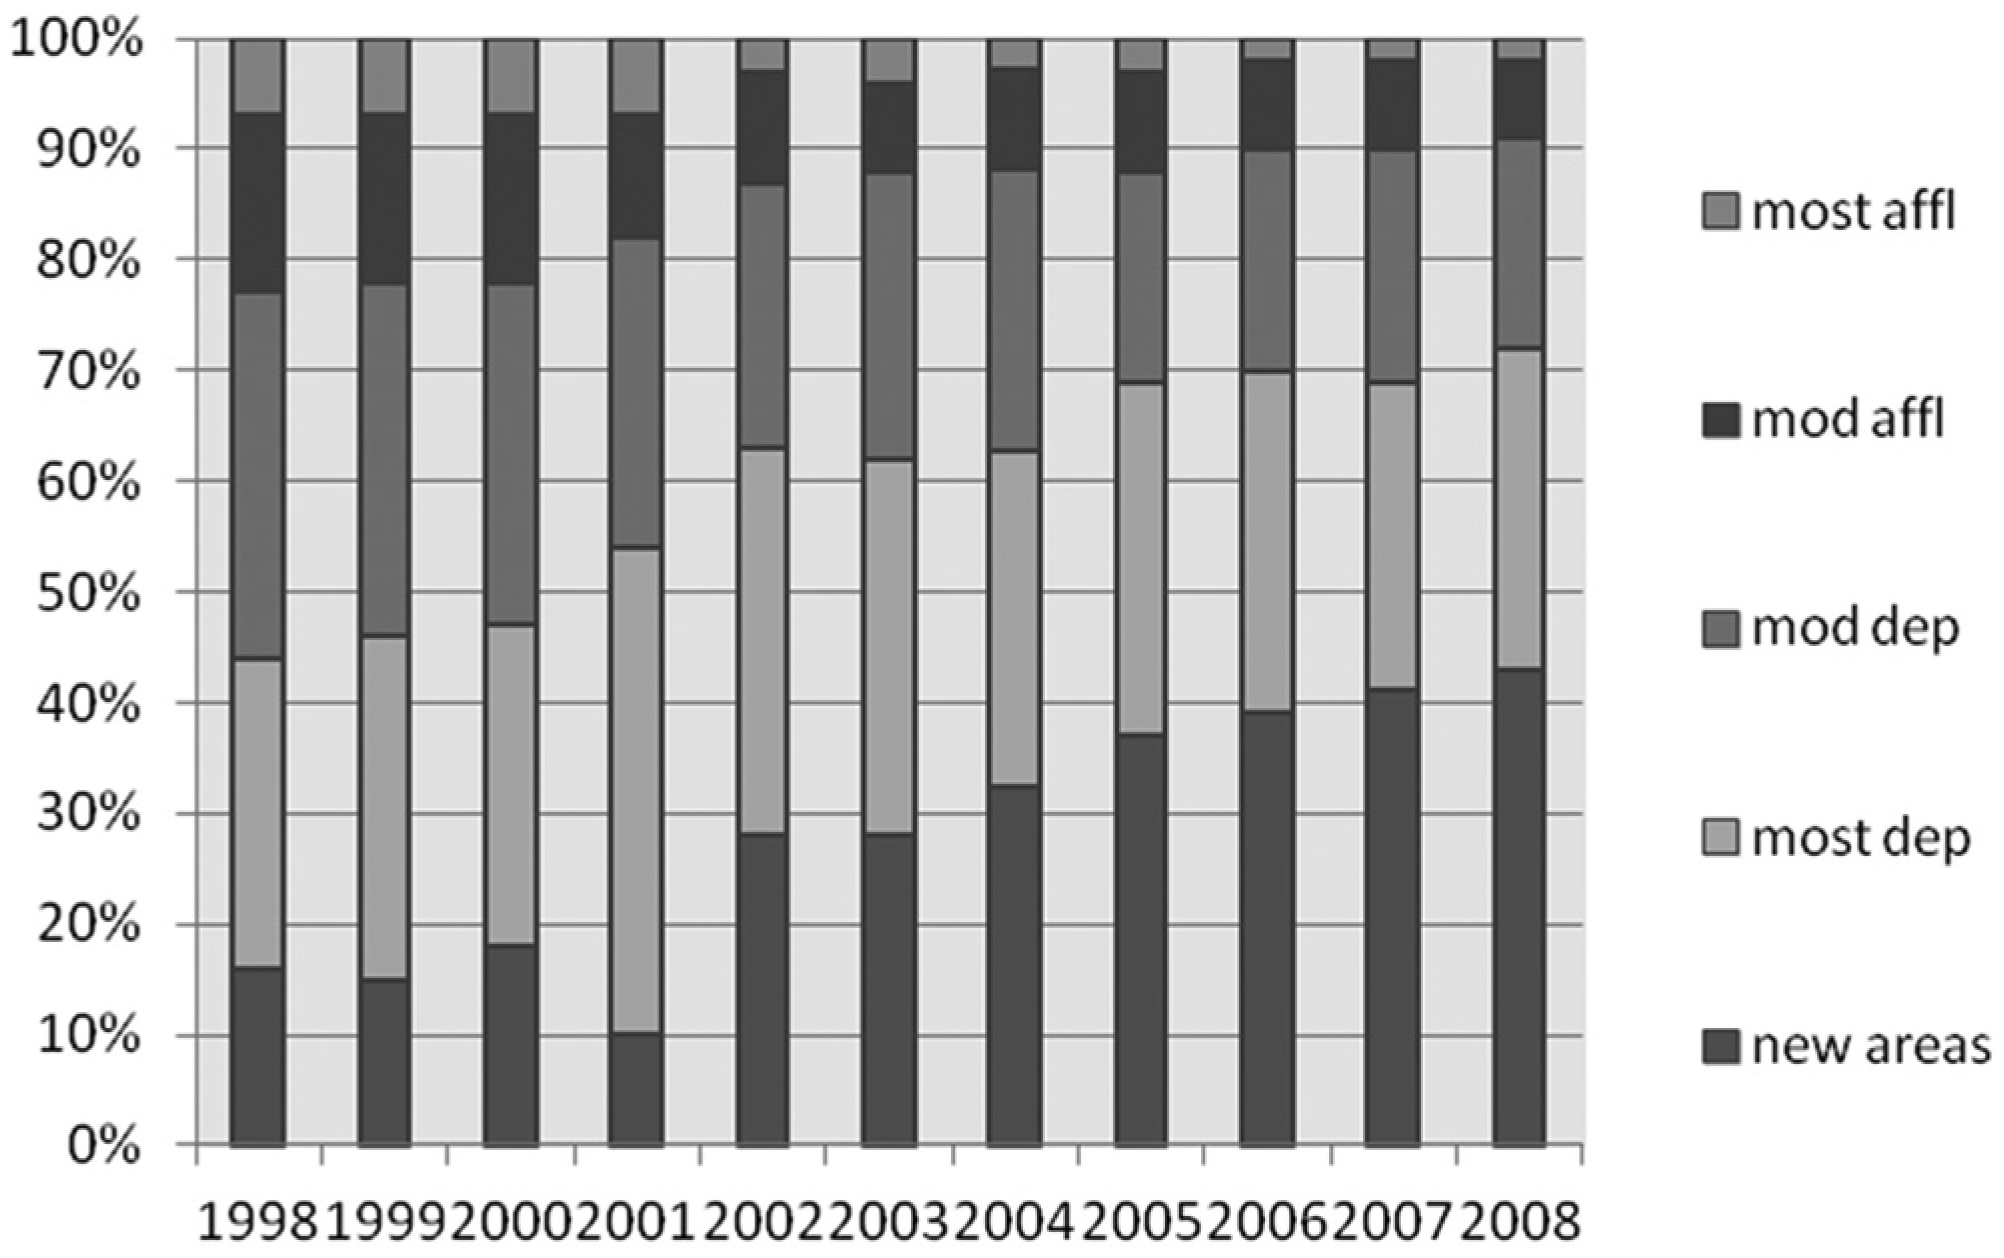
Percentage of new social rented dwellings built between 1998 and 2008 within new residential areas and in existing areas classified by 2001 deprivation score quartiles.
The location of new low-cost home-ownership dwellings
The proportion of first sales of LCHO dwellings built by housing associations in different types of neighbourhood is shown in Figure 2. The available data only allow examination of the more recent past, from 2003 to 2008, but they too show the considerable and increasing proportion of new LCHO dwellings that are in new residential areas. A falling proportion, from approximately 40% to 25% of first sales between 2003 and 2008 was in areas with the highest deprivation scores. Even so, this still represents a slight increase in absolute numbers as the total number of new LCHO dwellings built by housing associations in England rose from 7500 in 2003–2004 to 13,500 in 2008–2009. There were regional differences, however. In the three northern regions of the North East, North West and Yorkshire and Humber the majority of new LCHO dwellings were in the most deprived areas, a reflection both of the emphasis on tenure restructuring in regeneration programmes in these regions and of the limited planning gain available in new development sites in these regions (Crook and Monk, 2011).
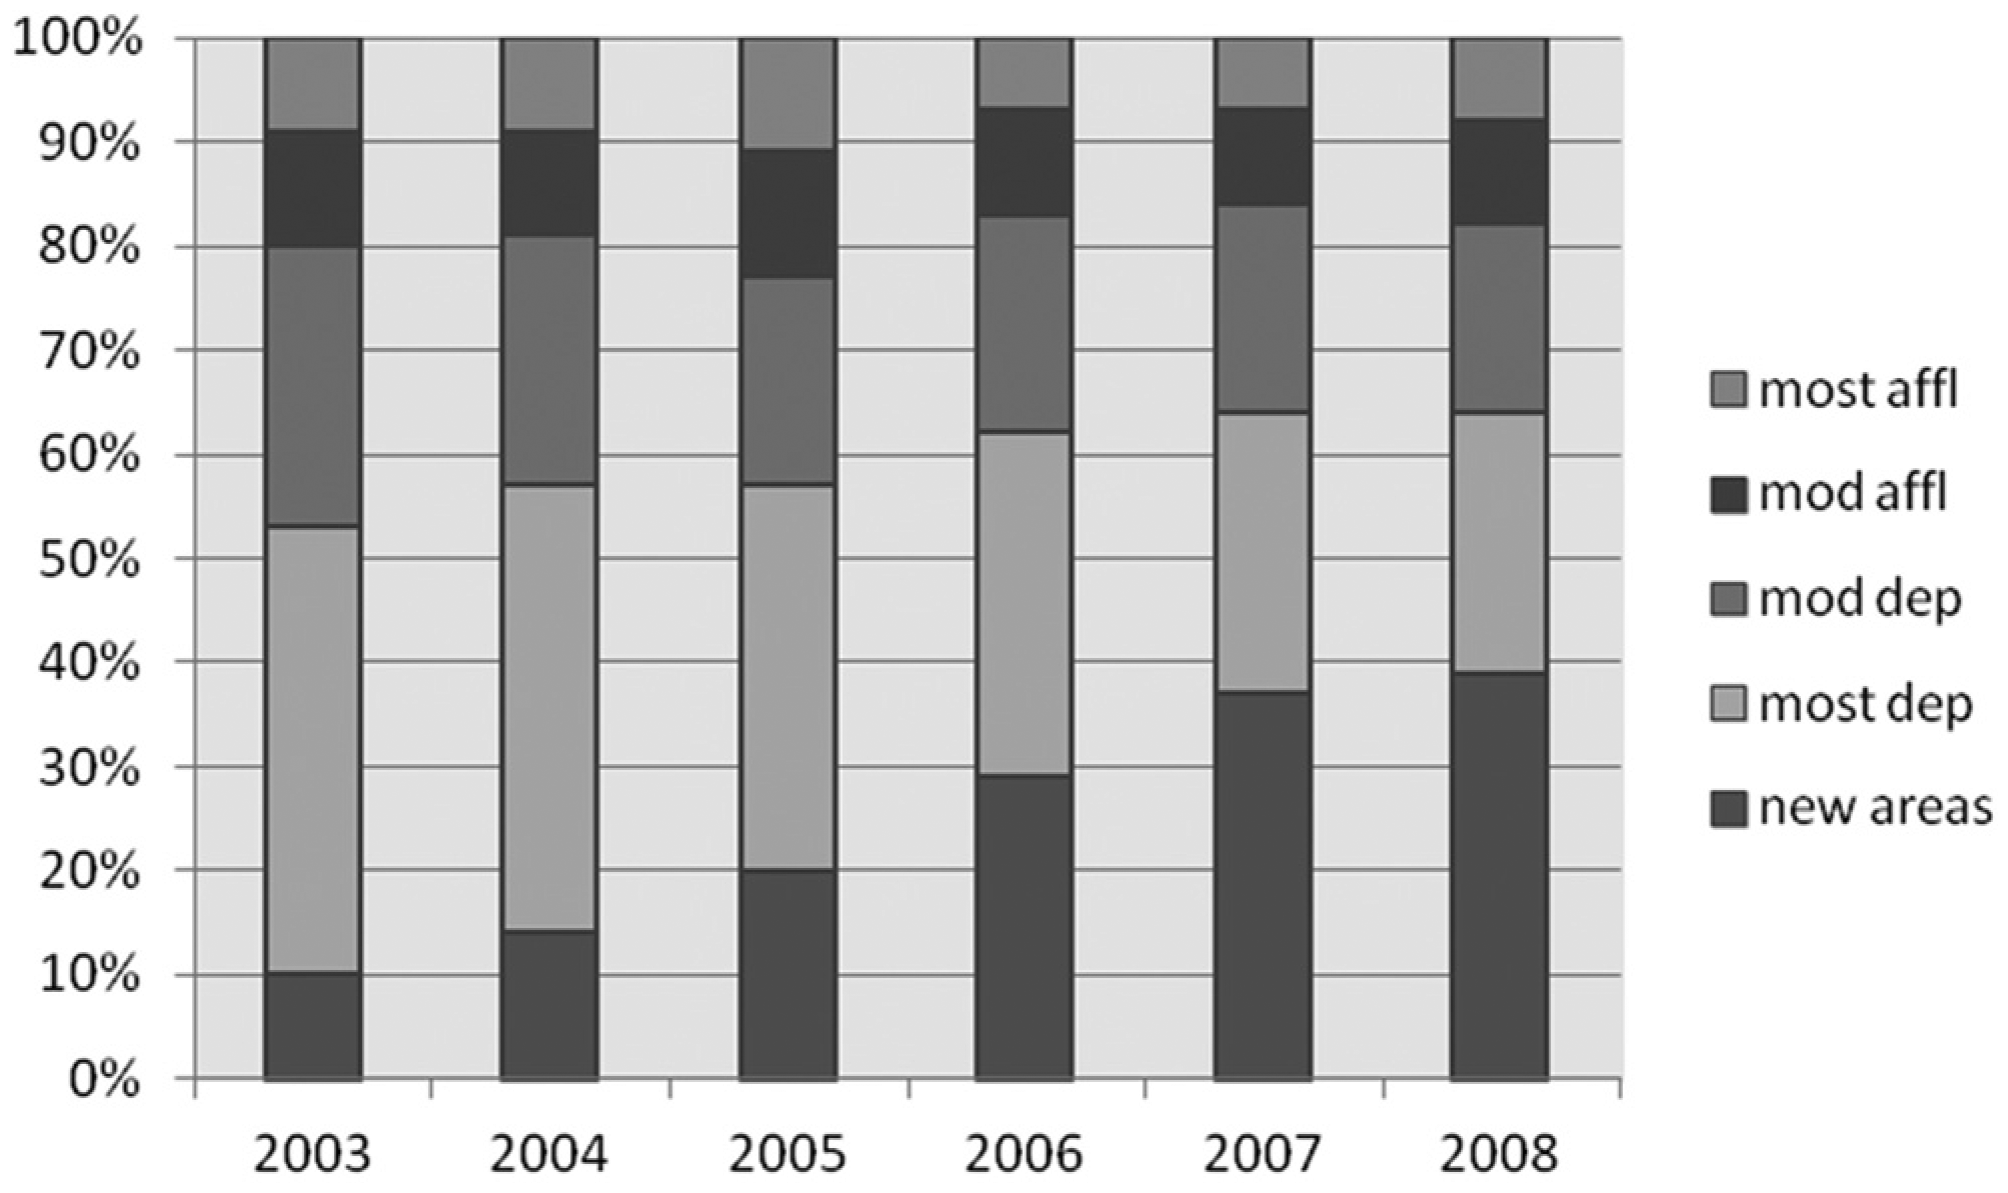
Percentage of first sales of new LCHO dwellings built between 2003 and 2008 within new residential areas and in existing areas classified by 2001 deprivation score quartiles.
The relative importance of different areas
There are now large volumes of new homes in mixed tenure schemes. In the most deprived existing areas 85,000 new dwellings were built by housing associations between 2003 and 2008, including 36,000 for LCHO and 49,000 for social renting. Over the same period associations built 59,600 newly social rented homes and 31,000 new LCHO homes in new residential areas. Together these constitute 63% of all new housing association homes built over that period. 8 Although there is no systematic information on the numbers of new private market homes built in either of these types of area, S106 planning agreements at that time typically required up to one-third of all new dwellings to be affordable (Crook and Monk, 2011). This suggests that 275,000 new dwellings were constructed in new residential areas which involved housing associations, of which two-thirds were market housing, around 20% social renting and 10% plus were LCHO homes.
Overall three distinct trends are apparent. First, the proportion of new affordable homes (both for rent and LCHO) built in new residential areas, generally near areas of low deprivation and with limited existing social housing, rose from 15% to 42% between 1998 and 2008 (Figure 1). Deprivation levels are, however, still positive – so these are not the highest value areas, confirming earlier work on the location of S106 sites (Crook et al., 2006). Second, a relatively stable proportion (between one-quarter and one-third, depending on the year between 1998 and 2008) has been built in areas of high deprivation on or near existing estates, often as part of regeneration programmes. Third, the proportion built in other existing, including affluent and moderately deprived areas, where there are relatively few or no existing social rented units, declined significantly. This is likely to be because many development sites in these areas tend to be too small for on-site provision of new social rented homes under S106 agreements. Thus new residential areas have substituted for affluent and other less deprived areas, while development has been maintained in areas where social housing is concentrated, often as part of regeneration programmes. But in addition, especially in the northern regions LCHO has been introduced into very deprived areas as part of these regeneration programmes.
Who has been housed in new social and affordable housing?
We next examine who moved into new housing, especially in the most deprived and new residential areas. In the latter, tenure mix and who lives in new stock can make a significant difference to household mix. In existing areas new build makes more limited changes as allocations to existing accommodation may have a greater role to play, depending on the extent of new build. CORE classifies properties by dwelling type, bedroom numbers, transaction type (initial let, re-let or sale 9 ) and location. Households are classified by the age of household members, household type, economic status, ethnicity and whether previously homeless.
The national picture
With respect to house type, analysis of the national picture over the two decades up to 2008–2009 revealed clear patterns (Crook et al., 2011). In the 1990s there were much higher proportions of houses, but flats, especially two-bedroom flats, came to dominate in later years as housing associations maximised output from grants and planning authorities wanted higher densities. Small households constituted an increasing proportion of tenants moving to new homes and household ‘heads’ average age fell steeply. New lets went increasingly to employed households and existing tenants
The picture is different for LCHO purchasers. Their average age rose as affordability worsened. More than 90% were in work and only 6% had children. At the same time, the proportion of existing social rented tenants buying fell from 22% in 2001–2002 to 6% in 2008–2009, probably reflecting rising prices.
Lettings and first sales of new homes
We examine initial lettings locally over the period 2002–2003 to 2008–2009 and first sales between 2003–2004 and 2008–2009 in three area categories: the most deprived existing areas (i.e. the bottom quartile); all other existing areas; and new residential areas.
Table 5 looks at the allocation of new social rented dwellings. It suggests that rents, allocation principles and outcomes were generally similar for all areas, although differences increased over time. In 2002–2003, there were more households in employment and with children in new compared with existing areas – reflecting higher proportions of houses and larger dwellings. In all areas existing social tenants were the majority of those moving into new dwellings.
Who has been accommodated in new social rented housing?
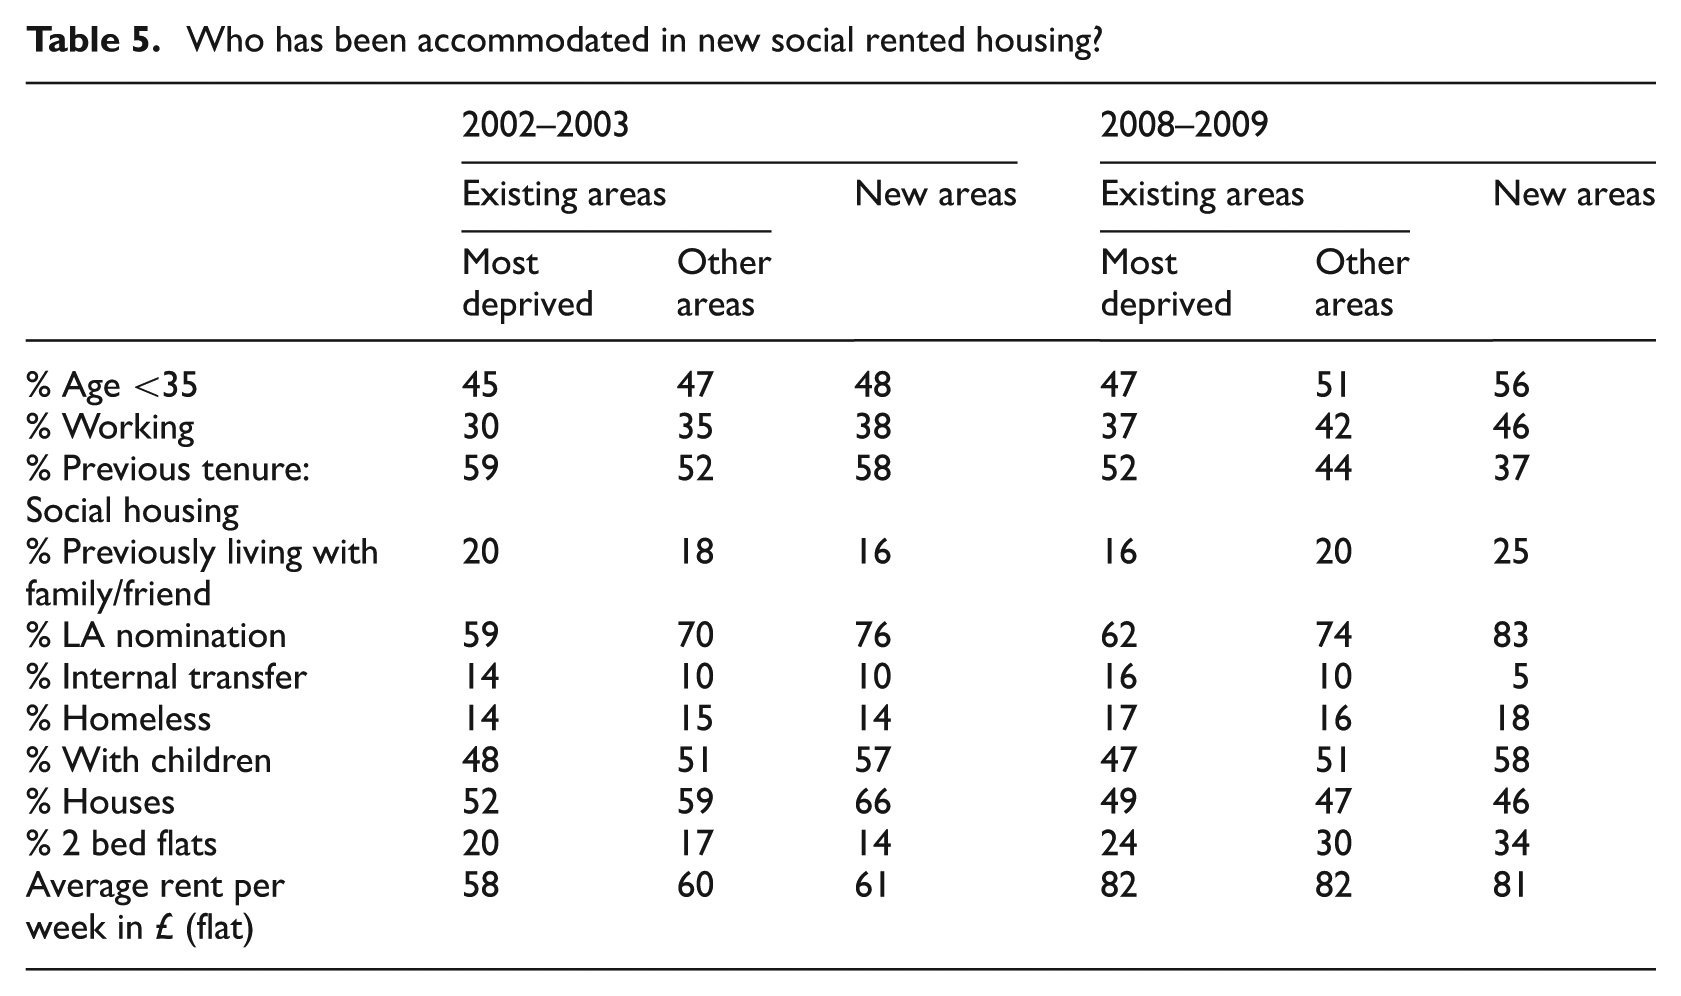
By 2008–2009, the proportion of two-bedroom flats, while it had not increased much in deprived areas, had more than doubled in new residential areas. Partly as a result, more younger and employed households were allocated new dwellings in new areas while far fewer social tenants were re-housed there than in 2002–2003.
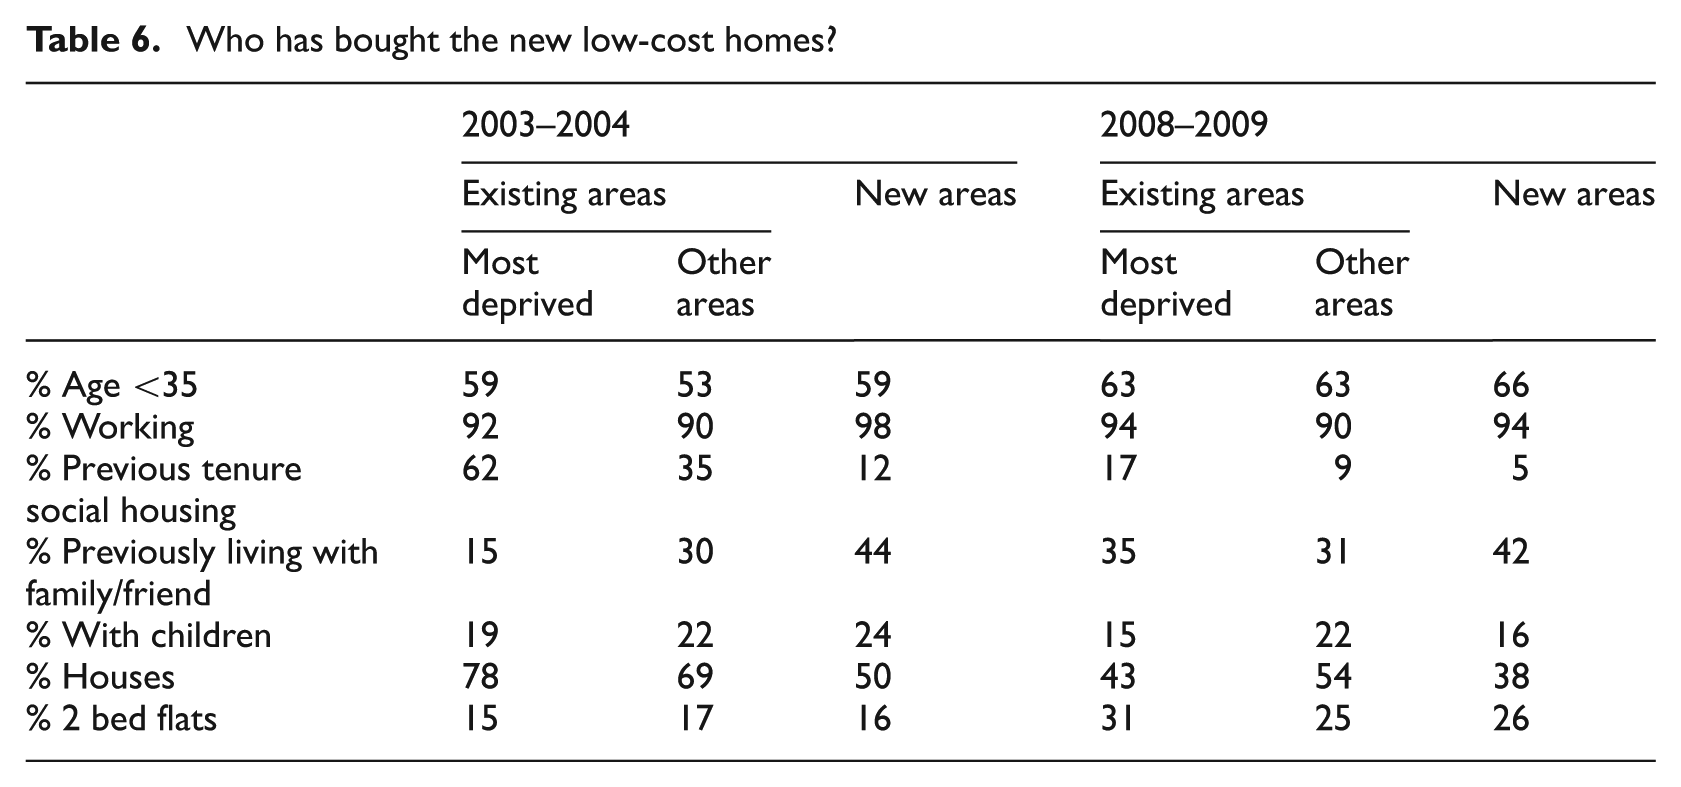
Table 6 shows who bought the LCHO dwellings. While purchasers were very different from social tenants in terms of age and employment, purchasers across the three area types were generally similar. The main difference was the large proportion of existing social tenants who bought LCHO dwellings in the most deprived areas in 2003–2004 (perhaps reflecting their wish to stay in the areas they knew) in contrast particularly to the very small proportions in new areas. But by 2008–2009, the proportions of social tenants buying across all area types had fallen significantly, reflecting problems of affordability and problems in accessing loans. Instead, LCHO units were acquired mostly by those moving from other tenures or by newly forming households.
Who has bought the new low-cost homes?
The picture in existing deprived areas
New social rented homes continue to go to those in the greatest need, evidenced by the high proportions not in work and previously living in insecure accommodation. At the same time, the construction of LCHO homes has introduced a very different group of households: mainly in work, younger and moving from other accommodation, including formerly living with family and friends (suggesting they were first-time buyers), particularly in 2008–2009. The fall in the proportion of houses is concentrated in the LCHO sector, reflecting expectations of who will wish to buy (increasingly younger households just starting their housing careers) and the way S106 negotiations trade increased numbers of units against their size. This is particularly important as the tenure mix shifted over time from renting to LCHO (Crook and Whitehead, 2010).
Thus, achieving a tenure mix in the most deprived areas has ensured a higher proportion of working households; a lower proportion of households with children; a wider range of ages; and those with very different housing careers. However, the limitations on dwelling size have restricted the types of household who buy and will be likely to generate significant movement out when these younger households have children. Thus how long this greater mix lasts depends on future sales and allocations, just as the long-term impact of the Right to Buy policy on tenure and household mix depended on who bought re-sales into the second-hand market (e.g. Jones and Murie, 2006). 10 Moreover, the fact that, on 2011 evidence, the deprivation index for the areas where housing associations were investing did not improve (see Table 3 above) suggests that, whilst the ‘injection’ of working households via LCHO programmes had contributed to a wider tenure mix, it was of itself insufficient to generate areas with lower deprivation.
The picture in new residential areas
The mixing of new social rented and LCHO housing in new residential areas brings together a quite different mix of households compared with those in surrounding areas. These new areas have typically accommodated a mix of young, often childless, working LCHO buyers and somewhat older households, many with children but with only a minority in work, allocated the new social rented dwellings.
We know nothing about households buying the open-market dwellings in these new residential areas but we do know that the immediately surrounding areas are much less deprived than the areas where housing associations have built new homes in the past. 11 Hence new residential areas have brought together younger employed and more deprived households all moving to more ‘up market’ neighbourhoods.
Bringing the story together: Conclusions and implications
Housing association investment has shifted significantly since 1998, mainly because far more is being built in new residential areas and proportionately less in more affluent existing areas. Proportions in deprived areas have stayed relatively constant but now include significantly more LCHO.
Both regeneration programmes and S106 planning agreements have created tenure and household mix. In deprived areas market and LCHO housing makes regeneration financially feasible and brings in younger employed households. In new residential areas on-site contributions required from planning gain makes social housing and LCHO possible. LCHO brings in lower income employed households, many not previously social housing tenants, while the social housing enables those in housing need to move to these less deprived areas, helping to create a mix of households both in and out of work and with and without children.
One outcome of the increasing emphasis on smaller flats is that it generates higher concentrations of younger singles and couples, especially in the LCHO sector, and reduces access for families in the social and LCHO sectors. It is reasonable to assume that these areas will be unable to retain the original households who move there as they later look for larger homes more suited to families. Sustaining the mix created by regeneration and planning gain policy thus depends on households similar to the first buyers purchasing the dwellings in the second-hand market.
Overall, the evidence shows that housing tenure can be a tool, at least initially, in tackling deprivation. Providing social housing in mixed tenure developments has enabled greater movement within the system, taken some people out of unsatisfactory neighbourhoods and improved neighbourhoods during redevelopment. The fact that one-third of all new social and affordable housing has been located in new residential areas – where mixed tenure policies have the power to imprint a significant element of social mix on to the development – is of particular importance.
The story with respect to the regeneration of highly deprived areas with significant existing social housing is rather less clear-cut. The short-term dynamics suggest that the process of regeneration may initially worsen deprivation and segmentation. Thus the deprivation index evidence shows no improvement in the indices in most deprived areas where there has been new social rented and LCHO investment. This reflects the priority attached to allocating new social rented as well as existing dwellings to deprived households. Only if these tenants’ circumstances or allocation priorities change or if there is a much bigger injection of LCHO dwellings with working owners is mixed tenure policy in regeneration areas likely to generate the intended benefits of mixed community policies.
Thus the imperative of allocating scarce resources to the most needy suggests that reducing area deprivation through tenure policies may be much harder to achieve through regeneration policies than through new building in less deprived areas.
Under the last government there was a shift away from spatially specific policies. In 2013, ‘Help to Buy’ equity loans were made available to first-time buyers for all new market housing. There are also moves to include privately rented housing on new market sites (BSHF, 2012; Montague, 2012). These provide different ways of reducing land values to help provide mainly for younger aspirant households in all types of area. Mixed tenure through a range of different pathways therefore appears if anything to be more strongly entrenched in the policy agenda than in the past – but at the cost of losing concentrated efforts to mix tenure and households in specific locations.
This English case study also points both to how we have learned from Europe, notably with respect to regeneration but also to lessons relevant to other European countries particularly with respect to new developments. A national policy such as S106, together with greater emphasis on providing partial ownership as well as traditional social rented housing in new developments, can provide a scale of intervention which enables communities with a mix of income groups and household types. This in turn has the potential to avoid concentrations of poverty and deprivation and the potential to maintain this improvement. Given the concentrations of deprivation in social housing across Europe (even in countries with a tradition of universalism), a mix of different types of affordable homes including partial ownership as well as traditional renting housing in both new developments and regeneration areas has a better chance of success – not just for social housing but in attracting younger, employed households that can help make the areas more dynamic.
Footnotes
Funding
The support of the Homes & Communities Agency and the former Tenant Services Authority, who supported some of the research reported in this article, is gratefully acknowledged. The conclusions drawn from the research do not necessarily reflect the views of those who commissioned it.