
Abstract
Water is a critical natural resource that sustains the productivity of many economic sectors, whether directly or indirectly. Climate change alongside rapid growth and development are a threat to water sustainability and regional productivity. In this paper, we develop an extension to the economic input-output model to assess the impact of water supply disruptions to regional economies. The model utilizes the inoperability variable, which measures the extent to which an infrastructure system or economic sector is unable to deliver its intended output. While the inoperability concept has been utilized in previous applications, this paper offers extensions that capture the time-varying nature of inoperability as the sectors recover from a disruptive event, such as drought. The model extension is capable of inserting inoperability adjustments within the drought timeline to capture time-varying likelihoods and severities, as well as the dependencies of various economic sectors on water. The model was applied to case studies of severe drought in two regions: (1) the state of Massachusetts (MA) and (2) the US National Capital Region (NCR). These regions were selected to contrast drought resilience between a mixed urban–rural region (MA) and a highly urban region (NCR). These regions also have comparable overall gross domestic products despite significant differences in the distribution and share of the economic sectors comprising each region. The results of the case studies indicate that in both regions, the utility and real estate sectors suffer the largest economic loss; nonetheless, results also identify region-specific sectors that incur significant losses. For the NCR, three sectors in the top 10 ranking of highest economic losses are government-related, whereas in the MA, four sectors in the top 10 are manufacturing sectors. Furthermore, the accommodation sector has also been included in the NCR case intuitively because of the high concentration of museums and famous landmarks. In contrast, the Wholesale Trade sector was among the sectors with the highest economic losses in the MA case study because of its large geographic size conducive for warehouses used as nodes for large-scale supply chain networks. Future modeling extensions could potentially include analysis of water demand and supply management strategies that can enhance regional resilience against droughts. Other regional case studies can also be pursued in future efforts to analyze various categories of drought severity beyond the case studies featured in this paper.
Introduction
Water is a critical resource that fuels economic development. However, rapid urbanization, population growth, and threats of climate change pose unprecedented challenges to the world’s finite water supply (Pagsuyoin and Santos, 2015). Over half of the global population (3.9 billion) now live in urban areas, and it is forecasted that this percentage will reach 68% (6.4 billion) by 2050 (United Nations Department of Economic and Social Affairs, 2018). Many cities are ill-equipped to provide reliable water to new urban dwellers (McDonald et al., 2011), let alone meet current needs (United Nations Department of Economic and Social Affairs, 2018). The increasing frequencies and severity of natural disasters further exert pressure on the already precarious balance between water supply and demand. For example, the 2012–2016 drought in California, United States, caused severe shortages to water delivered to ecosystems and production sectors (e.g. agriculture, hydropower plants, businesses, and water utilities), collectively resulting in lost wildlife and billions in economic losses (Lund et al., 2018). The 2011 flash flood in Copenhagen, Denmark, inundated homes and streets in a matter of hours, rendering the drinking water supply inaccessible for weeks due to contamination of damaged mains (European Environment Agency (EEA), 2012).
The future outlook for water availability also remains dire. The global water deficit is predicted to reach 40% by 2030 to keep on par with economic and population growth (Addams et al., 2009). Water scarcity is predicted to adversely impact agroeconomics in the next decades, most notably in South Asia, the Middle East, and North Africa (Schmitz et al., 2013). In Europe, the increased frequency of droughts and floods increases the risks of reduced renewable freshwater in the future, particularly in the water-stressed southern region where severe droughts aggravate high water abstractions for agriculture, energy, and domestic uses (EEA, 2019). In North America, climate change scenario simulations project that a third (1100) of all counties in the United States will experience a high risk of water shortage by 2050 (Roy et al., 2012), while groundwater recharge and run-off can decline by up to 10% in Central Mexico by the end of the 21st century (Herrera-Pantoja and Hiscock, 2015).
Addressing present and future water crises requires developing diagnostic tools to plan adaptation strategies and formulating policies that acknowledge the inextricable linkages among sectors competing for water (Molle and Berkoff, 2009). These approaches are often designed from the perspective of regional or basin-wide management and may require resource reallocation across sectors to dampen the net effect of the water shortage (Pagsuyoin and Santos, 2015). However, the provision of a reliable water service is a complex decision-driven process affected by many factors, including limited sources, fluctuations in supply and demand (Pielke et al., 2005), and temporality and severity of events triggering water disruption (Freire-González et al., 2017), among others. Distinct regional climates and uncertainties in precipitation patterns also complicate water service delivery. Nonetheless, a myriad of modeling tools is available for examining regional dynamics and resilience to water shortages and management scenarios, most notably, those that are based on input-output (IO; Cazcarro et al., 2013) and computable general equilibrium (Rose and Liao, 2005) models, and ecosystem services trade-offs (Banerjee et al., 2013).
In this paper, our goal is to develop a dynamic model—the water IO model—for examining the regional impacts of water disruptions due to drought events and evaluate the resilience of interdependent economic sectors in urban economies. The water IO model is based on the hybrid dynamic inoperability input-output model (DIIM) previously developed by Santos et al. (2014) to simulate the effects of varying drought severity and duration. To provide context to subsequent case studies, an overview of urban water service management is briefly discussed in the next section, and details on the water IO model are provided in the section that follows. Then, the case studies and general insights on their results are discussed. The final section presents concluding remarks and suggestions for future work. Drought impacts in rural areas, particularly for the agriculture sector, have been well documented (Howitt et al., 2014). In contrast, the impacts of drought in urban economies are not as well documented (Desbureaux and Rodella, 2019). This paper, particularly the case studies, seeks to contribute to this knowledge gap by examining and contrasting the drought impacts on two critical urban economies in the United States.
Urban water management
Although agricultural water use is generally higher than other nonagriculture uses, urban water consumption can be a significant portion of the total freshwater withdrawal (Niemczynowicz, 1999). Urban water includes uses in residential dwellings, industry, commercial establishments, and institutions. In the United States, total water use increased by 124% from 1950 to 1980 (180–404 billion gallons per day, Dieter et al., 2018). Domestic water use increased proportionately during the same period (Dieter et al., 2018), although this has shown a decreasing trend in recent years (88 gal/cap-day in 2010 to 82 gal/cap-day in 2015; Dieter and Maupin, 2017). Globally, urban water use is projected to increase by 80% by 2050 (Flörke et al., 2018), potentially giving rise to conflicts with other water-dependent sectors such as agriculture and thermoelectric power generation. In urban regions where water plays a critical role in sustaining economic activities, a reduced water supply can cause operational disruptions that impact individual sectors, as well as the overall regional economy (Pagsuyoin and Santos, 2015).
The majority of water used in large cities is obtained from surface sources, some of which are located far away from city limits (i.e. cross-basin water transfer). Of the top 10 global cities with the largest cross-basin water transfers, 4 are in the United States (Los Angeles, Boston, San Francisco, and San Diego), accounting for 51% of a total 133 billion gallons (504 billion liters) moved per day (McDonald et al., 2014). In the context of water risk management, water scarcity in off-site basin sources can significantly impact the resilience of urban regions to water disruptions. Furthermore, virtual water can also flow in and out of city boundaries through the exchange of goods and services. As such, in planning for improved resilience to urban water disruptions, it is important to recognize the roles of both physical water and virtual water embedded in trade and service transactions (Paterson et al., 2015).
Water policy planning requires establishing the local and regional economic impacts of natural disasters such as droughts. Comprehensive impact evaluation methodologies must include direct and indirect flow losses, as well as stock losses such as damage to a physical infrastructure (Okuyama, 2007). Droughts and the resulting disruptions to water delivery can have impacts that ripple through interdependent sectors, with each sector exhibiting varying degrees of resilience and vulnerability depending on its reliance on water (Pagsuyoin et al., 2019). Policymakers face the challenge of devising equitable water allocation strategies (Ward and Pulido-Velazquez, 2012), especially when competition exists between water-intensive (e.g. agriculture, power generation) and high-value (e.g. manufacturing) sectors. Ultimately, comprehensive risk assessments should aim to understand the individual and regional sector vulnerabilities in order to formulate holistic adaptation strategies that provide that most benefit to the region (Pagsuyoin et al., 2019).
Modeling water service disruption with the water IO model
Water is crucial in sustaining life and supporting the productivity of a myriad of economic activities. It is considered both as an essential natural resource, as well as a critical infrastructure (i.e. water utility distribution networks). Degraded levels of water supply that may occur on a regular basis, and more critically in the event of droughts, could severely affect households and many businesses, which are becoming more and more interdependent. There are a number of methods that can be used to assess the cascading effects of disruptive events on interdependent economic sectors. This paper focuses on the IO model (Leontief, 1936), which was developed by Wassily Leontief and has been awarded the Nobel Prize in Economics in 1973. The IO model has been used in many economic applications, and in recent years, has steadily gained popularity in modeling system interdependencies due to its simplicity and ease of access to required data inputs (Miller and Blair, 2009). Statistical agencies across the globe are collecting and publishing IO data to support various economic policies and decisions. The IO model along with related models such as the computable general equilibrium has been extended to analyze the effect of resilience in reducing the economic losses that can arise from disruptive events. Rose and Liao (2005), for example, have discussed various definitions and types of economic resilience in the context of disaster risk management.
In this paper, the IO model has been specialized to analyze disruptions to the availability of water supply, such as what would occur in the event of droughts. The model builds on the concept of inoperability—a dimensionless variable that ranges between 0 (normal operation) and 1 (total system failure). Hence, inoperability is conceptually similar to the concept of unreliability, which measures the proportional extent to which a system is not meeting the “business as usual” level of output (Santos and Haimes, 2004). The inoperability IO model has been applied in disaster risk analysis applications and has gained significant visibility in mainstream IO literature (Santos, 2006). IO model extensions have been developed to study indirect and direct water consumptions (Velazquez, 2006), regional water footprints and trade-off (Cazcarro et al., 2013), and policy making in irrigation (Lopez-Morales and Duchin, 2011), among others.
This paper, in particular, will customize the IO model to assess the effects of inoperability to the water utility sector and the ripple effects to other interdependent sectors, considering uncertainties pertaining to the severity of water supply reduction and the duration of recovery. Equation (1) relates the dynamic interaction between resilience with inoperability. The resilience matrix

Although disruptions in infrastructure systems have been modeled previously using the concept of inoperability, the dynamic nature of inoperability and its coupling with resilience are relatively new areas that are explored in this paper. In particular, not addressed in equation (1), is an ability to capture time-varying resilience, K(t), that adapts to some a priori and current levels of system inoperability. Integrating time-varying inoperability and resilience will be particularly relevant in studying water demand and supply management strategies and their impacts on interdependent systems.
In the inoperability vector
In this paper, we utilize data on “water-use balance ratios” (which we denote by

Relating equation (2) with equation (1) generates the inoperability of each sector at time t. Once the inoperability of each sector is determined, the associated economic losses resulting from a disruption to water supply can be estimated. The formulation also includes a function that enables the adjustments in the inoperability of the sectors depending on the level of water supply disruption, as shown in equation (2). Note that equation (2) can be written in an equivalent vector notation

We then simulate drought scenario vectors that determine the extent to which drought consequences will manifest as direct perturbations to the normal operation of economic sectors in a region. It consists of variables that allow modeling the regional resilience of interdependent economic sectors to various periods within the drought recovery horizon. Equations (2) and (3) are used to quantify the water-use balance ratios and enable the simulation of increasing or decreasing drought severity. The development of several drought prediction methodologies has been investigated in the literature; however, researchers have underscored the difficulty in developing consistent methodologies for estimating and comparing regional economic losses due to drought events (Banerjee et al., 2013). For this reason, the emphasis of the model is not on drought prediction, but rather, it is intended as a prescriptive tool that regional policymakers can adopt in formulating effective water supply and demand management strategies.
The adaptive formulation comprises a hybrid model that incorporates adjustments in the inoperability levels relative to the disaster timeline. Examples of such adjustments could be an aggravation of a disaster (not captured by the initial prediction) or conversely, the alleviation of inoperability via risk management. Hence, we combine two general types of inoperability. Equation (3) is similar to equation (1), but for tractability, it includes a subscript “DIIM” to the left-hand side of equation (1) to generate the following revised formulation:

Next, a subscript “NEW” is introduced to the left-hand side of equation (3) to represent a modified perturbation that is different from the inoperability generated from the DIIM. Hence, we can rewrite equation (3) as follows:

The expected value of inoperability at a subsequent time step, t + 1, can be determined by taking the weighted average of the two types of inoperability (DIIM and NEW) from the previous time step. The values in the probability vector
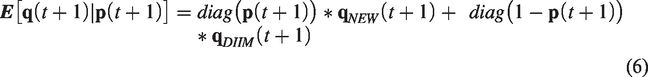
The first term on the right-hand side of equation (6) accounts for the effect of new inoperability values that can occur while the sectors are recovering. This term,

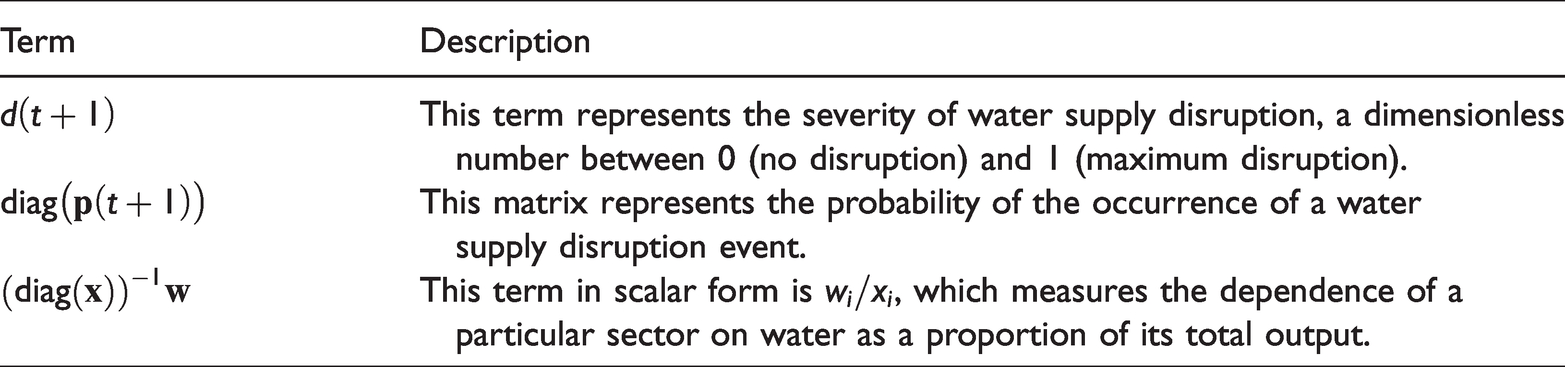
The terms on the right-hand side of equation (7) can be analyzed separately to explain how new perturbations can cause the inoperability to deviate from the inoperability as predicted in previous applications of the DIIM path. An earlier paper by Santos et al. (2014) provides a tutorial on the steps involved using a pedagogical two-sector economy. Table 1 explains how each term of equation (7) can potentially contribute to new types of inoperability within the recovery timeline.
Summary of model terms that contribute to new levels of inoperability.
Applications of the water IO model in urban regions in the United States
The water IO model extension was applied to case studies of drought, namely, in Massachusetts (MA) and in the National Capital Region (NCR), which are both located in the US East Coast (Figure S1 in the Supplemental Materials). These study sites were selected due to their high population density, degree of urbanization, and their criticality to the US economy. Among US states, MA is the fourth most densely populated (United States Census Bureau, 2020a) with the sixth highest per capita gross domestic product (GDP) (US Bureau of Economic Analysis (US BEA), 2018). While not a state per se, the NCR is a major economic driver in the country and includes 8 of the 20 highest income counties in the US (United States Census Bureau, 2020b); the District of Columbia in the NCR is also the most densely populated city-state in the US. In 2016–2017, MA experienced historically severe and prolonged drought that affected 52% of the state at peak drought levels (National Integrated Drought Information System (NIDIS), 2020) and compromised water distribution in many towns (Lowell Water Utilities, 2016, personal communication). Since 2000, the longest drought in the NCR occurred in the state of Virginia, beginning in May 2007 and lasting 103 weeks (NIDIS, 2020). See Figure S2 in the Supplemental Materials for plots of the historical droughts in MA and in Virginia.
The case studies utilized economic databases obtained from several sources: (i) the national IO matrix comprising 71 economic sectors and adapted for MA and the US NCR use, (ii) GDP, (iii) local area personal income, and (iv) water input requirements of each sector derived from the Use matrix available through the United States BEA website (US BEA, 2019a). The 71 economic sector classification (Table S1, Supplemental Materials) was based on the North American Industry Classification System.
The national IO matrix is used as the reference for constructing regional IO matrices for MA and NCR. Regional economic data such as GDP and local area personal income are used in calculating the “location quotients” to generate the region-specific IO matrix. Miller and Blair (2009) provide details on the process for regionalizing a national IO matrix. Subsequently, the total sector production of each region is computed from the newly constructed regional IO matrix. Finally, the water input requirements for each sector are determined by collecting “water-use” data for each sector (i.e. payments made by each sector to the water utility sector) and taking its proportion with respect to its total production output. This proportion yields the “water-use balance ratios” (
Case study 1: MA (180-day duration, 30 days to peak, 20% disruption sustained over four weeks)
MA is among the most densely populated US state (2016 population of 6.8 million, United States Census Bureau, 2020a). It is subdivided into six drought regions encompassing the counties of Berkshire, Franklin, Hampden and Hampshire, Barnstable, Bristol, Dukes, Essex, Middlesex, Nantucket, Norfolk, Plymouth, Suffolk, and Worcester (Figure S1). A state task force monitors drought and categorizes severity into five levels (Normal, Advisory, Watch, Warning, and Emergency) using seven indices (standard standardized precipitation, crop moisture, Keetch-Byram index, precipitation, streamflow, groundwater level, and reservoir level) (Massachusetts Executive Office of Energy and Environmental Affairs and Massachusetts Emergency Management Agency, 2013). Drought severity is determined based on where the majority of these indices occur in conjunction with forecast data for incoming weather patterns (Massachusetts Office of Water Resources, 2016, personal communication). The state task force plays only an advisory role in drought severity; it does not enforce water use restrictions during periods of drought. Drought management is the responsibility of individual towns and cities.
The MA case study simulated a 180-day drought with a severity progression that resulted in up to a 20% water reduction from normal operation. This assumed water reduction was adopted in the absence of statewide water reduction targets for different drought severity scenarios in MA and to enable comparison between the two case studies. This reduction is within range of water reductions in Virginia for a similar drought category (Virginia Department of Environmental Quality (VDEQ), 2018). The 180-day drought timeline was divided into three periods similar to what was observed in the 2016–2017 MA drought:
Period 1: Water reduction starts at Day 0 with Period 2: 30 days at 20% water reduction condition; and Period 3: Water reduction condition is improved until recovery is achieved at t=180 days, or
The above 90-day drought scenario contains the disruption parameters that are needed in equation (5). It is assumed for simplicity that the transition from one time increment to the next (in daily unit) is continuous, and latency (i.e. delay in realizing the shock) is not incorporated in the simulation. Nonetheless, resilience strategies can be embedded in future analysis, where the intent is to delay or offset the impact of the drought-triggered disruption on each sector. Rose and Liao (2005) discuss examples of resilience strategies such as inventories, production recapture, relocation, and utilization of backup facilities. Each sector has its own unique set of strategies for enhancing its resilience to curb the effects of disruptive events such as droughts. Furthermore, stakeholders in each sector arguably may also have diverse behaviors, risk aversion, and attitudinal responses to mitigate the consequences of disasters. Although such resilience strategies and modeling complexities are not directly incorporated in the current paper, a future extension could be implemented by dynamically adjusting the water-use balance ratio
In terms of the inoperability metric (Figure 1), the top 10 sector ranking in decreasing order is: Utilities (S6), Real estate (S49), Educational Services (S57), Paper manufacturing (S22), Nonmetallic product manufacturing (S9), Military (S69), Metal Manufacturing (S10), Water transportation (S34), Warehousing and storage (S39), and Accommodation (S64). The Utilities sector exhibits a disproportionately high peak inoperability compared to the other nine sectors. Its peak inoperability is 5 and 20 times higher than those of the Real estate (2nd ranked) and Accommodation (10th) sectors, respectively. This phenomenon reflects the high reliance of the Utilities sector on water availability to maintain its operation. Furthermore, manufacturing sectors are well represented in the top rankings, whereas the Farming sector is not. This is expected since the manufacturing industry is a main contributor to the state GDP while farming has a much lower contribution to the state’s production outputs (US BEA, 2016). Manufacturing accounts for 6.70% (244,000 workers) of the state workforce and 9.39% ($53.3B in 2018) of the total state outputs (US BEA, 2019b). MA has 7200 agricultural farms on 492,000 acres located mostly in western, central, and southeastern counties (Massachusetts Department of Agricultural Resources, 2021). Farming employs a relatively small workforce (26,000 workers) and produces market goods with an annual value of $475 M (USDA National Agricultural Statistics Service, 2019). For contrast, the state of California (top agricultural US state) has 69,900 farms spread out over 24.3 million acres (National Agriculture Statistics Service, 2021) with a production output worth over $50B (California Department of Food and Agriculture, 2021). Finally, we note the high inoperability ranking of the Military sector, which is on par with manufacturing. The US Department of Defense operates a large number of water and wastewater treatment facilities servicing more than three million people at military installations across the country (Strategic Environmental Research and Development Program, 2018). There are six large military bases in MA—two each for the air force, army, and coast guard—located mostly in the eastern region.
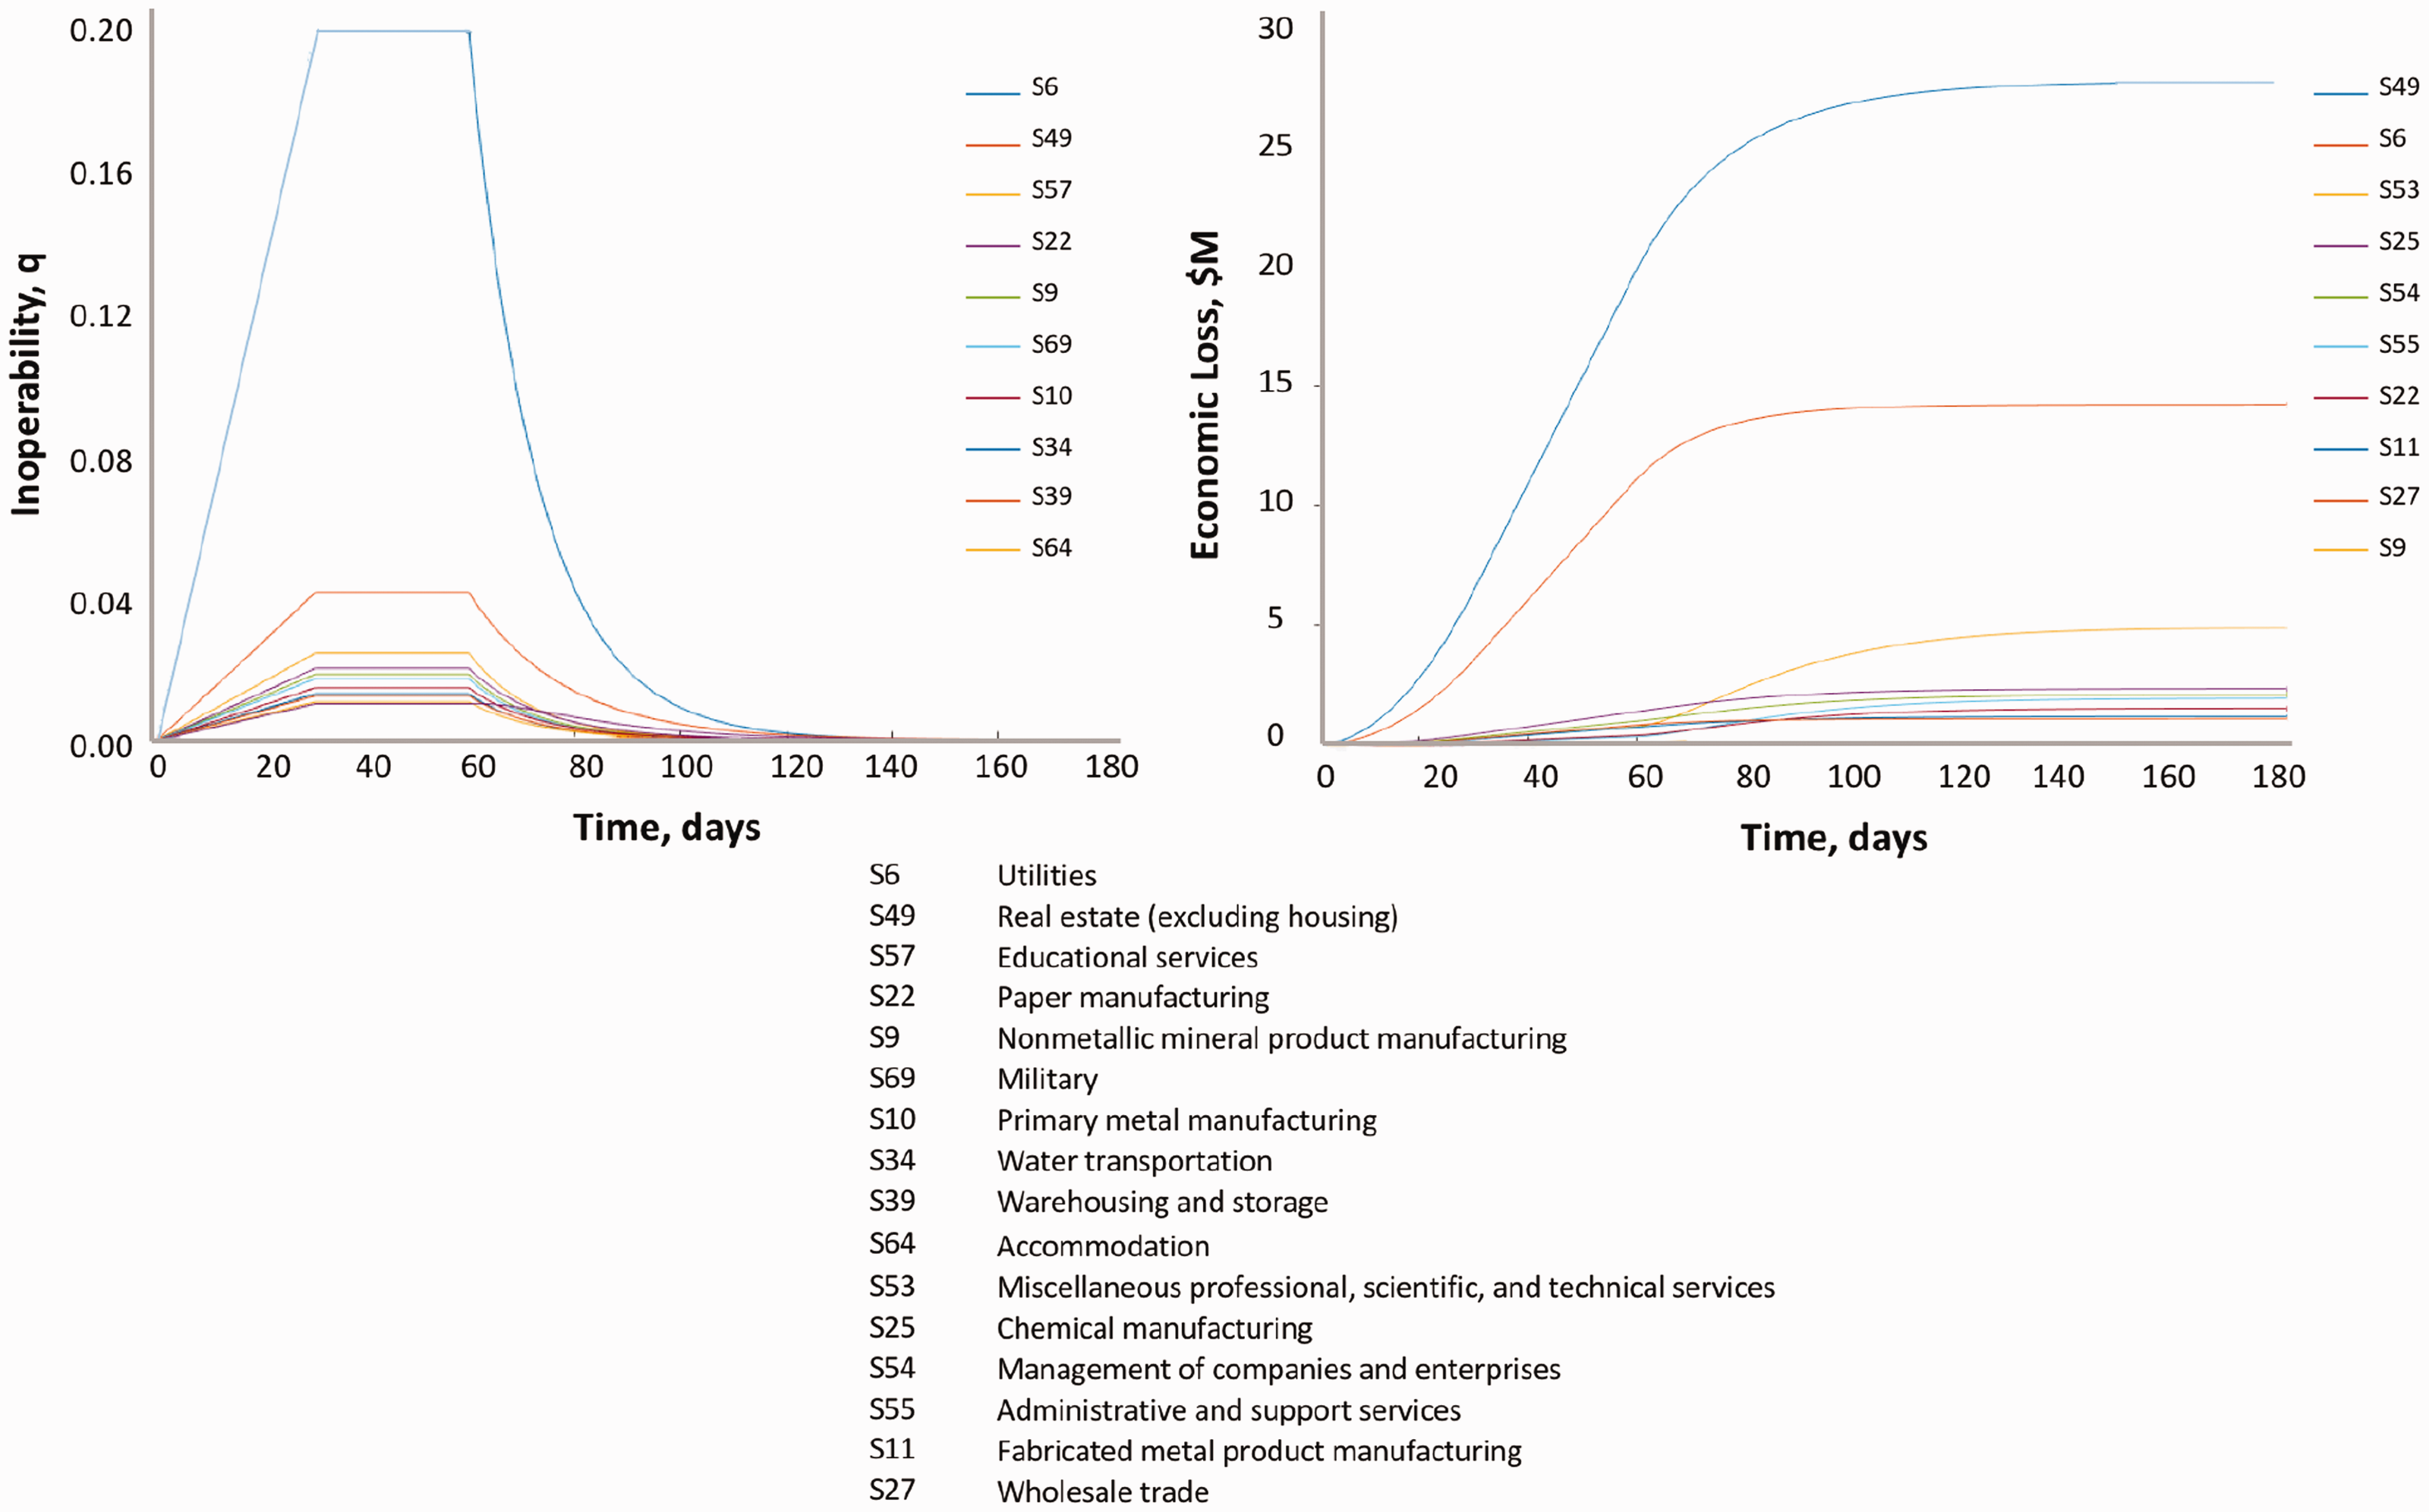
Ten most critical sectors in Massachusetts in terms of inoperability (left panel) and economic loss ($69 M, right panel).
In contrast, the top 10 ranking based on decreasing magnitude of economic loss is as follows (Figure 1): Real estate (S49), Utilities (S6), Miscellaneous services (S53), Chemical manufacturing (S25), Companies and enterprises (S54), Administrative services (S55), Paper manufacturing (S22), Metals manufacturing (S11), Wholesale trade (S27), and Nonmetals manufacturing (S9). The cumulative economic loss for these sectors is US$69 million (0.014% of the 2016 state GDP), of which 68% is incurred by the top three sectors. The total economic loss of the bottom seven sectors is less than 10% of the losses incurred by the Real estate sector (with loss of $28 M), indicating the criticality of real estate in the state’s economic outputs. The economic loss for Real estate is twice that of the Utilities sector despite the latter having a disproportionately high peak inoperability (qpeak of 0.2 vs. 0.04, Figure 1). Nearly 50% of this loss for Real estate is incurred by two counties, Suffolk (26%) and Middlesex (24%), which are both located in eastern MA. Note that Suffolk has a land area significantly smaller than Middlesex (14 times smaller); nonetheless, it encompasses metropolitan Boston, which has the 9th highest GDP among all metropolitans in the United States (US BEA, 2016). Furthermore, the economic losses by the top three sectors continue to increase significantly, even past the 60-day mark when drought conditions begin to ease. Of further note is the economic loss of Paper manufacturing, which begins to sharply rise after the 60-day mark until approximately 40 days later. Paper manufacture is a water-intensive process, with an estimated water footprint between 300 and 2600 m3/ton (Van Oel and Hoekstra, 2010). Nonetheless, such phenomenon of increased losses past mitigation conditions can be a combined result of the direct impact and ripple effects (e.g. delayed supply of other raw materials from other sectors) of water disruption.
Case study 2: US NCR (90-day, 45 days to peak, 15% disruption sustained over two weeks)
The NCR case study considered a drought scenario that could impact the US NCR, designated as the metropolitan statistical area comprising: Washington District of Columbia, 11 counties and 6 cities in Virginia (Alexandria, Arlington, Clarke, Culpeper, Fairfax, Fairfax City, Fauquier, Falls Church, Fredericksburg, Loudon, Manassas, Manassas Park, Prince William, Rappahannock, Spotsylvania, Stafford, and Warren), 5 counties in Maryland (Calvert, Charles, Frederick, Montgomery, Prince George), and 1 county in West Virginia (Jefferson). The NCR has a population of 6.2 million (2018) and is ranked #1 in terms of highest per capita income in the nation (US BEA, 2018). It also has a high concentration of federal agencies, government contractors, research facilities, and a myriad of consulting and legal firms.
The specifications for the drought scenario simulation were based on the Virginia Department of Environmental Quality Virginia guidelines (VDEQ, 2018; Virginia Drought Response Technical Advisory Committee, 2003). In Virginia, drought severity is categorized into four levels (Normal, Watch, Warning, and Emergency) based on four parameter indicators (precipitation, streamflow, groundwater level, and reservoir storage). This case study considered an Emergency category drought, which can happen if either streamflow or groundwater level falls below 5% of the normal, or if the precipitation level falls below 75% of the normal, which consequently could lead to a water supply reduction level of 10–15%. The scenario simulation assumed that the reservoir water supply will deplete in 60 days or less. Using the water IO model, we simulated an Emergency drought scenario consistent with a prior study (Pagsuyoin and Santos, 2015). Nonetheless, the data inputs have been updated to reflect the 2018 GDP and employment data of the region. In particular, this scenario simulated a 90-day timeframe decomposed into three periods:
Period 1: Water reduction starts at Day 0 with Period 2: Approximately two weeks in the 15% water reduction condition. Period 3: Water reduction condition is improved until recovery is achieved at t=90 days, or
In terms of the inoperability measure (Figure 2), the sector rankings in decreasing order are: Utilities (S6), Mining (S4), Apparel and leather and allied products (S21), Textile mills and textile product mills (S20), Electrical equipment, appliances, and components (S14), Educational Services (S57), Accommodation (S64), Pipeline transportation (S37), Support activities for mining (S5), and Federal general government (S68). The Utilities sector exhibits the most dramatic increase in inoperability. Note that water supply is a contributor to the Utilities sector (along with electric power and sewerage). Hence, the inoperability of the Utilities sector under the drought emergency scenario is likely attributed to the reduced quantity of water supply. It can be seen from Figure 2 that the inoperability for the most affected sector (Utilities) reaches a peak value close to 0.02 (i.e. 2% inoperability, or equivalently a 98% reliability). This is followed by a cluster of sectors that have reached peak inoperability values near 0.01 (i.e. 1% inoperability, or 99% reliability). These relatively “small” magnitudes of inoperability values may not look worrisome at first; nonetheless, from the perspective of six-sigma quality literature, a system is deemed reliable if its failure rate does not exceed 3.4 parts per million (which is equivalent to an inoperability value of 0.0000034).
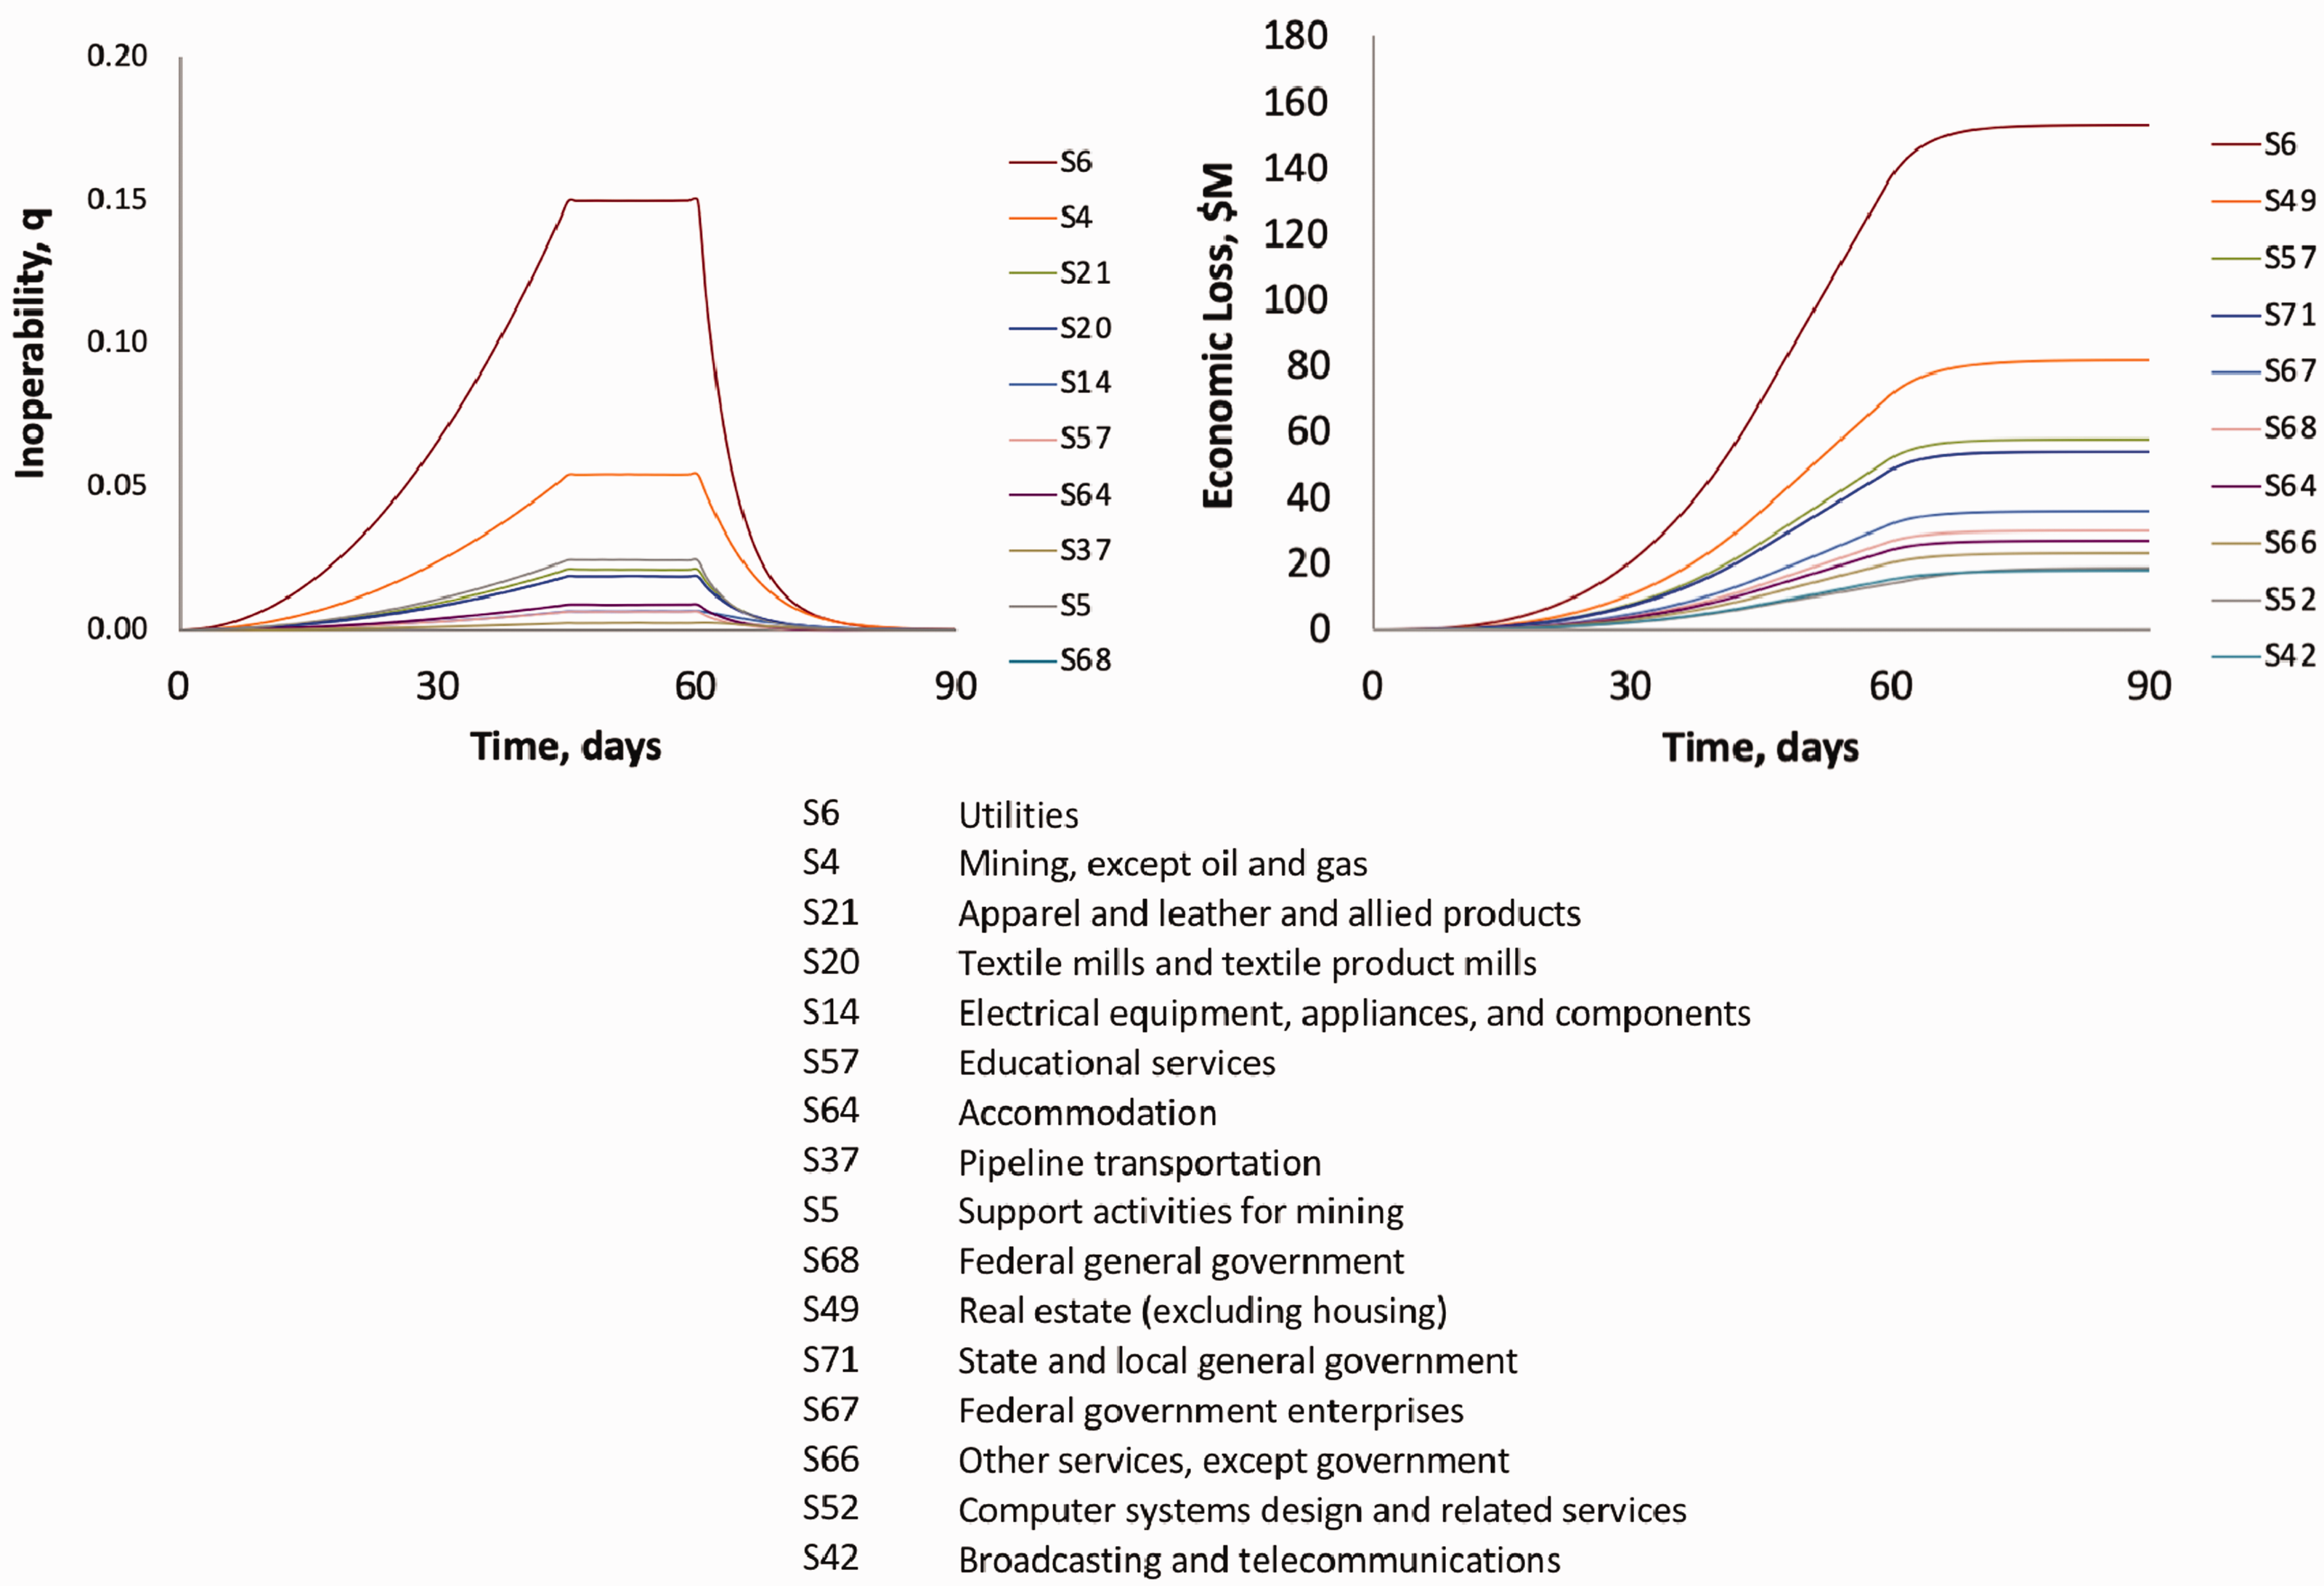
Ten most critical sectors in the NCR in terms of inoperability (left panel) and economic loss (right panel, $634 M).
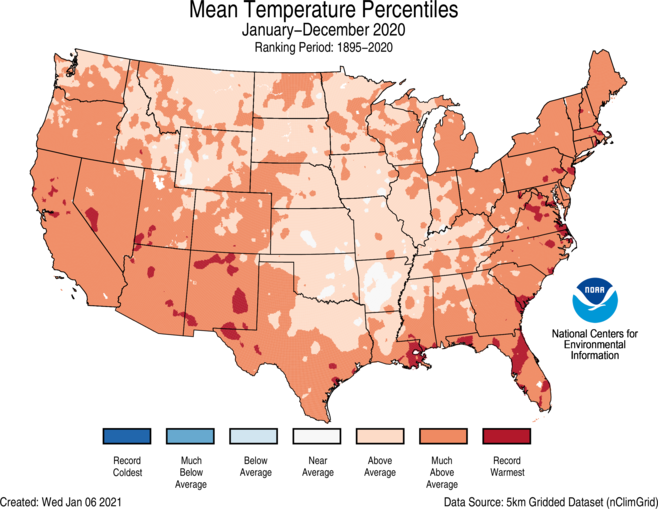
In contrast, the top 10 sectors based on the magnitude of economic losses (Figure 2) are as follows: Utilities (S6), Real estate (S49), Educational services (S57), State and local government (S71), Federal general government (S68), Accommodation (S64), Other services (S66), Federal government enterprises (S67), Computer systems design and related services (S52), and Retail trade (S31). The cumulative economic loss for these sectors is around US$634 million. About a quarter of this loss is incurred by the Utilities sector and 12% by the Real estate sector. Generally, (with the exception of the Utilities sector) it takes about 10 days from the start of the water supply disruption for economic losses to increase exponentially. Furthermore, the sectors continue to realize economic losses after water supply is mitigated, although the incremental losses begin to decelerate. This particular drought emergency scenario simulated in this study is consistent with findings in the Commonwealth of Virginia Hazard Mitigation Plan, which indicated that the Northern counties of Virginia have experienced the highest number of drought events for the periods between 1950 and 2016 (Virginia Department of Emergency Management, 2018: 27). Furthermore, the Northern Virginia region and contiguous counties have recorded the warmest mean temperatures between 1895 and 2020 (National Oceanic and Atmospheric Administration, 2021). According to the simulation, the most impacted sectors in terms of economic losses (such as utilities, real estate, educational services, state and local government, among others) are those that have high visibility in the region and also contribute significantly to the regional GDP (US BEA, 2018).
Implications to water use and drought risk management
Implementing the adaptive and dynamic inoperability IO model to two urban regions provides a comparative analysis of the distribution of urban economic losses due to a drought scenario. The case studies of MA and the NCR showcase two regions with distinct economic landscapes: (1) MA, a state comprising of a diverse mix of highly urban (eastern) and rural (western) subregions and (2) NCR, which is predominantly urbanized, encompassing the cities of Washington, Alexandria, Arlington, and surrounding counties in Virginia, Maryland, and West Virginia. The results of the case studies reveal several interesting findings that capture the general traits of urban regions as well as the distinct characteristics of MA and NCR. In both case studies, the Utilities and Real estate sectors are among the most economically vulnerable to water disruptions resulting from drought events, whereas the Farming sector was not at the top of the list of critical sectors. Likewise, an assortment of service sectors (education, administrative, computer systems) is also in the top 10 critical sectors in both regions. In MA, manufacturing sectors, which contribute significantly to the state GDP, are well represented in the top sectors in both inoperability and economic loss metrics. In the NCR, where many federal government headquarters are located, government-related sectors incur among the highest economic losses. The Accommodation sector in the NCR is also in the top rankings for inoperability and economic loss. Note that the NCR is home to world renowned museums, monuments, and landmarks.
With respect to policymaking, regional urban water management and use prioritization, particularly during periods of reduced supply resulting from drought events, should be viewed under a more holistic lens, where both economic impacts and operational disruptions to sectors are considered. Droughts can cause significant impacts on urban economies, particularly in regions with high economic activity and productivity. The case applications of the water IO model extension provide insights for drought risk analysis and management, specifically in the context of identifying sector vulnerabilities and interdependence. The results of the case studies demonstrate that urban economies, even geographically proximate regions, can exhibit distinctly different vulnerabilities to similar drought events, depending on the region’s economic activities and the sectors’ reliance on water supply. For policymakers, the inoperability and economic loss metrics can provide measures of a sector’s drought vulnerability and resilience and guide decisions on water use management during drought events. A sector may rely heavily on water availability to continually generate its output (i.e. product or service) even if this output has relatively low economic value, in which case, such a sector can be considered highly vulnerable to operational disruption but not necessarily to severe economic impact. Conversely, a sector can experience larger economic losses despite lower dependence on water if its output has higher economic value. It should be emphasized that decisions on water use management should not be based solely on the sector rankings. Sectors are inherently interdependent; disruptions in one sector can cause regional ripple effects through their economic linkages. With these considerations, the policymaker could implement equitable drought mitigation strategies that balance these two vulnerability metrics while being mindful of the collective effects on all sectors within the urban region.
Concluding remarks and future work
In this paper, we customized the Leontief IO model to analyze the economic losses that could arise from water supply disruptions. The IO model has been extended to assess the temporal effects of drought scenarios on economic sectors and uses the inoperability variable to express the extent to which each sector is affected by water supply reductions. A new adaptive feature has been embedded in the inoperability model, which provides a capability to update the inoperability path within the recovery horizon. This path of inoperability can be modified to account for the time-varying levels of drought severity, the likelihood of drought occurrence, and the sectors’ dependence on water (i.e. water-balance ratios). The case studies for MA and the US NCR indicate that the utility and real estate sectors incur the highest economic losses. In the MA case study, four manufacturing sectors (chemicals, paper, metal products, and nonmetallic mineral products) are among the sectors with the highest economic losses. These sectors are indeed significantly present in the MA (US BEA, 2019b). In the NCR case study, government-related sectors (state and local general government, federal government enterprises, and federal general government) incur among the highest economic losses. This result is intuitive since the NCR region is home to a myriad of federal agencies and enterprises. It is important to analyze the magnitude of economic losses in the context of regional GDPs. The current GDP for the MA and NCR are within the same order of magnitude: US$569 billion and US$541 billion, respectively (US BEA, 2019b). However, the overall economic loss for the MA (USD $69 million) is dramatically lower than that of the NCR (USD $634 million). This difference can be explained by the dependence of the sectors on water. The per capita water use is generally higher in urban areas, and since NCR is more urban and has a higher density of businesses/households relative to the state of MA, it is intuitive for the economic loss to be more pronounced in the NCR.
With respect to future work, other model extensions can include water demand and supply management strategies that can reduce the inoperability and economic losses across the economic sectors. Examples include water-use restriction, water-use prioritization, and exploring supplementary water supply sources, among others. Model extensions can also generate spatially explicit maps to visualize the concentration of losses in the region. Future work can also investigate the extent to which water management strategies can enhance the resilience of the sectors and the entire region. The water IO model can be applied to other regions or various drought categories to better understand the behavior of economic sectors depending on drought severity.
In summary, water is a key resource and essential in supporting economic livelihoods and the productivity of economic sectors. Constraints with water supply availability coupled with population growth will only further increase the urgency for developing models and policies to enhance regional resilience and reduce the adverse consequences of water supply disruptions, such as what would occur in times of droughts.
Supplemental Material
sj-pdf-1-epb-10.1177_2399808321998703 - Supplemental material for Modeling regional impacts and resilience to water service disruptions in urban economies
Supplemental material, sj-pdf-1-epb-10.1177_2399808321998703 for Modeling regional impacts and resilience to water service disruptions in urban economies by Sheree A Pagsuyoin and Joost R Santos in Environment and Planning B: Urban Analytics and City Science
Footnotes
Declaration of conflicting interests
The author(s) declared no potential conflicts of interest with respect to the research, authorship, and/or publication of this article.
Funding
The author(s) disclosed receipt of the following financial support for the research, authorship, and/or publication of this article: This work was supported by the Massachusetts Water Resources Research Center (WRRC Grant No. 2016MA450B) and the National Science Foundation (NSF Grant No. 1832635). The views expressed in this paper or those of the authors and do not represent the position of the WRRC nor of the NSF.
Supplemental material
Supplemental material for this article is available online.
References
Supplementary Material
Please find the following supplemental material available below.
For Open Access articles published under a Creative Commons License, all supplemental material carries the same license as the article it is associated with.
For non-Open Access articles published, all supplemental material carries a non-exclusive license, and permission requests for re-use of supplemental material or any part of supplemental material shall be sent directly to the copyright owner as specified in the copyright notice associated with the article.