
Abstract
Industry cluster development is important to stimulate regional economy. Conventional spatial methods for detecting industry clusters use a pairwise manner to infer the co-location relationships of multiple industrial types or instances, which increases the difficulty of interpreting the results. This study proposes to use co-location patterns (CPs) mining method to directly capture the co-location of multiple industrial types from the bottom up without any conditions of data relations defined a priori. The method is applied in Dongguan, China, to investigate the industry cluster patterns at an intra-urban scale. At the city level, the results show prevalent CPs of information communication and technology industry and other associated sectors. At the sub-regional level, however, approximately 41% of the industrial CPs are different from those obtained at the city level. The local features of sub-regional industry clusters are associated with productions of, for instance, sporting goods and toys, digital instrument and office equipment, machine parts and woodware, and textile-related products.
Introduction
The spatial organization of economic activities is a focal topic in economic geography. Empirical studies in this field have revealed the spatial tendency for the concentration of economic activities due to the agglomeration economies that promote efficiency. In particular, the concentration of industry is of prominent interest in both developed and developing countries because industry cluster developments have been recognized as an effective policy tool to enhance the competitiveness of enterprises and revitalize the economic conditions in declining regions (López and Páez, 2017; Sun et al., 2020). Today’s common understanding of industry clusters was mainly based on the theory proposed by Michael Porter (1998), in which an industry cluster refers to a geographically concentrated group of firms in related industries. Companies of a certain industry cluster often reach a balance between cooperation and competition, while their interactions can promote entrepreneurship and new venture creation. The quest for industry cluster developments is encouraged in many countries and has even reached international organizations (Motoyama, 2008). Within this context, it is critical to accurately measure and capture the occurrence of industry clusters in a certain geographical area.
This study contributes methodologically to the literature by applying a bottom-up approach to detect industry clusters based on the co-location patterns (CPs) mining method. The applications of CPs mining can provide useful implications for modeling, theoretical testing, and practices relevant to regional industrial developments (see Section “Implications of the results”). At the best of our knowledge, no previous studies have applied the algorithm of CPs mining to understand the organization of industry clusters.
CPs mining is a kind of method that aims at discovering spatial co-locations of multiple features. CPs mining can quantitatively report the size and degree of the prevalent patterns of industrial co-location. Compared with conventional methods in detecting economic concentration, such as location quotient (Porter, 2003), CPs mining is purely based on a spatial dataset of points without any conditions of data relations defined a priori. Moreover, the CPs mining method can directly capture the co-location relationships of multiple industrial types, while conventional methods usually adopt a pairwise manner to infer the co-location relationships (Leslie and Kronenfeld, 2011). With the data of enterprise location points, it is feasible to obtain the structure of industrial clusters by using the CPs mining method.
The CPs mining method is applied in the city of Dongguan, which is a fast industrializing city in China. We acquire the point data of enterprises from the national economic census of China in 2013. It is worth exploring how industry concentration varies throughout different geographical sub-regions, thereby revealing the unique industry clusters that are region-specific. Therefore, although CPs mining does not require the input of region polygons, we preprocess the data points to identify the representative industrial sub-regions using hot spot analysis before the mining procedures. We then implement the CPs mining algorithm for each sub-region and the entire city as well. We analyze our experimental results and discuss the findings and implications. Moreover, two typical metrics (cross-K function and CLQ) are calculated for all industrial sectors so that we can compare their results with our work to highlight the contribution of introducing CPs mining method into industry clustering.
Related work
Conventional methods of industry cluster detection
A variety of indicators and methods have been proposed to quantify the spatial patterns of industry clusters. These methods can be categorized into three generations, as summarized by Duranton and Overman (2005). Methods in the first generation refer to those developed based on pure non-spatial statistics, such as the location quotient (Porter, 2003) and the Gini’s index. The second-generation methods, including the global and local Moran’s I indices (Anselin, 1995), explicitly incorporate the spatial properties of the underlying concentration patterns. The third generation refers to those distance-based methods (Marcon and Puech, 2017). Ripley’s K function becomes the most famous one (Ripley, 1976), which is capable of analyzing the concentration patterns adaptively across different spatial scales. The Q statistic (Ruiz et al., 2010) and the CLQ method (Leslie and Kronenfeld, 2011) also belong to this set. The Q statistic detects co-location relationships by summarizing the class membership of all instances in a neighborhood, with the neighborhood size being defined a priori (Páez et al., 2012). The CLQ, however, originating from the classical specialization measurement of location quotient in economic geography, is designed to reflect potential co-location relationships between two types/categories of instances (Leslie and Kronenfeld, 2011).
These three generations of methods can further be separated into two groups from geographical perspectives (Garrocho-Rangel et al., 2013): discrete-space methods vs. continuous-space methods. In the former, the region being analyzed is divided into sub-units with an arbitrarily chosen level (e.g. municipalities, counties, and towns). Then indicators such as LQ, Gini’s index, and Moran’s I are applied to these sub-units to evaluate industry concentration. The latter group of methods mainly consists of distance-based methods, which treat a locality as a continuous space instead of a collection of discrete sub-units. Some of these methods, such as Ripley’s K function, often present the results by plotting a function of distance against the reference function of the null hypothesis to indicate whether a clustering pattern exists. The Q statistic can reveal the co-location relationships of multiple types of instances, and the results may contain co-located instances of the same class/type (e.g. the same ethnic group). The CLQ method can also handle multiple types, but it evaluates the co-location relationships in a pairwise manner. Empirical studies of industry clusters have been carried out using either discrete-space methods or continuous methods or a combination of them (Dubé and Brunelle, 2014; Mori and Smith, 2015).
Despite the extensive applications of these conventional methods, they are suffering from several important limitations. The discrete-space methods rely on aggregated data and fail to concern the spatial positions where economic activities actually take place. The arbitrarily chosen discrete units may cause the issues related to the ecological fallacy and the modifiable areal unit problem (Garrocho-Rangel et al., 2013). These methods are sensitive to the configuration of areal units and difficult to compare when changing aggregation levels or geographical regions. For some continuous-space methods (e.g. Ripley’s K function), they determine the results by comparing them against a theoretical reference with the assumption of a spatial Poisson process. However, such a reference is not meaningful as the locations of economic activities are subject to many institutional and geographical determinants rather than purely random and independent (Scholl and Brenner, 2016). For the Q statistic and the CLQ method, their results are difficult to interpret when there are too many types in the data, which causes the explosion problem in the number of resulting patterns.
Co-location patterns mining
A spatial CP refers to a collection of spatial event/feature types whose instances are frequently located together in close geographic proximity (Shekhar and Huang, 2001). Therefore, as a newly developed branch of spatial data mining, CPs mining is to identify the spatial co-location relationships among different types of spatial events/features from a point dataset (Wang et al., 2009). It stems from the traditional association rules analysis in data mining, extending it by incorporating the concept of spatial proximity. However, CPs mining is substantially different in that it must handle implicit data relations rather than explicit ones such as transactions in association rules analysis.
The connection operation of multiple instances and their features, as the basis of CPs mining, requires a massive computation and storage space. Thus, studies have developed various strategies to improve efficiency. Early CPs mining methods used the “join-based” and the “Apriori-like” algorithms to connect instances and generate prevalent co-locations (Shekhar and Huang, 2001), which had been found inefficient with large-size data. However, these “Apriori-like” methods suffer from the large consumptions of both time and storage space. To address these problems, Wang et al. (2009) proposed a maximal framework constructing long-size candidate maximal co-locations in their order-clique-based method. Different from previous studies, the maximal framework extracts candidate long-size co-locations based on size-2 instance table and further prunes the tree (a hierarchical structure storing connecting instances cliques) to verify the existence of candidate co-locations. This method effectively reduces the calculation of massive instance cliques and is considered a “bottom-up” mining way. Yao et al. (2016) further improved this maximal framework by using a sparse undirected graph to find candidate maximal co-locations and constructing a condensed instance tree in the pruning step. The former helps to extract candidate maximal co-locations more efficiently, and the latter eliminates most of the tree-based operations, reducing the time complexity and storage requirement.
Many recent studies of CPs mining focus on the development of more efficient methods to handle different spatial applications (Yao et al., 2018; Yu et al., 2017), while others extend the traditional point-based CPs mining algorithms to cases with different data formats (Leibovici et al., 2014; Yu, 2019). Overall, CPs mining has yielded important insights in the fields such as facility management, public security, and environmental studies (Chen et al., 2020; Deng et al., 2017). With the increasing availability of spatial micro-data, it is feasible to apply CPs mining to automatically identify the underlying industry clusters and their compositions.
Compared to the conventional industry cluster detection methods, the approach of CPs mining has several significant advantages: First, CPs mining requires no conditions of data relations and spatial tessellations defined a priori. Second, CPs mining can directly capture the co-location relationships of multiple industrial sectors, while many conventional methods, such as Ripley’s K function and the CLQ approach, can only address the co-location relationships of two sectors. Third, unlike the Q statistic that analyses the co-location relationships among spatial instances (i.e. individual companies), CPs mining directly generalizes the patterns of co-located industrial types, which are more straightforward and easy to understand.
Study area and data
We select the city of Dongguan as the case study area (Figure 1). Since the implementation of the reform and opening policies in the late 1980s, Dongguan attracted a massive amount of foreign investments by providing tax breaks or return, free land supply, low-cost labor, and subsidies. The current industrial system of Dongguan consists of industries such as the manufacture of communication equipment, computers and other electronic equipment, manufacture of electrical machinery and equipment, manufacture of instruments and meters, and so on.
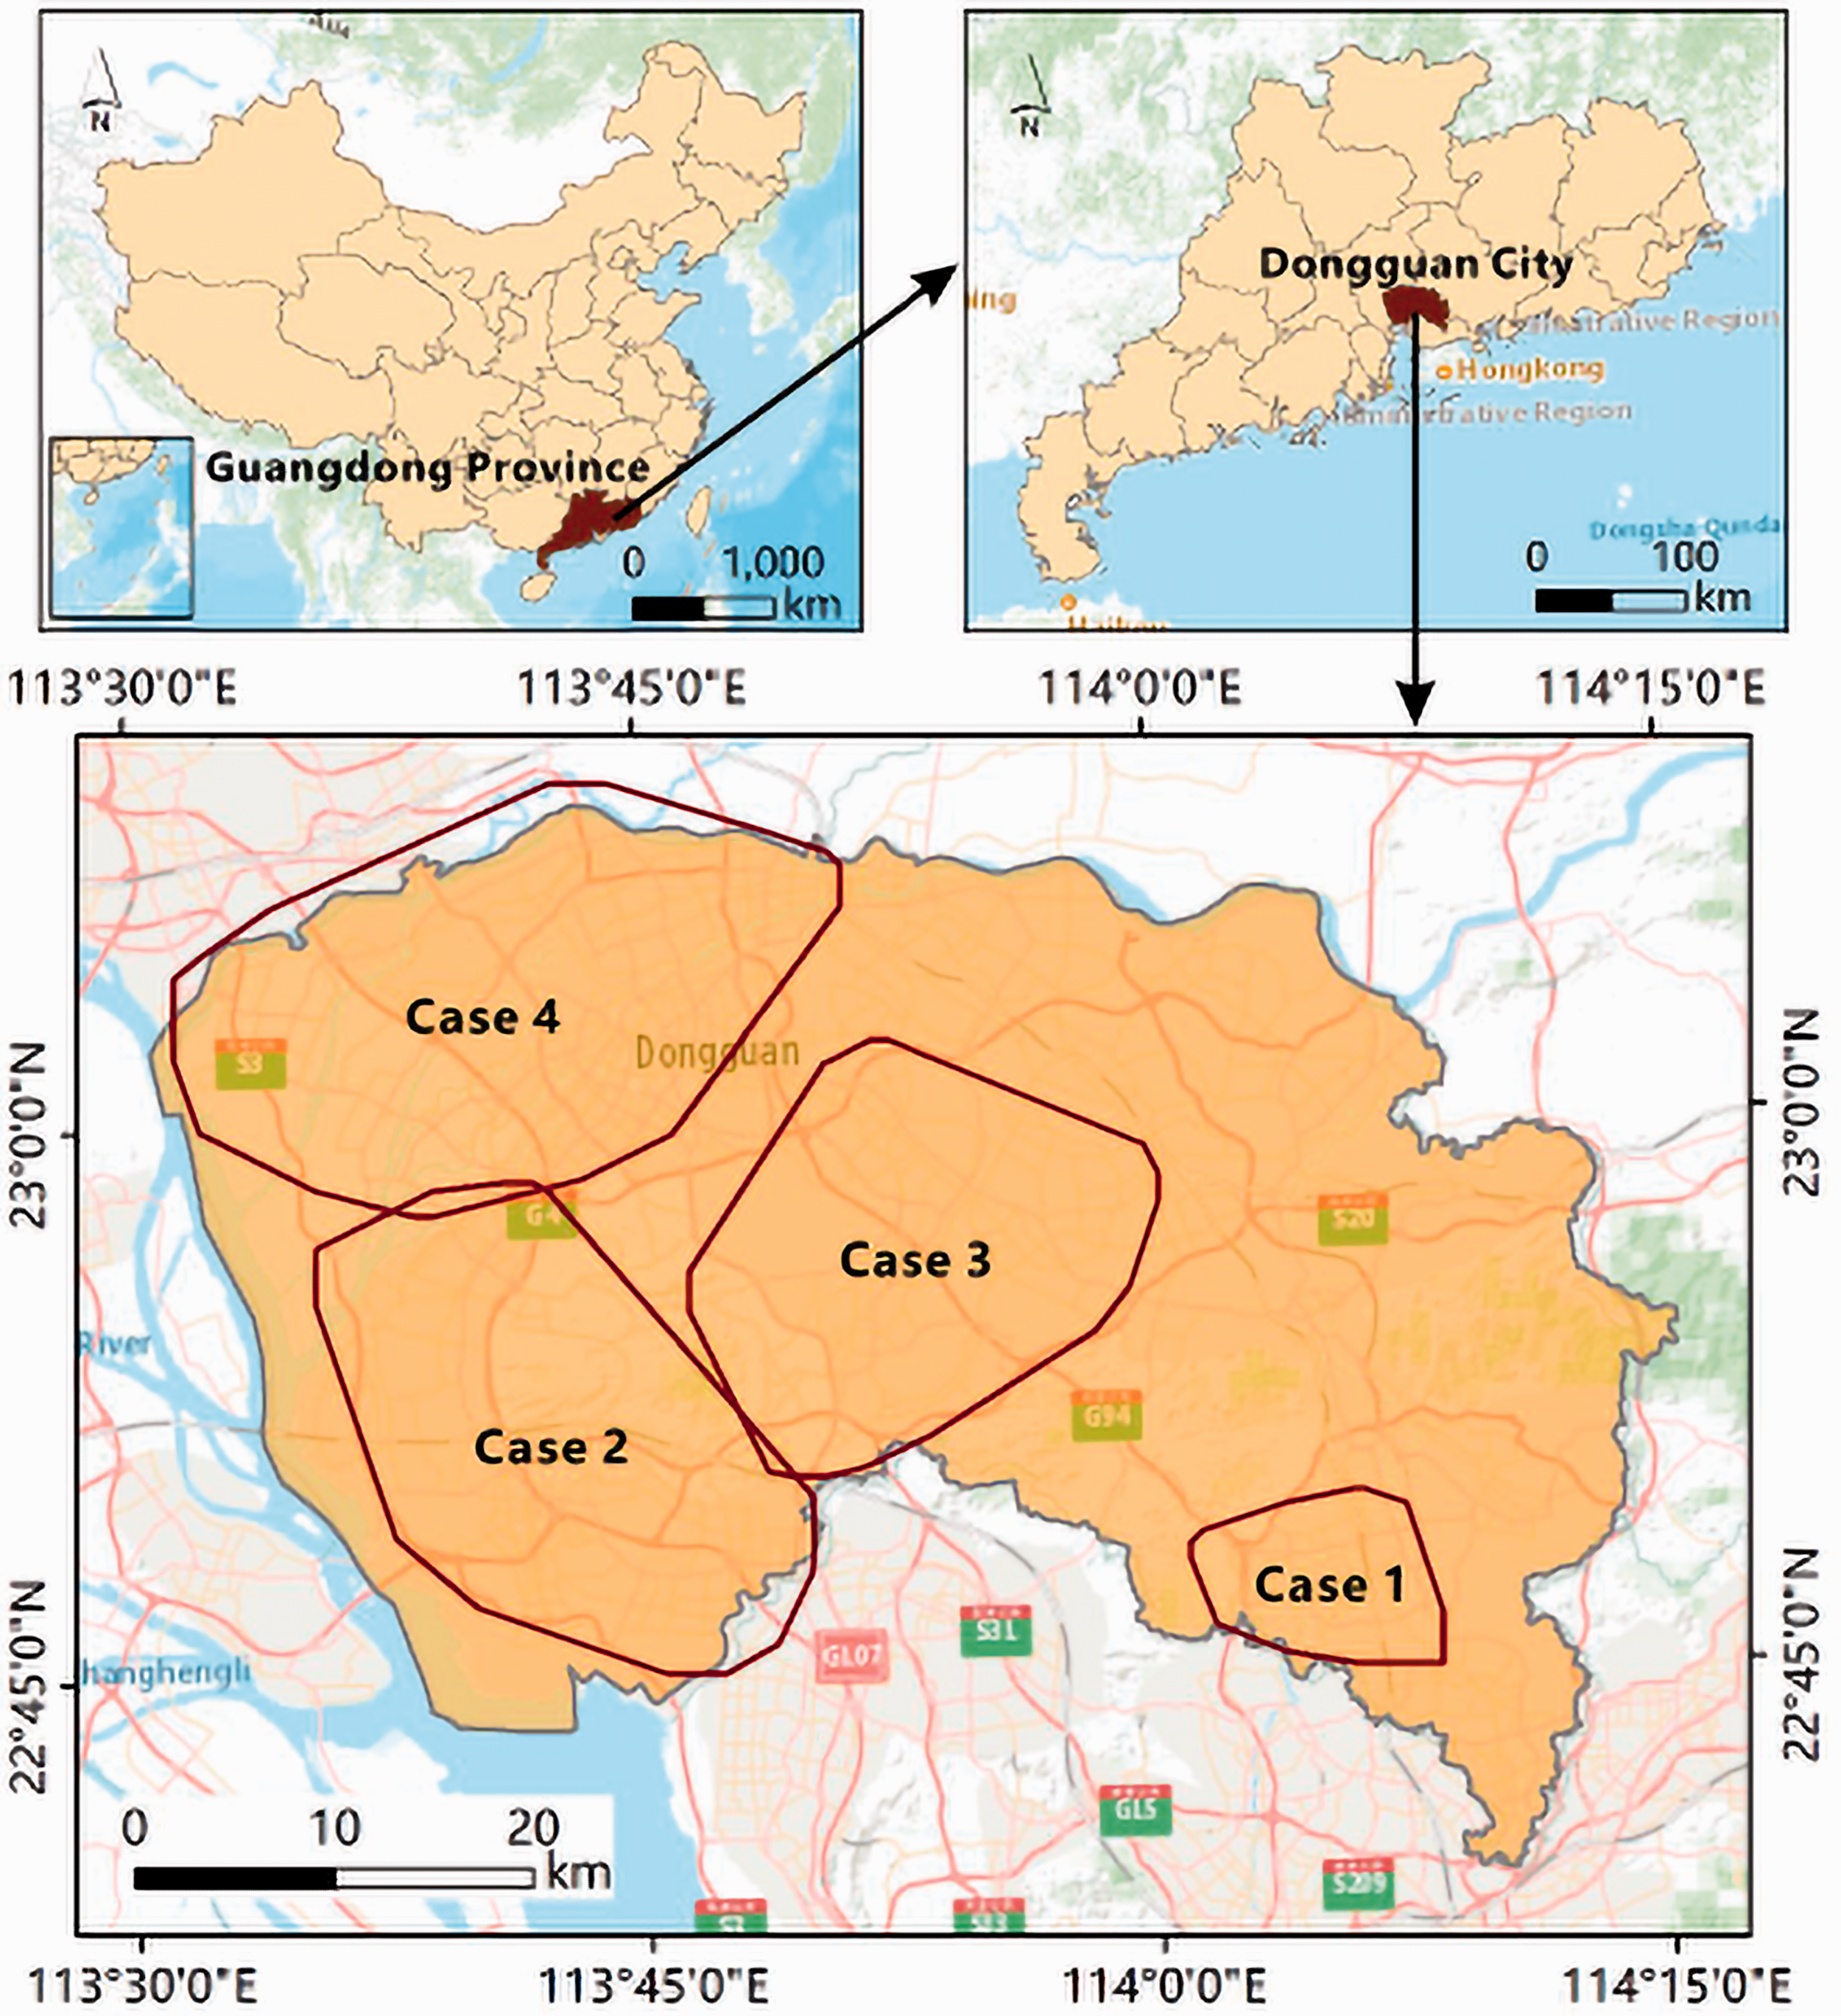
The geographic location of the study area: Dongguan, China. The case polygons with red boundaries indicate the hot spot areas generated from the enterprise data points.
The dataset in our experiment was collected from the third national economic census of China in 2013. We acquired the enterprise data of Dongguan for 30 industrial sectors. Each enterprise record is associated with the geographic coordinates and its sector code defined according to Industrial Classification for National Economic Activities (GB/T 4754-2002). To avoid the influence of sparse data, we eliminated six sectors with less than 100 enterprise records. Eventually, the experiment was conducted with the data of 42,794 enterprise records distributed in 24 industrial sectors. For ease of descriptions, we use the abbreviated sector names (Supplementary Table S1) instead of the full sector names in the following sections.
The point data of enterprises (Supplementary Figure S1(a)) were first processed to identify the representative industrial sub-regions. This processing was implemented using the tool of Optimized Hot Spot Analysis provided by ArcMap 10.4.1, which calculates the Getis-Ord Gi* statistic and creates a hot spot map for the input incident points. Therefore, the point data of enterprises were used to generate the hot spot maps for each industrial sector. A total of 24 maps corresponding to the industrial sectors were then created and stacked using the conventional spatial union analysis. The spatial union analysis resulted in a few large polygons and many small ones (Supplementary Figure S1(b)). We extract four polygons whose area is greater than the mean value and consider them as representative hot spot areas (Supplementary Figure S1(c)). Finally, the convex hulls of the four extracted polygons were generated and used as the boundaries of the four representative industrial sub-regions (Supplementary Figure S1(d)).
Methodology
We assume a set of industrial type F = {f1, f2, f3, …, fn} and their instance objects O = {o1, o2, o3, …, om}. Here feature fn represents the nth industrial type, and om represents an individual enterprise point in the planar space with the information of <instance ID, feature type fi, location(X,Y)>. In other words, F is the collection of all industrial sectors and O is the collection of all enterprise points. Before implementing the co-location mining algorithm, the elements of F are reordered alphabetically by type names.
The mining of prevalent CPs is implemented in four steps (Supplementary Figure S2) (Yao et al., 2018): First, instance pairs are identified based on the Voronoi diagram approach. Second, a table is constructed to store the filtered instance pairs, which is referred to as a size-2 instance table T. These instance pairs in T can be used to form the candidate size-2 CPs. Here a size-2 CP refers to a CP that involves two industrial types/sectors, and in general, a size-n CP represents a CP that involves n different industrial types/sectors. Third, the candidate size-2 CPs are used to compose the maximal size-n CPs, where n > 2. Specifically, a prevalence index (PI) is calculated for each candidate size-2 CP. Any candidate size-2 CPs with PI values exceeding a given threshold Min-prev are treated as the prevalent size-2 CPs. Then all prevalent size-2 CPs are connected to one another to form a graph. A maximal clique algorithm is further applied to the resulting graph, generating all candidate maximal CPs with more than two industrial types. Fourth, the candidate maximal CPs are evaluated or pruned using the PI approach to generate the final prevalent maximal CPs. More details are specified below.
Instance pairs generation
In this step, instance pairs are generated using a Voronoi diagram approach. To better understand this technical procedure, we use a simple example with Fexample = {fa, fb, fc, fd}. First, a Voronoi diagram is created based on the instances of fa, resulting in a set of polygons whose kernels correspond to the instances of fa. Second, within each polygon, the instances of types fb, fc, and fd are paired to the polygon kernel. This procedure, therefore, creates a collection of instance pairs related to sector fa. These two processing steps are also applied to fb, fc, and fd accordingly. Note that instance pairs of, for example, types fa and fb are equivalent to instance pairs of types fb and fa, and only the former are stored while the latter are discarded. Because all instance pairs involve two different industrial types, they are also referred to as size-2 instances and will be stored in a table (see Section “Size-2 instance table and candidate maximal CPs generation”). The spatial proximity of these instance pairs is measured using Euclidean distance. A distance threshold is further applied to these instance pairs. Only the instance pairs with a distance smaller than the threshold are reserved and those having a distance greater than the threshold are excluded from subsequent analysis.
Size-2 instance table and candidate maximal CPs generation
The resulting instance pairs are stored in a size-2 instance table T with a hash table structure (Yao et al., 2016). Taking the same example mentioned in Section “Instance pairs generation” (Fexample = {fa, fb, fc, fd}), the structure of the size-2 instance table is illustrated in Supplementary Figure S2(b). This table is indexed by industrial types. All instance pairs of the same combination of types are stored at the corresponding table position using a list structure. For instance, the table element T(fa, fb) (denoted as * in Supplementary Figure S2(b)) stores a list of instance pairs of types fa and fb. As aforementioned, instance pairs of types fb and fa are excluded, and hence, table element T(fb, fa) is left empty. The diagonal elements are empty as well. Therefore, the size-2 instance table T indeed is an upper triangular matrix.
The size-2 CPs can then be easily generated according to T. For any two industrial types, if they have a non-empty list of instance pairs, they form a size-2 CPs. For instance, if table element T(fa, fb) is non-empty, then fa and fb form a size-2 CP {fa, fb}. However, the observed co-location relationship of fa and fb could be accidental rather than prevalent across space. Therefore, the immediate size-2 CPs derived from T are called candidate size-2 CPs, and their prevalence should be evaluated before further analysis. The prevalence evaluation is based on the following equations (Shekhar and Huang, 2001; Yao et al., 2018)


The resulting prevalent size-2 CPs are used to form a graph, in which the industrial types are treated as nodes N = {n1, …, nλ} and the prevalent relationships (if exist) between types are regarded as edges E = {e1, …, ev}. For instance, given two prevalent size-2 CPs {fa, fb} and {fa, fc}, a graph is formed with two edges connecting nodes {na, nb} and nodes {na, nc}, while no edge exists between nb and nc.
With the resulting graph, the adapted Bron–Kerbosch maximal clique algorithm (Cazals and Karande, 2008; Tomita et al., 2006) is implemented to extract all maximal CPs (i.e. the size-n CPs) whose sizes should be greater than two (n > 2). Again, the resulting size-n CPs are called the candidate size-n CPs, because their prevalence should be further evaluated (see Section “Prevalent maximal CPs generation”).
Prevalent maximal CPs generation
The candidate size-n CPs are evaluated according to their PI values. Specifically, the instance cliques of each candidate size-n CPs are acquired from the size-2 instance table T using the condensed tree algorithm proposed by Yao et al. (2016). A brief explanation is provided in the Supplementary Material, while more details with illustrations can be found in Yao et al. (2016). The prevalence of the resulting instance cliques is then evaluated using PI. If a candidate size-n CP has a PI value greater than Min-prev, it is treated as a final prevalent CP; otherwise, it is divided into subsets with size of n – 1. The condensed tree algorithm is again implemented to obtain the instance cliques for each CP subset and the PI value can be calculated accordingly. The CP subsets with PI values greater than Min-prev are also reserved as the final prevalent CPs. For the CP subsets with PI values smaller than Min-prev, the dividing process continues until all prevalent CPs with n ≥ 3 are found.
Implementation and results
The CPs mining method was implemented separately for the cases of the entire city and the four sub-regions. Empirically, the Min-prev is set between 0.1 and 0.5 (Leibovici et al., 2014; Yao et al., 2016; Yoo and Bow, 2011). High values of Min-prev may yield too few CPs, while low Min-prev values may increase computation time and generate too many results of CPs. Therefore, in our analysis, the Min-prev was set moderately as 0.3. The distance thresholds were set between 200 and 500 m. The choices of these distance thresholds were based on previous CPs mining studies (Yao et al., 2017; Yu et al., 2017), in which a similar range of distance threshold was used. Empirical research also suggests that this range of distance threshold is suitable to represent spatial interactions at the intra-urban scale (Okabe et al., 2009; Porta et al., 2009).
The experimental results demonstrate that the number of prevalent CPs rapidly grows when enlarging the distance threshold from 200 to 500 m. A greater distance threshold also allows the emergence of CPs with large size. The experiment with a distance threshold of 500 m yielded 816 CPs at the city level and 1352 unique CPs for the four sub-region cases. Approximately 85% of the city-level CPs can also be found in the four sub-regions. Contrastingly, only 59% of CPs generated from the sub-region cases are consistent with those obtained at the city level. For each sub-region, the results of case #1 sub-region feature the highest consistency toward those at the city level (91%) while those of case #4 sub-region feature the lowest (68%).
Prevalent industrial clusters at city level
The resulting city-level CPs are illustrated using an undirected network with PI-weighting edges, as shown in Figure 2. Representative examples can be found in Supplementary Table S2. The greatest intersectoral connections, as measured by PI values, exist in the subnetwork consisting of seven industrial sectors, including Computers and Related Equipment, General Machinery, Special Machinery, Electrical Machinery, Metal Products, Plastics, and Paper (see Supplementary Figures S3 and S4 for details).
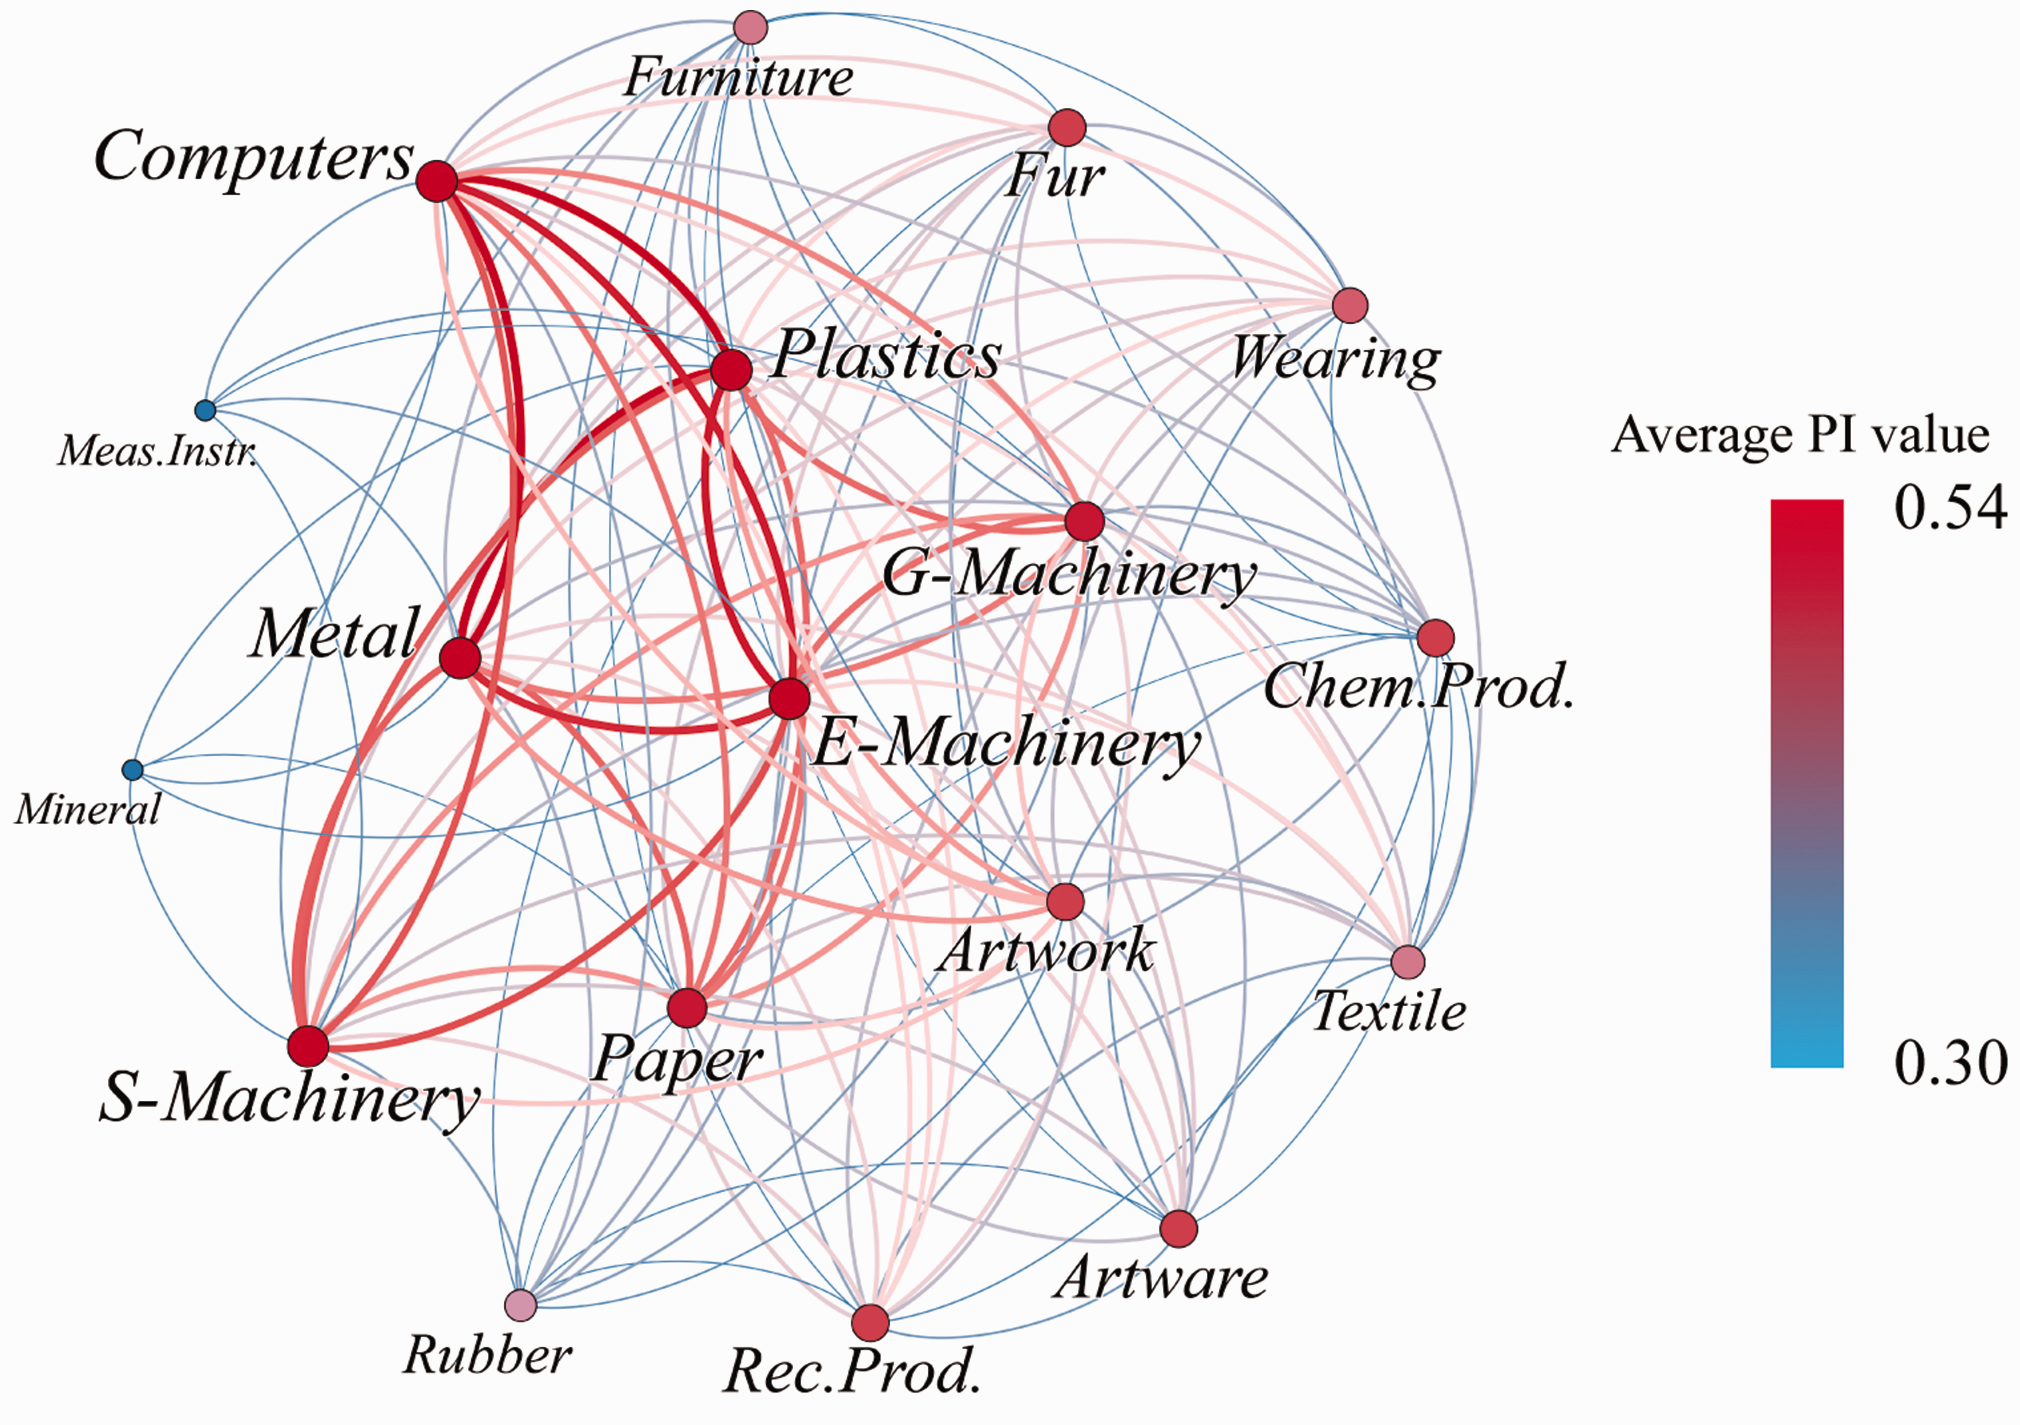
Sectors involved in the city-level prevalent CPs and their intersectoral connections weighted by the PI values (distance threshold = 500 m). Note: Please refer to Supplementary Table S1 for the full name of enterprises.
These CPs suggest the existence of potential sectoral cooperation among these seven sectors. In Dongguan, the Computers and Related Equipment sector mainly produces electronic components and computer peripheral equipment. They are largely related to the sectors of Metal Products and Plastics, whose products are the necessary materials for computer manufacturing. Furthermore, the Computers and Related Equipment sector is associated with the sectors of Electrical Machinery and Special Machinery, with the former supplying power devices, wires and cables while the latter producing models and tooling. These five sectors also have connections with the sectors of General Machinery and Paper, respectively. The General Machinery sector in Dongguan is specialized in the production of standard components (such as fasteners, springs, and other machine parts) and metalworking machines, which are essential to the computer manufacturing and associated industries. The Paper sector, however, mainly supplies electrical insulation papers and paper board (for packing).
Additionally, the Artware/Sporting Goods industries, which produce toys and sporting goods, are found frequently co-located with the industries of Electrical Machinery, Metal Products and Plastics, Computers and Related Equipment, and Special Machinery for equipment supports. Similar spatial linkages can also be witnessed among the sectors of Textile (e.g. for fabric products), Wearing Products (e.g. for garments and shoes), and Fur (e.g. for leather related products). The size-4 CPs shown in Supplementary Table S2 further suggest the spatial associations among the industries of Chemical Products, Rubber, and Furniture, while the size-3 CPs highlight the sectors of Measuring Instruments and Non-metallic Mineral Products.
Prevalent industrial clusters in the four sub-regions
For the four sub-region cases, a total of 596 CPs (or 44% of all unique sub-regional CPs) can be found in at least three sub-regions. Almost all of them (except for 18 CPs) have counterparts in the city-level results. Additionally, there are 484 CPs (or 36%) only observed in one of the four sub-regions, which can be denoted as distinctive CPs. Approximately 88% of these distinctive CPs are absent in the city-level results, implying the strong variations of industrial clusters across Dongguan. Supplementary Table S3 summarizes the distribution of distinctive CPs in each sub-region. The case #4 sub-region has the largest number and the biggest total share of distinctive CPs (212 and 22.65%, respectively), while the case #1 sub-region features the smallest number and total share of distinctive CPs (26 and 5.05%, respectively).
The representative prevalent CPs at the sub-regional level and their spatial instances are shown in Figure 3 and Supplementary Figure S5, respectively. In case #1 sub-region, a dominant share of its distinctive CPs (69%) includes an Artware/Sporting Goods sector (Figure 3a). However, the number of Artware/Sporting Goods enterprises shares disproportionately 4.6% of total enterprises in case #1 sub-region. Many Artware/Sporting Goods enterprises in this sub-region produce sporting goods related to golf, such as golf-club, golf bag, and shoe. They are found interconnected with the enterprises in the sectors of Metal Products, Plastics, Artwork and Other Manufacturing, Rubber, Fur, Recording Products, and Paper. Another prevalent type of Artware/Sporting Goods enterprises is toy manufacturing. They are frequently co-located with the enterprises in the sectors of Electrical Machinery, and Computers and Related Equipment, which supply electric parts and electronic components, respectively. The results of the size-3 CPs in this sub-region also suggest the industry clusters composed of furniture manufacturing and other relating sectors such as Rubber, Recording Products, and Textile.
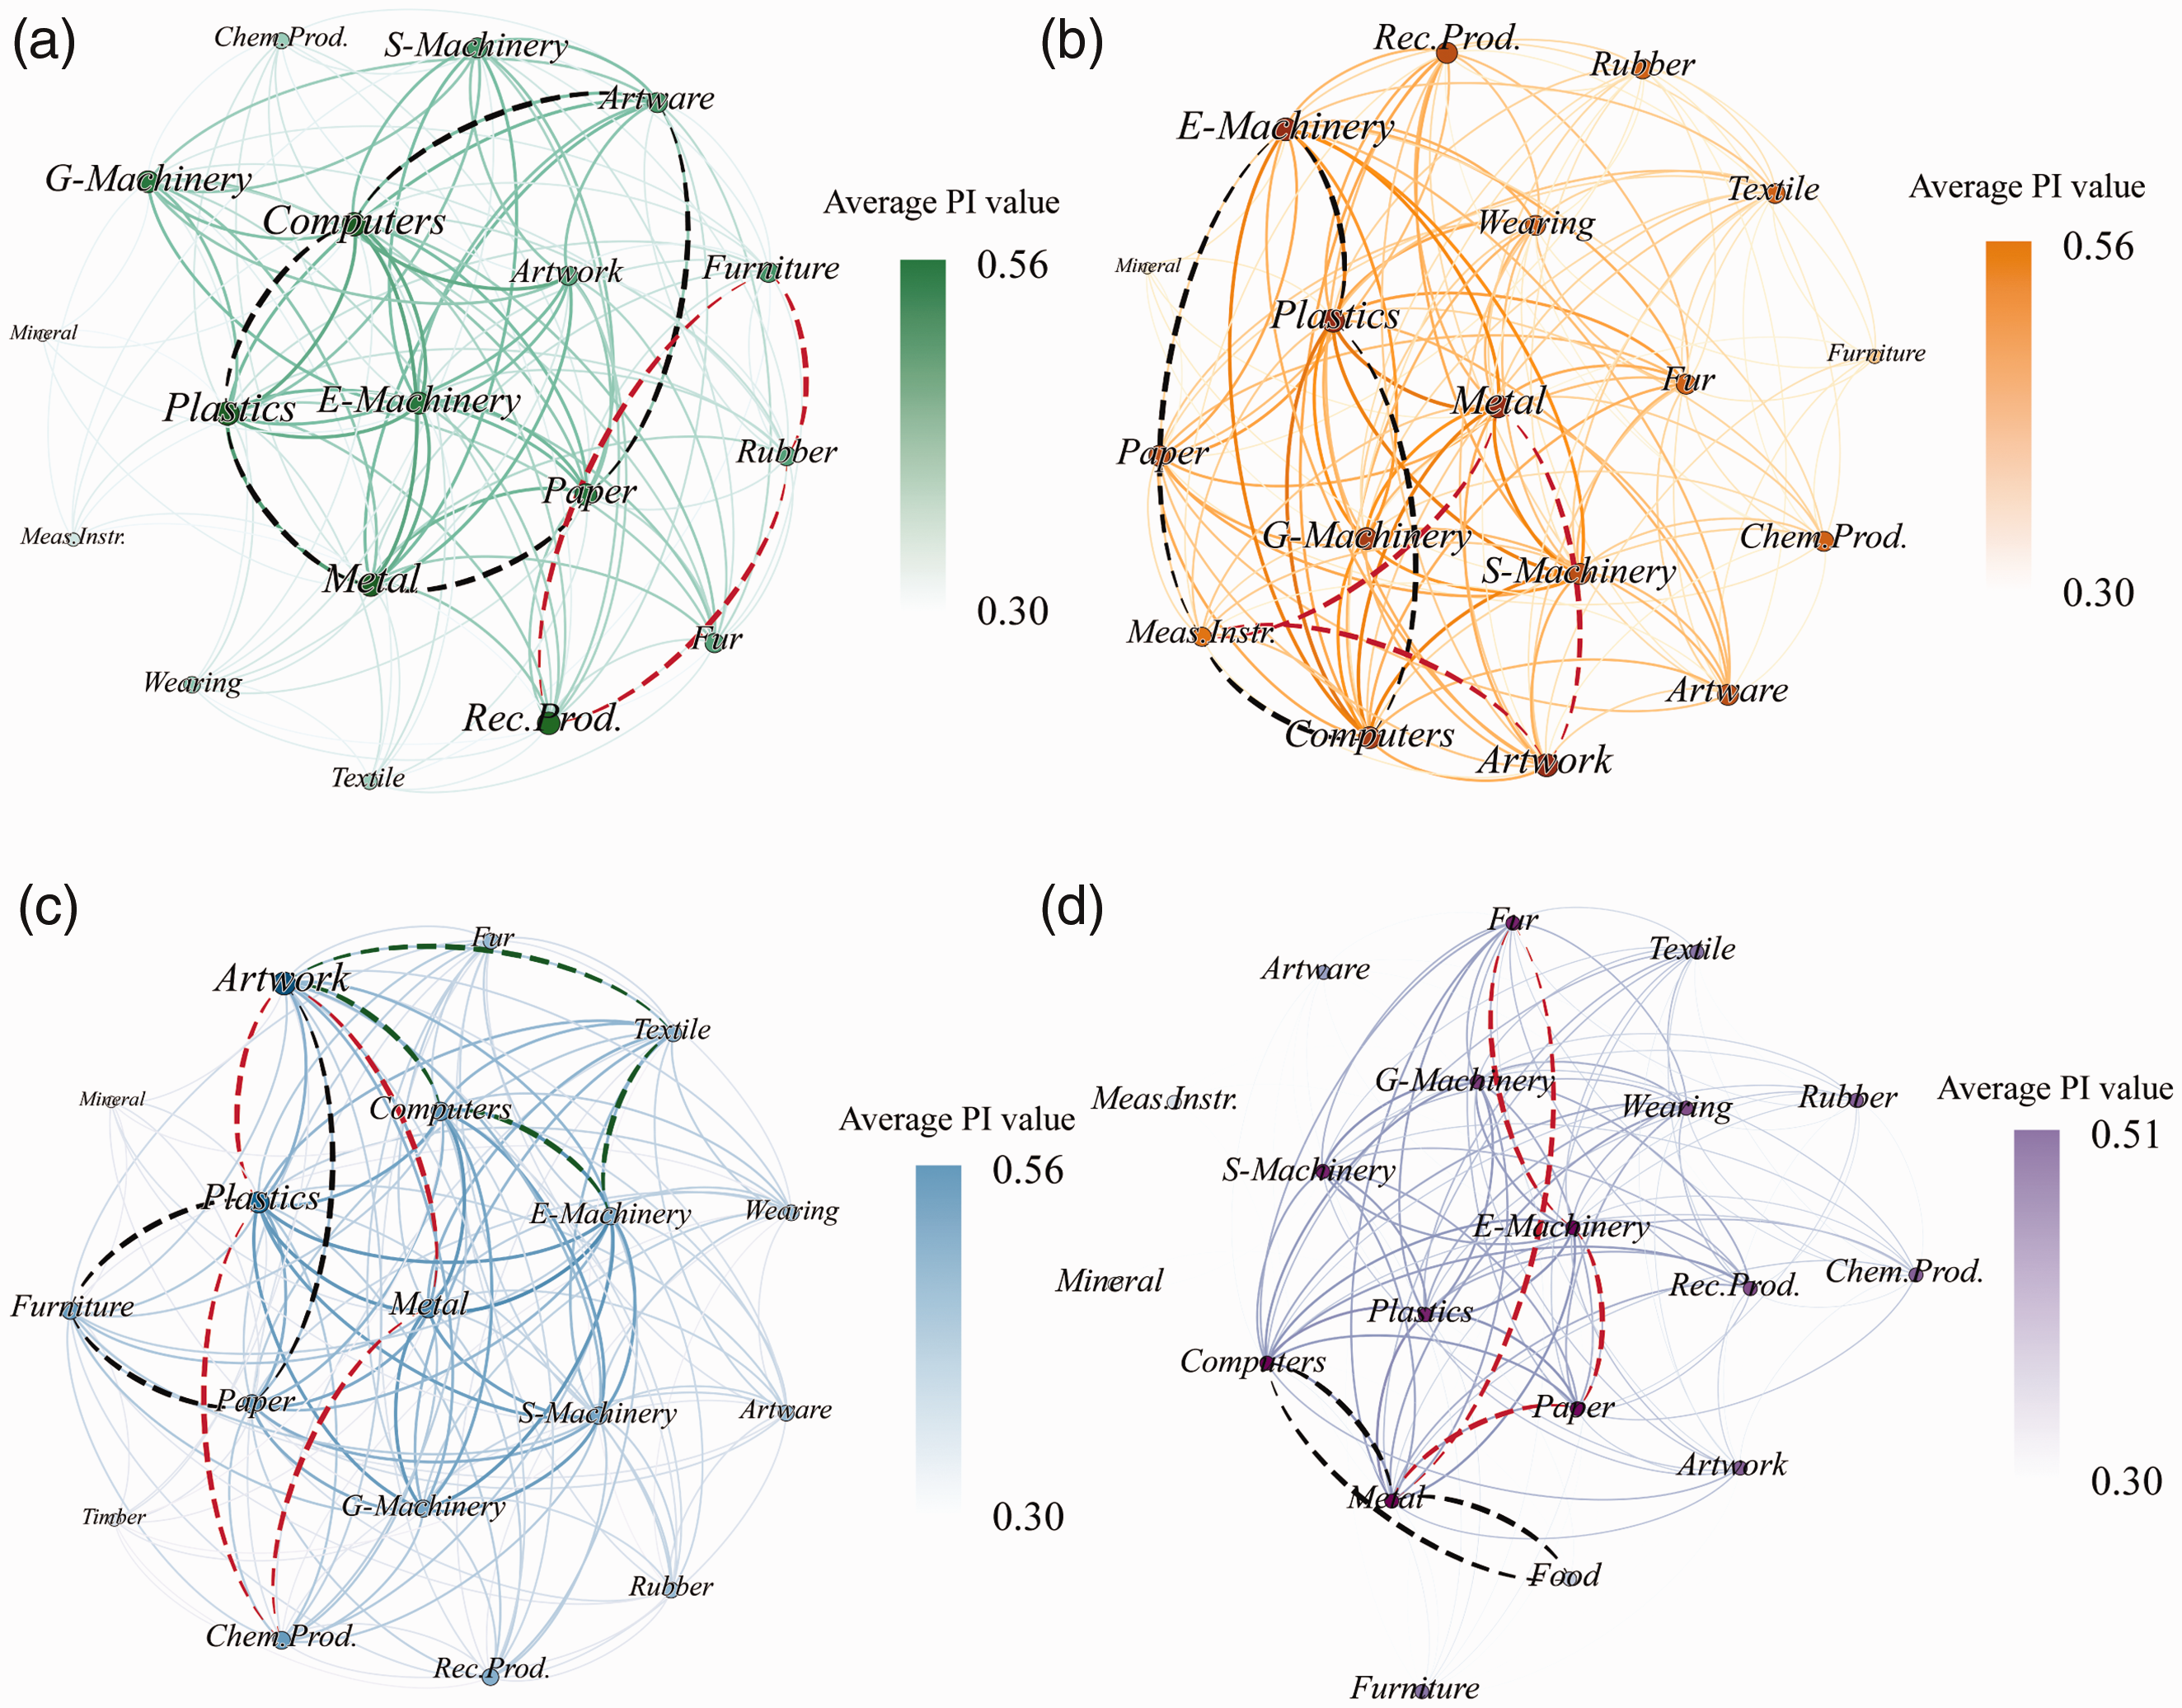
Representative prevalent CPs identified at sub-region level (distance threshold = 500 m): (a) case #1, (b) case #2, (c) case #3, and (d) case #4. The red and black dashes highlight the representative CPs. Note: Please refer to Supplementary Table S1 for the full name of enterprises.
In the case #2 sub-region, approximately 46% of its distinctive CPs include a Measuring Instruments sector (Figure 3b), even though Measuring Instruments enterprises cover only a relatively small proportion of all enterprises (18%). The principle outputs of these enterprises range from digital camera, eyeglass, and timing instrument to digital scale, printer, and optical instrument. These enterprises are spatially associated with those in the sectors of Computers and Related Equipment, Electrical Machinery, Special Machinery, General Machinery, Metal Products, Plastics, and Paper. The results of size-3 CPs in the case #2 sub-region also indicate potential sectoral cooperation among Textile, Furniture, Fur, Chemical Products, and Rubber.
In the case #3 sub-region, approximately 45% of the 159 distinctive CPs obtained are associated with Artwork and Other Manufacturing enterprises (Figure 3c). They supply a variety of products such as accessories, machine parts, woodware, and so on. According to the resulting CPs, Artwork and Other Manufacturing enterprises are frequently co-located with other enterprises in the sectors of Computers and Related Equipment, Electrical Machinery, General Machinery, Special Machinery, Metal Products, Plastics, and Paper. The resulting CPs also reveal the close relationships between Artwork and Other Manufacturing and Textile, Wearing Products, Furniture, Rubber, Timber, and Chemical Products.
In the case #4 sub-region, an extremely high proportion (78.3%) of the distinctive CPs includes either a Fur sector or a Wearing Products sector or both of them (Figure 3d), while the collective share of the enterprises in these two sectors is only 11.9%. In addition to their co-location relationships, the Fur sector and the Wearing Products sector also link with the sectors of Electrical Machinery, Computers and Related Equipment, General Machinery, Metal Products, Plastics, and Paper. Another notable set of CPs is related to the Food sector. The case #4 sub-region alongside with Tianjin and Zhangjiagang are the three biggest food grain and oil production bases in China. Therefore, this sub-region has the highest number of Food enterprises than the other three sub-regions. The Food sector related industry clusters mainly involve industries such as Metal Products, Paper, and Plastics.
Discussion
Implications of the results
With a case study in Dongguan, China, we have demonstrated the applicability of the CPs mining method for detecting industrial clusters at an intra-urban scale. Although the CPs mining method we use is not novel, it has not been applied in previous literature to understand industrial clusters. The results of our CPs mining application can provide essential implications and insights for studies relevant to industrial clusters and economic concentration.
First, from a methodological point of view, the proposed use of the CPs mining method can help alleviate the problems of traditional methods for identifying industrial clusters. According to a critical analysis by Komorowski (2020), the major limitations of the most commonly used methods (e.g. LQ) include inadequate ability to reflect the exact extent and location of industrial clusters, and the issues of data harmonization if additional data are required for analysis. In this sense, the CPs mining method is more advantageous. With purely location points data, the CPs mining method not only can generalize the patterns of co-located industries, but also allow tracing their spatial instances and locations/extents if needed (see Supplementary Figures S4 and S5). Furthermore, many conventional methods mainly deal with the spatial associations between two industrial sectors, such as manufacturing and services industries (Yuan et al., 2017), R&D and production sectors (Lica et al., 2020), and so on. Methods that can simultaneously handle many industrial types are still few. The Q statistic partly addresses this issue, but its major drawback is that it analyzes the co-location of instances rather than types, and hence, the results may be too complicated to interpret if many industrial types are involved (Ruiz et al., 2010). As an alternative approach, the CPs mining method shows promising potential for exploring industrial clusters composed of many sectors (Supplementary Table S2).
Second, our case study can provide a basis for further theoretical and empirical studies of industrial developments. As shown in Sections “Prevalent industrial clusters at city level” and “Prevalent industrial clusters in the four sub-regions,” the CPs mining method can capture the existence of co-located industries across a variety of sectors. These results can be considered as useful observations to help explain the coagglomeration of industries due to the benefits of skill-sharing, value chain linkages, and labor and input–output linkages (Diodato et al., 2018). Additionally, the results of our analysis reveal different features of industrial clusters at the city level and the sub-regional level. The results of the city-level industry clusters suggest that Dongguan is more specialized in computer manufacturing and machinery, while the sub-regional industry clusters are more diverse (Figure 3). These can serve as a foundation for identifying urban hierarchy from an industrial perspective (Kang et al., 2020) and examining the effects of regional industrial diversification (Zizi, 2019). If multi-temporal micro-data are available, it is also feasible to apply the CPs mining method for a better understanding of industrial restructuring and transformation over time in fast industrializing regions (Schmalz et al., 2017).
Third, the results of our case study can provide practical implications for urban planners. For instance, the identified industry cluster patterns imply the potential spatial dependencies of different industrial sectors, and feasible sector combinations to form “industrial ecosystems.” This knowledge is useful to support planning new industrial zones or improve existing ones (Nilsson and Smirnov, 2016) to achieve the benefits of industrial agglomeration.
Methods comparison
To better understand the characteristics of CPs mining, we compare its results with those obtained from two standard methods, i.e. cross-K function (Ripley, 1976) and CLQ (Leslie and Kronenfeld, 2011). The cross-K function method identifies bivariate associations between feature types tested with a Monte Carlo simulation. The CLQ approach, however, calculates the proportion of the points of one type among the other type’s nearest neighbors.
We calculate the cross-K function between every two types of enterprise points. Supplementary Figure S6 shows the number of observed clustered pairs with different distance thresholds. In a relatively short distance (i.e. <500 m), most pairs of points are clustered except three pairs: {Timber, Ferrous Metals Smelting}, {Chemical Products, Ferrous Metals Smelting}, {Ferrous Metals Smelting, Transport Equipment}. The results of CLQ are shown in Supplementary Figure S7 in a matrix form. The point pairs with CLQ values exceeding 1.0 are highlighted because they suggest co-location relationships.
We compare the prevalent size-2 CPs derived from the CPs mining method against those generated by the cross-K function and CLQ methods (Figures S8 and S9). For cross-K function, only the results under 500 m are considered, which are rendered consistent with the distance range used in CPs mining. The comparison shows that almost all of the prevalent size-2 CPs are also detected as cluster patterns according to cross-K function. However, the CPs mining method rejects 109 pairs of types, although they are still considered as cluster patterns by cross-K function. The main reason is that it uses complete spatial randomness as a reference, while patterns induced by human activities are usually far from random (Scholl and Brenner, 2016). The results of CLQ show more differences from those of CPs mining, with a total agreement of 0.43. The reasons behind could attribute to the nearest neighbor definition that the CLQ approach adopts, whereas our method defines neighbors based on Voronoi diagrams and a neighboring distance threshold as well.
Overall, partial consistency exists among the results of these three point patterns analysis methods. The disagreements are owing to the assumption and the spatial connection strategies that these methods adopt. In terms of detecting multi-type co-located points, however, the methods of cross-K function and CLQ are rather difficult, albeit not impossible, to deal with the co-location relationships that simultaneously involve more than two types. Contrastingly, the CPs mining can extend CPs detection immediately from size-2 to size-n, and hence is more reasonable to use for detecting industry clusters that are composed of multiple sectors.
Conclusion
Our study investigates the patterns of industry clusters on an intra-urban scale based on the CPs mining method. The results may complement related research by providing explicit and detailed evidence of how enterprises of different ownerships and sectors are co-located with (or separated from) one to another. Our results also reflect distinctive features for the four industrial sub-regions in Dongguan, which confirm the importance of mining CPs at multiple levels rather than only at the global level (Deng et al., 2017). Additionally, we compare the CPs mining method with the cross-K function and CLQ methods. The results show partial consistency, and the disagreements are owing to the assumption and the spatial connection strategies that these methods adopt.
The presented method is suffering from several limitations and can be further improved in our future work. First, the analysis in this study adopts the assumption of planar space, in which Euclidean distance is used to measure spatial proximity. The network distance approach is more reasonable because events and activities are frequently located at or moved through the edges within, for instance, transportation networks (Yu et al., 2017). Second, the parameter thresholds in the presented methods are tuned and determined subjectively, although the choice of distance range is consistent with previous studies at the intra-urban scale. Therefore, in our future work, a more sophisticated thresholding approach should be considered to improve the adaptiveness of our method. In our future work, we will also try to transplant our method to a high-performance platform and utilize its power to enhance computation efficiency.
Supplemental Material
sj-pdf-1-epb-10.1177_2399808321991542 - Supplemental material for Detecting industry clusters from the bottom up based on co-location patterns mining: A case study in Dongguan, China
Supplemental material, sj-pdf-1-epb-10.1177_2399808321991542 for Detecting industry clusters from the bottom up based on co-location patterns mining: A case study in Dongguan, China by Zihui Liu, Xinyue Chen, Weipan Xu, Yimin Chen and Xun Li in EPB: Urban Analytics and City Science
Footnotes
Declaration of conflicting interests
The author(s) declared no potential conflicts of interest with respect to the research, authorship, and/or publication of this article.
Funding
The author(s) disclosed receipt of the following financial support for the research, authorship, and/or publication of this article: The research was supported by the National Key R&D Program of China (2019YFA0607201), the National Natural Science Foundation of China (Grant No. 41871306), the Fundamental Research Funds for the Central Universities (20lgzd09), and the Open Fund of Key Laboratory of Geographic Information Science (Ministry of Education), East China Normal University (Grant No. KLGIS2020A02).
Biographical notes
References
Supplementary Material
Please find the following supplemental material available below.
For Open Access articles published under a Creative Commons License, all supplemental material carries the same license as the article it is associated with.
For non-Open Access articles published, all supplemental material carries a non-exclusive license, and permission requests for re-use of supplemental material or any part of supplemental material shall be sent directly to the copyright owner as specified in the copyright notice associated with the article.