
Abstract
The spatial distribution of metropolitan areas creates a complex system of competing and cooperating economic units. Understanding the size, scale and functional structure of such systems is an important topic in regional science. This paper uses commuter flow data over a 40 year period to analyse the changing structure of the Greater Manchester metropolitan area. We apply a combination of complex network analysis, residual network analysis and spatial network visualisation to detect Greater Manchester’s polycentric structure and identify intra-regional communities. This method is able to identify economic geographies in a highly complex and interdependent commuter network. We comment on the role of administrative boundaries in shaping metropolitan regions and discuss the potential of our work to inform debates on regional governance geographies and local government planning practices.
Introduction
Metropolitan areas have emerged as important economic and political spaces. They often take a polycentric form, reflecting the urban agglomeration processes that shape contemporary urban development (Fang and Yu, 2017). Recent work in urban theory has concluded that the complexities of such urban systems are best understood through the interactions that shape them (Batty, 2013; Pflieger and Rozenblat, 2010). Adopting this theoretical stance encourages urban systems to be studied using a complex network framework that focuses on the set of relationships that define a system. Whilst topological relationships, including political or social interactions, influence the form and extent of the interplay between proximate areas, it is also important to acknowledge the importance of geographic space in facilitating economic and social exchanges (Berdegué et al., 2019). We apply a combination of complex network analysis, spatial interaction models and geographic network visualisation to understand the functional structure of metropolitan areas and how they change over time. Our work is motivated by the following research questions: • To what extent, and in what ways, can the functional structure of metropolitan areas be discerned from the patterns of human activity revealed by commuter flows? • How has metropolitan structure in the UK changed over the last four decades? • How can spatial network analysis inform a debate on metropolitan policy making and the configuration of regional governance boundaries?
We address these research questions through empirical analysis of commuter flows in Greater Manchester (Figure 1). Commuter flow data can be extracted and interpreted using network analysis, providing a way of delimiting meaningful labour market areas that can inform economic development policy and land-use planning (Hincks et al., 2018). Map of local authorities comprising Greater Manchester. Manchester City Centre ward highlighted to show the focal point of the city region.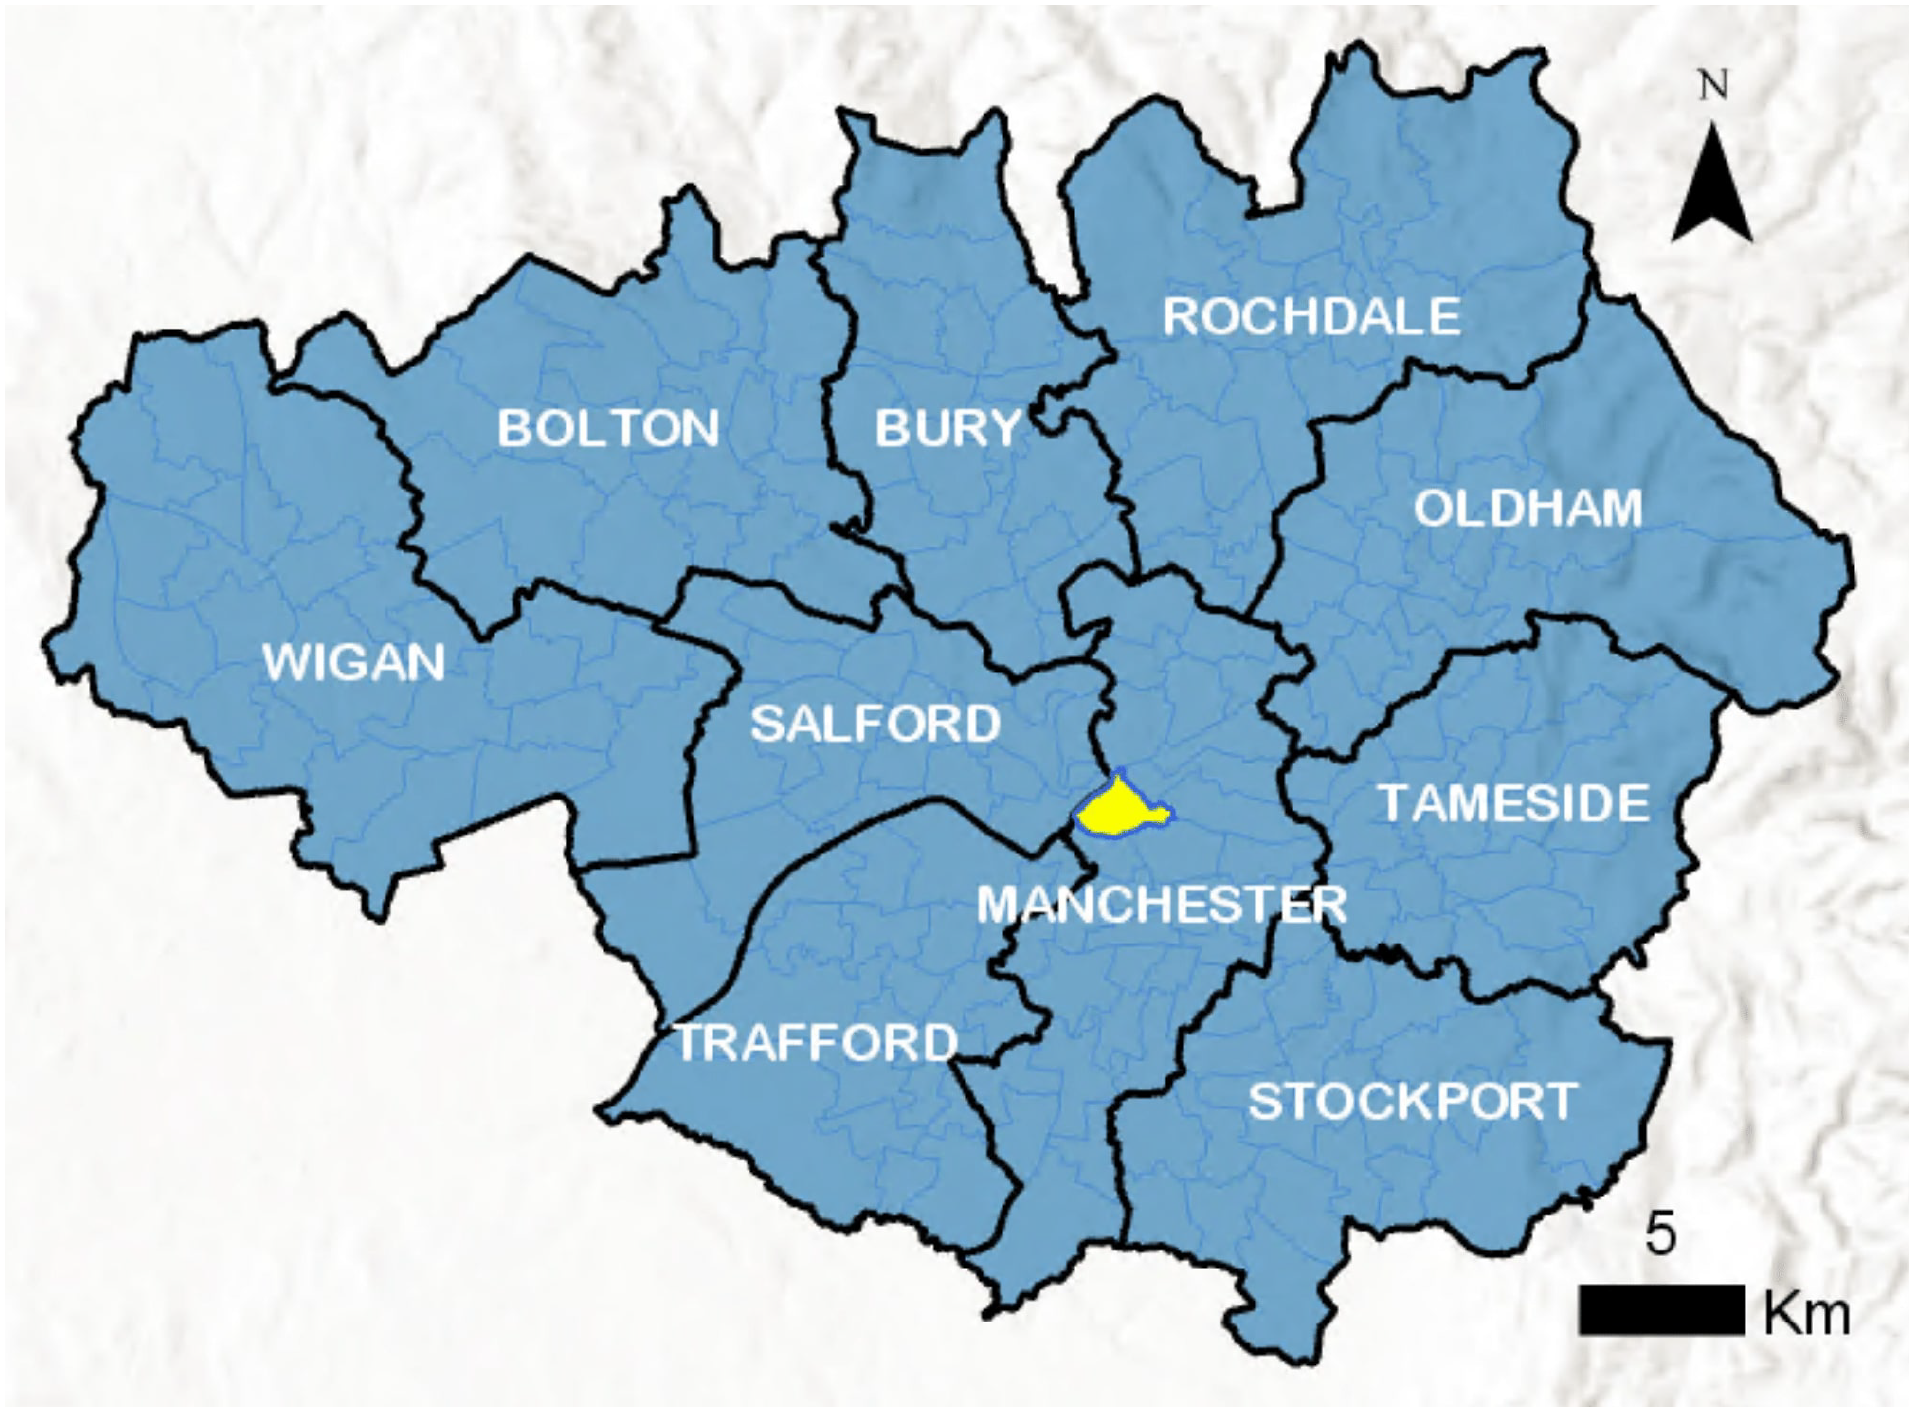
Greater Manchester was chosen as the case study area due to its claimed status as an exemplar of contemporary metropolitan governance (Haughton et al., 2016; Harding et al., 2010). Following three decades of collaborative governance under the Association of Greater Manchester Authorities (AGMA), Greater Manchester became the first statutory combined authority to be created in England. As such, subsequent devolution deals agreed between Greater Manchester Combined Authority (GMCA) and central government mean that city-regional governance is more thoroughly developed than in other parts of England (Kenealy, 2016).
Our approach builds on methods developed in previous work (Nelson and Rae, 2016; Zhong et al., 2014). We argue that the nature of intra-regional patterns of connectivity are more interdependent than regional or national patterns which were the focus of previous studies. As such, space-independent community detection methods struggle to depict the underlying functional structure that is evident in Greater Manchester’s distribution of economic nodes. To account for these complexities, we extend previous work by using spatial interaction models to incorporate the geographic nature of urban networks into our analysis. Specifically, we use gravity models to refine the commuter network into a network subgraph, referred to as a residual network, that is more readily interpretable by community detection methods. Having detected major shifts in functional structure over time, our analysis culminates with a model of Greater Manchester that delineates the metropolitan area into functionally coherent communities. We then make comparisons between the network-based communities and Greater Manchester’s existing administrative boundary structure.
The rest of the paper is organised as follows. In the next section, we review previous research on spatial network analysis and regional delineation and argue that this work extends our understanding of functional economic geographies in both methodological and empirical terms. In the Materials and methods section, we introduce the data used, explain the network extraction method employed and provide a technical description of the network tools used in the analysis. We present results in the Results section before reflecting on our approach and its limitations in the Discussion section. We conclude in the Conclusions section, highlighting areas for future research.
Background
Spatial network analysis
Urban morphology, as Batty defines it, is the ‘study of form and structure in cities that focuses on the dynamics of change and the rules underlying these dynamics’ (Batty, 2013: 179). This encompasses the set of relationships arising from the interactions of people, freight, materials and information (Rodrigue, 2016), with the spatial structure of modern cities shaped in part by the increasing complexity of these interactions.
A network approach provides a framework for the study of such interactions and has been applied extensively to urban networks. Urban street networks have been particularly well studied, with early research from Jiang and Claramunt (2004) and Porta et al. (2006) analysing the network properties of urban street networks in a range of cities. Boeing (2019) later examined the orientation of street networks to measure the spatial order of cities.
The emergence of urban interaction data has been used to study the patterns of connectivity and human interactions that shape modern cities. For example, Roth et al. (2011) used Oyster card data to study the polycentric configuration of London, while Thiemann et al. (2010) used a dataset obtained from the online bill-tracking game wheresgeorge.com to study spatiotemporal phenomena generated by human activity.
To generalise traditional network approaches to account for the spatial characteristics of urban networks, recent research has used flow data or distance data to produce models that are more reflective of the spatial nature of urban networks. For example, Cheng et al. (2015) used network centrality measures that incorporate flow volume to understand Singapore’s mass rapid train network beyond its topological structure. Zhong et al. (2014) applied spatial network analysis to smart card data to identify hubs, centres and borders in Singapore.
Despite being granular, novel interaction data is limited by its short history, with the effect that changes in urban structure over time cannot fully be understood. In this respect, we make two contributions to previous works. First, we use census interaction data to capture the long-term shifts in spatial structure that are characteristic of urban areas. And second, we employ gravity models, which have not been used in this context before, to add a spatial dimension to the network analysis.
Regional delineation
Regional delineation is an important topic for multiple disciplines, featuring in previous research by geographers, economists and urban planners (Sng et al., 2018). This makes for a diverse field of study, with many different approaches to defining regions and delineating boundaries. However, due to the complexity and heterogeneity of features that influence the configuration of boundaries (Jiang, 2018), the development and operationalisation of a practical framework for regional delimitation is not straightforward. The complexity of the problem has long been recognised, with Hartshorne (1939) warning that the face of the earth is the ‘antithesis of a mosaic’ and Nelson and Rae (2016) later commenting on the impossibility of defining stable territorial regions whose boundaries are uncontested. Any attempt to employ an algorithmic approach to the definition of regional political space therefore faces significant challenges.
Traditional approaches to regional delineation tended to employ a core-based approach, where an emphasis is placed on defining an urban core and identifying its connections to the periphery (He et al., 2020). Approaches of this nature are generally less interested in the patterns of connectivity and spatial agglomeration processes that shape the development of polycentric regions. Plane (1981) pioneered the use of a flow-based approach to show that suburbs were less dependent on central cities than it was previously supposed. Later, Pflieger and Rozenblat (2010) asserted the importance of networks in creating interdependencies between urban spaces. They proposed the view of ‘The city as a network of networks’, allowing urban systems to be studied using a complex network framework. Capitalising on this network perspective of regions, Nelson and Rae (2016) and Hamilton and Rae (2018) used a network partitioning approach to delineate regions in the U.S. and Scotland, respectively.
Other studies have emerged that do not use a network-based approach. These empirical approaches have been guided by the nature of the data and the scale of the analysis. Sng et al. (2018) opted for a geographic approach, using Geographic Information Systems and digital elevation data to create hypothetical provinces in China. Berdegué et al. (2019) used nighttime satellite imagery to identify the boundaries of conurbations. Other types of data that have been explored include sub-regional housing and labour markets (Hincks, 2012), smart card data (Zhong et al., 2014) and mobile phone data (Louail et al., 2014).
Whilst many of these efforts have highlighted functional urban areas that differ greatly from existing administrative boundary structures, in the UK there has been a general reluctance to engage in wide-ranging local government reorganisation to create more logical geographies (Demazière and Sykes, 2020). There have however, been experiments and reforms to regional governance, initially on a voluntary basis but more recently involving legislation, including the creation of GMCA in 2011. Greater Manchester Combined Authority brings together the 10 districts that previously constituted the Greater Manchester Council (GMC) and assumes responsibility for the region’s transportation, economic development, strategic land-use planning and policing. Greater Manchester Combined Authority boundaries were the result of political compromise, rather than any attempt to delimit boundaries in a more systematic way. The city-region’s political leaders discussed multiple configurations, but eventually reverted to the 10 district geography of the former GMC in order to sidestep potential sensitivities among neighbouring local authorities, fearful of Mancunian expansionism (Deas, 2014). In this regard, it is unclear how well Greater Manchester’s administrative boundaries capture the functional reality of the region. To address this, we attempt to delineate Greater Manchester into functionally coherent communities that are reflective of its polycentric economic geography, augmenting the existing literature on regional delineation by utilising residual networks in this process.
Materials and methods
Origin-destination data
In this paper, we use data on the commuting flows of workers in the Greater Manchester metropolitan area. In an attempt to understand the functional changes of Greater Manchester across time, our analysis includes data from the four most recent UK census years (1981, 1991, 2001 and 2011). These data were obtained using the Web-based Interface to Census Interaction Data (Stillwell, 2006). We consider travel to work data only, limited to persons aged 16 or over who were in employment in the week before each respective census year. The specific census question we are interested in concerns a person’s ‘usual residence and place of work’.
We perform our analysis at ward-level, where a ward is a subdivision of a local authority area and has an average population size of 5, 500 people. This geographical unit is comparable to those used in previous studies, such as US Census Tracts (Nelson and Rae, 2016) and Scottish Intermediate Zones (Hamilton and Rae, 2018). Ward boundaries and nomenclature are consistent across the first three time periods but have minor changes for 2011. As we are interested in the structural properties of the commuter network, these changes have a negligible effect on our analysis and we do not perform a geographical lookup or aggregation to construct consistent ward boundaries. We exclude flows that originate or terminate outside of the Greater Manchester area.
Network extraction
We use the ward-level origin-destination matrix to construct a commuter network. The network consists of a set
Basic network statistics for each year of data.
Complex network analysis
We analyse Greater Manchester’s commuter flows using network analysis. Our network extraction and centrality analysis is written in Python and uses graph-tool functions implemented in the Networkx library (Hagberg et al., 2008). We perform two methods of community detection, COMBO and InfoMap, using implementations in C++ (Sobolevsky et al., 2014) and R (Csardi and Nepusz 2006). Our analyses focus on identifying network structure and important nodes and communities. We are particularly interested in how these network characteristics have changed across the four time periods.
Node-level importance
Identifying the most important nodes in a system is a major element of network characterisation (Newman, 2010). We implement a selection of centrality measures and algorithms that capture various aspects of what makes a node important, such as a node’s position in the network and the importance of its connections. For many spatial networks, these characteristics are closely linked to the morphology of the network (Barthélemy, 2011). Such analysis is meaningful in the context of commuter flows as the structure of the network and the position which a node takes within the global topology has implications for policy design, patterns of mobility and the interactions of goods and ideas (Berdegué et al., 2019). As we use well established centrality measures and algorithms in our analysis (node strength, eigenvector centrality, PageRank centrality and HITS algorithm), we present these in Supplementary 1.
Community detection
Community detection refers to the procedure of identifying groups of interacting nodes in a network depending on their structural properties. One of its aims is to identify groups of nodes that are more densely connected internally than they are with the rest of the network (Newman, 2010). Identifying network communities in this way has implications for metropolitan areas. In our analysis, communities are theoretical groupings that offer insights into the functional structures that constitute metropolitan areas and the delineations of administrative boundaries. We implement two community detection algorithms that were chosen for their ability to account for the directed and weighted edges of the commuter network. 1. COMBO algorithm is a universal optimisation technique for community detection. It is computationally expensive but has been shown to effectively recover community structure in a variety of networks, including commuter networks at large scales (Nelson and Rae 2016; Hamilton and Rae 2018). COMBO is a modularity maximisation technique, where modularity is a measure of the strength of division of a network into communities (Newman, 2010). In their paper, Sobolevsky et al. (2014) attribute the success of the algorithm to the method in which vertices are recombined between communities. 2. Infomap is an algorithm that utilises random walks to detect communities. It is based on the premise that once a random walker enters a community structure it tends to stay within that structure for a long time, with movements between communities occurring relatively rarely (Esquivel and Rosvall, 2011). It differs from COMBO algorithm in that it attends to patterns of flow on the network and the modularity maximisation approach, utilised by COMBO, does not. As such, the algorithms are prone to capture different elements of community structure (for further technical details of the InfoMap method, see (Rosvall et al., 2009)).
Residual network
Residual networks are network subgraphs. They are obtained by retaining only those edges in which their observed edged weight exceeds their expected edge weight by a given threshold. The expected edge weight can be calculated in a variety of ways and is dependent on the nature of the data. In the case of commuter networks, we calculate the expected edge weight using a gravity model. We formally define the expected commuter flow between two wards, F
g
, as
With the constituent elements calculated, we can now use equation (1) to predict the expected commuter flow from one ward to another based solely on their respective node-strengths and distance from each other. A positive residual indicates that an edge has a greater flow than expected. Taking the residuals, we can produce residual networks that consist only of edges that exceed their expected flows at different thresholds. For example, a 5% residual network is a subgraph of the original networks that retains the top 5% of highest valued residual edges, in absolute terms, in the network. The value of the threshold is application dependent and is determined through visual interpretations of network plots, with the aim to strike a balance between network refinement and the preservation of community structure.
The residual network can be understood as representing the most important and interesting edges in the network. More significantly for metropolitan areas, however, is the structure of the residual network. The residual structure refines the global topology into clusters of edges that identify economic clusters and functional communities.
Visualisation
Spatial network visualisation and mapping in this paper relates to three main types of plots: 1. In the first set of maps, centrality values of network nodes are projected on to their respective ward-level polygons. This mapping shows how the geographical position of a node in Greater Manchester relates to its importance and function from a network perspective. The visualisations also describe how some elements of network topology relate to urban morphology such as infrastructure. 2. Visualising residual networks has the advantage of revealing the underlying structure of spatial networks when correcting for distance. Each edge in the visualisations represents a commuter flow between two wards that were higher than expected given the gravity model. We show how these visualisations can be used to reveal functional structures at different thresholds and also how residual network plots can be used to inform the community detection process. 3. In regards to making a visual comparison of the existing administrative boundaries against potential new regional delineations, we adopt a similar approach to that of Sobolevsky et al. (2014). That is, we overlay an outline of the existing administrative boundaries (shown in black) on top of colour coordinated communities. The colour coordination facilitates comparisons to be made across years and across methods, revealing the changing structure and emergence or disappearance of communities.
Results
Centrality and clustering: Hubs, centres and shifts in structure
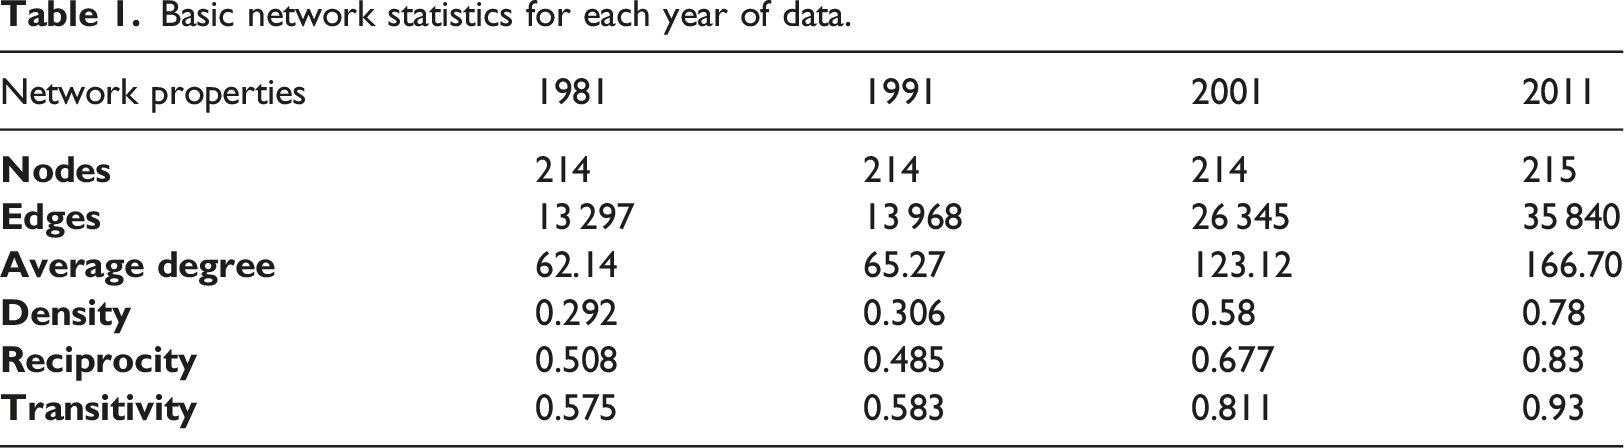
To explore how the topological structure of Greater Manchester relates to the geographical space in which it is embedded, we project measures of node-level importance onto their respective ward polygons. Figures 2–5 are the maps of the eigenvector, PageRank, authority and clustering coefficient scores for each time period. The emerging structure is one of polycentricity, with clear shifts in structure and importance for many areas of the region. Eigenvector centrality scores. PageRank centrality scores. Authority scores. Clustering coefficient scores.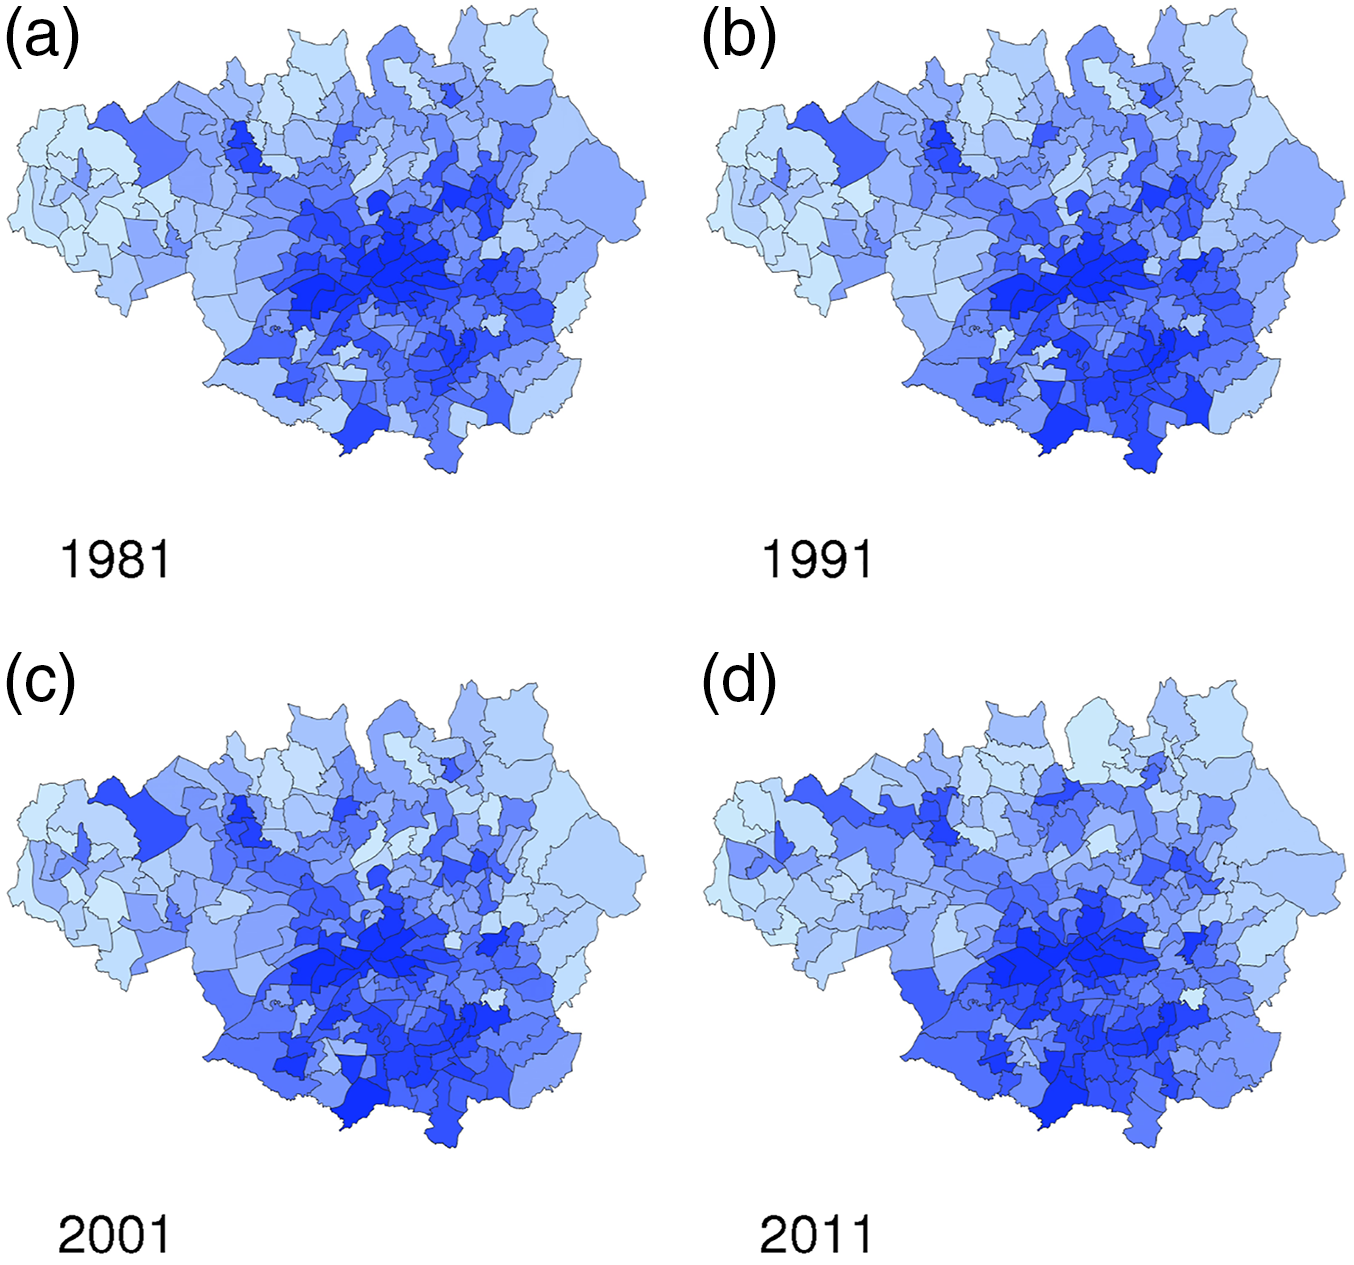
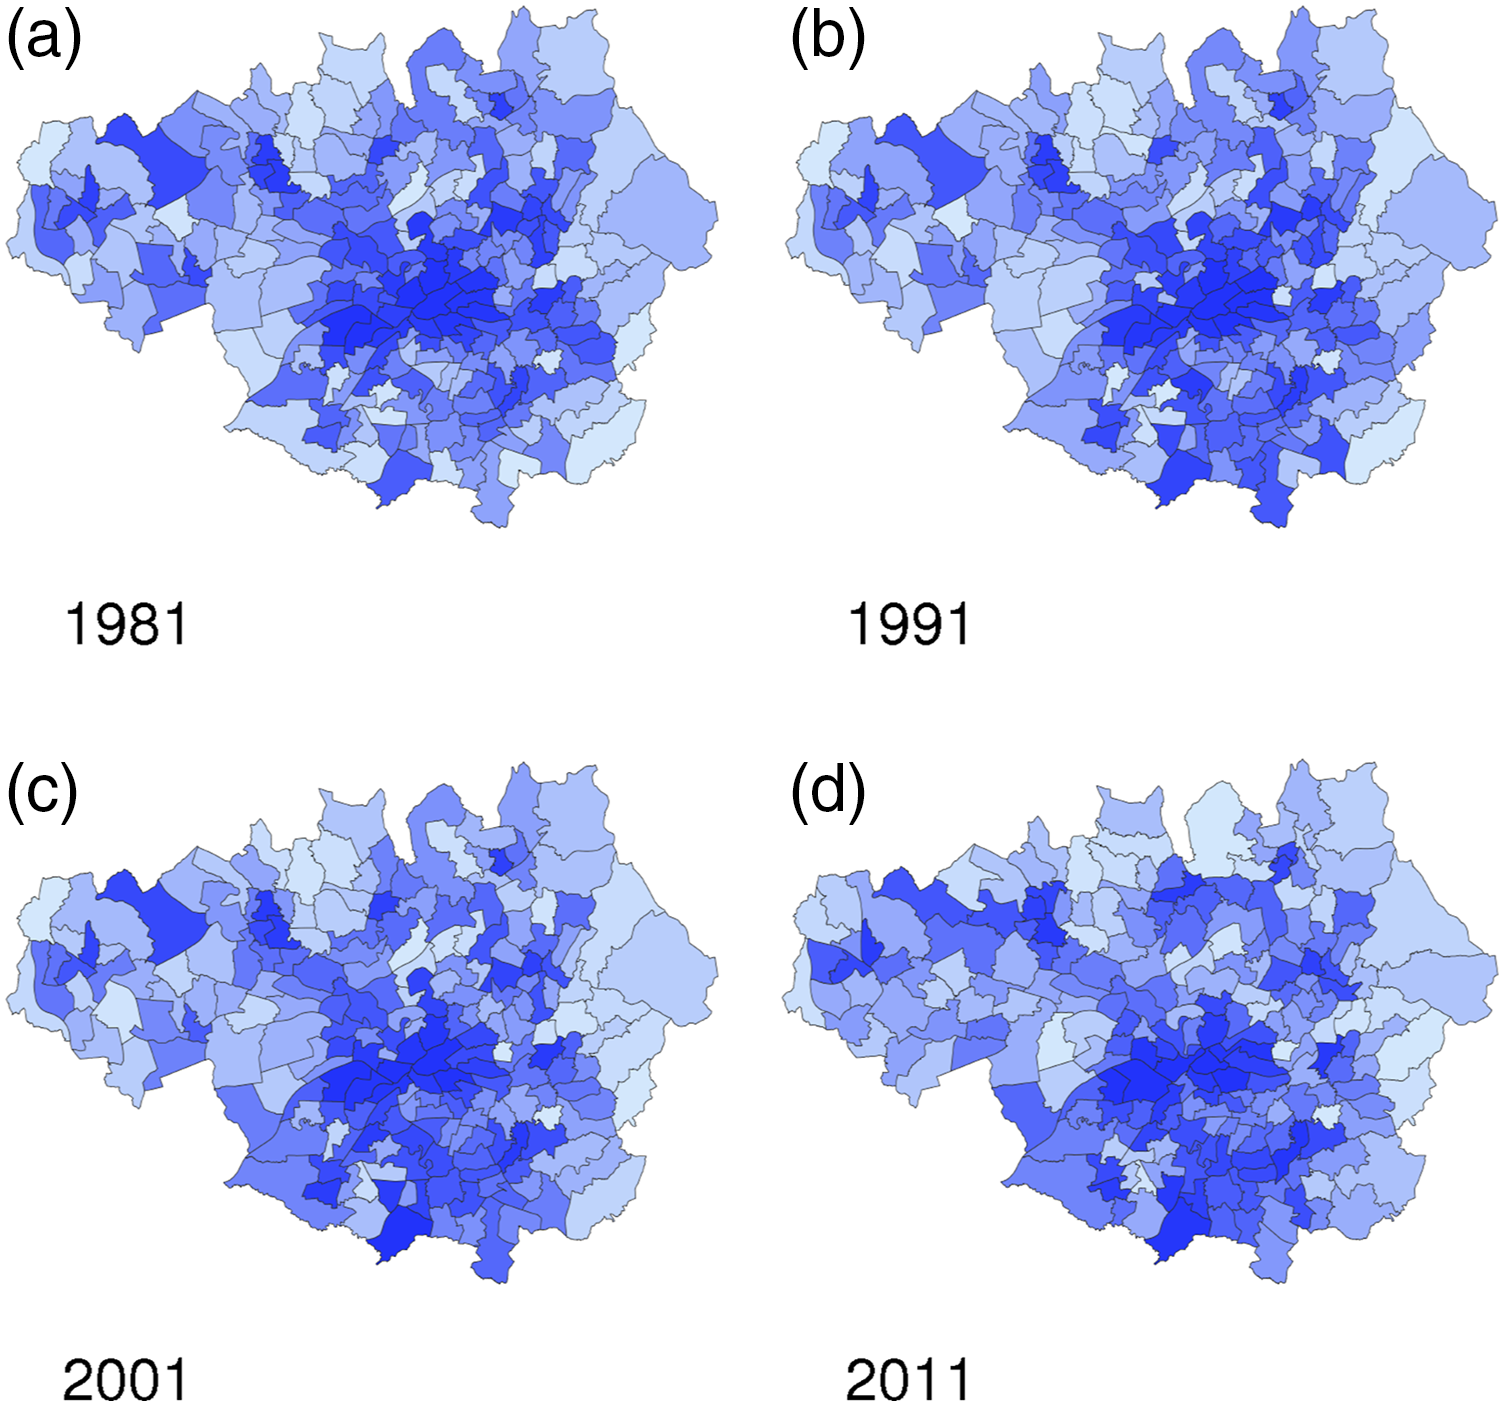
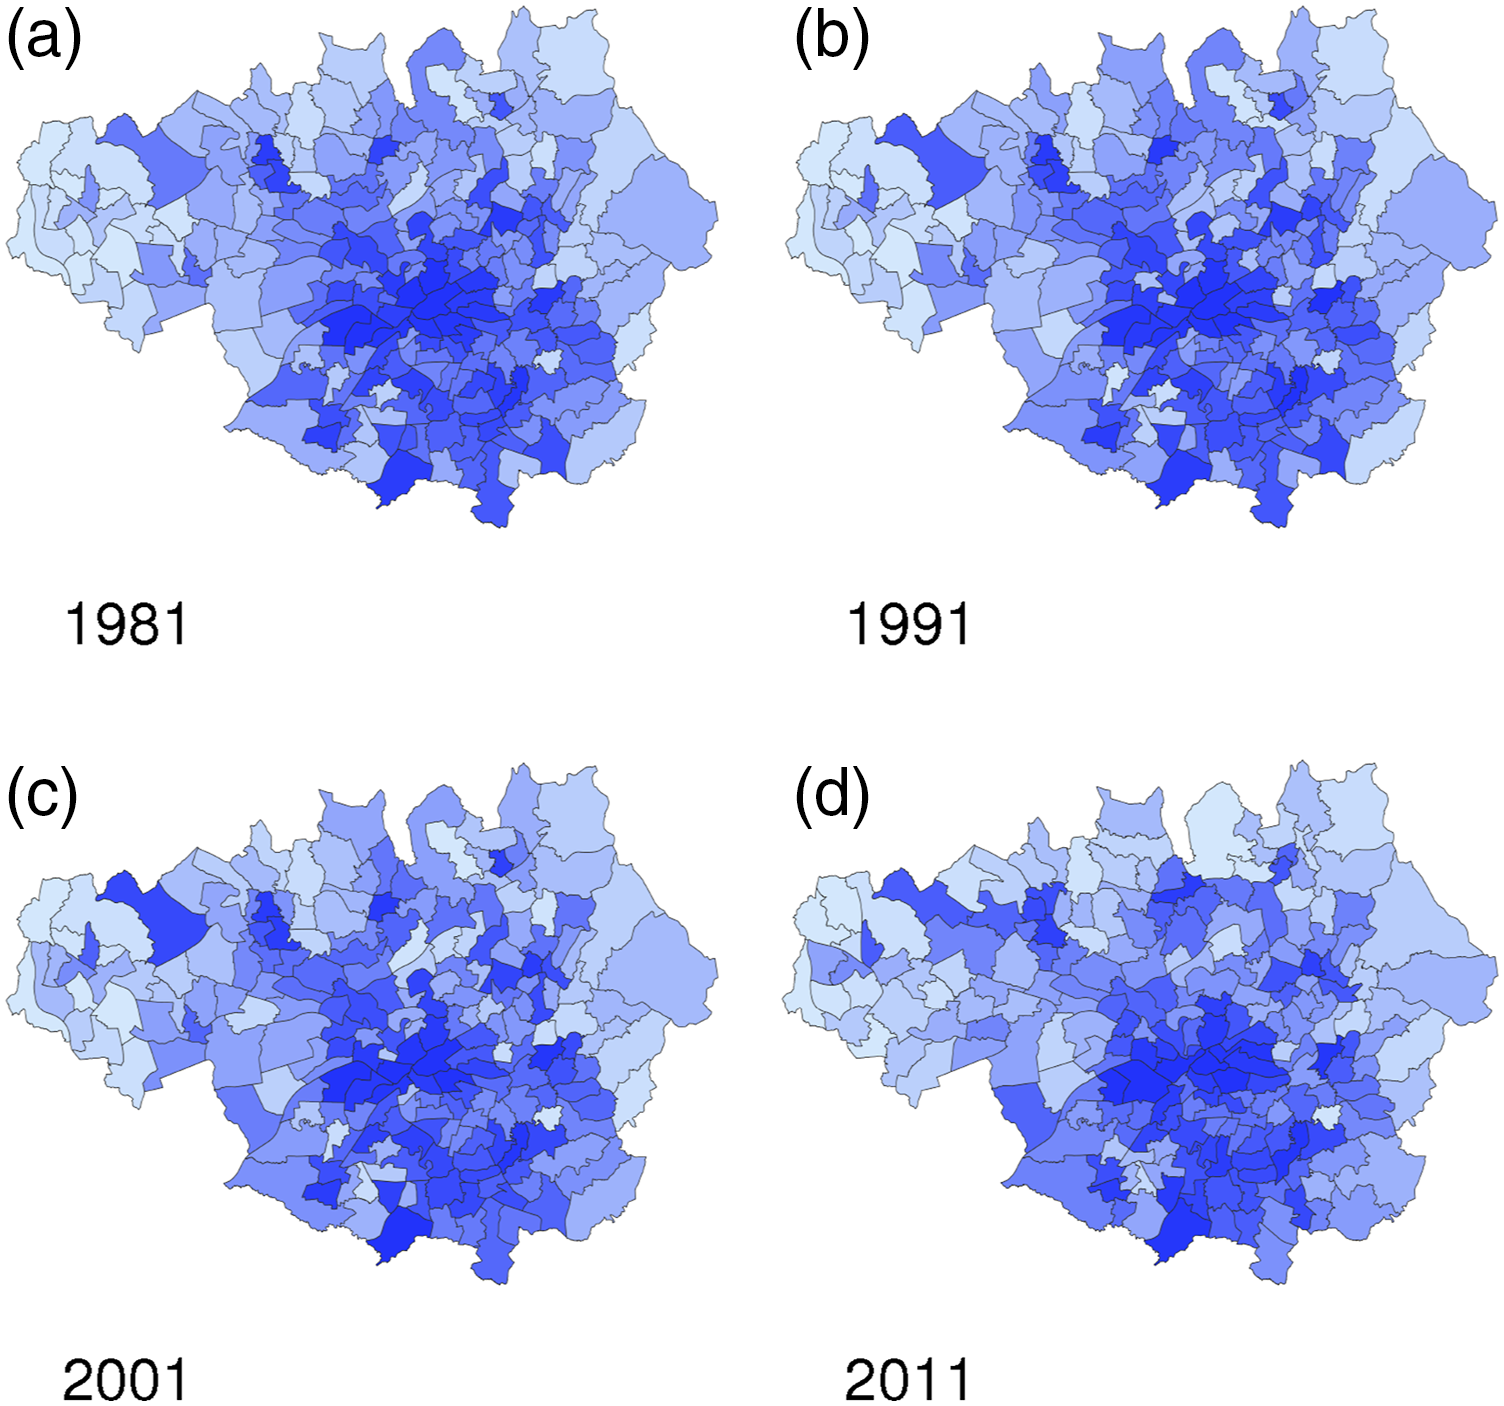
Analysing the results more closely, we see that Figures 2–4 capture similar network characteristics. As would be expected, geographically central wards constitute a nexus of economic activity, with peripheral wards, for the most part, being less important. This pattern reflects the concentration of service sector organisations in the city centre. There are, however, wards located elsewhere in the region that are also of markedly higher importance than their neighbours. These centres stand as secondary local attractors of commuters to their respective poly-centres and act as important economic units within the wider region. Observing only Figures 2–4, there is inconclusive evidence to support major structural changes in Greater Manchester’s urban morphology over time; individual wards wax and wane in importance, but the global structure remains relatively consistent.
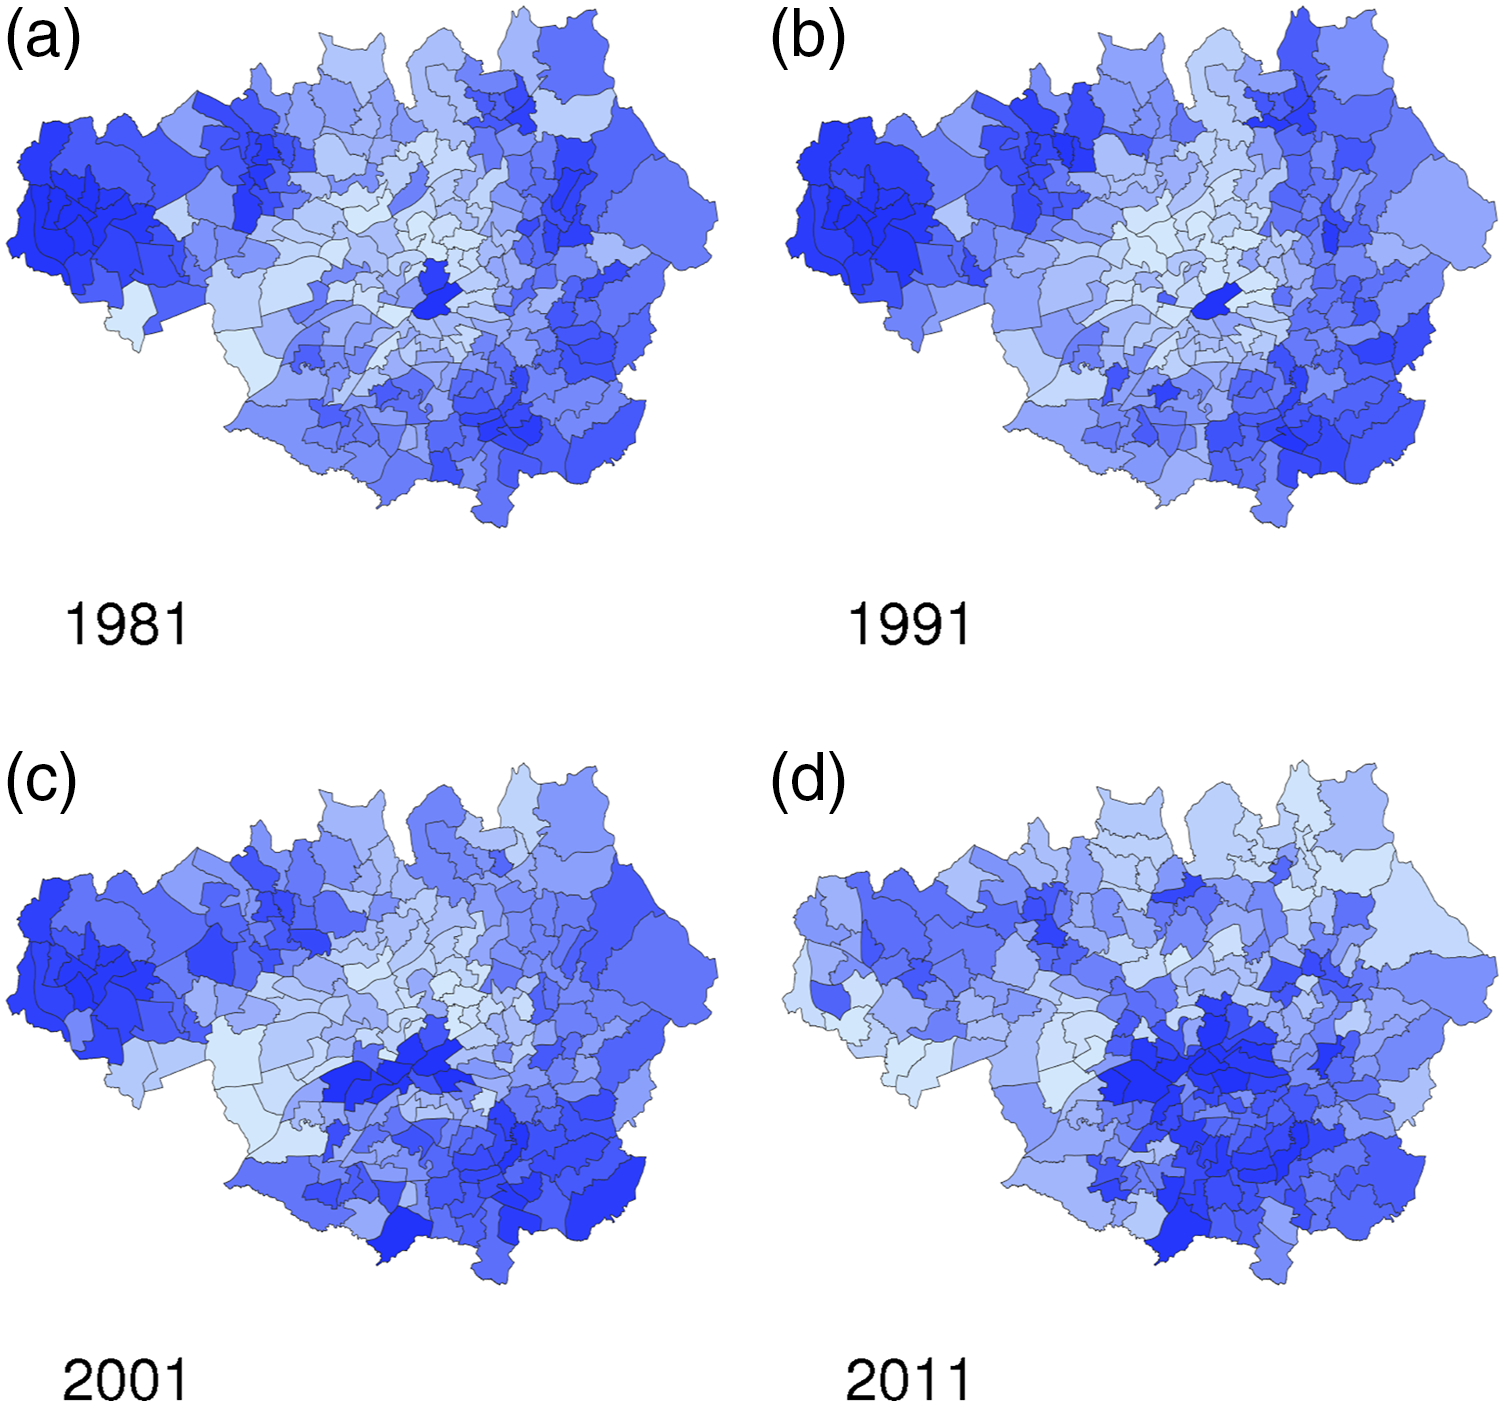
Unlike the previous centrality measures, the distribution of clustering coefficient values in Figure 5 suggests significant changes in connectivity patterns over time. The local clustering coefficient quantifies how close a ward’s neighbours are to forming a clique. In reality, then, a highly clustered area is indicative of commuters taking up employment opportunities in neighbouring wards. In 1981, 1991 and 2001, Wigan is the most clustered area. Given that, in terms of physical distance, Wigan is furthest from the centre of Greater Manchester, it is conceivable that residents of Wigan are more likely to seek economic opportunities in a more localised area. Over time, however, and culminating in 2011, commuting patterns involving Wigan become markedly more integrated, and the central Manchester area emerges as the most highly clustered area.
In the next section, we discuss the results of our main metropolitan structure analysis. We expect COMBO and InfoMap to detect community structures that reflect the polycentricity identified in this section.
Community detection for intra-regional delineation
Administrative boundaries often define regions on the basis of historical patterns of identity and inherited political subdivisions. Although this may hinder the ability to govern effectively, updating territorial boundaries may not be a political priority, for two principal reasons: the practical and political difficulty of restructuring administrative boundaries and the absence of a robust framework to determine functional boundaries to which different actors can subscribe. In this section, we address this latter issue by employing community detection algorithms to delineate intra-regional borders based on community structure. We track the changes in community structure over time and highlight discrepancies with Greater Manchester’s current administrative boundaries.
Figure 6 maps COMBO communities onto the Greater Manchester region, with the existing local authority structure included for comparison. The results of COMBO for 1981 divide Greater Manchester into seven communities. The COMBO communities for Wigan, Tameside and Stockport are identical or very similar to the existing administrative structure, but the remaining four COMBO communities span multiple existing local authorities. The results for 1991 and 2001 are similar, with the exception of the introduction of a new COMBO community that maps onto the Bury area. For 2011, however, the community structure changes significantly. The COMBO communities along the northern boundary remain stable but two southern communities disappear when compared to 2001. The disappearance of these two communities is compensated by the growth of two existing communities that previously occupied Manchester and Trafford (to which Salford is added in 2011), and Stockport (to which Tameside is added). The notion that the commuting patterns become more integrated across this central and southern area is indicated by the increased clustering depicted in 2011 (Figure 5(d)). An independent ‘city centre’ community was not detected in any period. Instead, Manchester city centre is grouped alongside Trafford for all four censuses, and with Salford for 2011. This, we argue, is the de facto centre of the city-region, linking the commercial core, and its offshoot at Salford Quays, with the more affluent suburbs in Trafford (to the south of the city centre). Comparison of the community structure detected by COMBO and the Greater Manchester local authority structure across all four periods.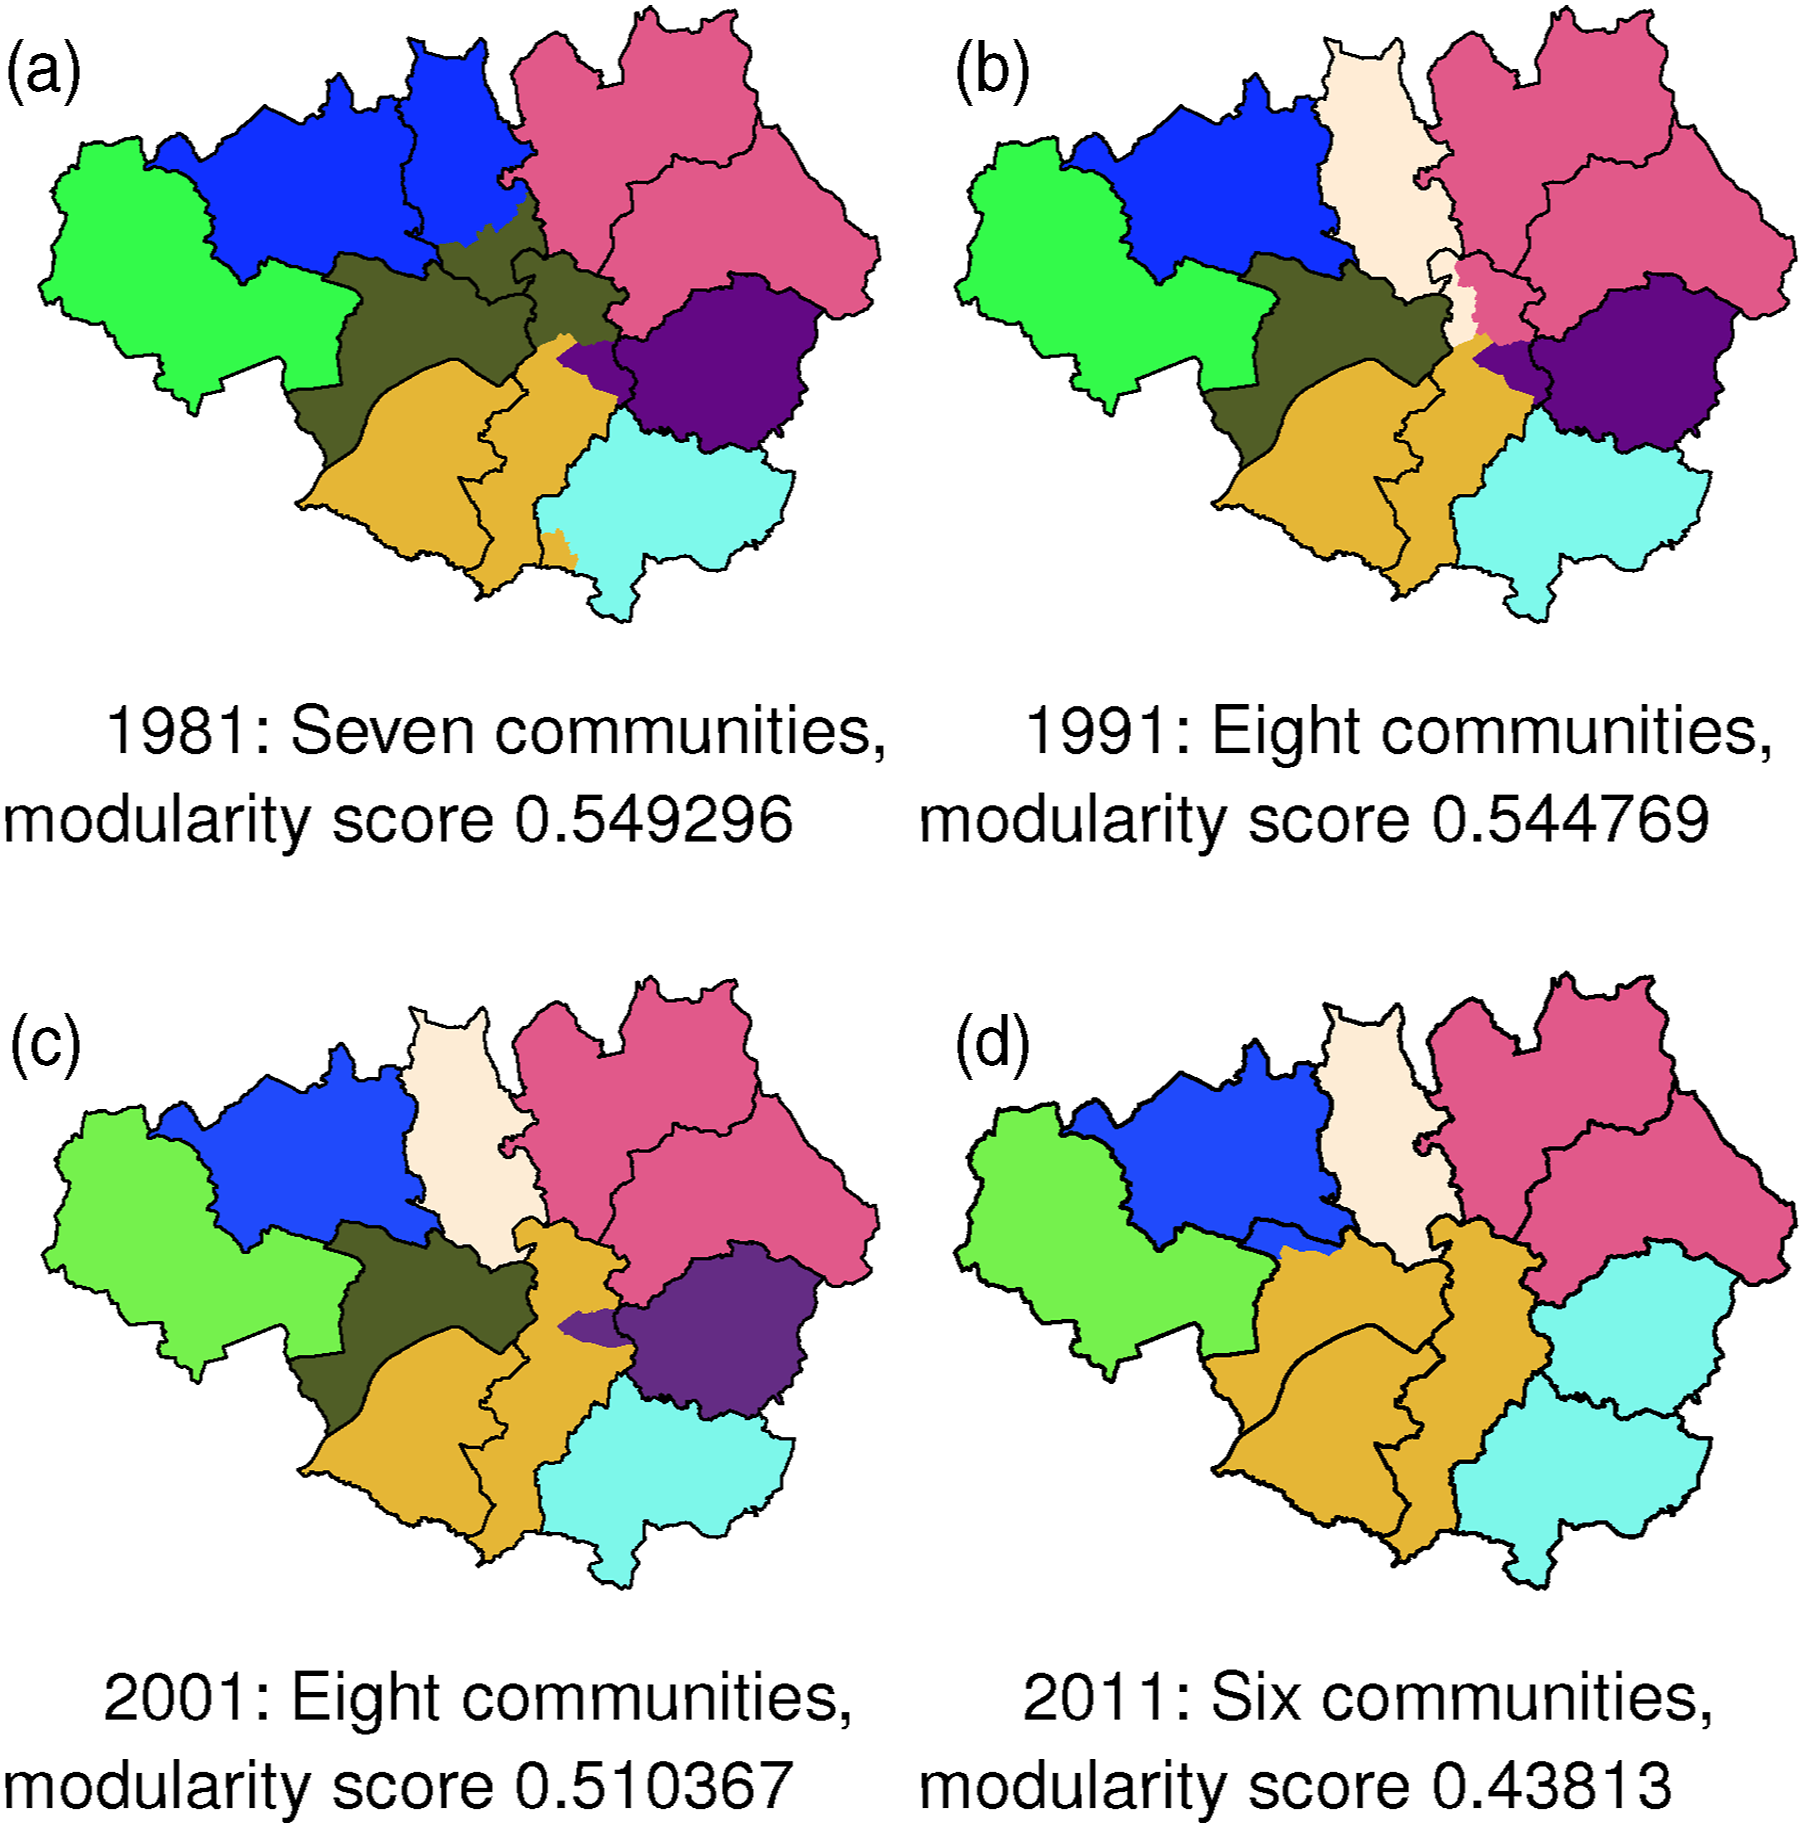
We draw two more general conclusions from our COMBO analysis. First, metropolitan communities are relatively stable, shifting only in small increments and across long time periods. Second, the modularity score decreased in each subsequent time period, suggesting that communities in Greater Manchester are becoming more interdependent.
Figure 7 shows the communities detected by InfoMap. By comparison, InfoMap detected more communities than COMBO. In 1981 and 1991, InfoMap divided Greater Manchester into nine and 10 communities, respectively, which is two more than COMBO for each time period. The community structure detected is also noticeably different, with InfoMap identifying smaller communities along the northern periphery. These smaller communities sit above a larger community that grows in size between 1991 and 2011. By 2011, this large community encompasses five of the existing local authorities, exaggerating the community development that was highlighted in this area by the COMBO analysis, and again picking out the core of the Manchester conurbation. Comparison of the community structure detected by InfoMap and the Greater Manchester local authority structure across all four periods.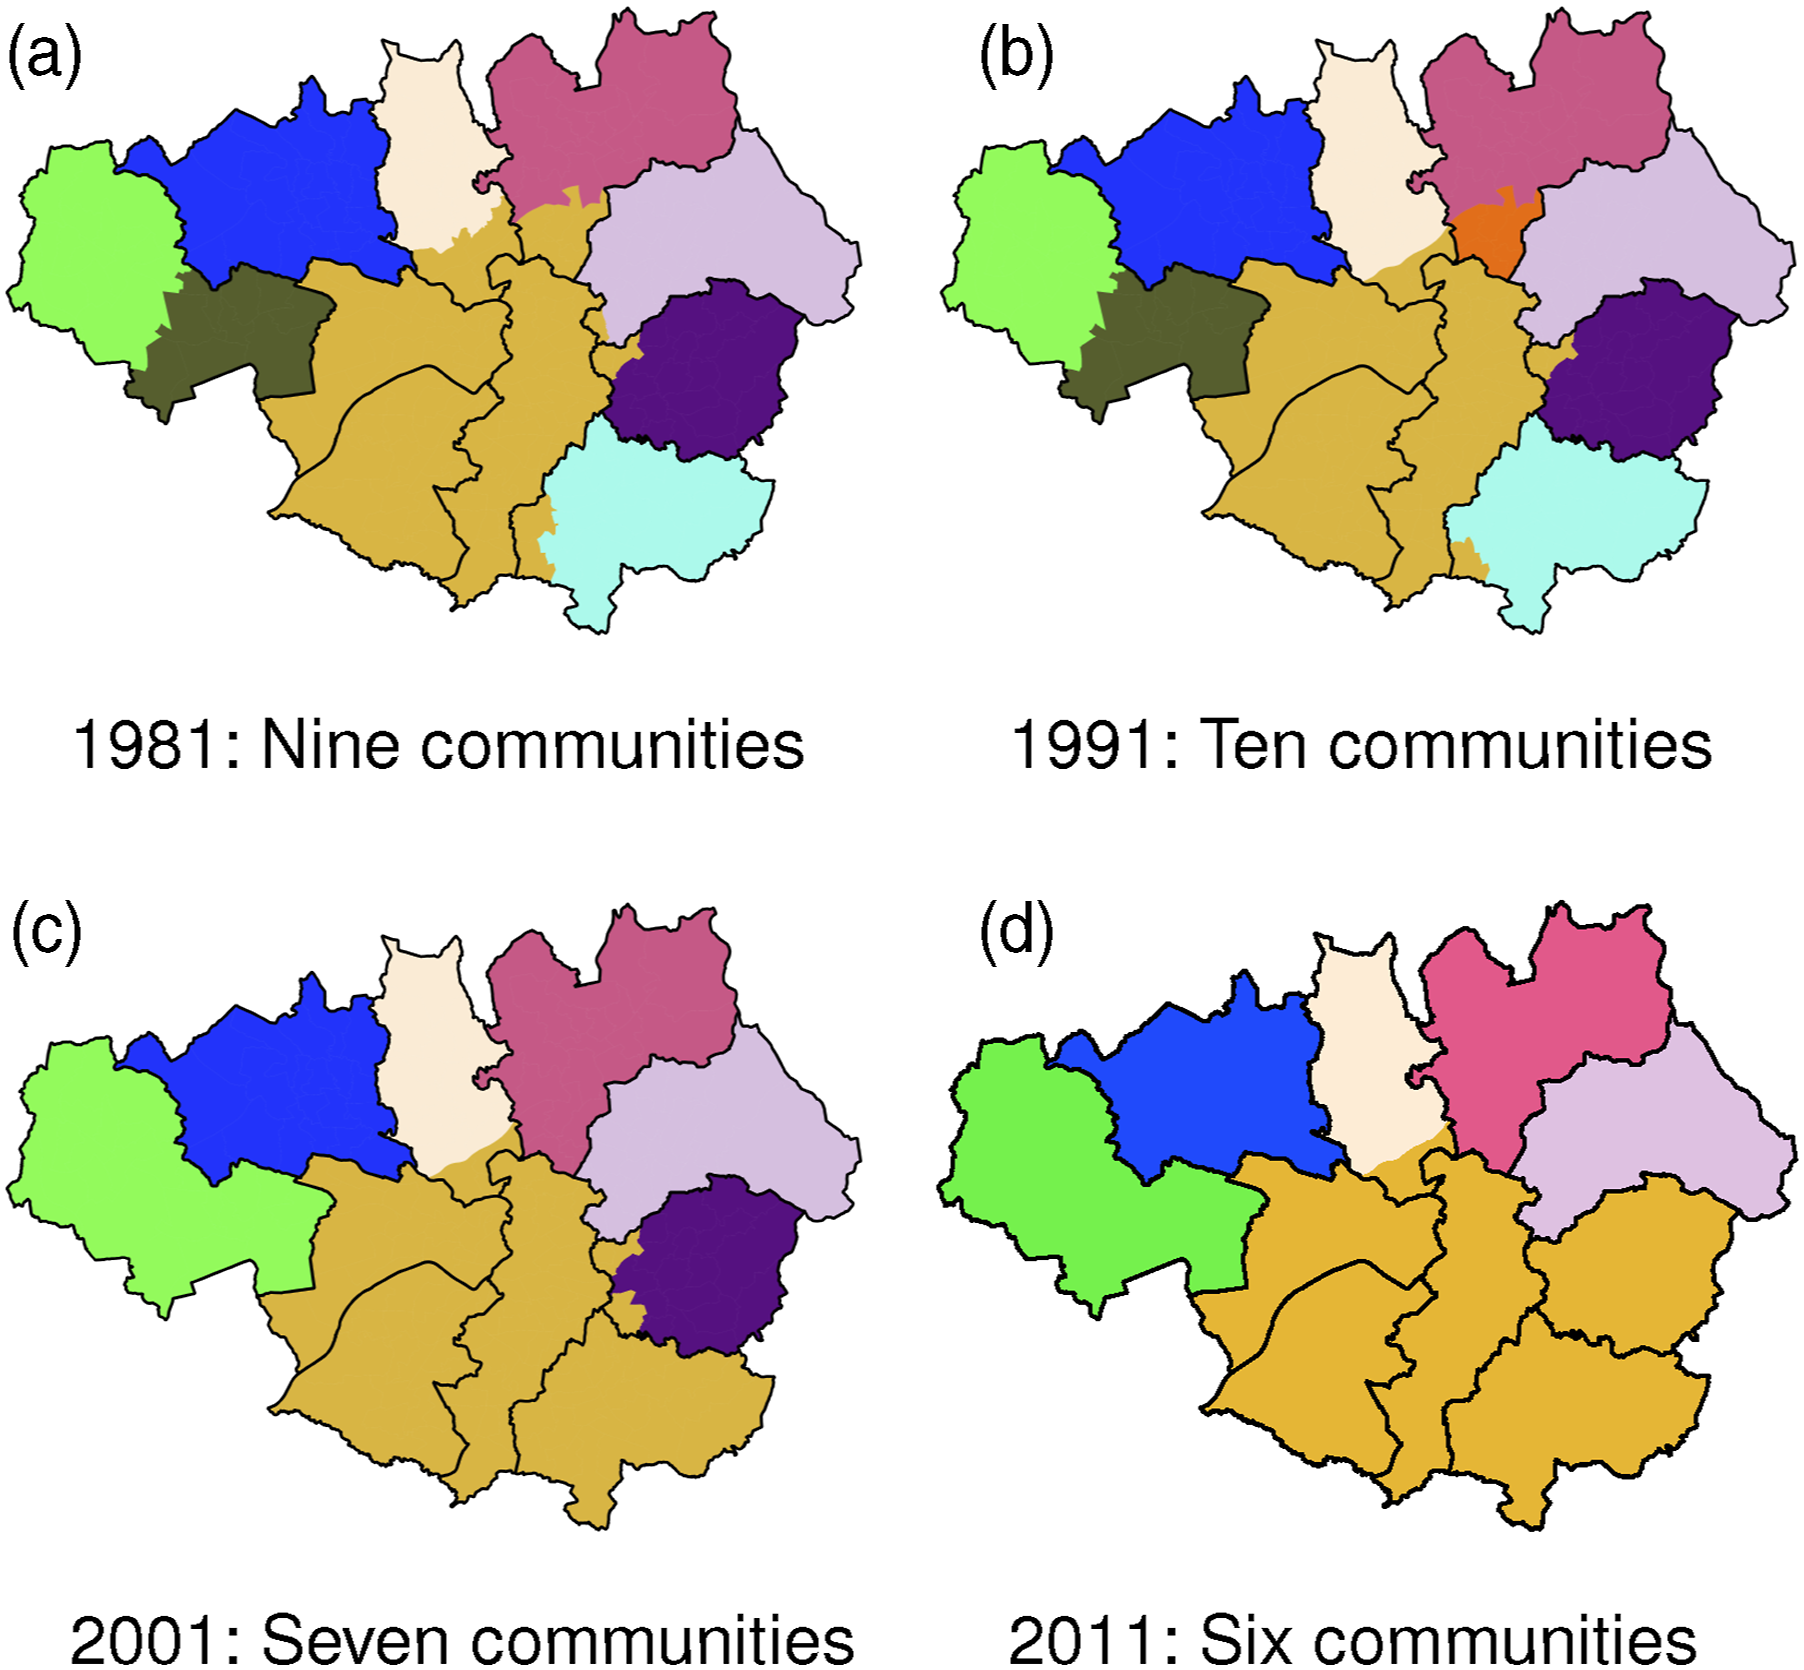
Taking both community detection algorithms into account, the five most northern local authorities of Wigan, Bolton, Bury, Rochdale and Oldham form relatively stable communities. The lack of structural changes in these authorities, especially in the InfoMap analysis, is suggestive that they are functionally more independent than the remaining local authorities in the metropolitan area. This finding is consistent with Folkman et al. (2016) who argue that northern peripheral boroughs are excluded from the benefits of economic growth due to uneven development favouring the central city and inner south west quadrant.
In contrast to the stability of the northern authorities, Manchester, Salford, Stockport, Trafford and Tameside, according to the InfoMap analysis, experience significant and sustained changes in their commuting patterns and community structure. With each new year of data, these communities become more interdependent and morph into larger community structures. This analysis, then, has captured the spatial agglomeration processes that have occurred to a greater extent in the city centre and southern area of Greater Manchester, corroborating the argument of Hodson et al. (2020) and Deas (2014) that Manchester’s strategy has been to promote the geographical concentration of economic development in the core of the city-region and its southern fringes.
In the next section, we use a gravity model to refine the commuter network into a residual network. By controlling for distance and retaining a subgraph of important links, we identify the underlying economic geography of Greater Manchester.
Residual network - refining network complexity
Presenting spatial network data is challenging for sizeable (or dense) networks. This is true of Greater Manchester’s commuter network, where complex commuting patterns make initial visualisations cluttered and inhibit spatial structure from being detected. Methods to facilitate more interpretable visualisations are often based on optimising node positioning according to some centrality measure, regardless of geographic position (Hennemann, 2013). For urban networks, however, maintaining a spatial element is important to understand the relationship between network topology and urban structure. To account for this, and to identify the functional economic geography of Greater Manchester, we refine the commuter network using a gravity model and plot the residual network at different thresholds.
Figure 8 shows the use of this technique in visualising the underlying structure of a spatial network. A clear image of the polycentricity of Greater Manchester emerges. At the 1% cutoff, Wigan, Bolton and Oldham emerge as economic clusters, but the patterns across the wider region are unclear. As we increase the retained edges to 2.5% and 5%, more centres become evident. A central cluster is also depicted in both models that was captured by neither COMBO nor InfoMap. At the 10% cutoff, the visualisation becomes cluttered and makes the interpretation of functional structures increasingly difficult. Residual networks for 2011 data keeping highest valued residual edges at different thresholds. Nodes are positioned geographically in respect to the centre point of their respective wards. Clusters of edges visibly reflect economic units across Greater Manchester.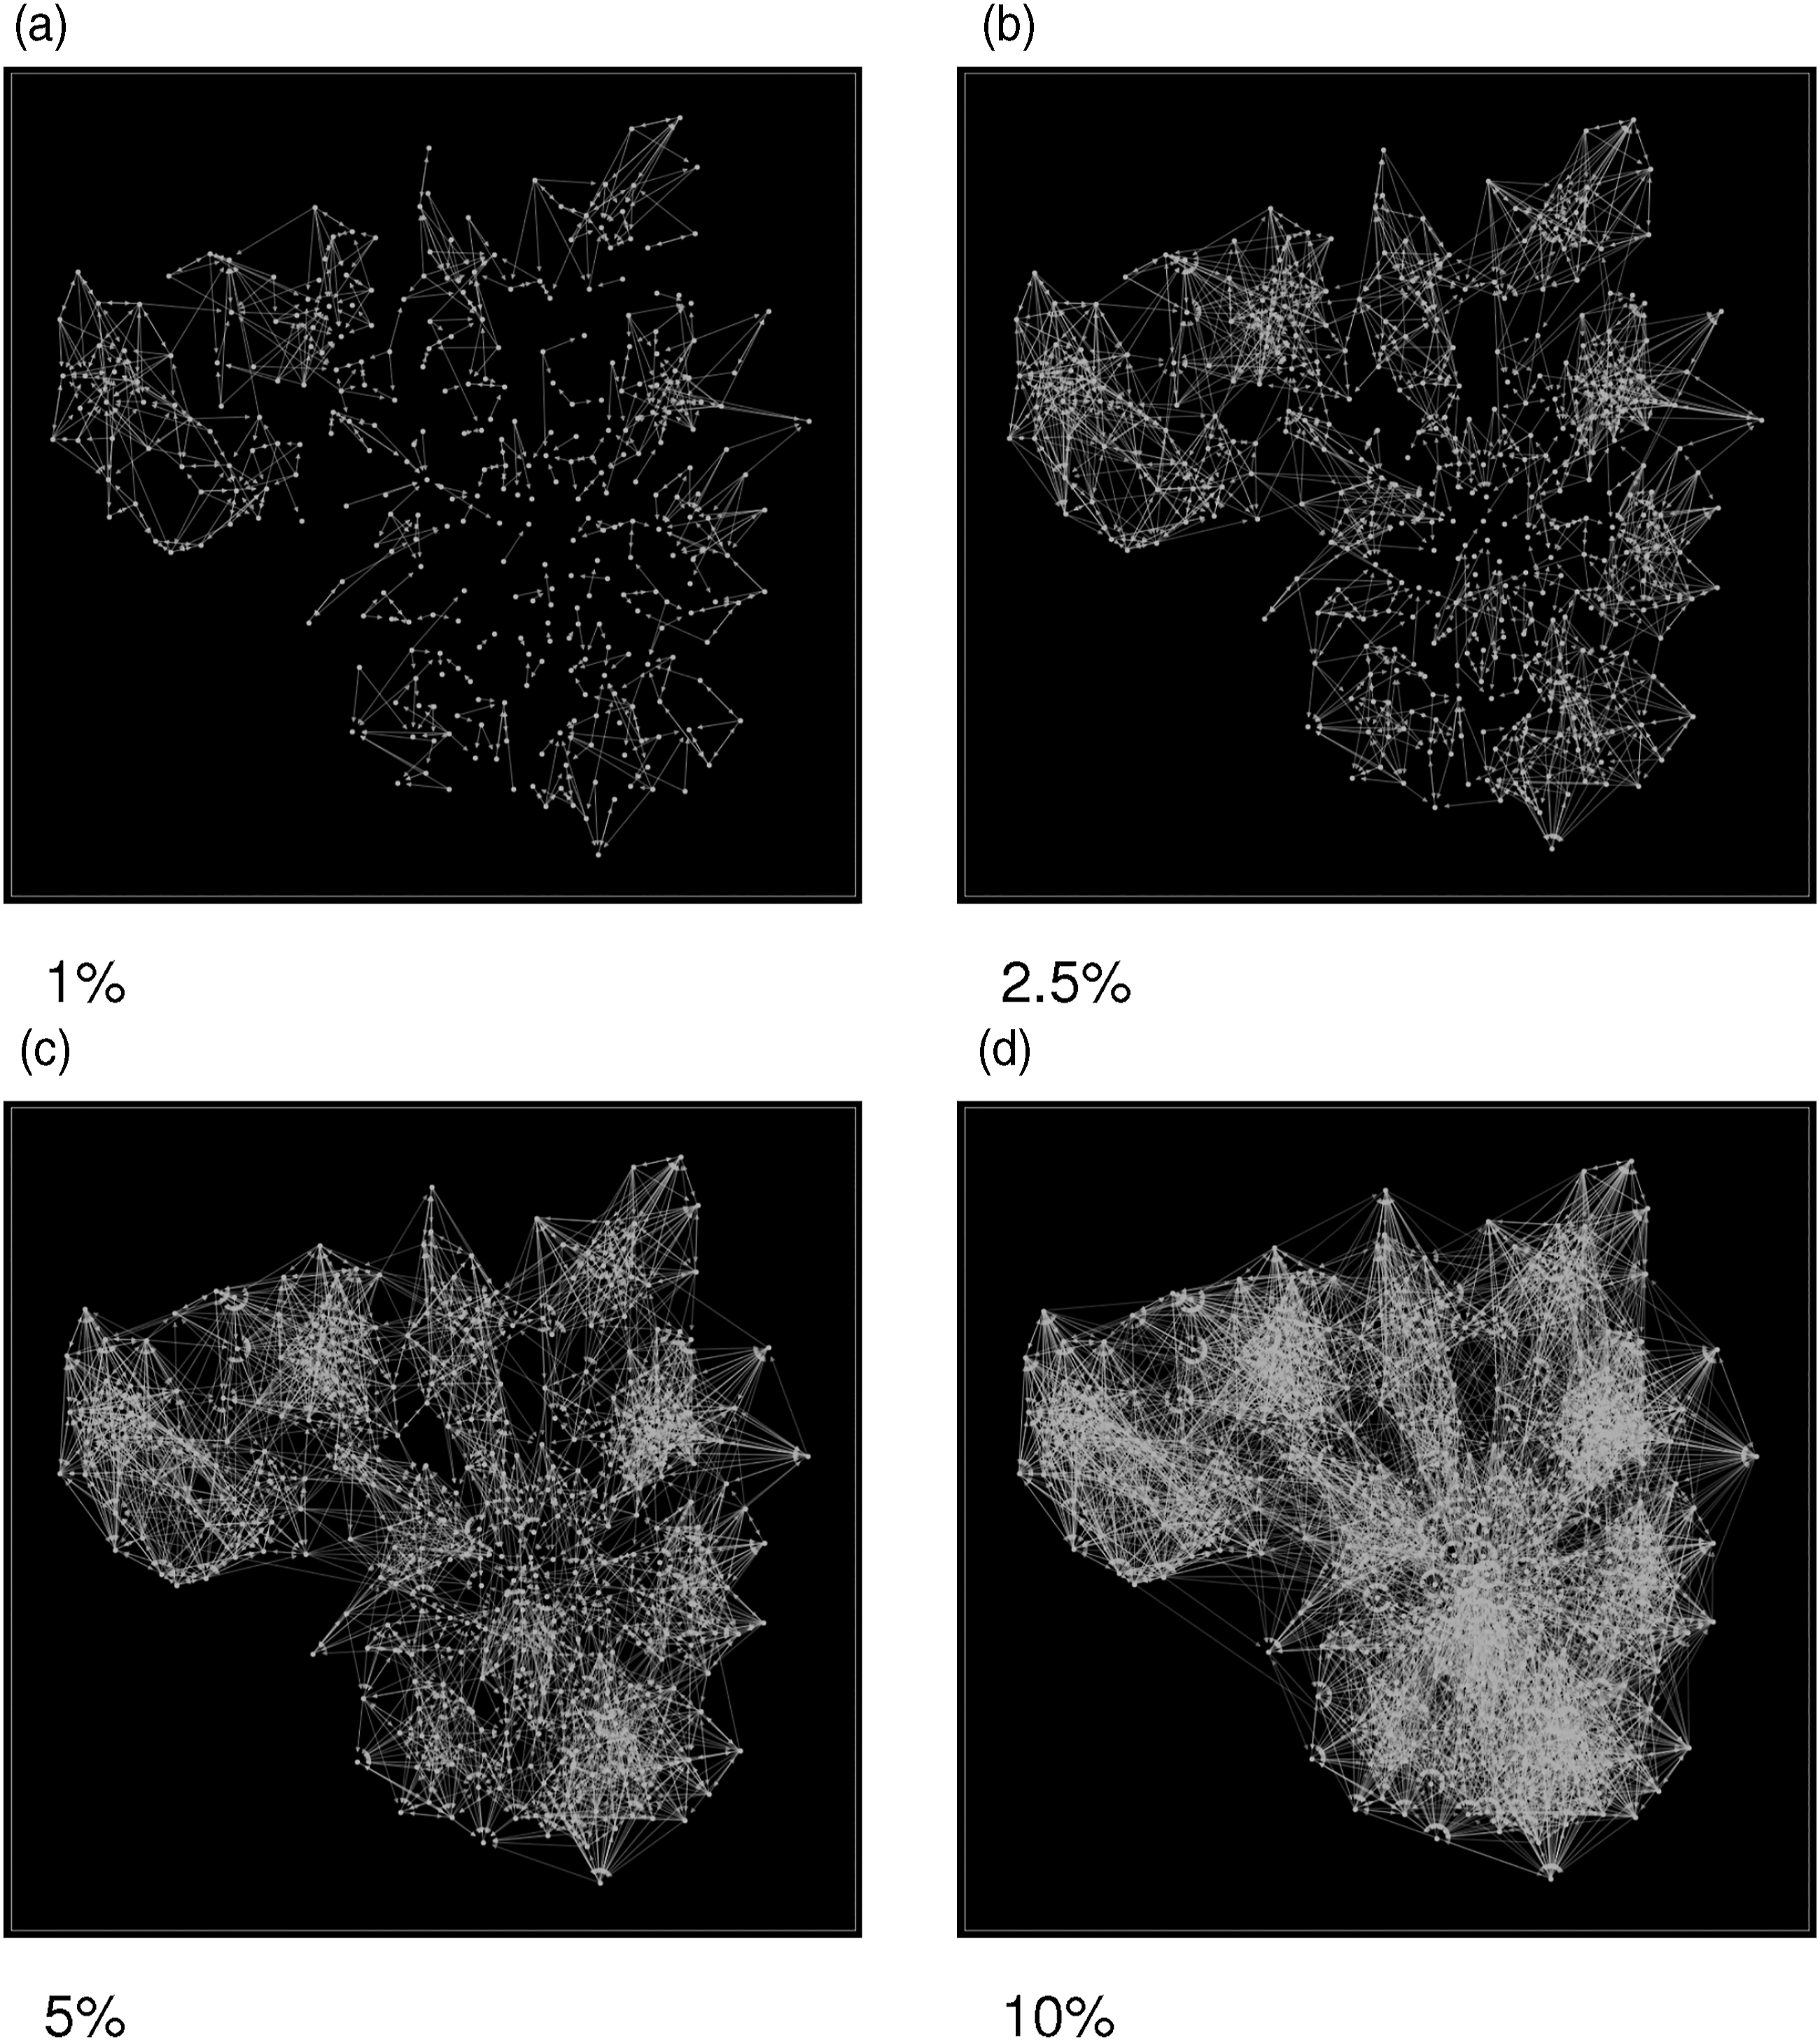
Visualising residual networks is a quick and simple method for interpreting the underlying structure of spatial networks. The residual network is essentially a subgraph of the initial commuter network that displays the most important connections across the region. Given this notion, we re-apply COMBO and InfoMap to the 5% residual network shown in Figure 8(c). It is expected that the community detection methods will perform better in their respective tasks following the reduction in network complexity.
Figure 9(a) shows that COMBO has detected 10 distinct communities, the same number as local authorities in Greater Manchester. The size, shape and structure of the detected communities are consistent with the polycentric nature of Greater Manchester and, to a large extent, the existing local administrative boundaries. Five of the 10 COMBO communities are identical to the existing administrative structure, with most other authorities seeing only slight changes. For the first time, COMBO detected a central community coterminous to Manchester city centre. This city centre community overlaps poorly with the Manchester local authority boundary, but this is unsurprising given the functionally unorthodox shape of the existing boundary. The new communities identified across the northern border are remarkably similar to those identified in previous COMBO analysis, providing further indication that these communities are the most stable in the region. Comparison of the community structure detected by COMBO (a) and InfoMap (b), performed on the residual network at a 5% threshold.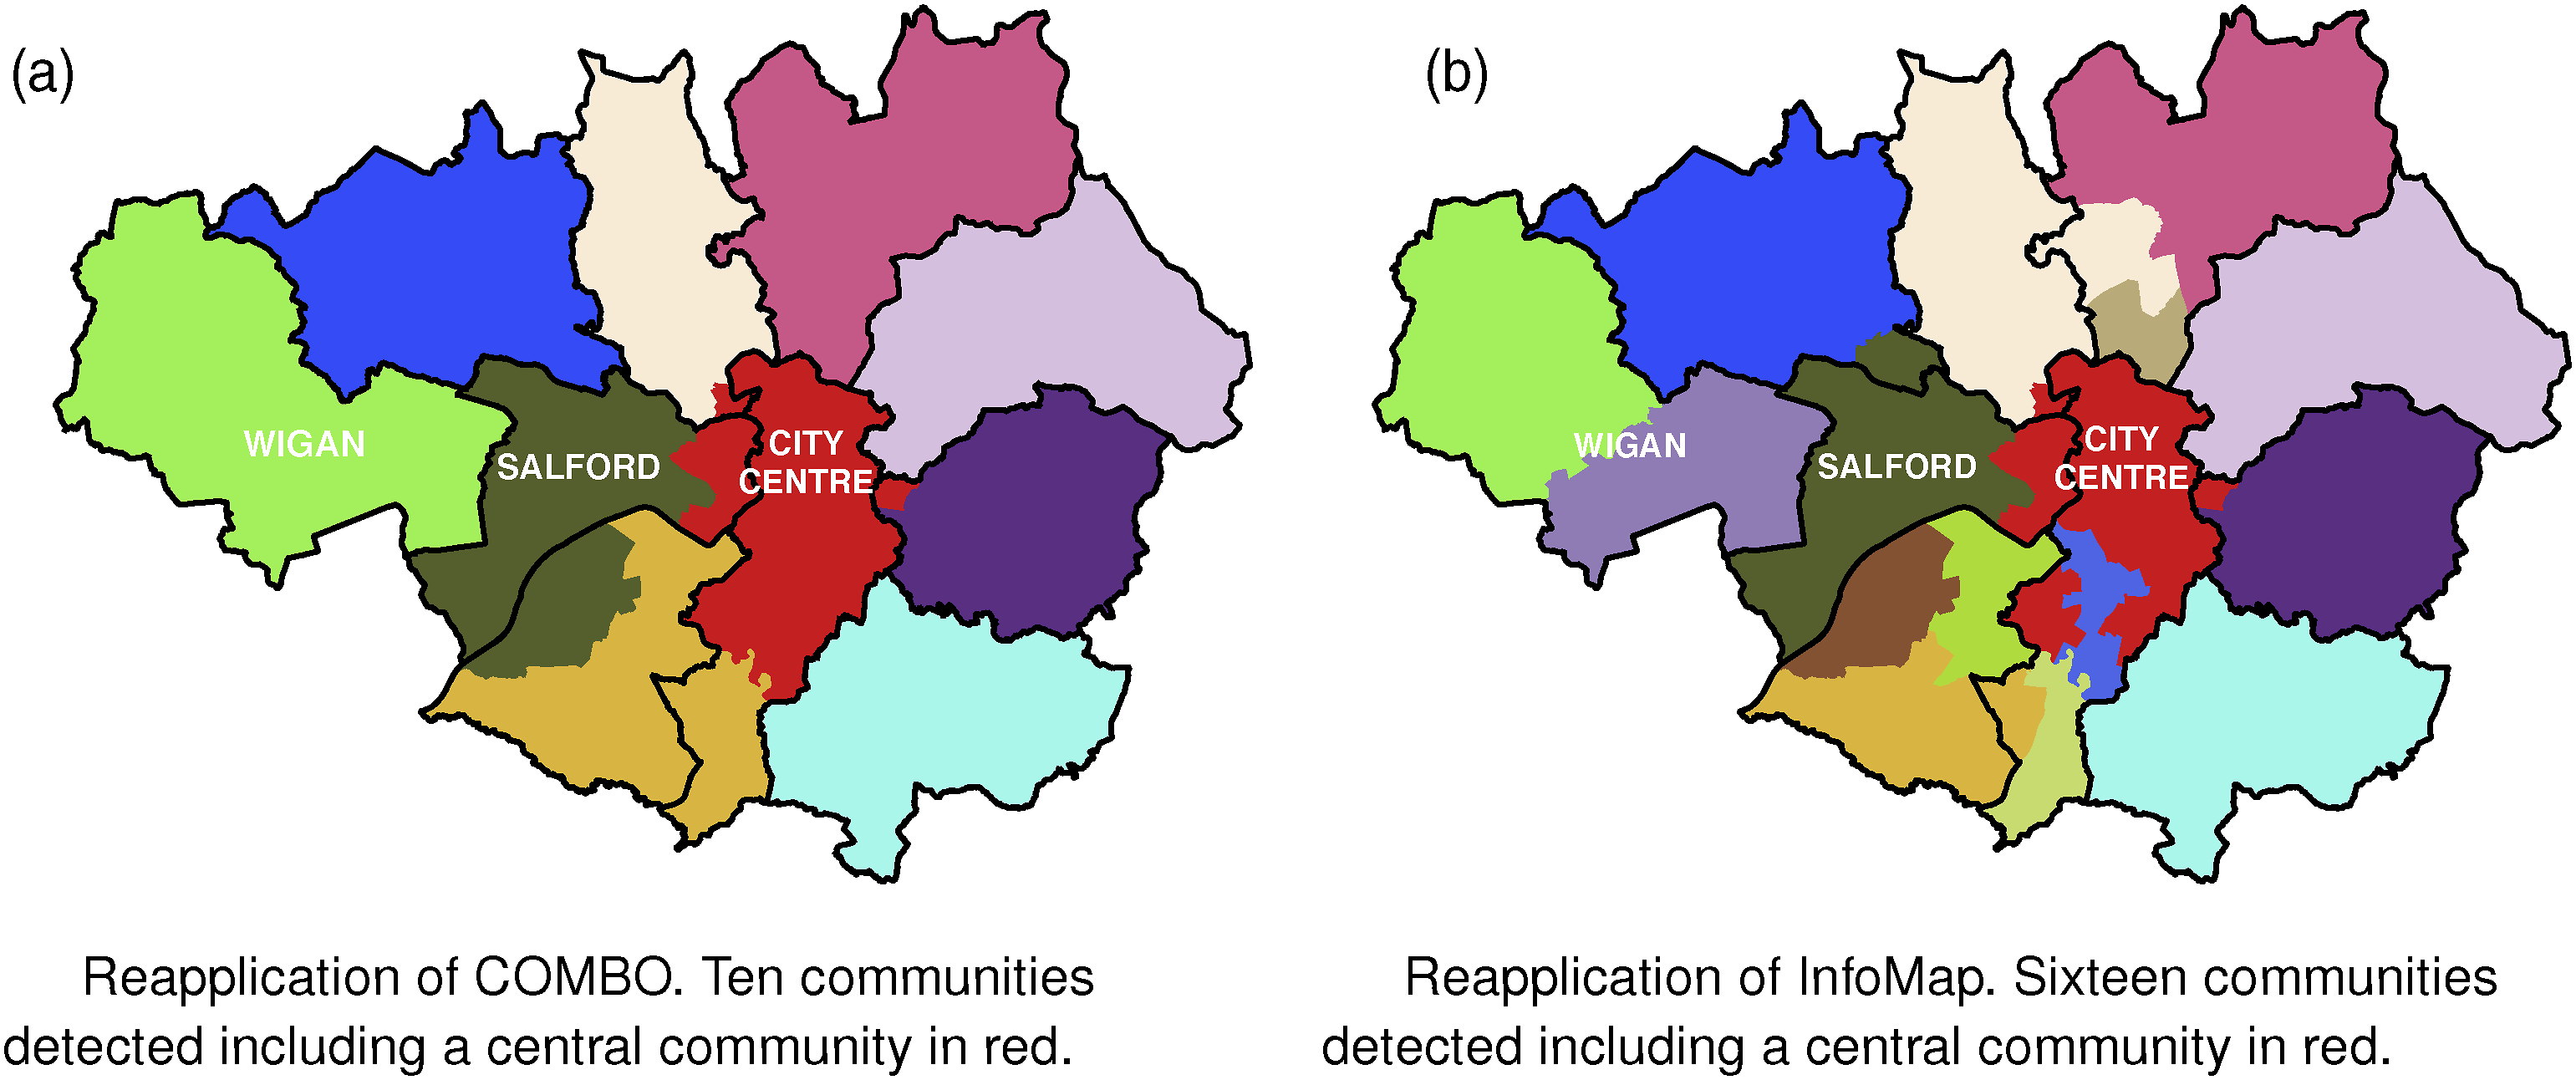
The re-application of InfoMap to the 5% residual network produced interesting results. Figure 9(b) shows that, whereas InfoMap previously detected an expansive community extending across central and southern Greater Manchester, we now have a number of smaller units. In refining the structure through gravity models, then, InfoMap is detecting the smaller interacting elements that form this larger community. This finding is less clear for the northern communities which are now, by comparison, larger than those in the south. A possible explanation is that the northern communities are delimited less parsimoniously at a local authority level, whereas southern communities are comprised of an amalgamation of interacting units.
When observing Figure 9(a) and (b) together, it is difficult to ignore the role that administrative boundaries play in shaping urban structure. Despite not being in absolute agreement, all the detected communities share boundaries that align to some extent with the existing administrative borders. In the case of Wigan, for example, the COMBO analysis in Figure 9(a) shows that the detected community is broadly coterminous with the existing administrative boundary. InfoMap on the other hand has divided Wigan into two distinct communities. The interesting point here is that both communities remain entirely within Wigan’s administrative boundary. This happens despite the wards that are to the eastern border of Wigan being geographically as close to Salford as they are to the centre of Wigan. The question then becomes what role does the administrative boundary structure have in shaping Greater Manchester’s urban structure? Using Wigan as an example, this finding may be a reflection of local authority employment patterns, and the fact that substantial numbers of Wigan residents work for the area’s local authority. It could also be a reflection of resident perceptions of labour market opportunities, their affinity with the town and their predisposition to structure job searches to focus on localised employment. More broadly, however, questions are raised regarding how local services, planning and funding within local authority boundaries shape the structure of metropolitan areas and perhaps fail to promote intra-regional development.
Discussion
Metropolitan areas are complex entities that are composed of multiple interacting elements. When reflecting on our results, then, it is important that we acknowledge the complexities of the system we are modelling and the limitations of our approach. The first issue in this regard is the type and temporal availability of the data used. Having only four snapshots of data over a lengthy period limits the ability to undertake sufficiently granular temporal analysis. In analysing commuter flows, we are also following previous works in suggesting that origin-destination interactions are representative of the broader patterns of connectivity that shape city-regional economic geographies (Hincks et al., 2018; Nelson and Rae 2016).
An advantage of using COMBO and InfoMap for most pieces of network-based analysis is that the algorithms determine community structure based solely on the patterns of connectivity within the network, and with no input from the user regarding the size or number of communities to be detected. In our application, however, commuter networks are dense, complex structures, with an inherent spatial underpinning. We also have an understanding of what appropriately structured administrative boundaries might look like and, as such, we can make judgements about how useful the network partitions might be in real-world debates on organising institutional and policy geometries. When reviewing the results presented in Figure 6 and Figure 7, then, we see that COMBO and InfoMap have achieved, to some extent, promising results in identifying spatial units that are coterminous to the existing administrative boundary structure. However, following the use of gravity models to refine the complexity of the network, Figure 9(a) shows that COMBO has now captured a more fragmented community structure that is closer to known clustering phenomena of different socioeconomic drivers. Using gravity models to create residual networks prior to performing community detection methods has improved results in our application. In this way, we liken the use of gravity models to that of feature engineering applications in machine learning, where domain knowledge is leveraged to improve the performance of computational tasks.
Whilst it is evident in our analysis that administrative boundaries are important structures in defining intra-regional economic geographies, as our results are comparable with existent administrative boundaries, the question remains as to why this happens to the extent we have seen. In instances where administrative boundaries do not align well with the geography of detected communities, the difficulty of reorganising boundaries must not be overlooked. Such undertakings are eclipsed by more pressing policy reform issues that are more easily delivered. This argument stands not only from a regional perspective, where the focus is on what is in a region, but also from an intra-regional perspective where the question of who is responsible for delivering local services becomes the primary concern. Against the backdrop of austerity and through work consolidated by AGMA, some of the Greater Manchester authorities have previously considered joint-working as a way of achieving economies of scale in relation to local public service delivery. The intra-regional geographies identified in this work might suggest particular alliances that make sense in relation to joint-working on specific sectors and policies.
Political, social and cultural factors will ultimately define the composition of local authorities, but this work has demonstrated the value of a network approach in providing evidence-based support to inform the development of intra-regional institutional structures and policies.
Conclusions
The findings from this research suggest that a combination of network analysis, spatial interaction modelling and geographical network visualisation can identify the underlying urban morphology of metropolitan regions. We argue that without network refinement using gravity models, community detection methods are challenged with unpicking the complex interdependencies that are a characteristic feature of intra-urban networks. The empirical analysis of the Greater Manchester region revealed a community structure that was geographically and algorithmically coherent and has the potential to be used as a framework to inform a policy debate over local service delivery. We have also demonstrated the importance of administrative boundaries in shaping the economic geography of administrative regions.
This work suggests two main directions for future research. First, this framework of analysis could be applied to different metropolitan settings, geographic scales, and would benefit from higher resolution spatial and temporal data that is likely to become more readily available. Second, commuter networks stand as an important proxy for intra-regional flows, but they say little about other relationships that shape urban areas (for example, professional, social or cultural networks). Extending beyond a monoplex (i.e. single-layer) network framework, could allow interrelations with urban other networks to be explored. Emerging work in the field of network science is being used to model systems of multiple interacting elements using multilayer networks (Bianconi, 2018). Whilst there are complexities in defining meaningful relationships between networks of different nodes, the potential to understand how urban networks co-evolve and influence each other is an area of potential future research.
Supplemental Material
sj-pdf-1-epb-10.1177_23998083211065767 – Supplemental Material for Detecting shifts in metropolitan structure: A spatial network perspective
Supplemental Material, sj-pdf-1-epb-10.1177_23998083211065767 for Detecting shifts in metropolitan structure: A spatial network perspective by Harry Odell, Eva M Navarro-López, Nuno Pinto and Iain Deas in Environment and Planning B: Urban Analytics and City Science
Footnotes
Acknowledgements
We thank Alan Harding (Greater Manchester Combined Authority) for useful discussions and continued support of this research. This work was supported by the ESRC-funded CDT in Data Analytics and Society [grant number ES/P000401/1].
Declaration of conflicting interests
The author(s) declared no potential conflicts of interest with respect to the research, authorship, and/or publication of this article.
Funding
The author(s) disclosed receipt of the following financial support for the research, authorship, and/or publication of this article: This work was supported by the ESRC-funded CDT in Data Analytics and Society [grant number ES/P000401/1].
Supplemental material
Supplemental material for this article is available online.
References
Supplementary Material
Please find the following supplemental material available below.
For Open Access articles published under a Creative Commons License, all supplemental material carries the same license as the article it is associated with.
For non-Open Access articles published, all supplemental material carries a non-exclusive license, and permission requests for re-use of supplemental material or any part of supplemental material shall be sent directly to the copyright owner as specified in the copyright notice associated with the article.