
Abstract
During the rural [re]vitalization process in China, national strategies required rural public spaces with cultural significance to be identified before planning decision-making. However, places identified as culturally significant by planners and visitors can differ from the ones mostly used and valued by locals. Even if there is a growing interest in integrating local perspectives and experiences in planning, studies seldom discuss and compare openly the adequacy of spatial configuration, cognition and behaviour to support it. This study took Anyi Historic Village Cluster as a case study to empirically investigate rural public spaces with three distinct, yet related approaches: (1) Morphological: spatial network centralities based on space syntax; (2) Cognitive: Lynchian village images with semi-structured interviews; (3) Behavioural: spatiotemporal occupation patterns using Wi-Fi positioning tracking. Significant places valued and used by locals and non-locals were detected with the multi-source data. Furthermore, multivariant regression models managed to characterize the relationship among different aspects of investigated rural public spaces, which also helped diagnose places of interest to prioritize in planning, demonstrating the advantage of integrating the sources of information in practice instead of studying them apart. Results can also assist rural planning on how to identify what to preserve, what to enhance, and how to develop such spaces, without overlooking the local needs or losing the rural identity.
Introduction
In spatial planning, morphological, cognitive and behavioural data are essential for understanding and representing the spatial configurations and their effect on the vitality of human settlements, as well as identifying the most significant and valuable public spaces empirically (Haq, 2003; Kim, 1999; Kim and Penn, 2004; Penn, 2003). Among them, morphology represents how space is topologically and geometrically structured, cognition shows how people view, perceive and memorize the space, and behaviour demonstrates how people actually occupy and use the space. Methods corresponding to the three sources of information were introduced to spatial analysis in the 1960–1980s as: 1. A family of topological accessibility and visibility analysis methods known as Space Syntax for Morphological Analysis (Hillier and Hanson, 1984; Hillier, 2007); 2. A set of interviewing and sketching techniques studying mental maps of cities through Cognitive Mapping (Lynch, 1960); 3. A group of observation-based strategies for activating human-oriented cities being dubbed as Behavioural Studies (Jacobs, 1993; Gehl, 2011).
Each method has been broadly applied in architecture design, urban planning, tourism and heritage management. Arguably, these three lineages of spatial design methods all focused on the relations between space and human behaviour. Much research has focused on combining two of the three information sources, creating terms such as space semantics, cognitive space and behaviour urbanism (Franz and Wiener, 2008; Hanna, 2020; Haq, 2003; Kim and Penn, 2004; Noyman et al., 2019; Orellana, 2019; Penn, 2003; Stevens, 2006). These studies implied that both perceived and used places are influenced by the spatial configuration and socio-behavioural patterns. Yet, conclusions are not necessarily alike (Franz and Wiener, 2008; Haq, 2003; Ma et al., 2018; Stevens, 2006). Remarkably, 20 years after Kim’s dissertation about spatial configuration, cognition and behaviour, empirical studies combining all three sources are still scarce (Kim, 1999).
Moreover, considering that these methods were mostly applied to urban environment, further studies to validate their applications to rural environments are still needed. Yet, it has become urgent in China to investigate the rural spaces and reveal the local identities of villages. In the past decades, rapid urbanization has been challenging the millennial rural-based foundations of the Chinese society (Fei et al., 1992). The two extremes of non-use and over-use have put the rural identities at risk (Wang, 2000). Fearing the loss of local identities, scholars have realized the urgency of [re]vitalizing rural heritage (Long, 2014; Yang et al., 2016). Consequently, a national policy, The Five-Year Plan on Rural Vitalization Strategy (2018–2023), was released on September 26th, 2018, expressing the strong intention to support [re]vitalizing and preserving rural China in the upcoming years (CPC Central Committee and State Council, 2018).
This national policy calls for ‘constructing modernized villages based on the rural society with local identities, avoiding villages mimicking each other, and preventing rural landscape from getting over-urbanized’ (CPC Central Committee and State Council, 2018). The policy requires that before any planning decision-making, local governments and planners need to thoroughly identify the local rural heritage, which may not be listed officially. Some tangible objects (such as a well or a tree) and spaces with intangible attributes of significance (such as the space under a tree providing shade and breeze) in historical villages are not normally recognized as heritage, but contribute significantly to the collective memory and emotions of villagers, which could be recognized and safeguarded as local heritage (Wang, 1999). Scholars have recommended to involve locals as key stakeholders in the [re]vitalization process (Chen and Li, 2008; Wang, 2000). This approach is endorsed by the UNESCO Recommendation on the Historic Urban Landscape, which calls for actively involving various stakeholders in heritage planning and decision-making process, considering their needs and preferences (Bandarin and van Oers, 2012; Pereira Roders, 2019; UNESCO, 2011). Under such circumstances, the aforementioned morphological, cognitive and behavioural analyses have great potential to comprehensively assist the identification of cultural, historical or natural significance conveyed by various stakeholders, and locals in particular, to be included in planning processes and related decision-making (Bai and Wang, 2019a).
This study aims to reveal the places with cultural significance in historic villages to support planning decisions by involving both locals and non-locals to identify the most used and valued significant public spaces. To do this, a methodological framework was proposed following Kim (1999) to link the three spatial information sources, that is, morphology, cognition, and behaviour, and state-of-the-art methods for each source were jointly applied in a Chinese historic village cluster.
Methodology
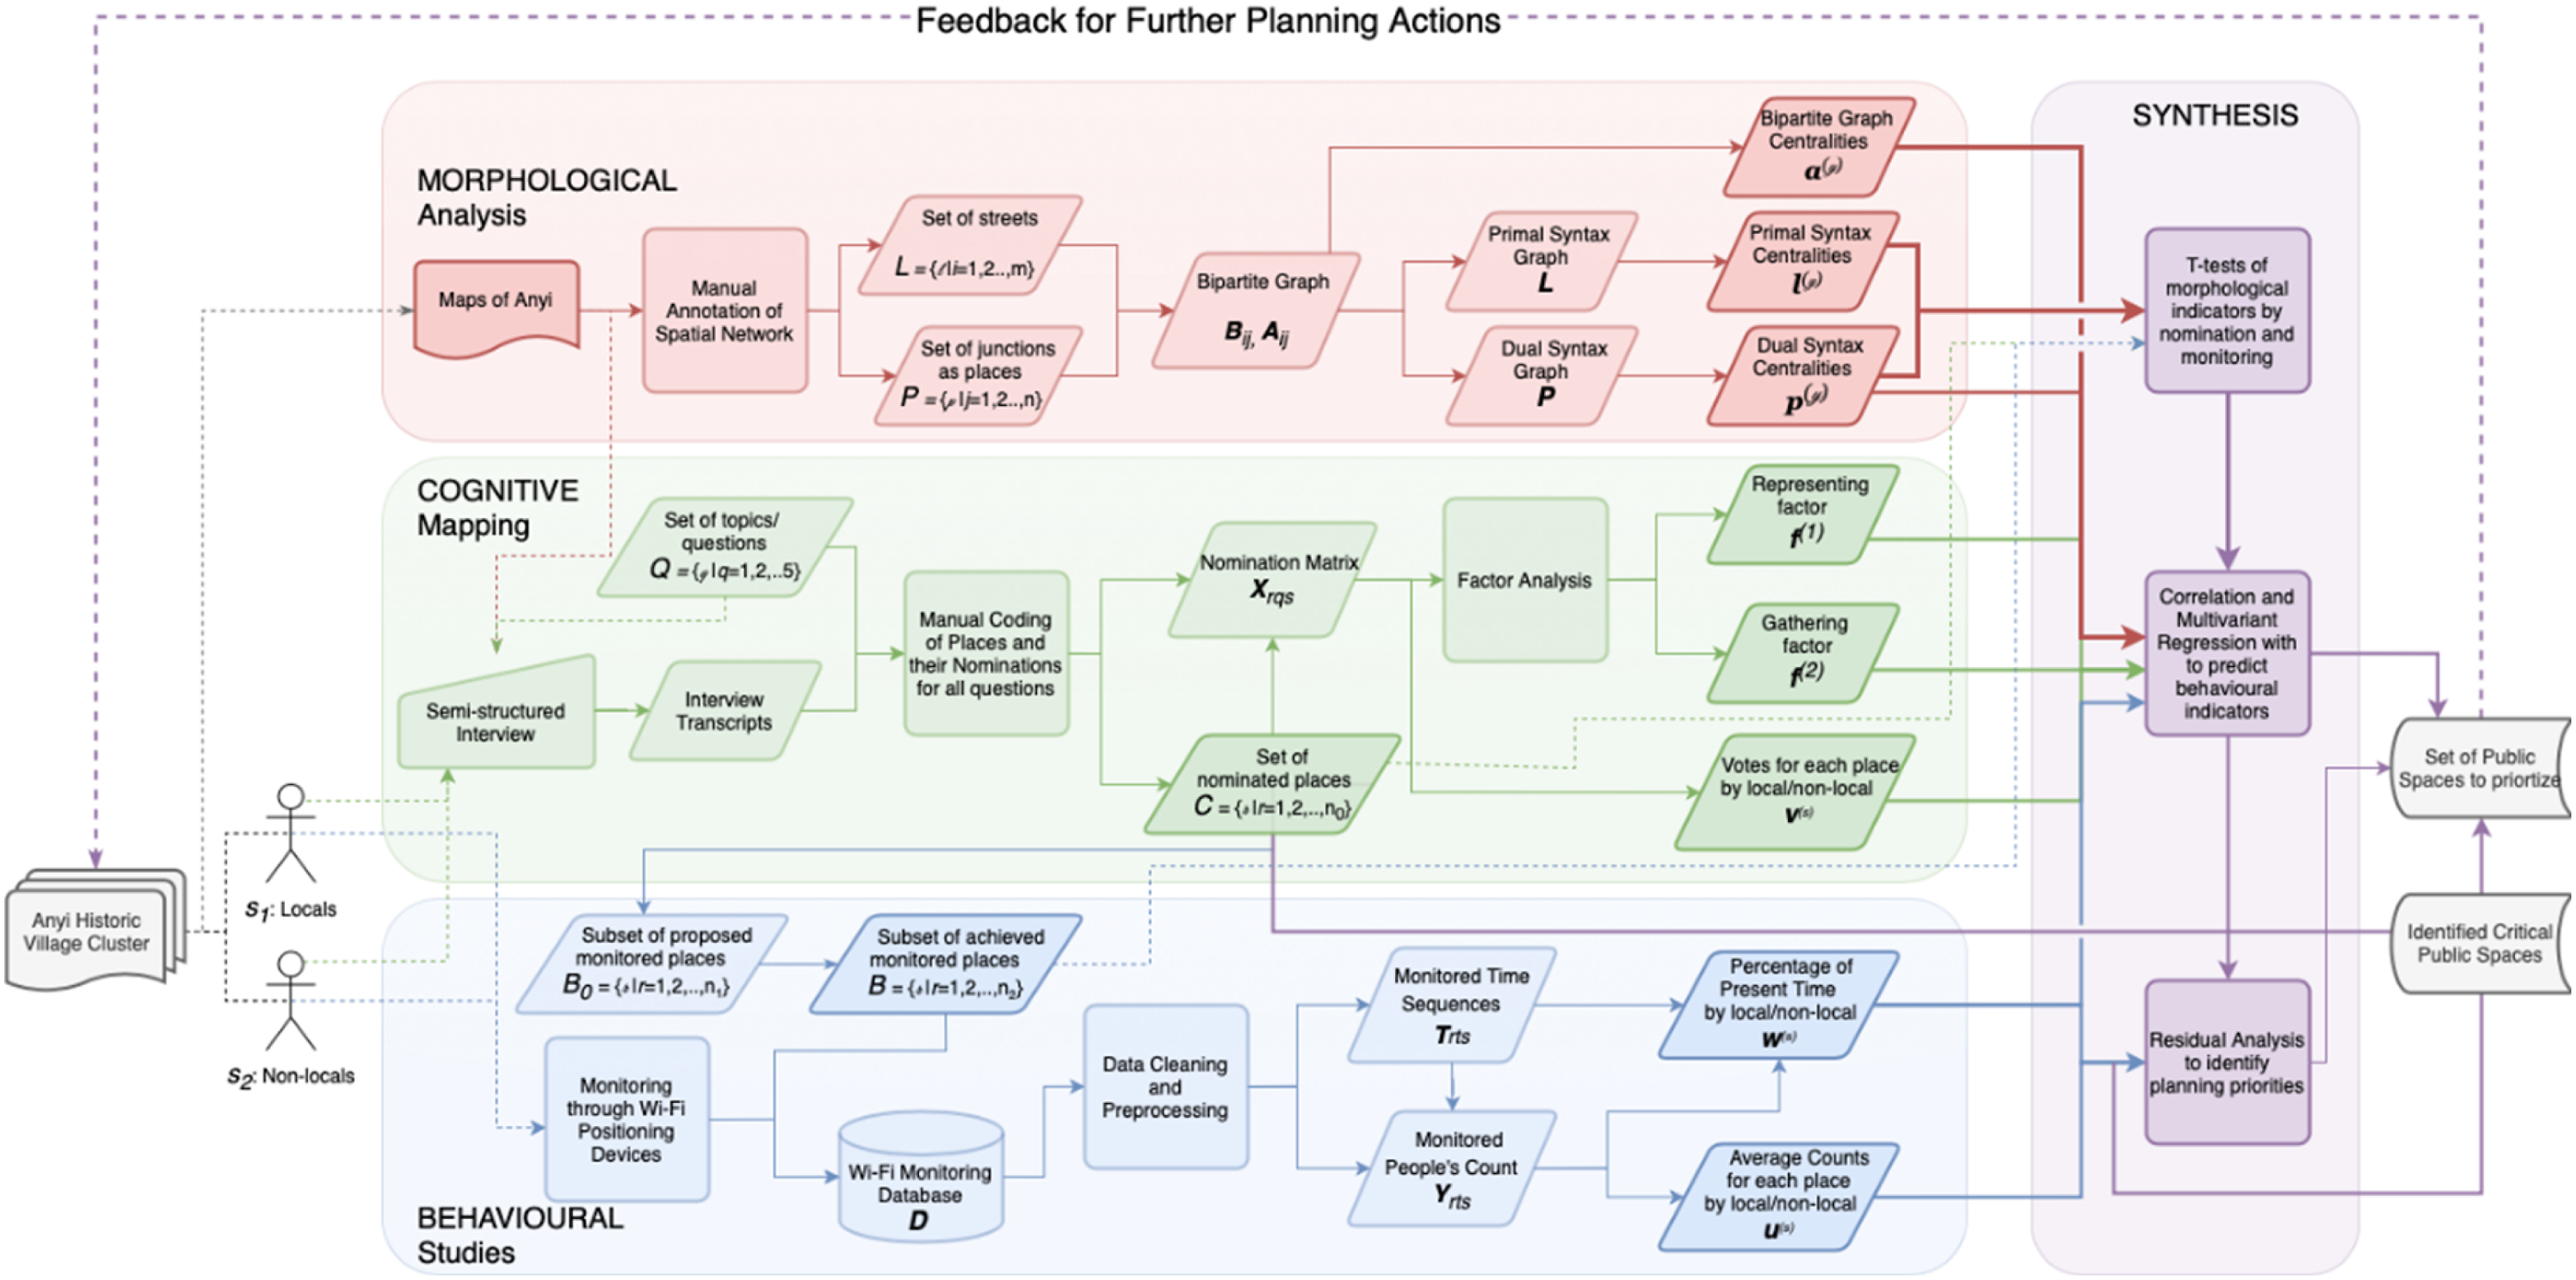
As is shown in Figure 1, the methodological framework consists of four parts: three parallel sub-studies and a synthesis sub-study integrating their results. For each information source, a similar workflow was followed: 1. Supporting materials (e.g. maps, interview scripts, Wi-Fi devices) are prepared; 2. A set of public spaces is determined directly or indirectly; 3. Data is collected for each space in the set describing its features; 4. Specific analytical methods are applied to derive key indicators to quantify the information source; 5. The key indicators are inputted to the synthesis sub-study to compare and characterize the relationship among information sources using regression models as dependent and independent variables and 6. Spaces with either high key-indicator scores or obvious mismatch among information sources are identified to prioritize in planning. The overall methodological framework to investigate rural public spaces using morphological, cognitive and behavioural sources of information.
Case study
Anyi Historic Village Cluster (AHVC) is composed of three villages, located in central Jiangxi Province, south-eastern China. According to the local municipal archive, AHVC has a history of around 1000 years (Anyi County Archive Committee, 2007). Seven monuments (including residential buildings, ancestral halls and an old opera stage) distributed in AHVC were listed as Major Historical and Cultural Site Protected at Provincial Level. Besides, a thousand-year-old camphor tree, the ancient stone-paved trade paths, old wells and stone archways were also considered as traditional elements in the archive though not listed as heritage. Since 2006, the local government has been considering both heritage preservation and exploitation. Within the process of rural [re]vitalization, a few deserted houses were chosen as pilot projects and renovated with modern aesthetics. Consequently, contemporary buildings have been introduced in the historical areas, which can be controversial for the traditional rural context. This research was conducted between November 2018 and March 2019. The entire village cluster was taken as a case study, treating all existing public spaces equally, old or new, listed or unlisted as heritage, without preconception, to investigate their uses and cultural significance. Further information about AHVC could be found in Supplemental Materials 01 and Figure S1.
Morphology – Bipartite-graph space syntax
In the course of Space Syntax theories’ development since the 1980s, different approaches have been introduced concerning network centralities and accessibility. Such approaches can be characterized with how they represent spatial relations, such as with axial lines, convex maps, angular segments, visibility graphs, voxel units, spectral methods, etc. (Bafna, 2003; Fisher-Gewirtzman et al., 2013; Haq, 2003; Lu et al., 2019; Penn, 2003; Turner, 2007; Turner et al., 2001; Nourian, 2016; Nourian et al., 2016). These models abstracted the space with different conditions and fitted their own analytical purposes, sometimes causing criticisms and contradictory evidence, especially concerning the use of axial lines (Ericson et al., 2020; Hillier, 1999; Ma et al., 2018; Ratti, 2004; Read, 2011).
In this study, a more generic representation of the space – the bipartite graph approach – is proposed following previous studies (Batty, 2004; 2013; Nourian et al., 2016; Porta et al., 2006). A set of street-centrelines
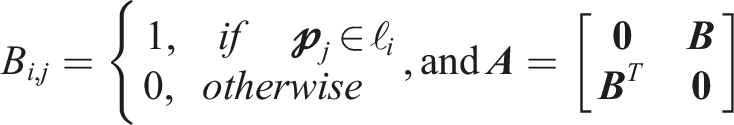
The bi-adjacency matrix
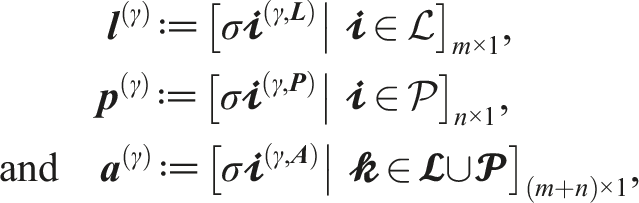
Degree Centrality (whether a place directly connects to many places), Closeness Centrality (whether a place is closely connected to many other places), Betweenness Centrality (whether a place appears in many shortest paths connecting the network as bridge) and PageRank [Centrality] (whether a place connects to many ‘circles’ of ‘central’ places, and thus demonstrating the steady state of a random walk) of the graphs were computed using NetworkX Python Library (Hagberg et al., 2008). The computation of the four centralities relies on the concepts of shortest paths and random walks, respectively, which is believed to correspond with the space discovery modes with different levels of familiarity (Nourian, 2016). All four centralities are common in social network analysis and space syntax, capturing related yet distinct characteristics of the nodes as either street-lines or junctions (Agryzkov et al., 2019; Agryzkov et al., 2019; Boulmakoul et al., 2017; Curado et al., 2020; Nourian, 2016; Nourian et al., 2016; Page et al., 1998; Porta et al., 2006; Taheri et al., 2017; Wasserman and Faust, 1994). The centrality computation yields three groups of vectors
Cognition – semi-structured interview
Along with the ‘five elements’ of cities, Lynch also proposed a methodology with semi-structured interviews and cognitive map sketching to understand how people sense the city they live in (Lynch, 1960). Since then, his theories have been broadly referenced, adapted and sometimes critiqued in urban planning, tourism and environmental psychology (Ford, 1999; Filomena et al., 2019; Hall and Page, 2014; Morello and Ratti, 2009; Stevens, 2006). Although his purpose was originally about wayfinding and the structure of city imageability, Lynch did interview about the significance of places for citizens and the symbolic and emotional values in particular (Lynch, 1960), allowing for amendments by adding space usage, playability and cultural significance into the framework (Bai & Wang, 2019b; Peng et al., 2020; Stevens, 2006; Van der Aa, 2005).
A semi-structured interview was designed under the Lynchian paradigm, while dimensions of cultural significance and space usage were added by inquiring representative, meaningful, crowded and attractive places for participants. Twelve participants sampled from key stakeholders joined the interview, including six local villagers and six non-locals (architects, government staff and managers). Maps of AHVC were presented during the interview to help participants recall the places. Participants were asked to mark the places where they refer to, or orally describe them if they could not read maps (Bai & Wang, 2019b). The interviews were recorded and transcribed, being consented to by all participants.
The transcription was coded inductively on five main topics (denoted as
Factor analysis with Varimax rotation was conducted along the
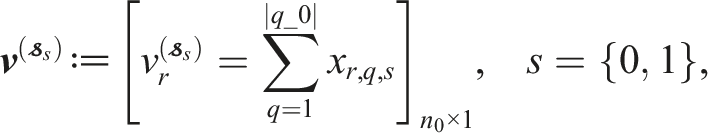
Furthermore, the total number that each place
Behaviour – Wi-Fi position tracking
Classical space syntax is a good model to predict traffic flow as it focuses on primal line syntax (Major et al., 1999; Major et al., 2000; Ma et al., 2018; Penn, 2003). Switching to dual point syntax provides possibilities to regard public spaces as locations to stay at in instead of merely to pass through (Batty, 2017; Gehl, 2011; Zhang et al., 2020). The staying activities provide meaningful information of the public spaces in traditional villages like AHVC, which can be either where locals gather daily for chatting, or where tourists visit occasionally for sightseeing. To capture the crowd staying behaviour in open public spaces, Wi-Fi Position Tracking has proved effective for its balance between applicability and accuracy (Huang et al., 2018; 2019; Lin and Huang, 2018; Mashhadi et al., 2016; Sapiezynski et al., 2015).
In this sub-study, a Wi-Fi positioning system was set up in AHVC under the IEEE 802.11 protocol, following previous studies (Huang et al., 2017 2017; Huang et al., 2018; Lin and Huang, 2017, 2018). A set of Wi-Fi Access Points (APs) were installed at pre-selected locations to record the presence of Wi-Fi-enabled mobile devices (as seen in Supplemental Figure S3). The record dataset
Data pre-processing (as described in Supplemental Material 06 and Figures S4-5) was conducted to distinguish three groups of people (non-locals, locals and others) based on the MAC-addresses’ presence frequency. Following Lin and Huang (2018), the arrival-departure pattern can be plotted for each group as 2D heatmaps in Figure 2. Clear patterns can be observed: (1) points along the diagonal represented the moving behaviour when people passed by; (2) points parallel to the main diagonal demonstrated the sightseeing behaviour when people stayed for a short time and (3) points distributed in the top left part of the plots showed the staying behaviour when people came and stayed for a longer period. As the patterns of locals and non-locals are clearer and fit better to the research question, further analyses will only consider these two groups. The arrival-departure time plot of the three labelled groups of people: left for non-locals, middle for locals, right for others.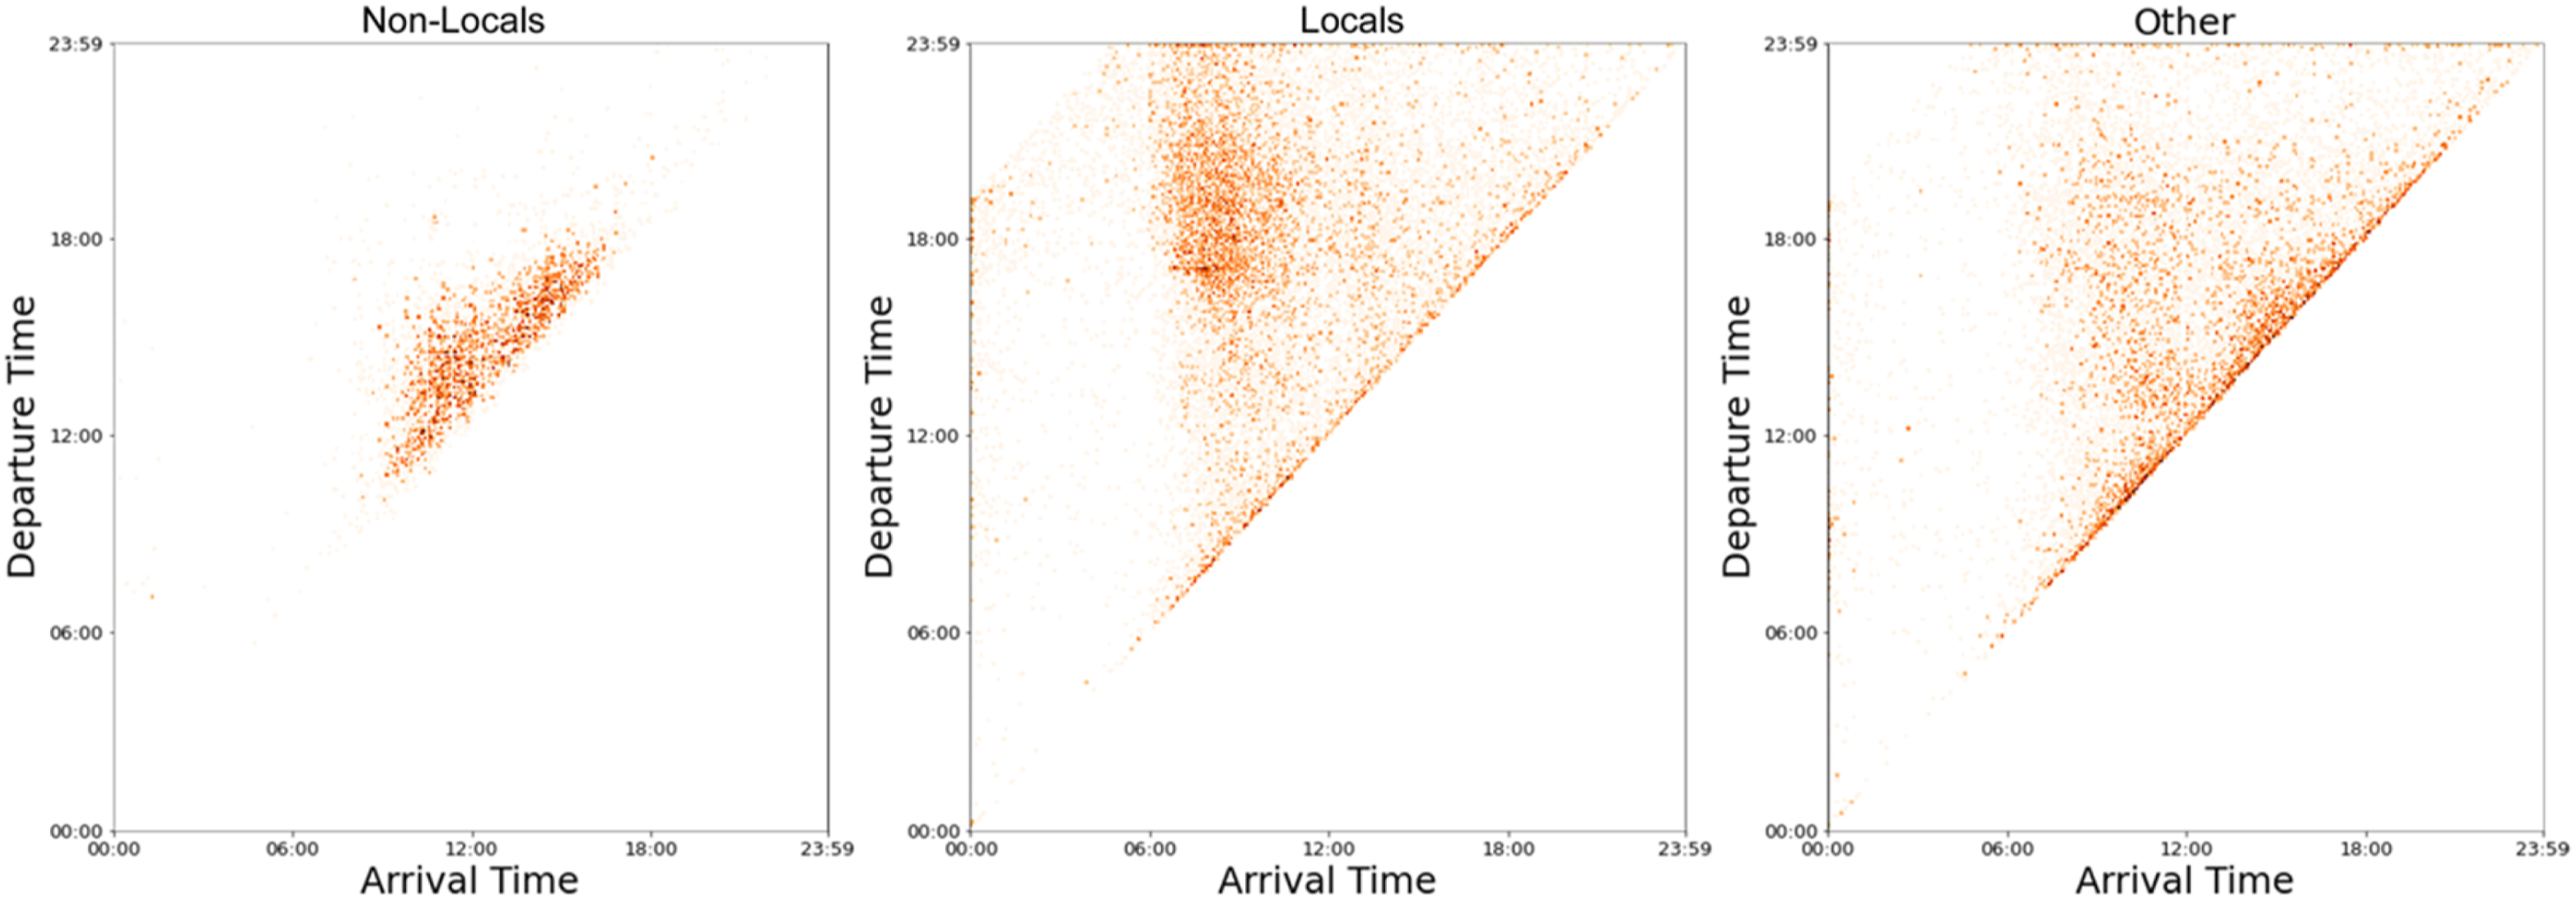
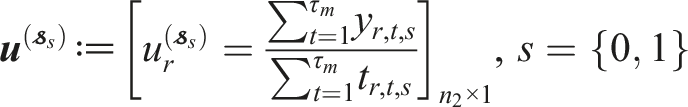
After pre-processing, the number of both groups of people

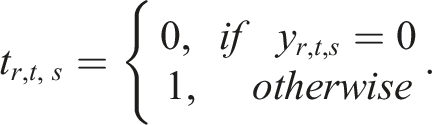
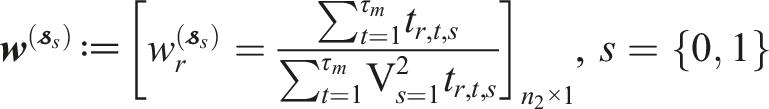
As not all devices managed to capture data all the time, another matrix
Analysis of Variance (ANOVA) was conducted on
Synthesis of information sources
All the previously listed variables from each source of information could be referred to in Supplemental Table S1. The following key indicators were selected to investigate their relations: 1. For morphological analysis, four dual-syntax centralities 2. For cognitive mapping, the factors 3. For behavioural studies, the average counts
As hypothesis, the behavioural indicators could be characterized and predicted with indicators from the other two sources. A regression model for the local count
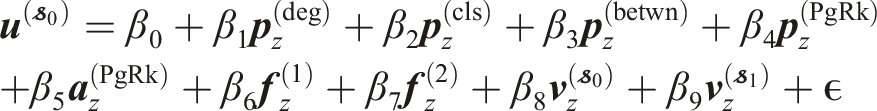
All independent variables were standardized into z-scores (subtracted with means and divided by SDs within set
Furthermore, as the dual-syntax centralities
The indicators were first compared pair-wise with Pearson Correlation using SciPy python library before regression models were constructed, where instances were omitted when at least one variable contained empty values. Ordinary Least Squares (OLS) was used to estimate the regression models with
Making behavioural data dependent variables in regression is a natural choice since the ultimate goal of rural [re]vitalization and sustainable heritage planning is arguably to stimulate the human activities in public spaces, to engage stakeholders through active usage, and therefore to enhance human-centred heritage (Janssen et al., 2017; Ginzarly, Pereira Roders and Teller, 2019). It is valuable to both investigate the interpretability of relevant indicators for predicting behavioural patterns, and compare predictions with observations (Wooldridge, 2013).
Since the correlation and regression analyses only investigated places in set
Results
Evidence distinguishing locals and non-locals
Cognitive mapping enables the distinction of perceptions between locals and non-locals. The behavioural tracking, on the other hand, can distinguish the behavioural patterns of different groups by observing the raw occupation data. However, although intended by introducing centrality indices within different radii and depths, such distinctions cannot be directly derived from morphological analyses.
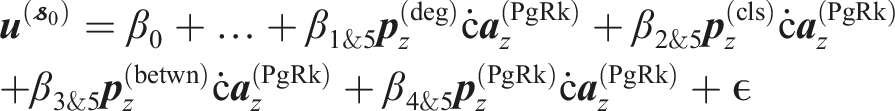
K-means clustering on the two cognitive factors Left: the two main factors 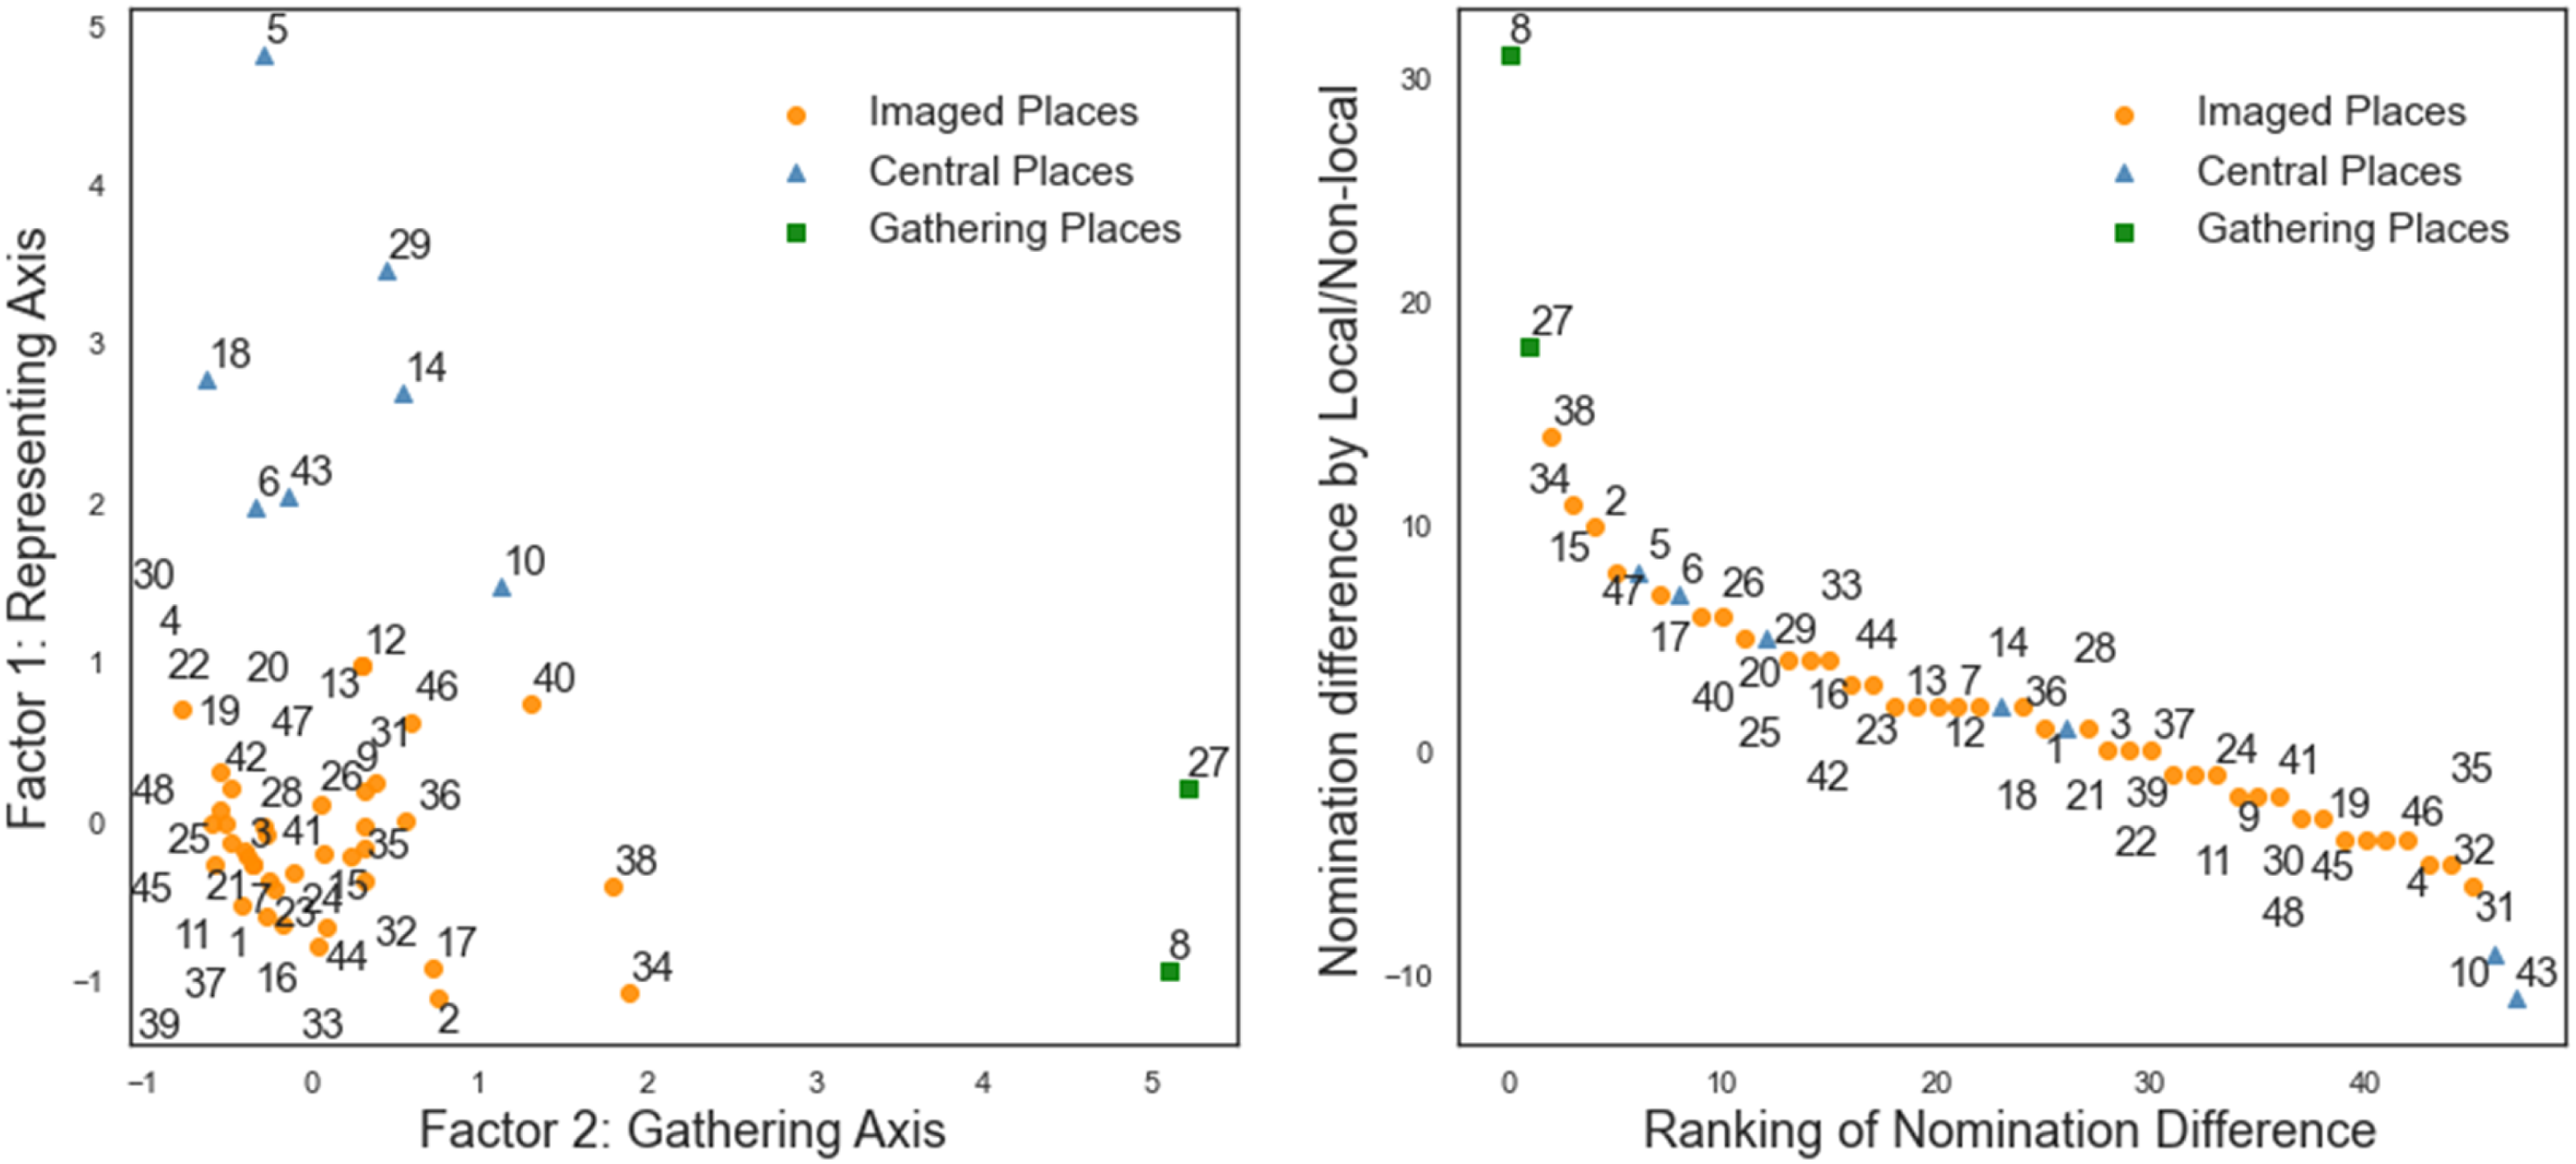
Inspecting the behavioural patterns at the monitored places, clear distinctions between locals and non-locals could also be observed. The average occupation patterns of both groups on a typical day for a subset of exemplary APs are shown in Figure 4 (the complete temporal patterns of all APs could be found in Supplemental Figures S11-12). For some APs (for example, LT04 located at The average number of people present at each AP for every time window in a ‘typical’ day. The solid curves showed the average numbers, while the shades showed the standard deviations. The daily numbers of captured people from Jan 28 to Mar 24 were plotted in the subgraphs, showing the peaks of non-locals during weekends and the relatively steady curves of locals. For brevity, only a typical subset of 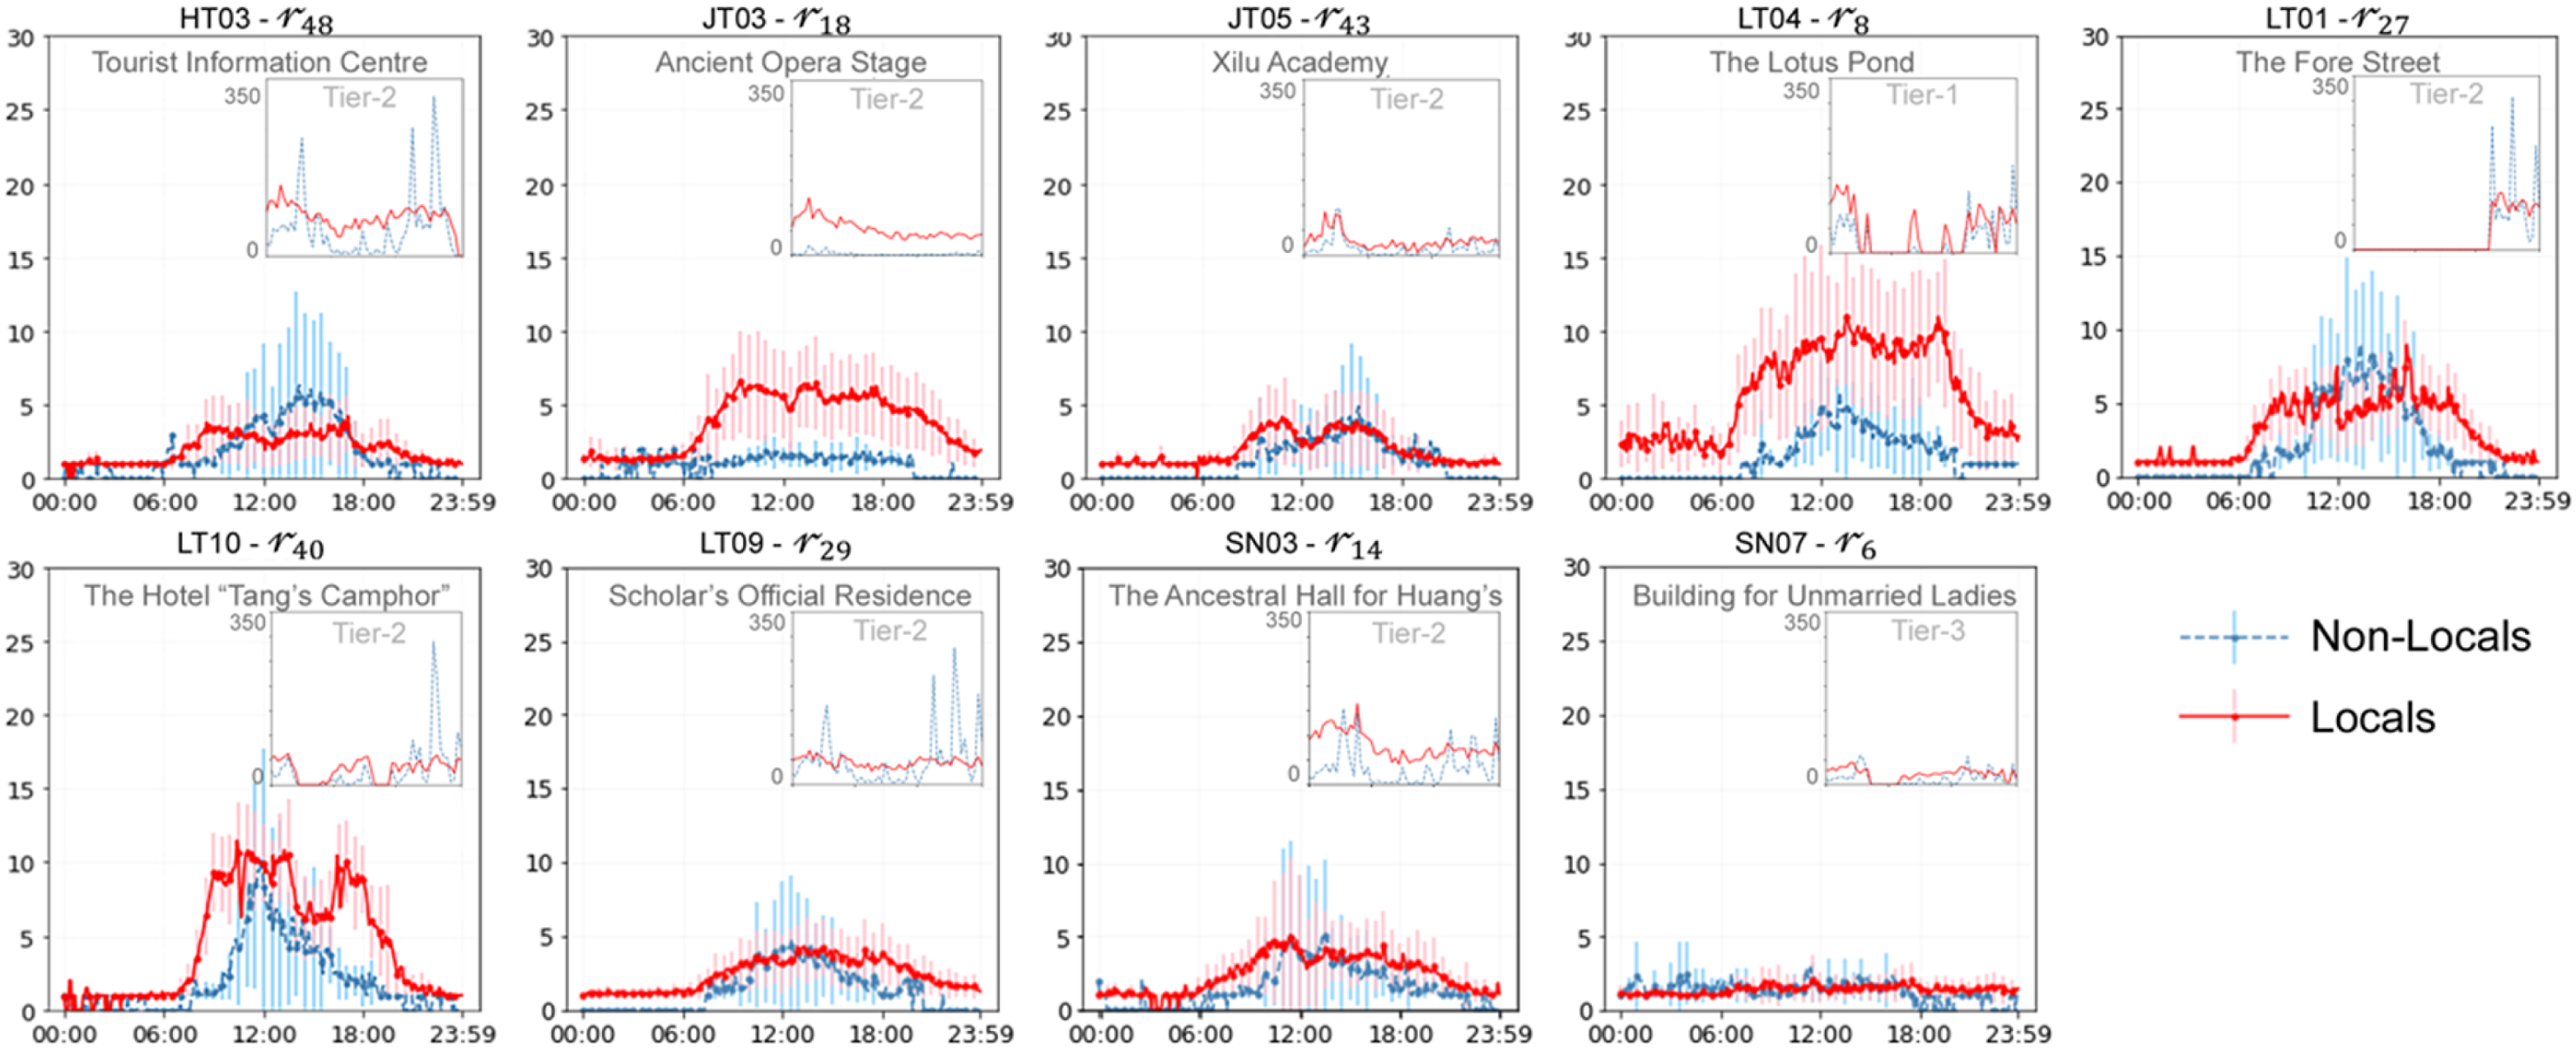
Ability to identify places of cultural significance
As the nature of three sources of information differs, ‘significant’ places have different meanings. For morphological analysis, places with higher centrality values reflect the connectivity of the spatial structure in different senses; for cognitive mapping, places mentioned more frequently by people indicate stronger cognitive associations; and for behavioural studies, places that attract more people for a longer time imply that they are more popular and actively used. However, the term ‘significant’ (not to confuse with the statistical term) used here was only a common denominator and did not intend to generalize and/or deviate from the real meanings in each context.
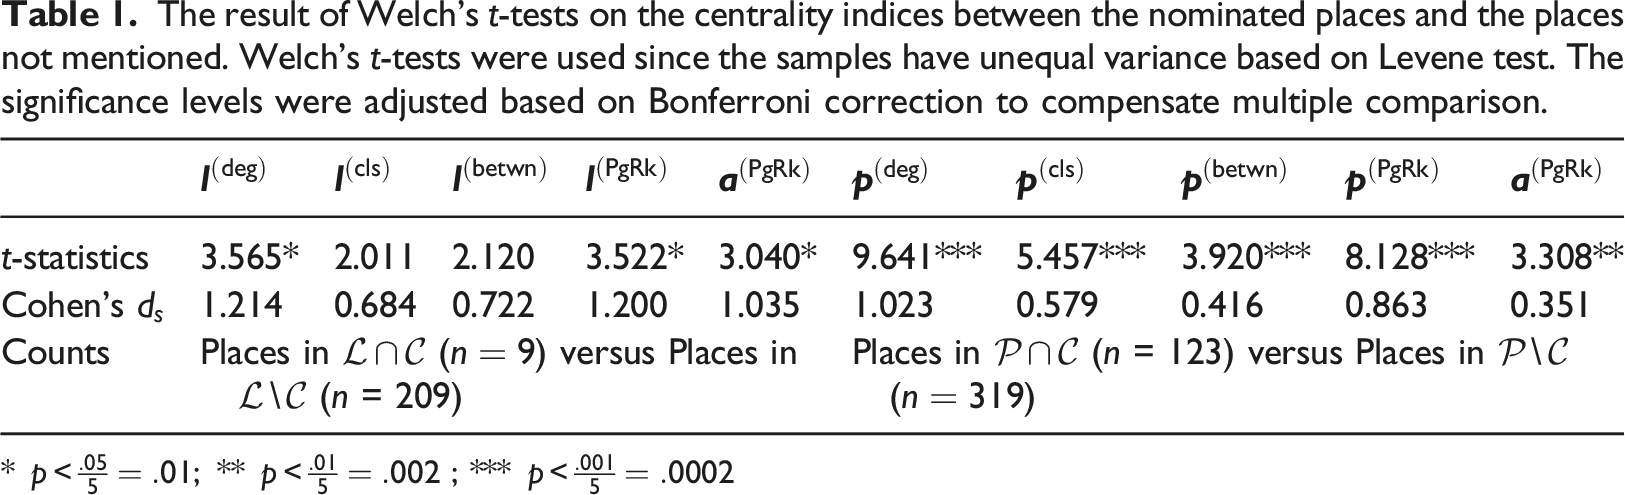
Figure 5(a)-(c) mapped some centrality indices that proved to have influence in regression models, while Figure 5(d) showed the cognitive mapping of all participants in the research. The places with higher centrality values included the main streets, squares and entrances to each village in AHVC, overlapping with the places nominated by people in the interview (the complete mapping of centrality indices in all three types of graphs could be found in Supplemental Figures S7-10). The t-tests between the nominated places and other places in Table 1 showed significant differences (with moderate or large Cohen’s The spatial centralities and cognitive mapping of AHVC. a) PageRank in the bipartite graph; b) closeness centrality in the dual point syntax; c) betweenness centrality in the dual point syntax; d) the cognitive mapping of all participants. For space syntax graphs, the size of the points, the width of the lines, and colours showed the centrality indices. For cognitive mapping, the spatial elements were plotted based on Lynch’s rules. The result of Welch’s t-tests on the centrality indices between the nominated places and the places not mentioned. Welch’s t-tests were used since the samples have unequal variance based on Levene test. The significance levels were adjusted based on Bonferroni correction to compensate multiple comparison. * 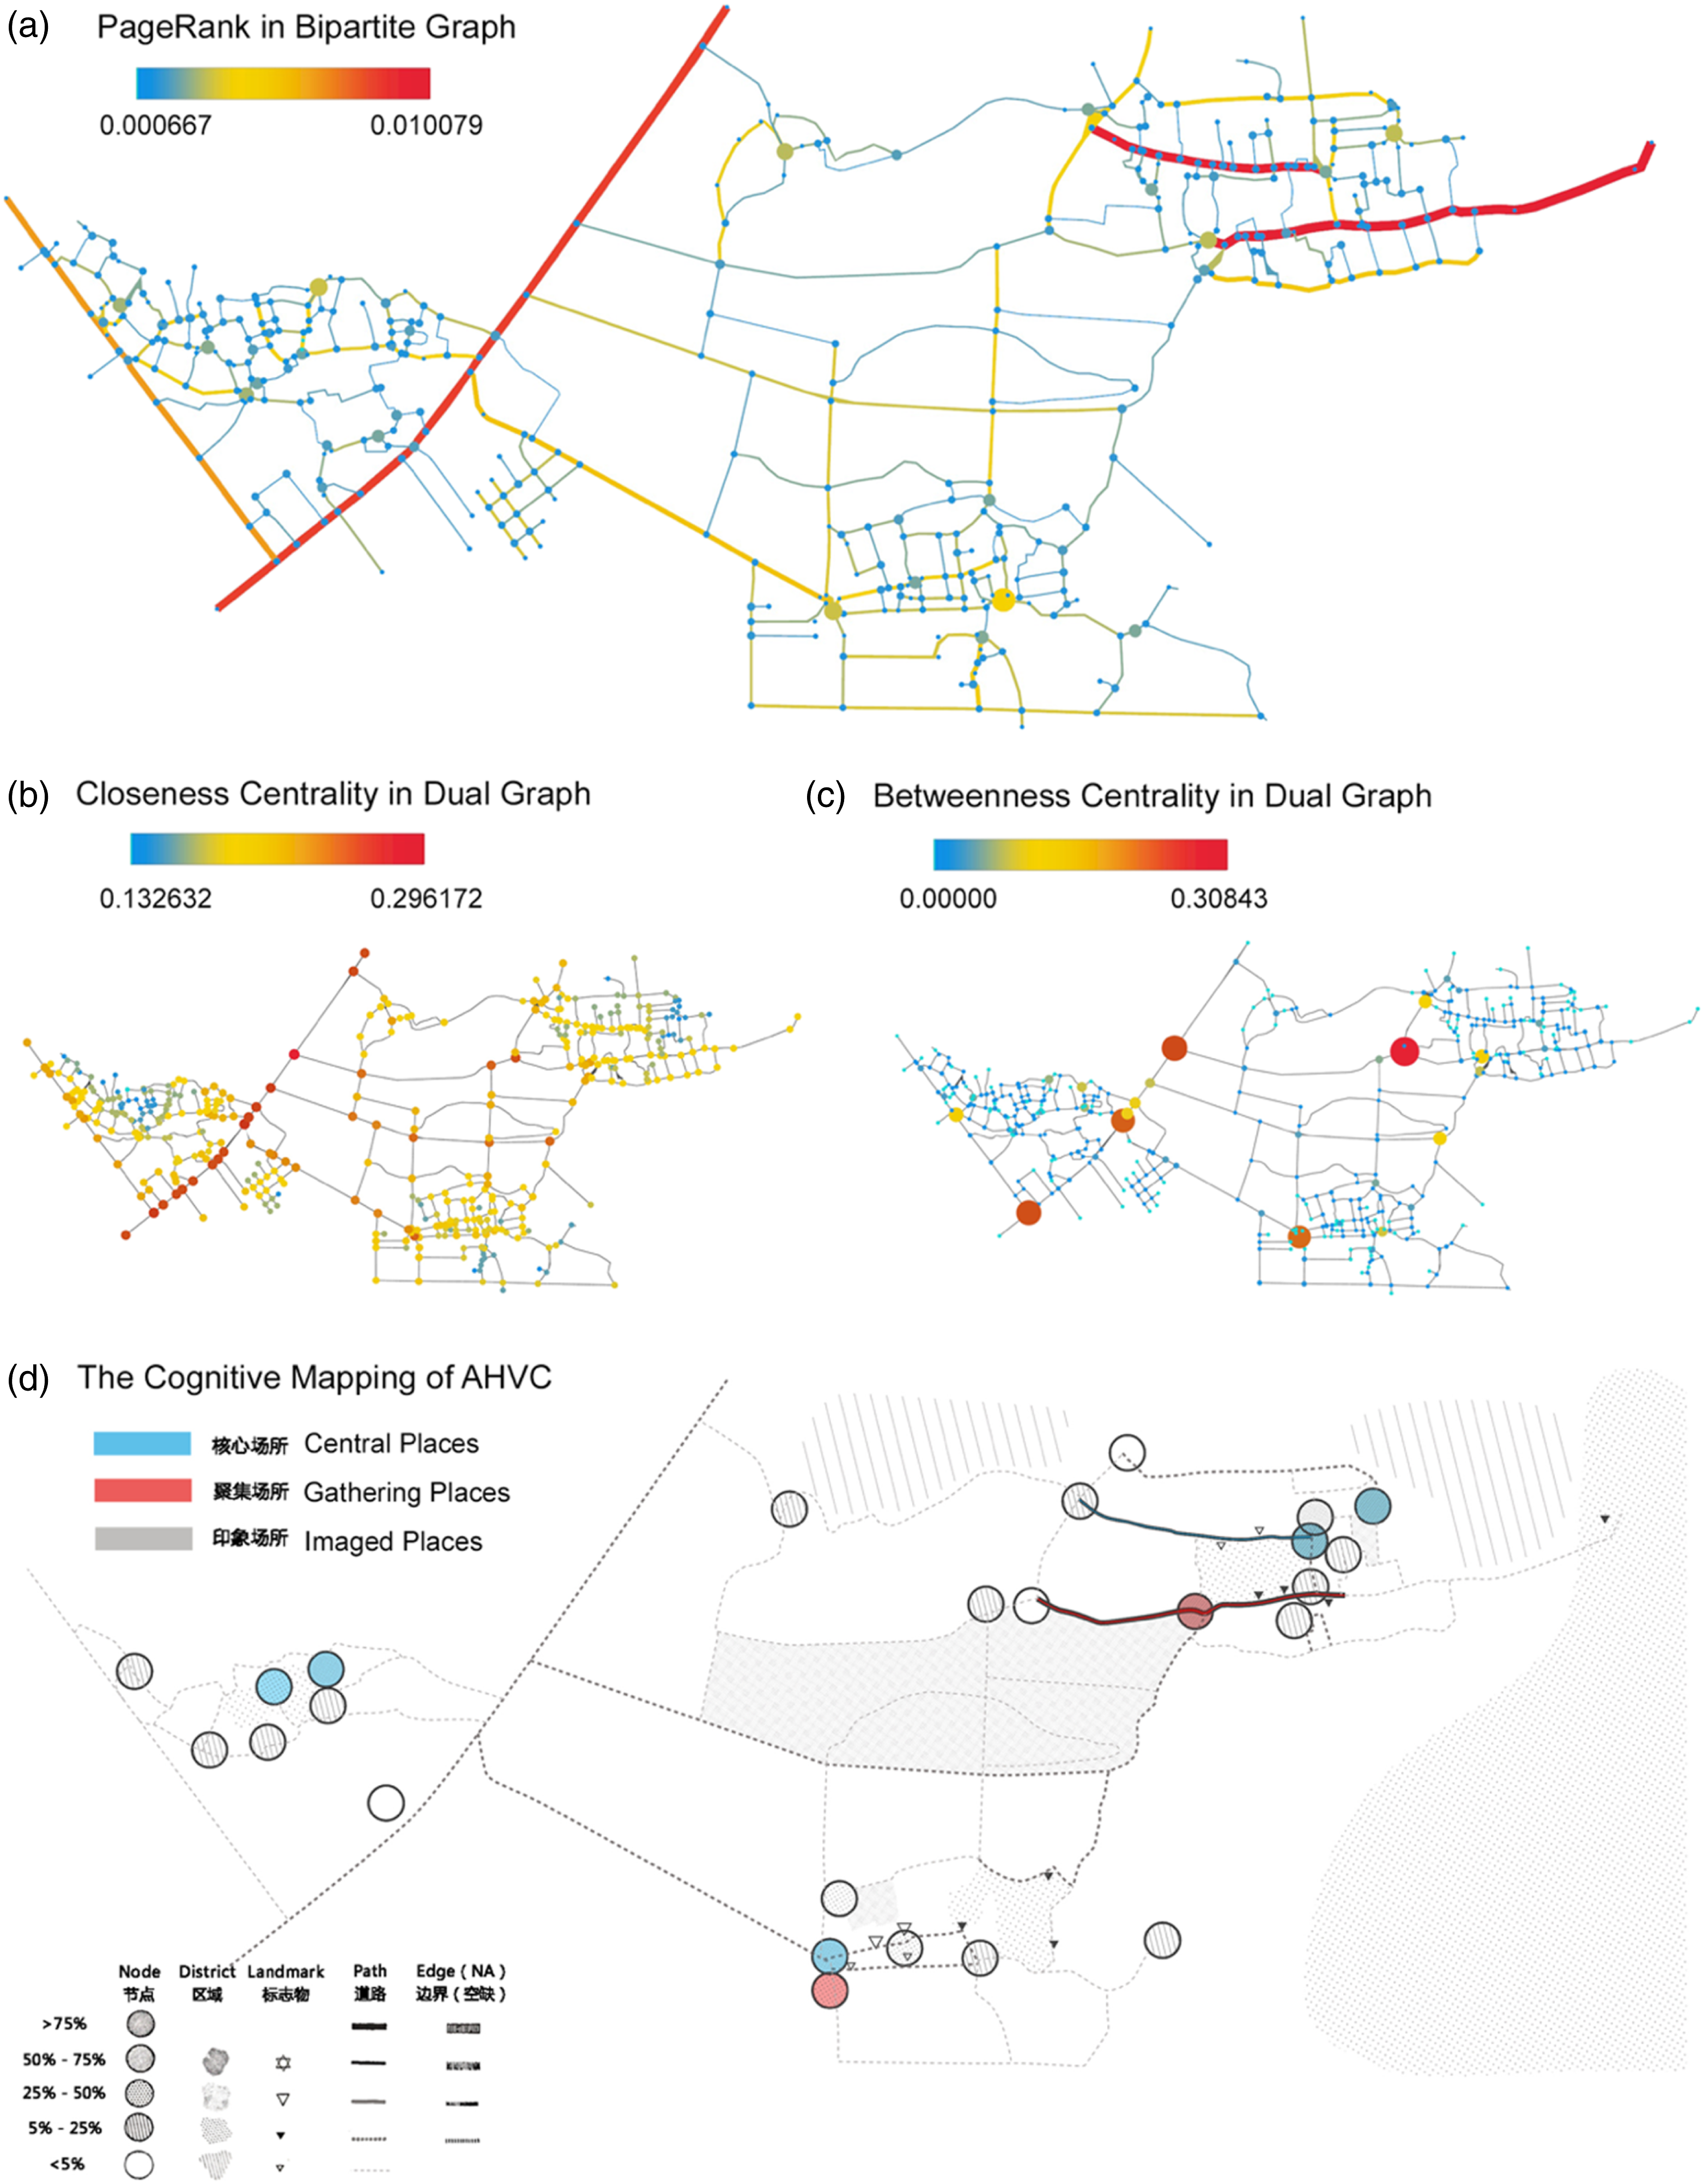
Furthermore, the average number of people captured by each AP for each time window in a typical day formed three tiers of crowdedness (see Supplemental Table S2). ANOVA with F-test showed significant difference among the tiers
Comparative analyses
The correlation analysis among the indicators showed strong associations between all three information sources, as shown in Figure 6. Intra-group correlations between variables from the same source were generally higher than inter-group ones across the sources. The correlation patterns among behavioural indicators and the other two sources supported the construction of regression models. The result of correlation analysis within key indicators from all three sources. The lower triangle showed the r-values, while the upper triangle showed the p-values. The significant correlations were highlighted.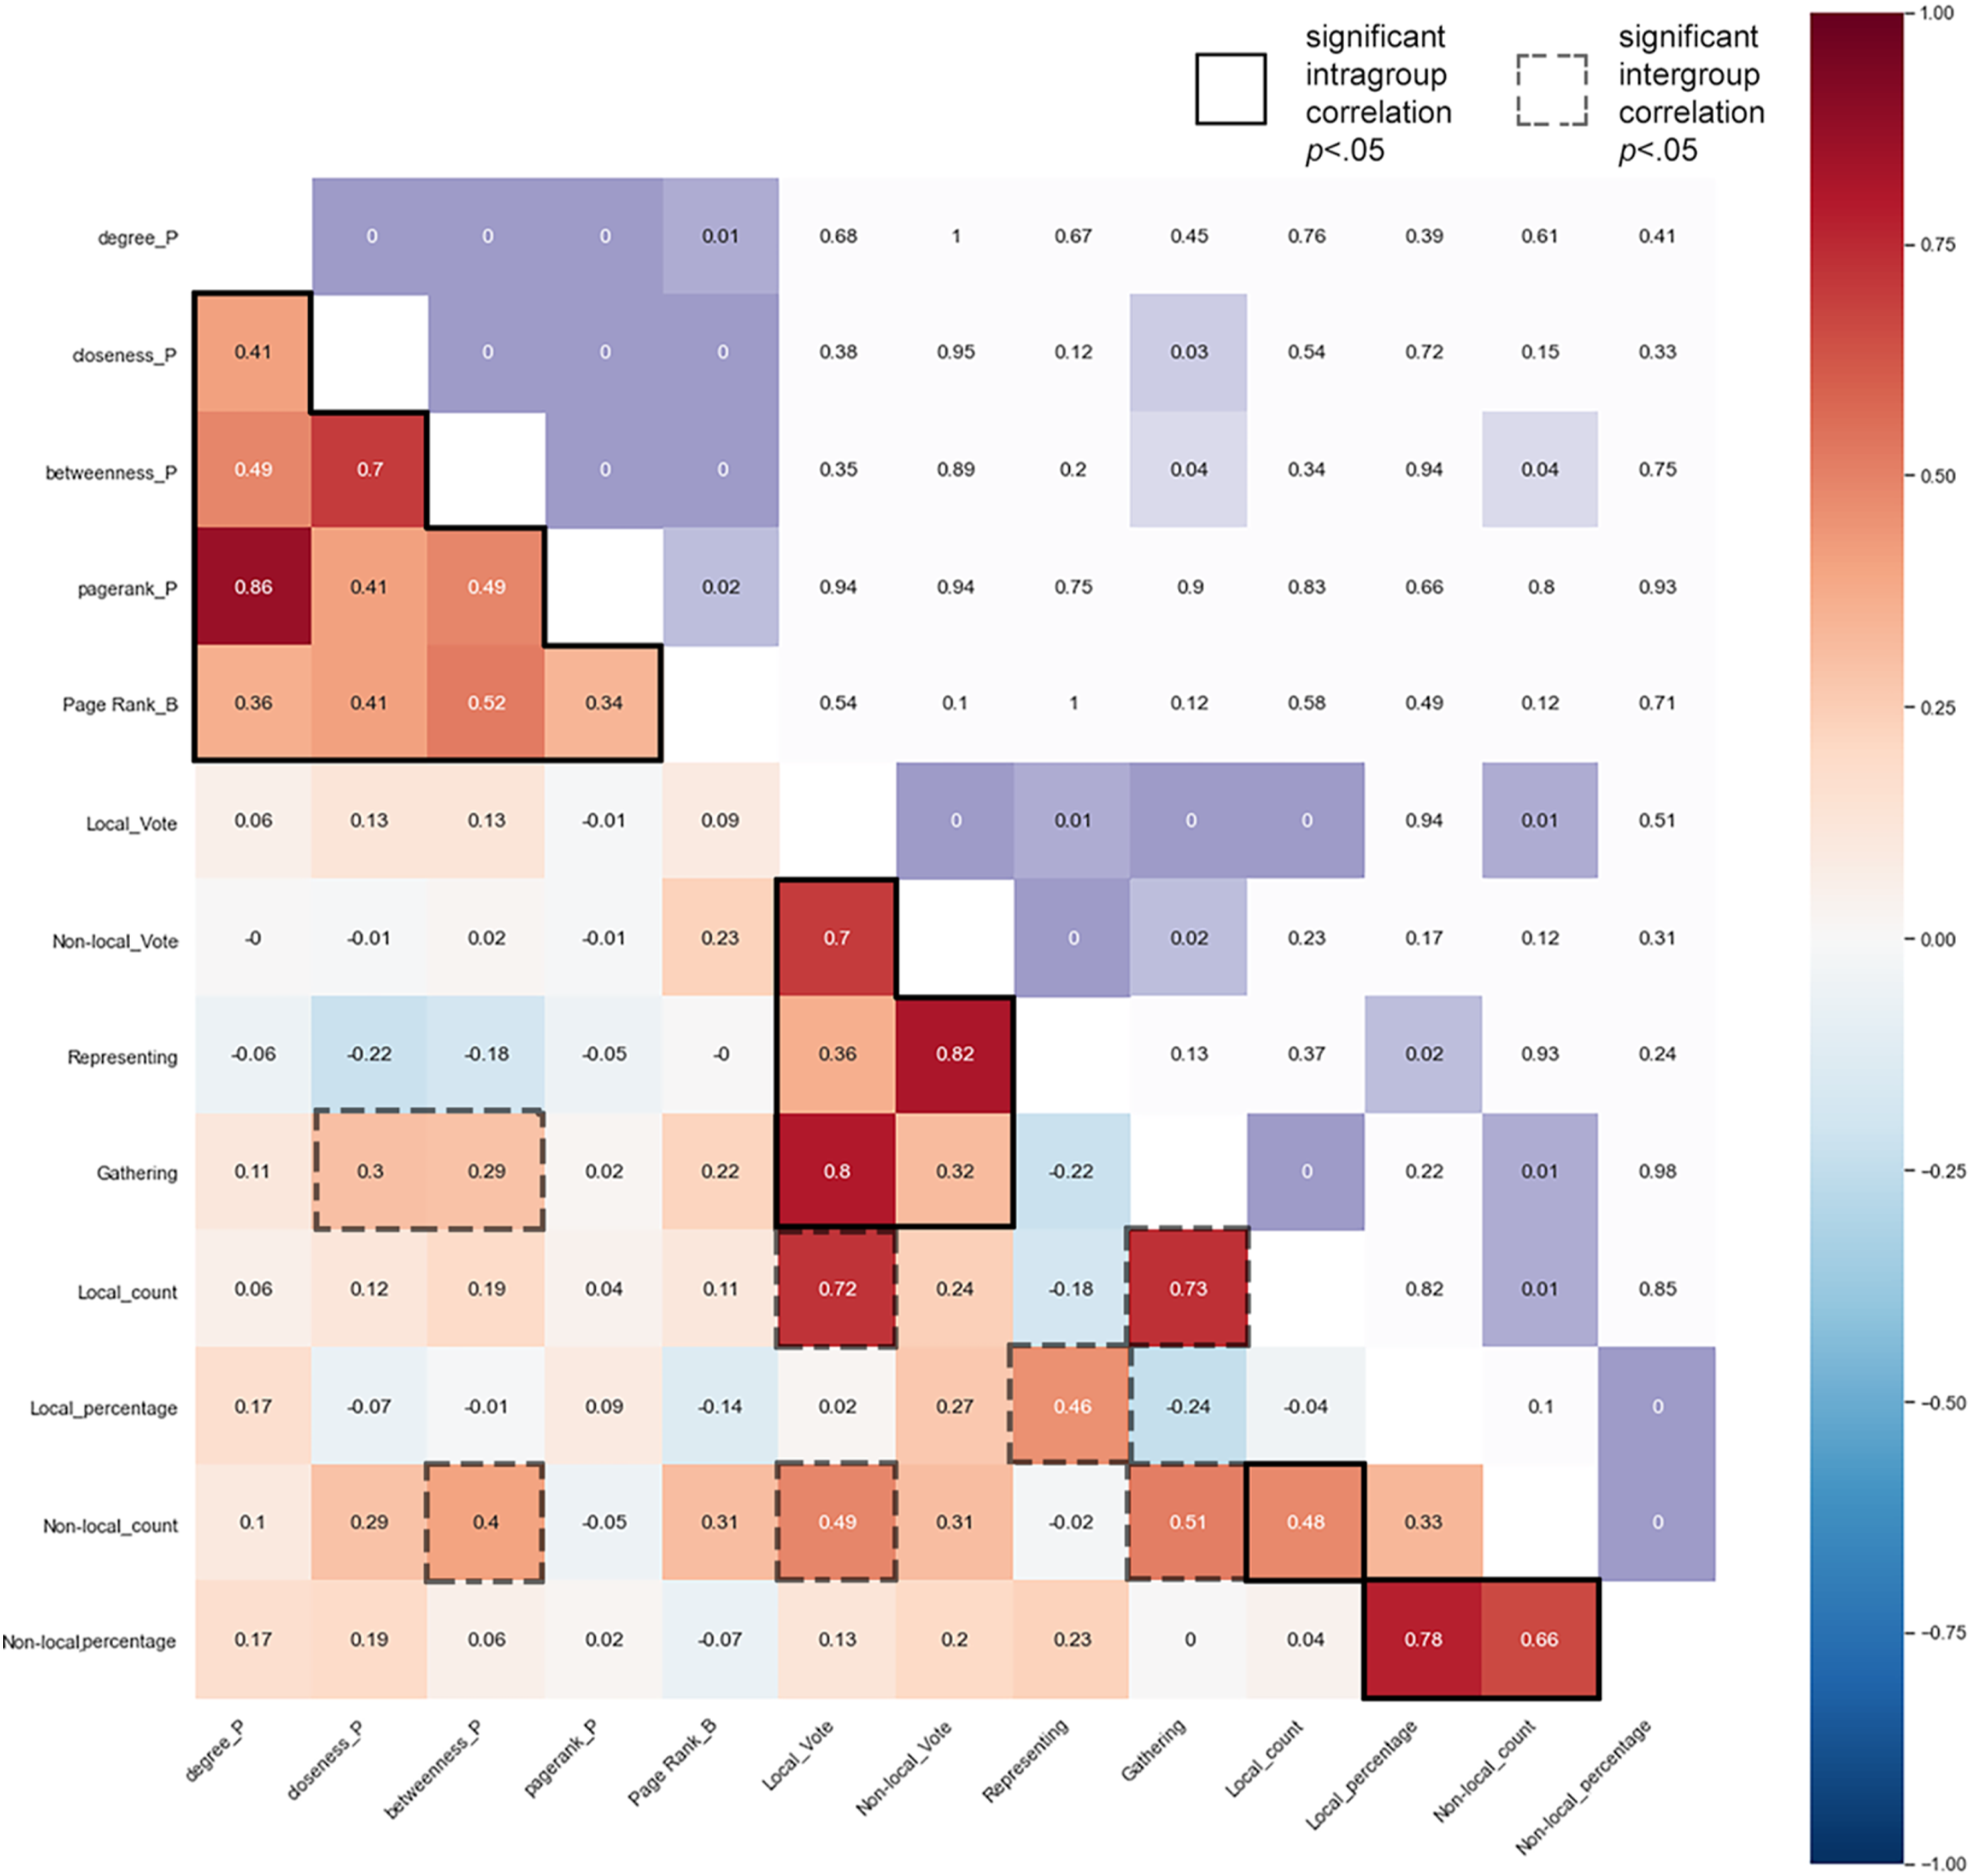
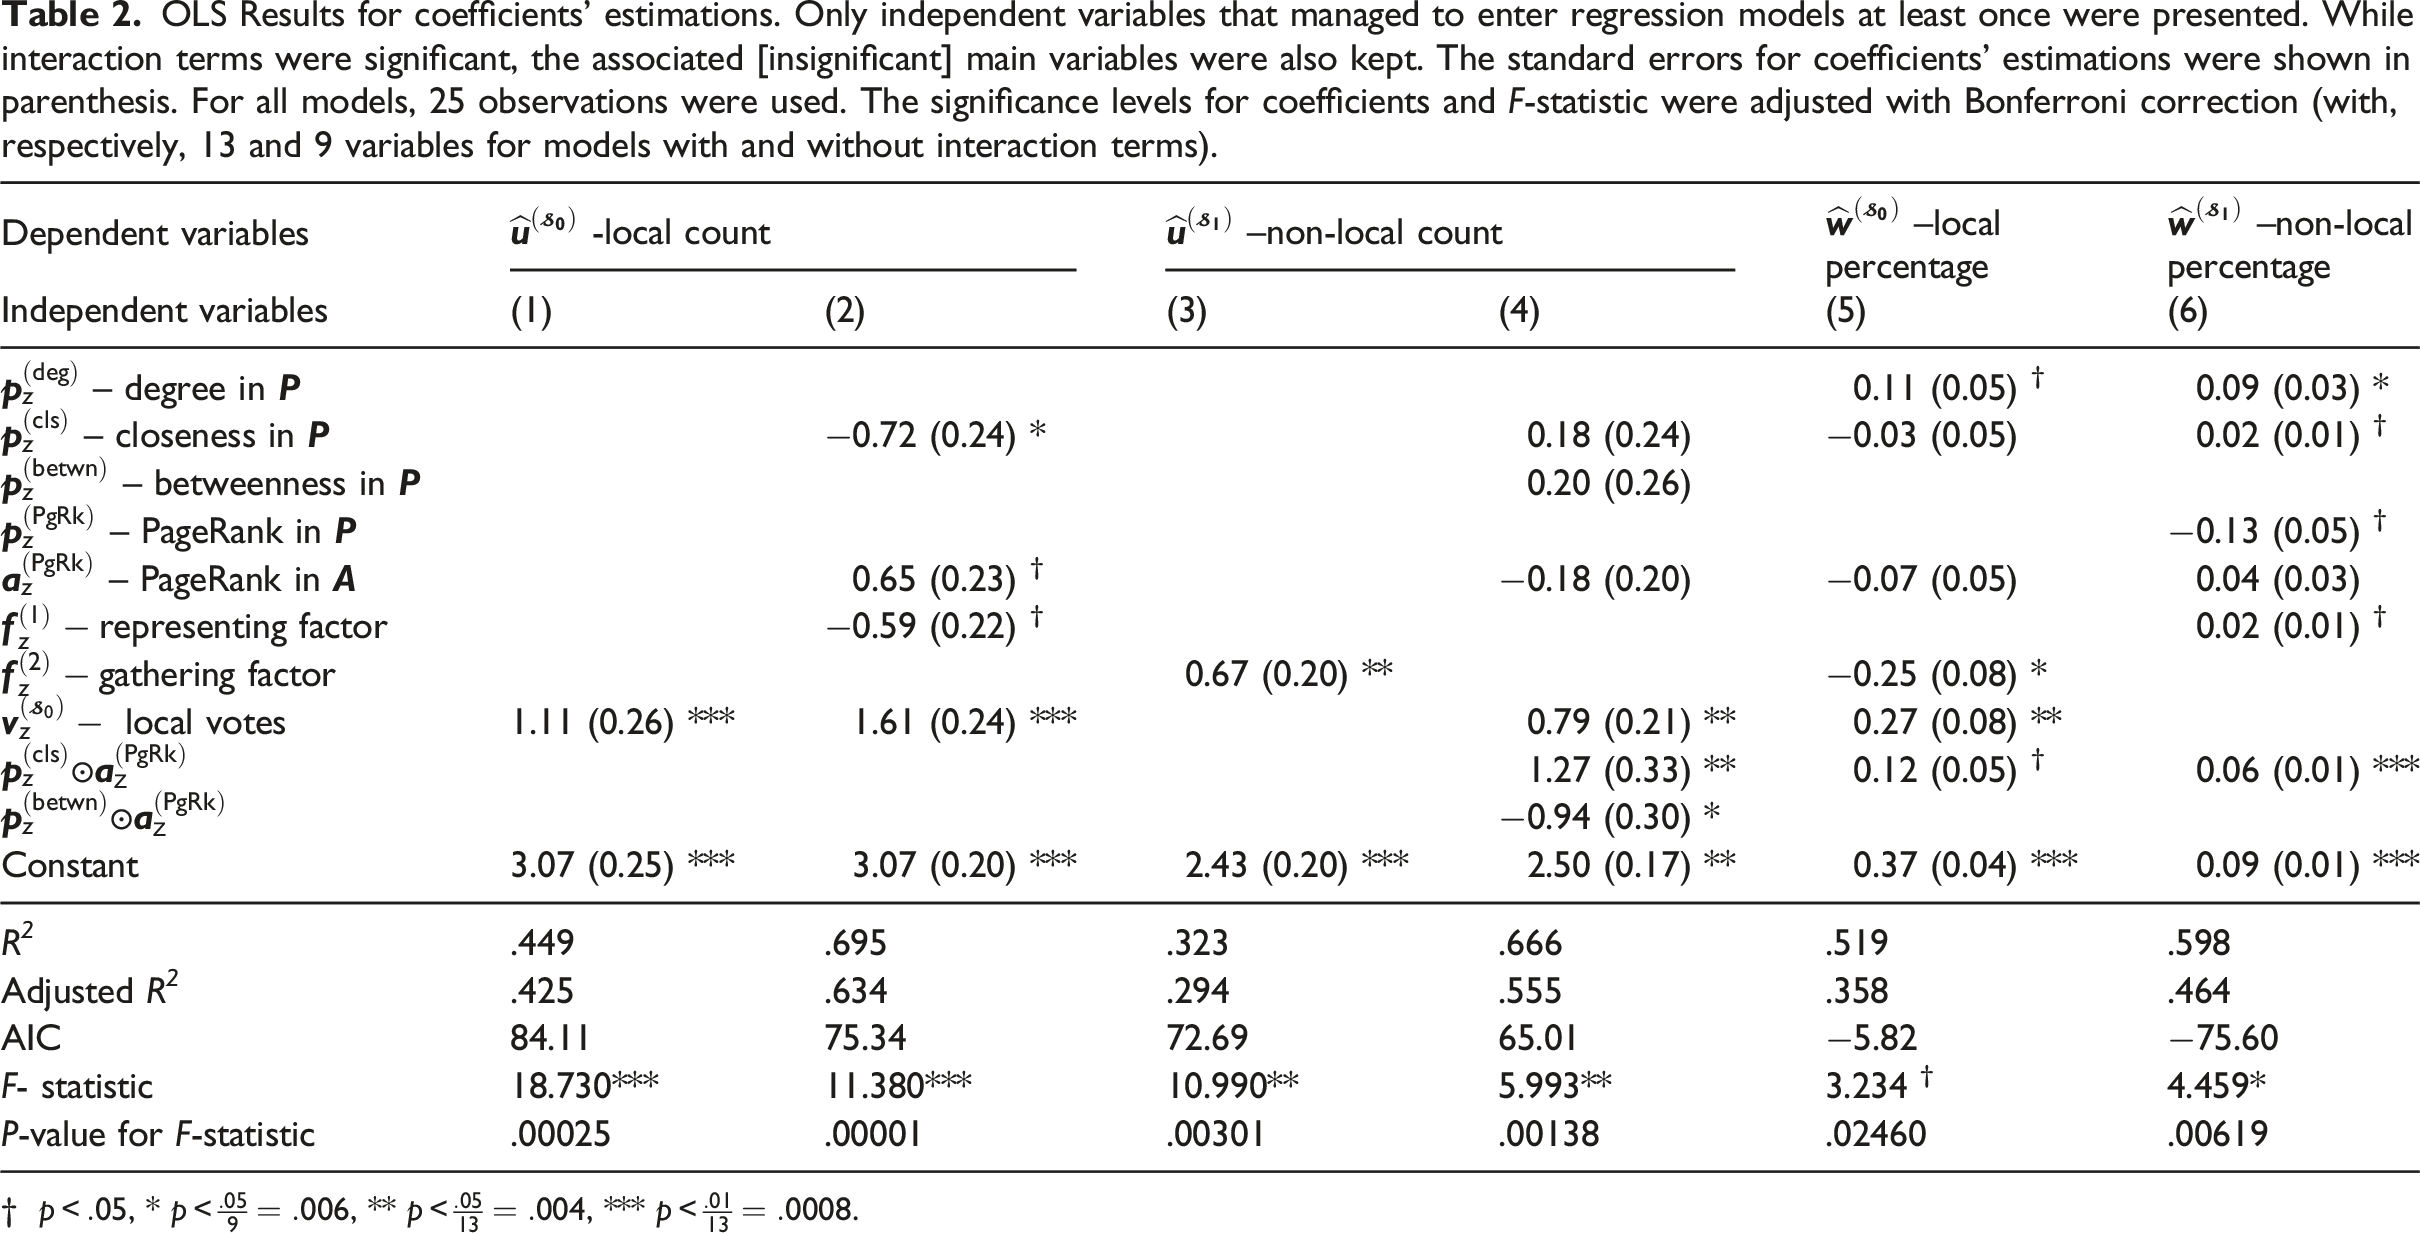
OLS Results for coefficients’ estimations. Only independent variables that managed to enter regression models at least once were presented. While interaction terms were significant, the associated [insignificant] main variables were also kept. The standard errors for coefficients’ estimations were shown in parenthesis. For all models,
†
For local counts, other than the most influential variable local votes with the highest estimated standardized coefficient
For non-local counts, however, the inclusion of interaction terms and local votes
Models (5) and (6), predicting the percentage of time windows when people were present at the spots, were both [marginally] significant based on Bonferroni-corrected F-statistic. Similar to average counts, local votes
Interestingly, the non-local votes
Since the models reached high Adjusted Residual Analysis of the regression models as scatter plots. X-axes showed 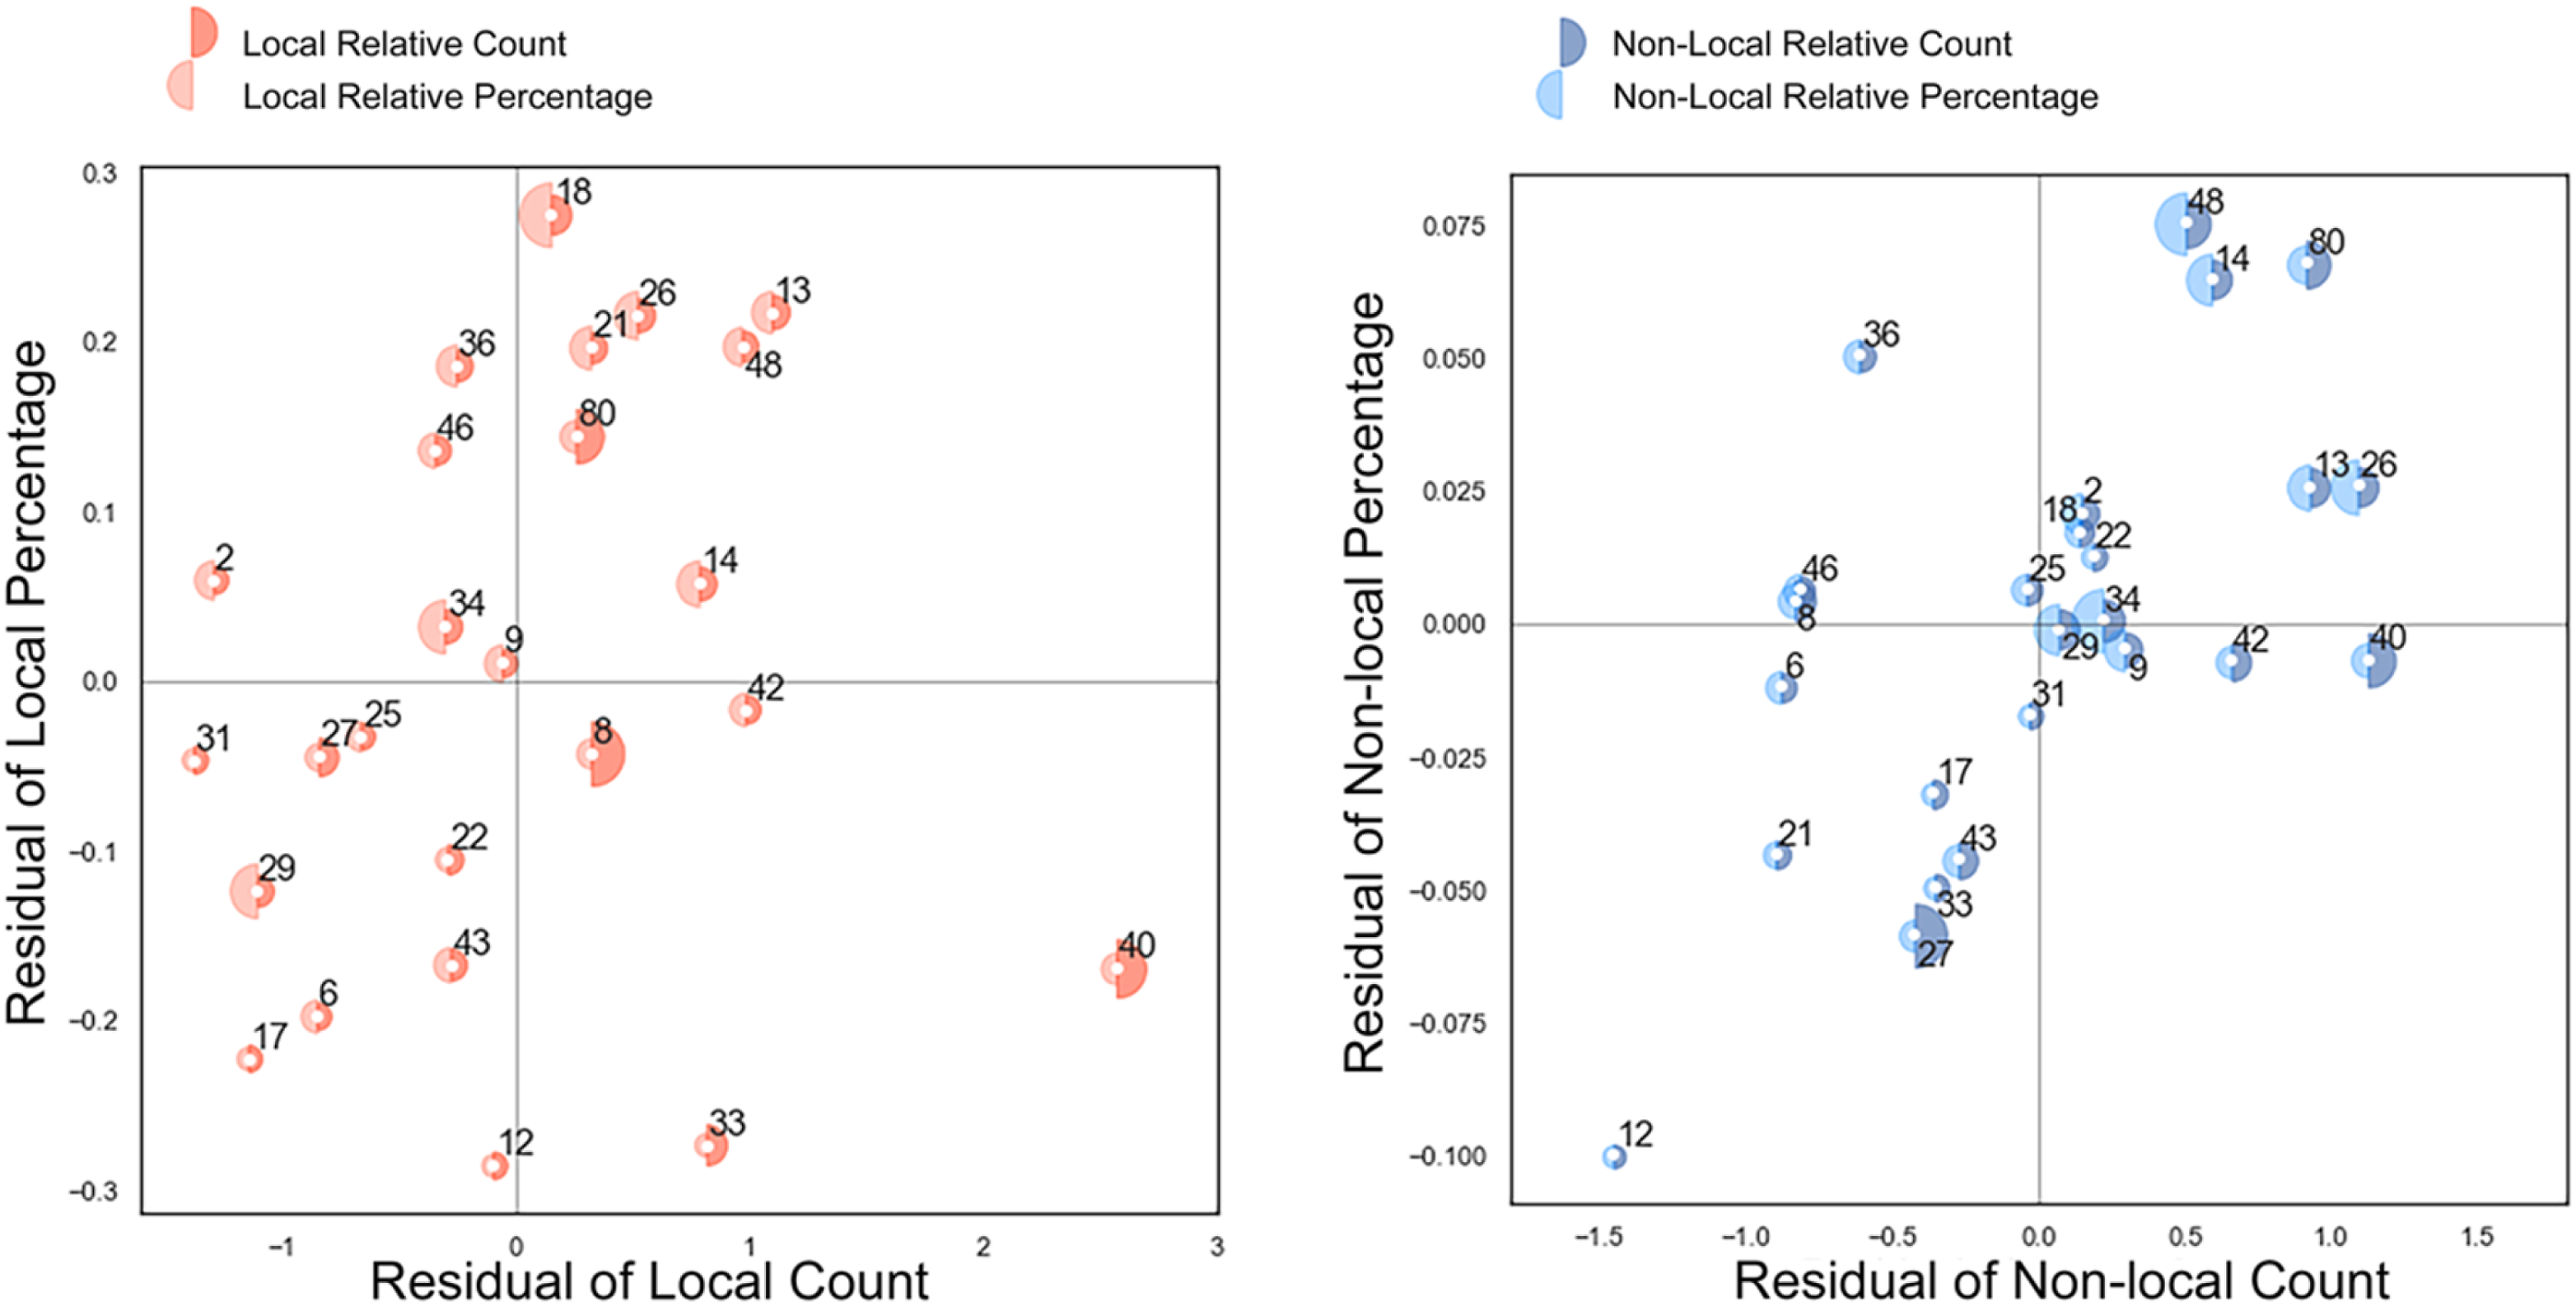
Discussions
Planning support recommendations
Following the presented methodological framework, the outcomes could be utilized in support of strategic spatial planning in similar historic villages with cultural significance: 1. The different needs of locals and non-locals should be identified, respected and balanced, especially when constant changes are on-going. During the past decades, many rural public spaces have been implanted with fancy attractions, disregarding the essential needs of local residents to use public spaces to maintain their lifestyle, for example, to chat, dance and/or play cards. A successful development plan should consider both visitors and residents, allowing for a symbiosis of stakeholders without disturbing or destroying local needs. Places that are popular tourist destinations do not necessarily attract local people, and places where locals spend most of their time do not always draw planners’ and visitors’ attention. Both types can be identified as public places with cultural significance, and should be handled with different planning strategies. This study provides empirical tools to distinguish the ‘central’ and ‘gathering’ places used and valued differently by both stakeholders, following a systematic analytical workflow that could also be applied elsewhere, possibly armoured with more effective technologies in the future. 2. Multiple sources of information focus on divergent aspects of ‘significant’ public spaces and they all ought to be recognized by planners. In this study, systematic methods have been proposed to capture three sorts of ‘significant’ public spaces: places with high centralities in different morphological configurative contexts, ‘central’ and ‘gathering’ places perceived cognitively by people, and frequently-used ‘tier-1’ places standing out in behavioural monitoring. The comparative synthesis showed that the sources are related yet divergent. This refers back to earlier philosophical discussions on the triad of ‘conceived/perceived/lived’ spaces (Lefebvre, 1991). Places such as Lotus Pond could be valued as vivid living spaces though it might not be considered as valuable in conventional heritage perspectives. The finding that cognitively imaged places also appeared at spatially central spots suggests that initial morphological analyses (especially on dual-syntax and bipartite graphs) in future studies could effectively provide sets of potentially significant spaces, to be followed by cognitive mapping and behavioural tracking for a comprehensive understanding. 3. The evaluation of behavioural occupation patterns could become a diagnosis tool for public spaces. Through occupying and using the spaces, emotional connections could be built and/or strengthened, helping locals and visitors better convey the cultural significance within the spaces, beneficial for both heritage preservation and planning development (Janssen et al., 2017). By combining and comparing the observational popularity of places with theoretical estimations, one may suggest priorities in development through investigating the detected ‘under-used/well-used places’ one by one. Rural [re]vitalization plans could use such diagnosis tools and seek for suitable strategies to help determine what to preserve, renovate and demolish in traditional villages, while the spatial structure and human perception are non-trivial to change directly in a planning process.
Towards a general theory
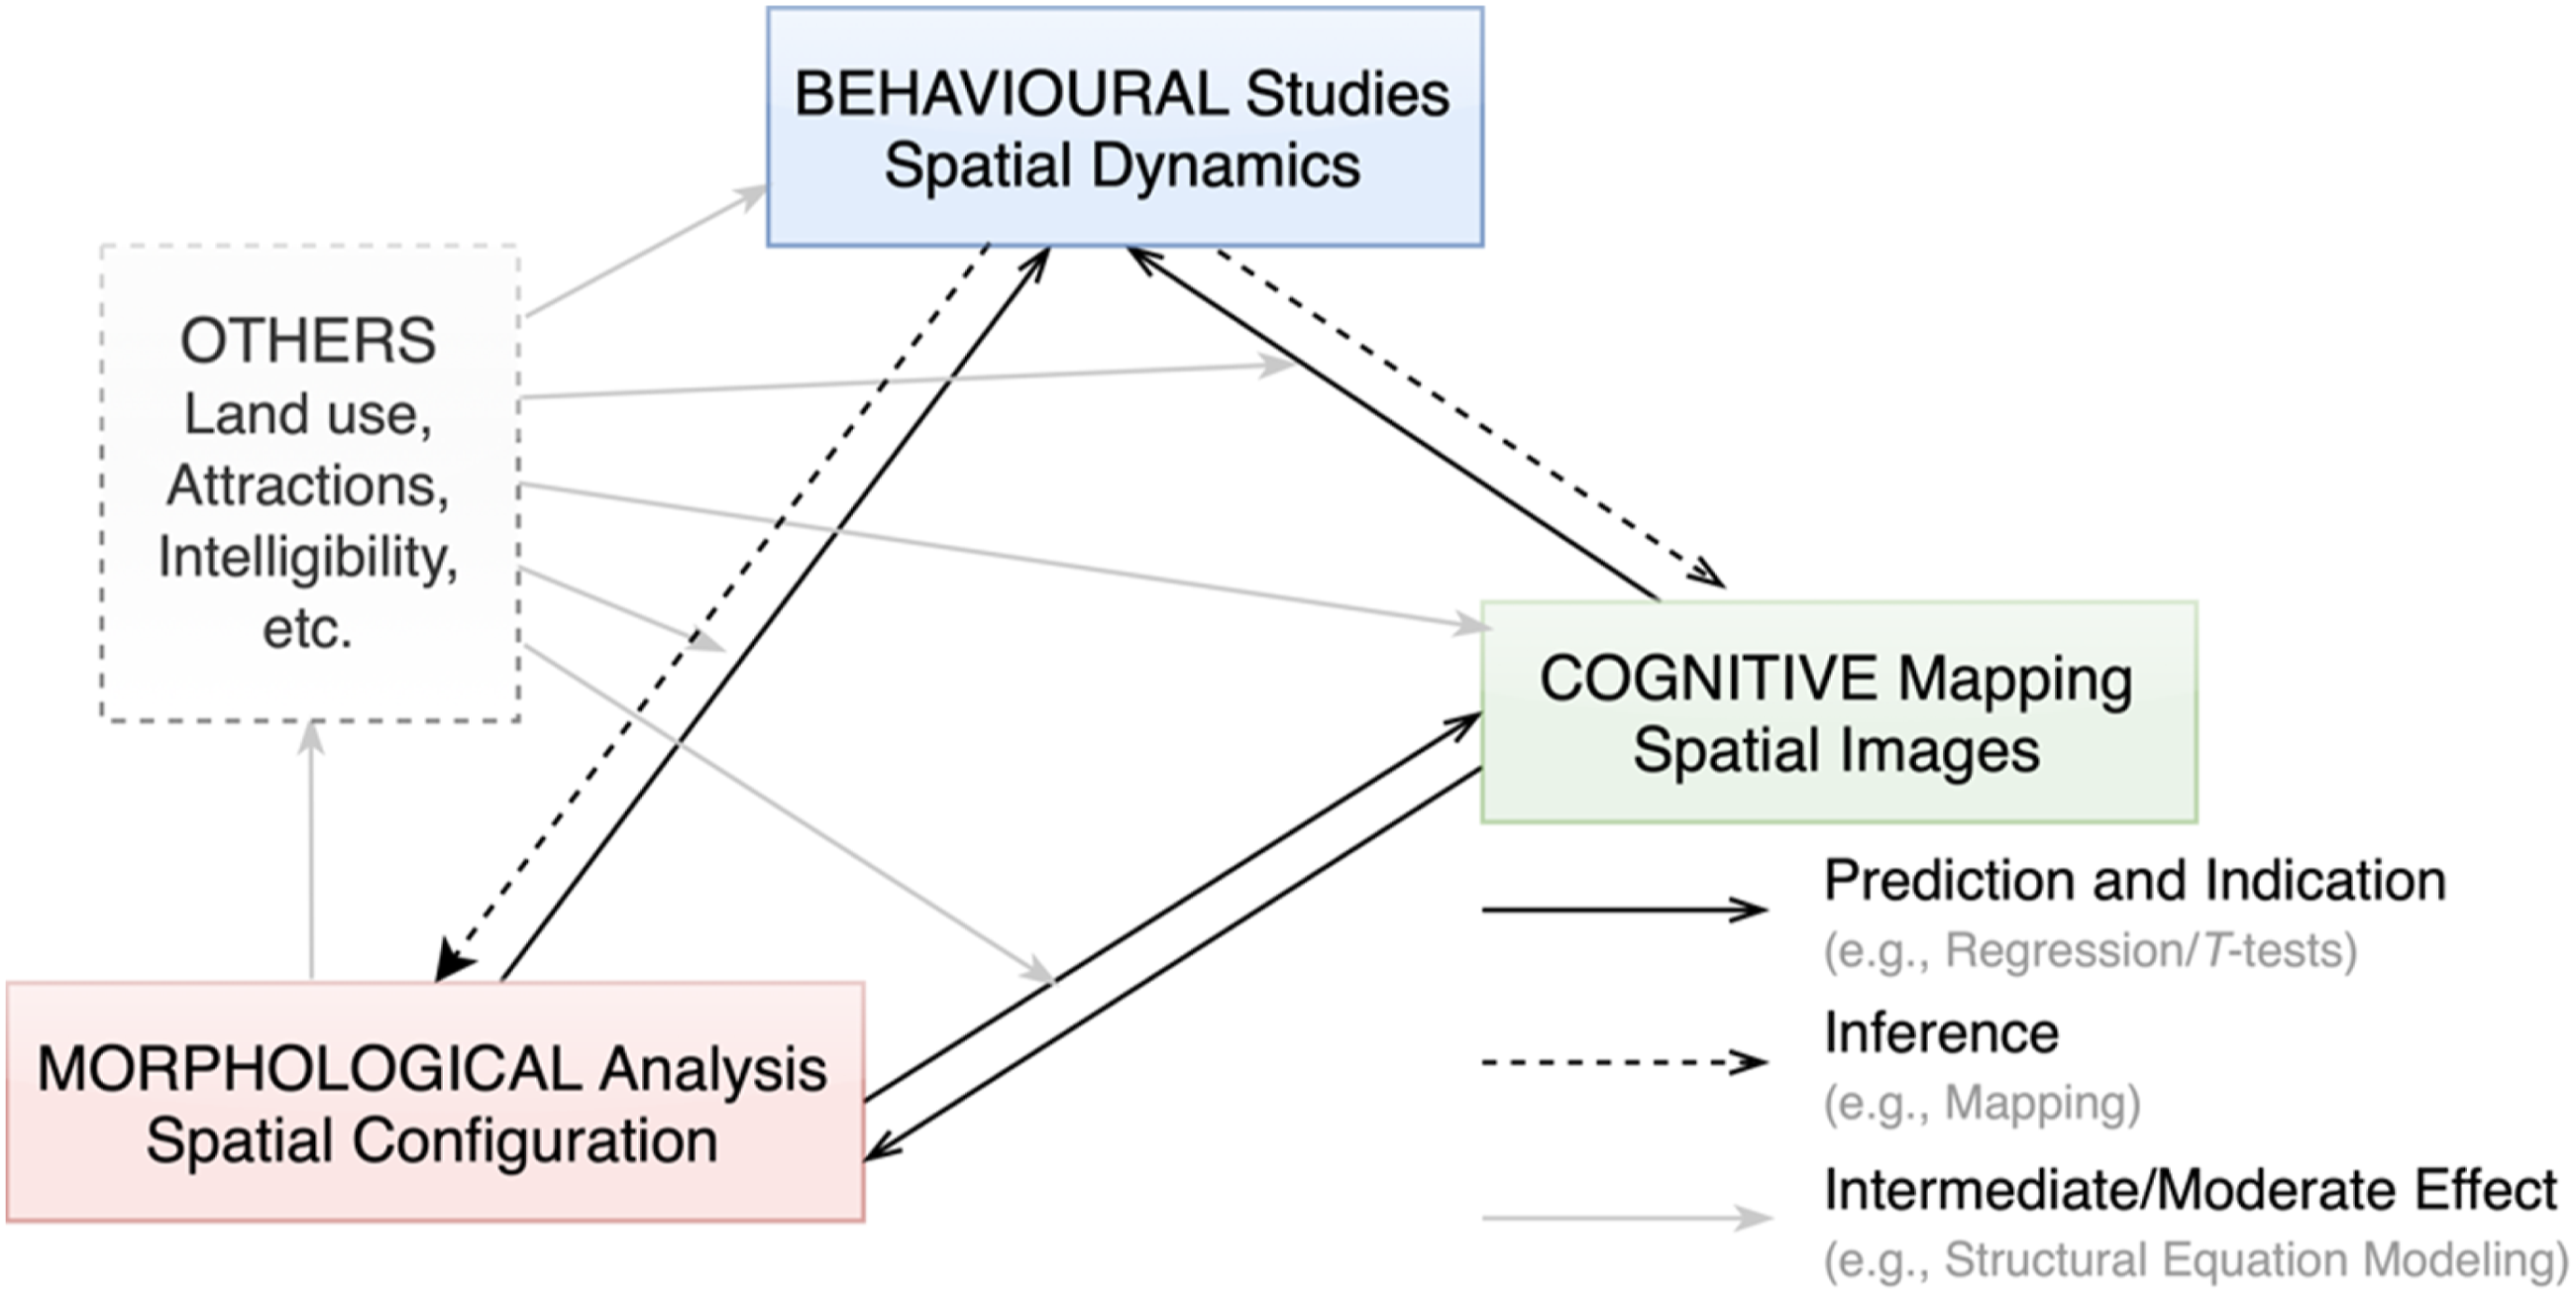
Although a totally different set of indicators (variables) were selected from the three information sources, measured in case-studies from various cultural contexts, this study confirms most conclusions from Kim (1999), especially that cognitive variables are better predictors for behaviour than spatial configuration. This is to suggest that there might exist a general theory to explain the relationship between human behavioural patterns, complex morphological structure of space and its cognitive representation, as demonstrated in Figure 8. This study mainly investigated the solid arrows in the diagram, while the remainders could also be scientifically interesting: 1. Would other factors such as demographics, attractions, land use, spatial intelligibility, etc., have intermediate and/or moderate effects on the complex interrelation (Penn, 2003)? 2. Given a behavioural pattern distribution effectively collected with digital technologies, could the underlying spatial/social structure and human preference be inferred, as a reversed process to the conventional prediction and modelling of human behaviour (Noyman et al., 2019)? The theoretical framework characterising the interrelation among morphology, cognition and behaviour. The diagram is adapted and updated from Kim (1999).
To approach a general theory, more cases are needed following the methodological framework proposed by this pilot study, probably using different time periods and economic status as control variables.
Limitation and future steps
Although we meant to be neutral without preconception during the research, especially during the interview, biases to value certain typology could have been introduced unintentionally. However, the accordance of the chronologically first-conducted interview with other analyses added reliability to the proposed methodology. The models presented might suffer from over-fitting to the collected dataset, while the sensitivity check in Supplemental Table S8 suggests that they are relatively robust. With more cases, machine learning techniques such as cross-validation, Lasso-regression and Elastic-Net could be applied to perform variable selection while avoiding over-fitting, providing more concrete proofs on the generalizability of the models. Furthermore, specific techniques have to be adopted if a concrete causality inference is desired in future studies, in order to suggest changes in planning actions.
Moreover, the following aspects can be improved: (1) network centrality indices adjusted by other distance measures may contribute to a more precise evaluation of spatial morphology; (2) a wider range of stakeholders could be involved; (3) Wi-Fi devices could be supplemented with other spatiotemporal data collected by GPS and/or wearable devices; (4) horizontal and vertical comparative studies for rural [re]vitalization projects would help monitor and assess the changing dynamics and (5) time series as dynamic panel data instead of aggregated values could be used to characterize the behavioural observations in higher resolution, benefitting more from the collected big data.
Conclusion
This study proposed new methods for processing three sources of information to draw a comprehensive picture of the rural public spaces with cultural significance in Anyi Historic Village Cluster (AHVC), suggesting that the spaces are valued and used differently for various stakeholders. The three approaches – morphology, cognition and behaviour – proposed and jointly evaluated were strongly interrelated and provided useful information for spatial planning, consistent with the rich urban study cases in the literature. The complex relationship of the spatial structure, the valuation and usage of spaces in AHVC was characterized with regression models, providing tools to identify places to prioritize in planning through comparing estimation and observation. This could only be achieved by integrating all three sources of information, such as the methodological framework proposed here.
Rural [re]vitalization is ongoing in China, continuously changing the space quality in villages. This study provides planners with a methodological framework to systematically investigate important rural public spaces, both as perceived and used places that need to prioritize in planning. This approach can assist planners to make more comprehensive village development plans, while respecting the local needs and rural identities.
Supplemental Material
sj-pdf-1-epb-10.1177_23998083211064290 - Supplemental material for Investigating rural public spaces with cultural significance using morphological, cognitive and behavioural data
Supplemental material, sj-pdf-1-epb-10.1177_23998083211064290 for Investigating rural public spaces with cultural significance using morphological, cognitive and behavioural data by Nan Bai, Pirouz Nourian, Ana Pereira Roders, Raoul Bunschoten, Weixin Huang and Lu Wang in EPB: Urban Analytics and City Science
Footnotes
Acknowledgements
Declaration of conflicting interests
The author(s) declared no potential conflicts of interest with respect to the research, authorship, and/or publication of this article.
Funding
The author(s) disclosed receipt of the following financial support for the research, authorship and/or publication of this article: This work was supported by National Key Research and Development Program of China (NO. 2018YFD1100303) Digital Simulation and Evaluation Model for Reconstruction of Town and Village Settlements Space.
Author’s Note
The advice about statistical methods and reporting from Professor Pei Sun, the Department of Psychology, Tsinghua University, the language support from Sören Johnson, Centre for Languages and Academic Skills, TU Delft, and the help on the initial data processing algorithm for Wi-Fi positioning data from Yuming Lin and Yu Zhang, Tsinghua University, are gratefully appreciated. The field work in AHVC could not be conducted without the support from Yihui Zheng, the local management team from Anyi, and Rural Vitalization Station of Tsinghua University. This paper is based on Nan Bai’s master thesis in Chinese at Tsinghua University, Beijing, China, and Technische Universität Berlin, Berlin, Germany. A preliminary version of the cognitive mapping sub-section was presented (unpublished) at the Leiden-Delft-Erasmus (LDE) joint Conference “Heritage and the Sustainable Development Goals”, November 26-28, 2019, Delft, the Netherlands.
Supplemental Material
Supplemental material for this article is available online.
References
Supplementary Material
Please find the following supplemental material available below.
For Open Access articles published under a Creative Commons License, all supplemental material carries the same license as the article it is associated with.
For non-Open Access articles published, all supplemental material carries a non-exclusive license, and permission requests for re-use of supplemental material or any part of supplemental material shall be sent directly to the copyright owner as specified in the copyright notice associated with the article.