
Abstract
This study examines regional differences in local environment factors to better understand the sustainability of local governments indexed by per capita public spending. Under the condition of heterogeneous population size, we examine how factor characteristics differ depending on the spatial context represented by the urban area category. By employing a Cobb–Douglas cost function with congestion effects on public service provision, the estimated factors enable us to articulate major factors and differences in cost-efficiency between urban area categories. We found that statistical significance and even the signatures of local environment factors differ depending on the urban employment area category. Regarding factors such as the ratios of employees in secondary and tertiary industries, these did not tend to be statistically significant in small-sized urban areas, while small-sized cities in large-sized urban areas were likely to gain confidence intervals. Moreover, we did not observe any statistical significance for the ratio of elderly people due to the balance of spending between national and local governments. These findings could contribute to sustainable management of cities in the advent of population decline.
Introduction
Population decline is emerging as an increasing attention among developed countries, and cities in affected countries face subsidiary effects, such as increasing per capita public spending and falling real estate prices (Martinez-Fernandez et al., 2012; Rieniets, 2009). In Japan, population decline began in 2008, and by 2055, the population is expected to be reduced by approximately 36 million (28.7%) compared to that in 2019 (NIPSSR, 2019). Although some cities, such as several in the Tokyo metropolitan area, continue to experience population increases, most cities are facing the prospect of serious population decline (Wirth et al., 2016). For instance, among 1405 municipalities whose population is below 100,000, 95.4% will experience population decline over the next two decades. One extreme case is the city of Yubari, which already experienced more than 90% population decline from its peak. Consequently, the city had to declare bankruptcy due to lost tax revenue and weak governance (Seaton, 2010). It follows that cities must sustainably manage local public services to deal with challenging fiscal conditions.
One of the main impacts of population decline is deterioration in the quality of public services (Deng and Zhang, 2020). Since local municipalities need to maintain the quality of public services, per capita public spending is likely to be higher for areas where the density of the residents decreases, resulting in further fiscal constraints (McCann, 2017). Although a dense population can facilitate efficient public service provision through economies of scale (Gyimah-Brempong, 1987), an excess density of inhabitants can lead to inadequate public service provision and an increase in public expenses; these are called congestion effects (Edwards, 1990). In other words, per capita public spending indicates the efficiency of public service provision. It follows then, that examining local environments (with a range of population sizes) as determinants of cost-efficiency would be the key to measuring local public sustainability.
The relationship between population size and the local environment has long been discussed (Albouy and Stuart, 2014; Clark et al., 1988, 2002), and comparative studies of different population settings have produced meaningful findings on how population size and changes can impact local environments across nations (Haase et al., 2012; Rink et al., 2012). However, studies have tended to overlook spatial contexts in cities (Großmann et al., 2013). For example, spatial heterogeneity can internalise spatial effects, such as economies of agglomeration and the spillover effect (Feldman, 1999). While the contextual framework does not explain all phenomena, it can help identify the causes of, impacts on and responses to changing local environments (Haase et al., 2014). Thus, we need to enlarge target areas when analysing local environmental factors across cities, in contrast to previous studies focusing on factors in a single study area. Regarding the spatial context of cities, one useful idea is urban area categories, such as core-based statistical areas (CBSA) in the United States, urban employment areas (UEAs) in Japan and functional urban areas in European countries. The urban area category delineates the spatial heterogeneity of cities, and it assumes that local environments are different (Baba and Asami, 2017).
This study examines regional differences of local environment factors to understand the sustainability of local governments indexed by per capita public spending. Our primary research question focuses on whether per capita spending is significantly correlated with local environment factors under the condition of heterogeneous population size. Particularly, we explore how factor characteristics differ depending on the spatial context represented by an urban area category, allowing us to consider which local environment factors influence local public sustainability. By employing a Cobb–Douglas cost function with congestion effects on public service provision, the estimated factors enable us to articulate major factors and differences of cost-efficiency between urban area categories.
The organisation of this paper is as follows. A literature review is described in the next section, focusing on the relationship of cost-efficiency, local environment factors and population size with factors of sustainable local governments in Japan. Section ‘Methods and data’ specifies the cost function considering population size and explains the selected data. Section ‘Results’ interprets the statistical significance of factors from the viewpoint of urban area categories. The last section presents a discussion and conclusions.
Literature review and research hypotheses
Cost-efficiency, local environments and population size
The cost-efficiency of local public services is recognised as extremely important (Hood, 1991, 1995); extant literature identifies the relationship between cost-efficiency and cities’ characteristics (Da Cruz and Marques, 2014; Fonchamnyo and Sama, 2016; Hirsch, 1959). Regarding characteristics of cities, seminal articles have focused on population size and its relation to minimising per capita public spending in areas such as fire protection (Duncombe and Yinger, 1993), education (Fox, 1981) and local administration (Cobban, 2019). Since public goods provided by municipalities do not always satisfy non-excludability, studies such as Brueckner (1981) have applied both economies of scale and congestion effects in analyses of a wide variety of public services to avoid biased results. Thus, we must carefully specify the cost function, including effects associated with population size.
Excluding cost-efficiency, studies have explored the endogenous relationship between population size and local environment to determine drivers of both population growth and decline (Bettencourt and West, 2010; Bettencourt et al., 2007; Heider, 2019). According to several urban theories, large-sized cities tend to offer better job opportunities, higher-quality amenities and more skilled workers compared to small-sized cities (Buck et al., 2005; Clark et al., 1988). In addition, Albouy and Stuart (2014) analytically argued that local environments related to quality of life are more important than working environments in terms of residential preference, revealing how local environments can affect municipal population shifts. These previous studies have indicated that cities’ local environment factors are tightly connected to population size and even to population change (Clark et al., 2002).
Moreover, previous research has discovered that the quality of local environment factors is affected by a larger spatial continuum beyond the municipality, such as the entire urban area (Albouy, 2008, 2016; Glaeser et al., 2001; Wolff et al., 2018). Simple evidence by Glaeser et al. (2001) suggested that a metropolitan statistical area with more amenities attracts more residents than one with fewer amenities. Wolff et al. (2018) argued that the larger the urban areas, the more they benefit from population influx due to the existing capacity of their residential areas. Meanwhile, smaller urban areas must develop their hinterlands, highlighting the difference between large and small urban areas. When cities with similar population sizes are compared with other urban areas, local environments such as those affecting commuting patterns (Aguilera and Mignot, 2004), vacant housing rates (Baba and Asami, 2017) and environmental sustainability (Tao et al., 2019) are completely different. This indicates that factors of cost-efficiency are dependent on urban areas.
Factors of sustainable local governments associated with population decline
Japan is typical of countries facing population decline due to low fertility rates and an ageing population (Hattori et al., 2017). Scholars have been discussing problems related to population decline within the framework of urban shrinkage since the beginning of the 21st century (Bontje, 2004; Hollander et al., 2009; Schilling and Logan, 2008). A book edited by Oswalt (2006) describes ‘urban shrinkage’ as an ‘end of era’ phenomenon. In 2004, the Shrinking Cities International Research Network was founded, and researchers began discussing and comparing experiences; their case studies illuminated many features of shrinking cities (Martinez-Fernandez et al., 2016; Turok and Mykhnenko, 2007; Wiechmann and Pallagst, 2012). Through this rich exchange, researchers gradually understood that a mixture of physical, demographic and socio-economic factors affect shrinking cities (Haase et al., 2016).
There have been many discussions on the relationship between local government sustainability and various factors related to population decline in the case of Japan (Faruqee and Mühleisen, 2003; Kaizuka and Krueger, 2006; Matsutani, 2006). Oyama and Morimoto (2017) evaluated the characteristics of cities from the perspective of their fiscal situation; their results indicated that land use composition and economic changes (e.g. changes to industrial structure) are significantly associated with public spending changes. Other studies, such as one by Faruqee and Mühleisen (2003), have demonstrated that population aging is relevant to fiscal sustainability; Kanasaka et al. (2011) obtained a similar result, showing that industrial structure and age composition are significant factors for explaining per capita public spending.
Although per capita public spending seems to be associated with various factors, the magnitude of public spending can derive from an uneven spending balance between central and local governments. Although local governments are responsible for 57.8% of the overall expenditure in Japan, the proportion depends on the public service: 99% in sanitation, 87% in education, 6.7% in pensions and so forth (MIAC, 2018). The extent of decentralisation affects both economic growth (Zhang and Zou, 1998) and the efficiency of public service provision (Kwon, 2003), which may cause a bias between per capita public spending of local governments and the level of the public services.
Informed by previous research, we recognise that the cost-efficiency of local public services, local environment factors and population size are closely linked. However, research has not fully addressed the relationships from the perspective of local public sustainability under population decline. Moreover, considering Japan’s situation, we intend to further develop the local environment factors mainly as land composition, age structure and economic activities. Thus, this study examines the following hypotheses: (H1) depending on population size, local environment factors such as the ratio of built-up area and average taxable income have positive relationships with per capita public spending; (H2) despite similar population sizes, different urban area categories exhibit varying coefficients for local environment factors such as the ratio of daytime population and employees of both primary and secondary population ratios; and (H3) the local environment factors in Japanese local municipalities are mainly composed of land composition, age structure, economic activities and fiscal situation, but some factors (e.g. the elderly population ratio) are affected by the national tax system, for example, the spending balance between central and local governments. Verifying these hypotheses would contribute to understanding the different impacts of local environment factors on cost-efficiency with heterogenous spatial settings.
Methods and data
Urban employment area
The characteristics of population decline depend heavily on cities’ locations. In particular, the size of an urban area affects both the quality and the quantity of amenities (Albouy, 2008). Regarding regional activities, the main determinant of urban area scale is the economic activities of local residents, such as their commuting behaviour. Kanemoto and Kurima (2005) described an UEA as one whose boundaries are defined by worker commutes and the location of densely inhabited districts (DID). 1
Within an UEA, the authors differentiate the urbanisation gradation in terms of core and suburban cities. A core city is composed of densely settled municipalities with a DID population of more than 10,000, whereas a suburban city is an area where at least 10% of workers commute to a specific core. Meanwhile, a UEA whose DID has a core population of more than 50,000 is called a metropolitan employment area (MEA), whereas one with a DID core population of 10,000–50,000 is defined as a micropolitan employment area (McEA). 2
In this study, our categorisation of cities adds to the definition of Kanemoto and Kurima (2005). First, we categorise Tokyo, Osaka and Nagoya metropolitan areas as ‘three major UEAs’; these areas are considerably larger than others, with population sizes exceeding 5,000,000. The three major UEAs differ from other UEAs in that most workers commute to the strong core cities even when the commutes involve many hours. As the second category, we follow the original definition of ‘MEAs’ and ‘McEAs’. In this group, a substantial number of workers would be commuting to core cities, but the core cities’ influence on residents is weaker compared to that of the three major UEAs. Cities in McEAs are typically located in suburban or rural areas, and the daily mode of transportation is expected to be private vehicles. Finally, cities not included in the other categories are defined as ‘cities without cores’; in these cities, no true core exists.
Model specification
We consider per capita public spending as an indicator of the cost-efficiency of public service provision; let us define


Then, we obtain the reduced form of the cost function


One of the main aims in this study is to observe the regional differences in local environment factors; therefore, we apply a stratification method by using the four categories introduced in the previous subsection. We first check the average effect of the UEA category differences and then conduct a series of regressions using equation (7).
Data
In the subsection ‘Factors of sustainable local governments associated with population decline’, we hypothesise that land composition, age structure, economic activities and fiscal situation are the aspects of local environments that affect per capita public spending. Referring to related studies, we choose the specific factors.
For the composition of land use, first, the geographic areal size will affect the per capita public spending, since a large areal size tends to mean that longer distances are required to deliver public services (Ogawa and Takahashi, 2008). Focusing on land use, urban area roughly consists of built-up area, farmland and forest areas. The built-up and farmland area ratios to the total geographic area are expected to be positively and negatively related to per capita public spending, respectively, because larger ratios of both forest and farmland indicate aggregation of the urban area (Fregolent and Tonin, 2016). Although, as suggested by Šťastná (2009), spatial interdependency may affect per capita public spending, we do not include it, because the analysis unit is the municipality, which cannot fully reflect spatial interactions.
An unbalanced age structure is related to per capita public spending, because larger age cohorts can more effectively pressure politicians to spend on specific services (Cattaneo and Wolter, 2009). First, we suppose that the elderly population ratio – the ratio of the population aged over 65 years to the total population – is the appropriate factor for explaining the aging population, because the elderly retire from employment and are more likely to suffer from health problems. We assume that the ratio of the population aged below 15 years is also an important determinant of per capita spending due to educational expenses. However, given the strong correlations between the two ratios (r = –0.774), we use only the elderly population ratio.
Regarding economic activities, taxable income determines how much the municipality levies resident tax. Ashworth et al. (2005) argued that income level has a positive effect on public expenditures, as exemplified in Flemish municipalities. The ratio of the daytime population to the municipal population is also an important factor, not only for indicating the intensity of economic activities’ aggregation but also for controlling spillover from a high degree of social welfare and consumption in the city (Baba and Asami, 2020). Moreover, industrial structure should be related to the extent of subsidies to industries, and variation in the industrial proportion can reveal differences in local expenditure (Seaton, 2010).
Moreover, a severe fiscal situation would likely interrupt efficient public service provision, because municipalities would underproduce their public services (Bernt, 2009). In this case, per capita public debt would represent the municipal fiscal situation, since public debt is easily measured and reflects the extent to which a municipality can independently deliver public services. Therefore, a high public debt per capita suggests inflexibility in financing and a higher per capita expenditure. Based on the assumptions above, we select factors for the analysis.
The public service level is a critical variable that transforms the direct production of public services into tractable data. Although the data are difficult to acquire, we obtained public service-level data from Nihon-keizai-shinbun-sya (2009), which was from a questionnaire survey in municipalities across Japan to determine the extent of public services ranging from child and elderly care, education and public utilities to developing housing and infrastructure. As an agent variable of public service level, we use the aggregated public service level score (please see Supplementary material for details).
The analysis data are obtained from local municipalities in Japan, in which significant differences exist between cities, towns and villages. Mixing such municipalities together results in diverse statistical trends of local environment factors. The descriptive statistics for the aggregated municipalities and municipalities grouped by UEAs are shown in Table 1.
Descriptive statistics.
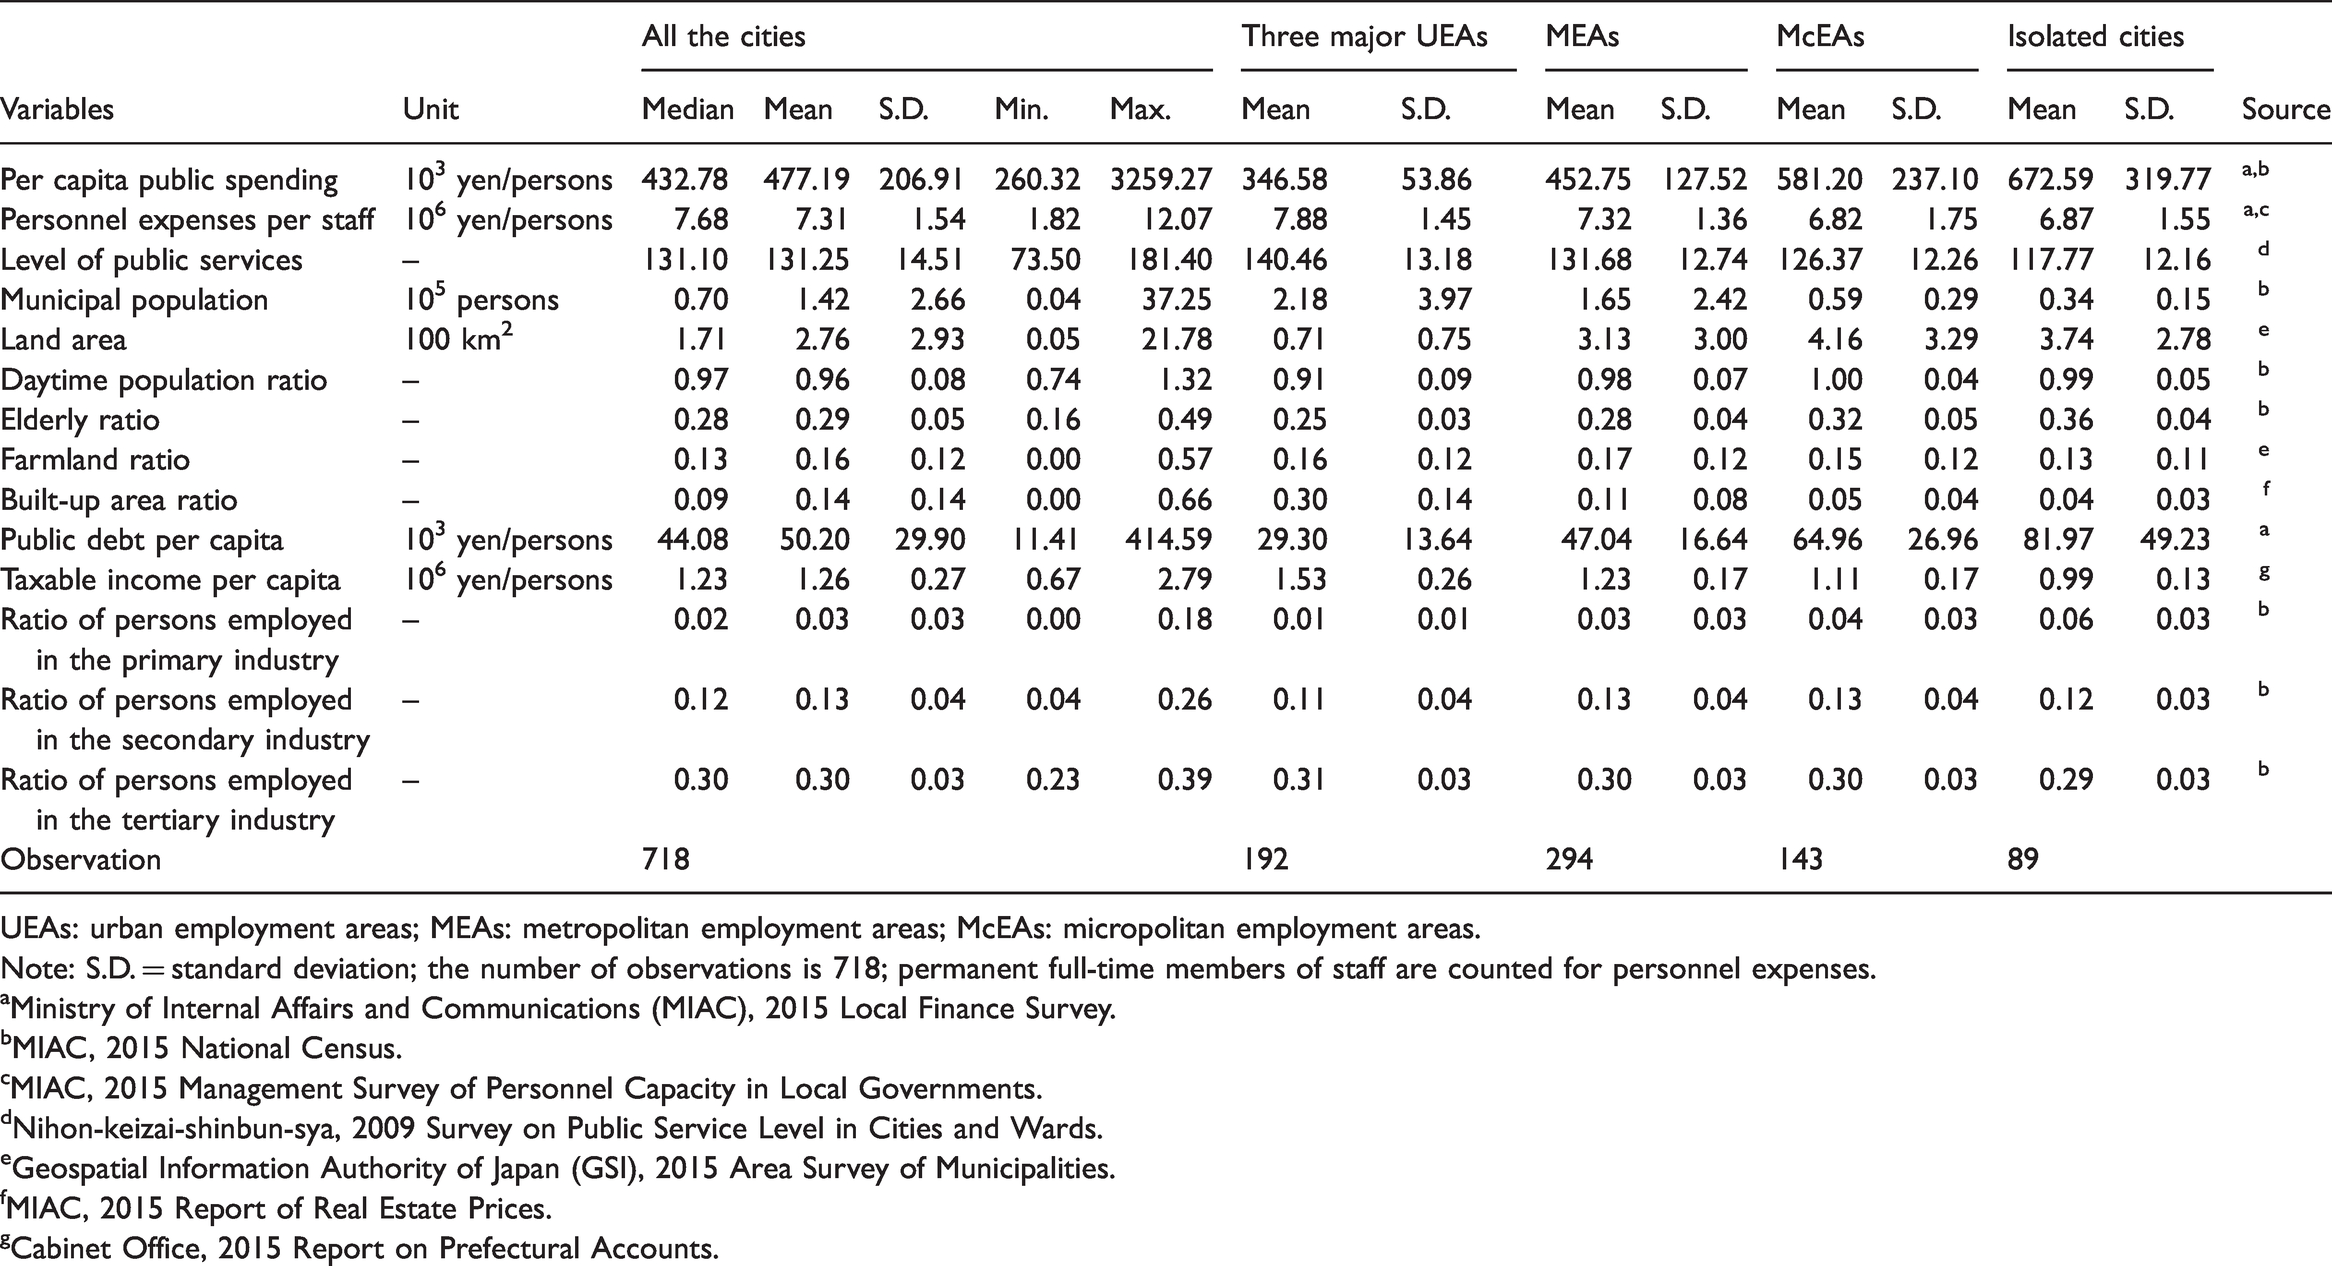
UEAs: urban employment areas; MEAs: metropolitan employment areas; McEAs: micropolitan employment areas.
Note: S.D. = standard deviation; the number of observations is 718; permanent full-time members of staff are counted for personnel expenses.
aMinistry of Internal Affairs and Communications (MIAC), 2015 Local Finance Survey.
bMIAC, 2015 National Census.
cMIAC, 2015 Management Survey of Personnel Capacity in Local Governments.
dNihon-keizai-shinbun-sya, 2009 Survey on Public Service Level in Cities and Wards.
eGeospatial Information Authority of Japan (GSI), 2015 Area Survey of Municipalities.
fMIAC, 2015 Report of Real Estate Prices.
gCabinet Office, 2015 Report on Prefectural Accounts.
Results
Model estimation
We first estimate parameters with the baseline model; Table 2 shows results. This baseline model assumes that interaction terms between local environment factors and population do not affect public spending; thus, the interaction term between the municipal population and local environment factors is omitted. The estimation produces the following findings.
Estimation result of the baseline and specified models.
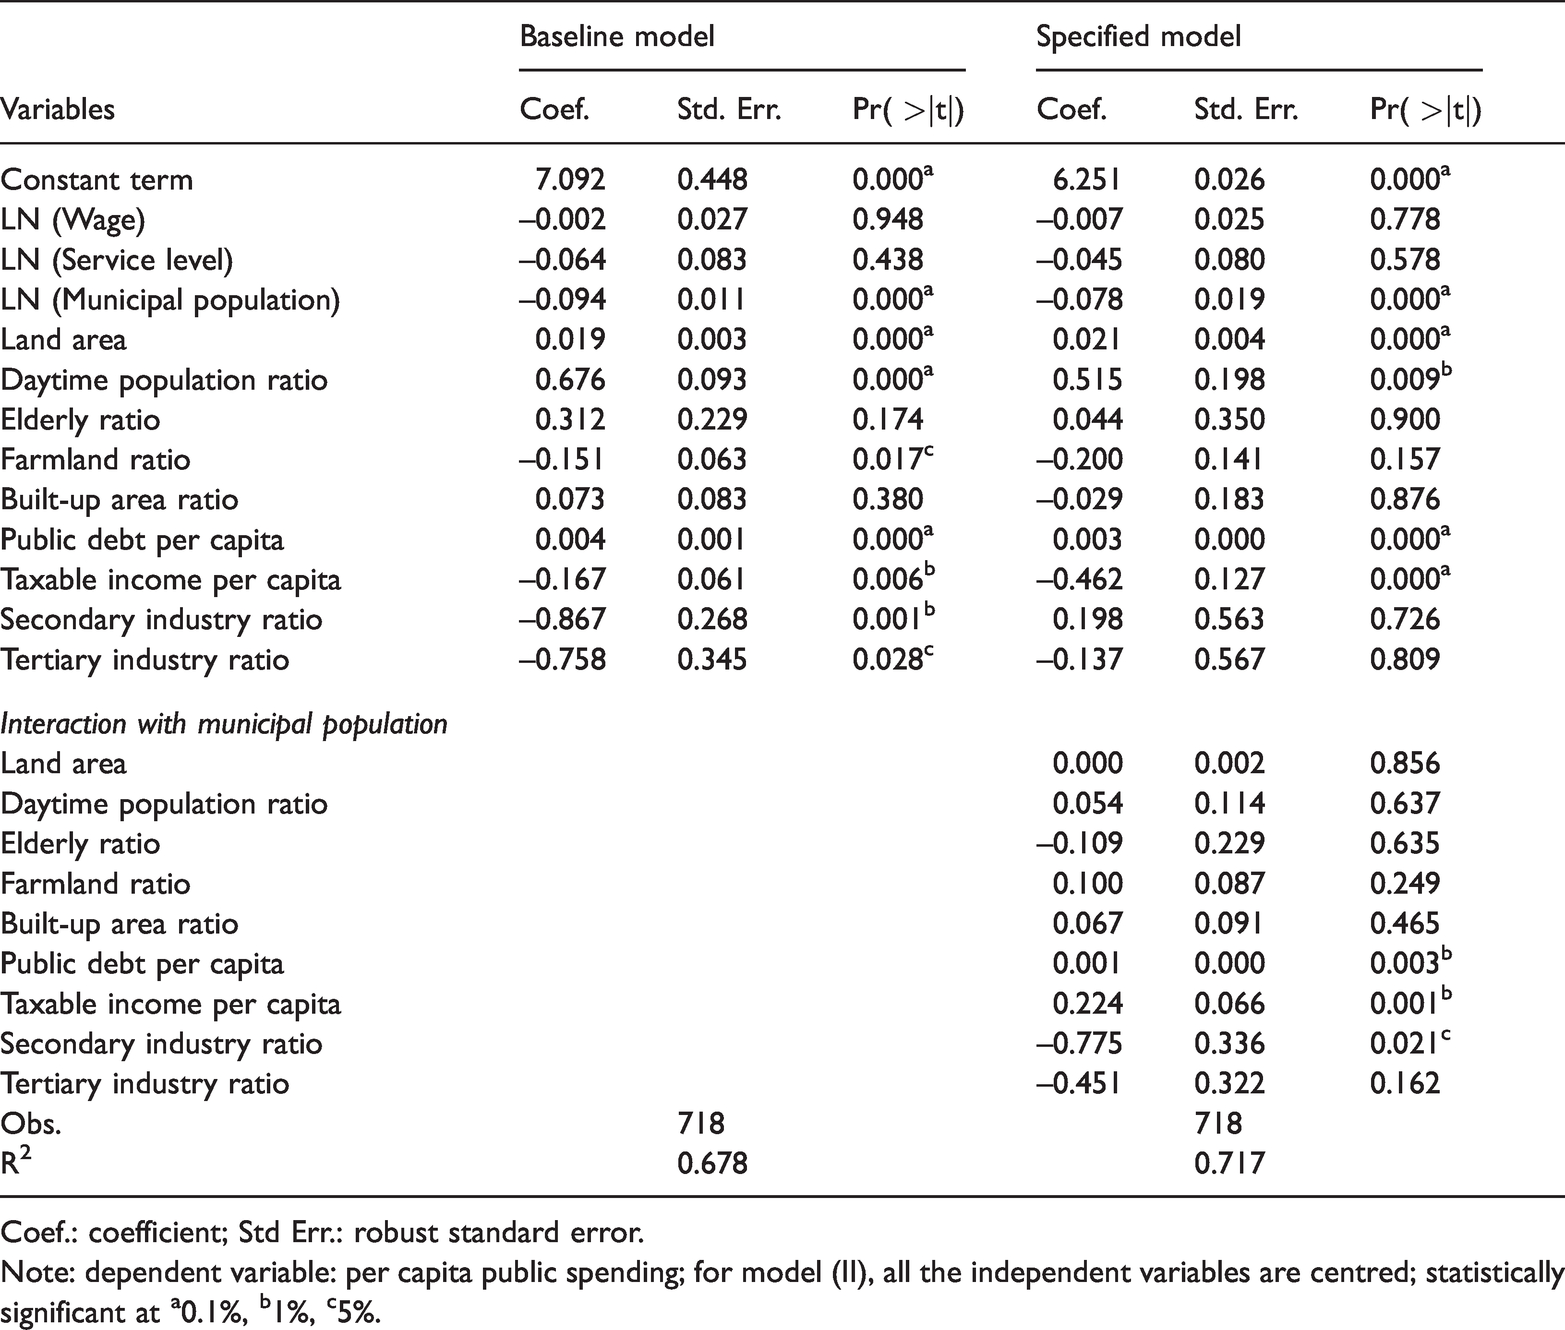
Coef.: coefficient; Std Err.: robust standard error.
Note: dependent variable: per capita public spending; for model (II), all the independent variables are centred; statistically significant at a0.1%, b1%, c5%.
The coefficient of municipal population has a statistically significant negative value at the 0.1% level. This shows that a large city size is advantageous for cost. It can be considered that, if workers reside in a city, the city can accommodate more firms than before, and this contributes to a decrease in workers’ transportation cost due to agglomeration economies (Fujita, 1989; Fujita and Thisse, 1996).
For local environment factors, most signatures are the same as the expected ones. While the coefficient of land area shows a statistically significant positive value, the land composition of the farmland ratio expresses a negative value. However, the ratio of built-up area does not show any statistical significance. Conceivably, since the built-up areas do not represent density and spatial distribution, their effects would differ depending on cities. Regarding socio-economic status, the daytime population ratio is significantly positive, which shows that intense economic activity can be a cost-increasing factor. On the other hand, per capita taxable income and the ratios of persons employed in both secondary and tertiary industry show negative coefficients. Thus, cities with inhabitants who are wealthy and not engaged in primary industry tend to be cost-efficient. Focusing on the fiscal situation, per capita public debt exhibits a statistically significant positive value at the 0.1% level, indicating that a city struggles to deliver public services efficiently under strong fiscal constraints.
Under the assumption that neither municipal population nor UEA size affects the statistical significance of local environment factors, the baseline model offers some fundamental findings. However, the addition of municipal population interaction terms would provide more practical evidence about how population scale influences the local environment factor effects (Table 2).
Focusing on interaction terms between local environment factors and municipal population, the public debt per capita and average taxable income are significantly positive at the 1% level. Since per capita public debt shows a positive coefficient even without interaction with population, it is thought that an increasing population boosts the cost-increasing effect of per capita public debt. On the other hand, the average taxable income shows opposite signs with and without interaction with the population, indicating that average taxable income is cost advantageous but the effect is discounted by population size.
Although some factors show significant effects when estimated by the specified mode, most variables are not statistically significant due to interaction terms. Therefore, it is difficult to elaborate on the estimation results. Since one of this study’s aims is determining the urban area size that affects the local environment factors, we stratify the cities into four categories of UEAs and focus on statistical significance, specifically the 95% confidence interval (CI).
Difference in local environment factors per UEA category
We first regress the cost function without assuming a congestion effect in equation (3) and stratified cities depending on UEA categories. The estimation results shown in Table 3 describe fundamental differences in local environment factors per UEA category. Furthermore, Figure 1 illustrates the 95% CIs, considering the marginal effects of local environment factors on the population size per UEA category. The red and blue lines illustrate positive and negative signs, respectively. The estimation results considering interaction terms of the municipal population per UEA size appear in the Supplementary material. The major findings are as follows.
Estimation result with no population interactions per UEA category.
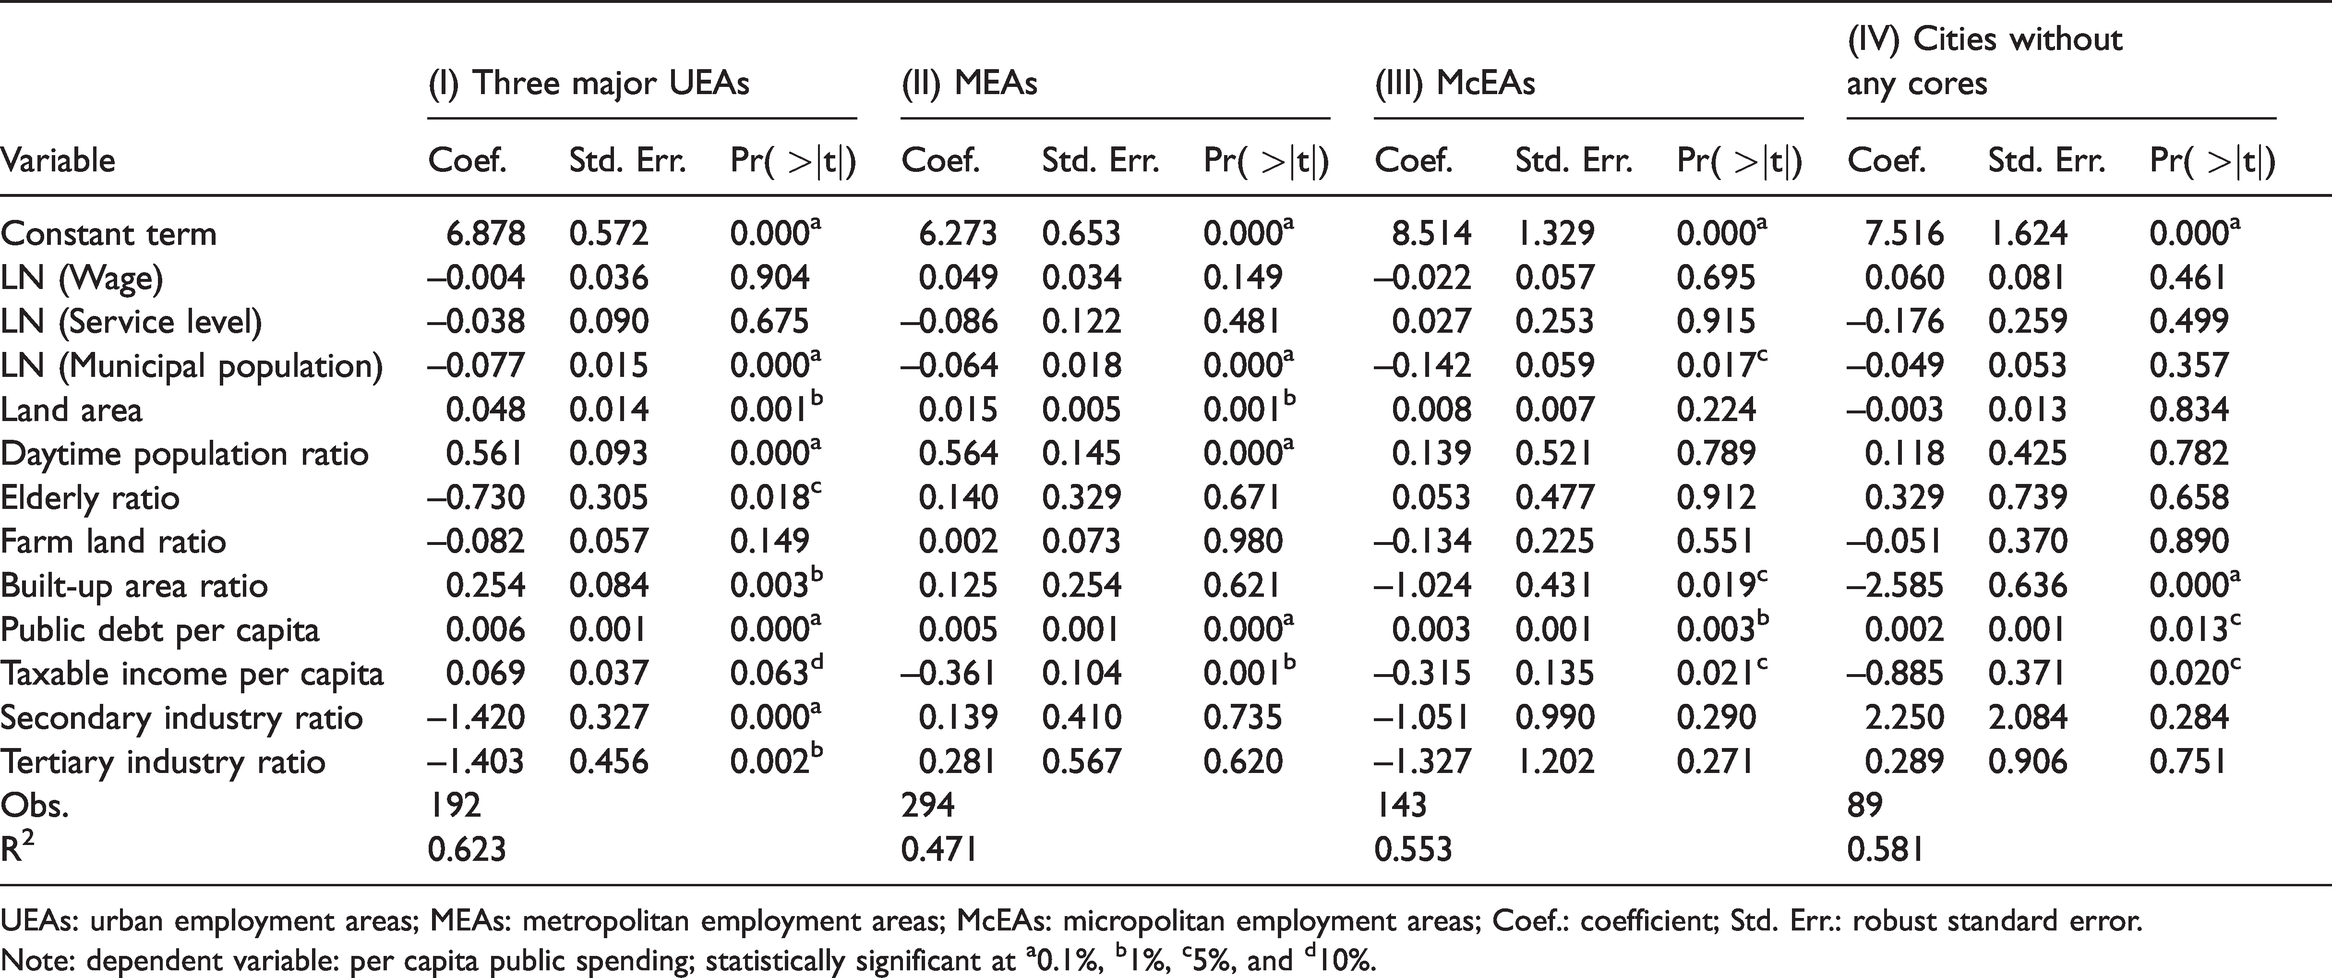
UEAs: urban employment areas; MEAs: metropolitan employment areas; McEAs: micropolitan employment areas; Coef.: coefficient; Std. Err.: robust standard error.
Note: dependent variable: per capita public spending; statistically significant at a0.1%, b1%, c5%, and d10%.
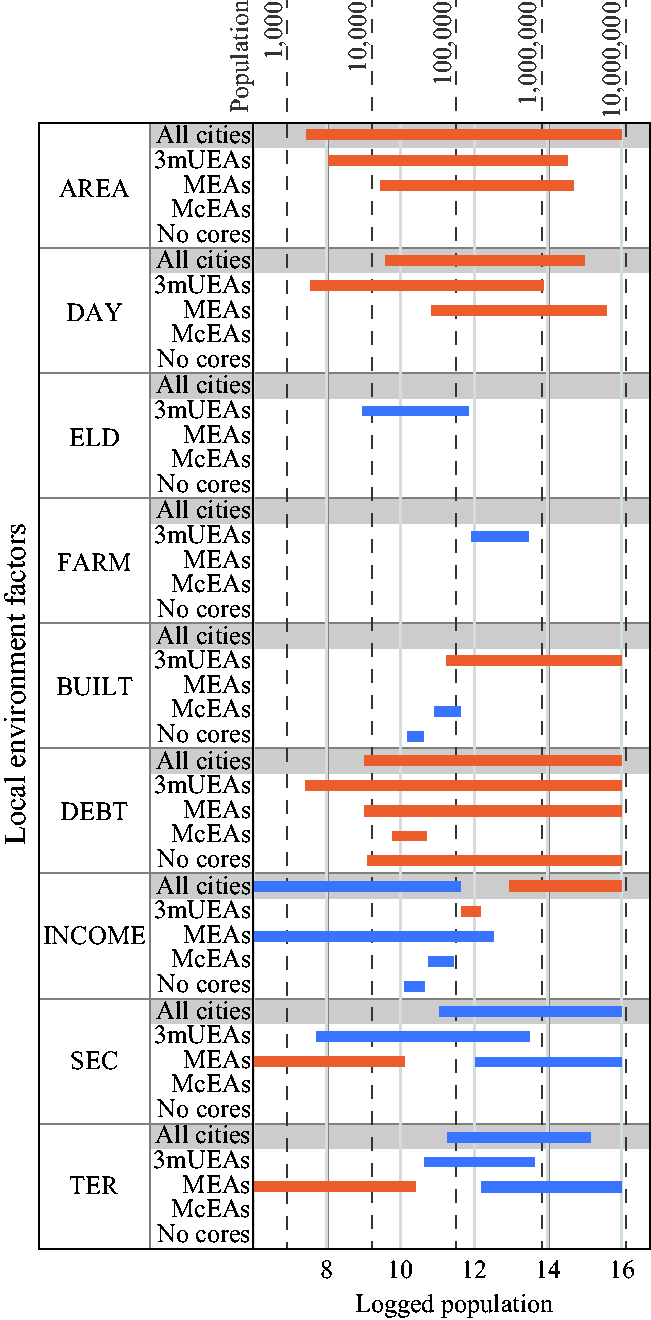
CI ranges of urban shrinkage factors per UEA category.
Regarding land composition, the land area reveals positive values for the three major UEAs and MEAs, whereas the built-up area ratio shows both signs depending on the size of the UEAs. We consider that cities in large-sized UEAs must maintain a high quality of public infrastructure with an increasing built-up area ratio, while cities in small-sized UEAs do not. The marginal effect of land area on population size is significantly positive in the three major UEA and MEA categories, and the range is
Focusing on age composition, the elderly population ratio does not show any statistical significance despite a certain population range
The ratios of daytime population and employees in secondary and tertiary industry demonstrate the intensity of economic activity, showing significant trends in the all-cities sample, the cities in the three major UEAs and the MEA sample. Daytime population ratio is positive correlated with the ranges of
The average taxable income includes both positive and negative 95% CIs in the all-cities sample. The number of wealthy residents tends to be a cost-increasing factor in large-sized cities, while it is likely a cost-decreasing factor in small-sized cities. One reason for this is that large-sized cities with wealthy residents tend to deliver high-quality public services, which residents in adjacent cities also consume, indicating spillover in public services. Conversely, the average taxable income in MEAs, McEAs and cities without cores is negatively associated with per capita public spending, depending on population size. The ranges of 95% CIs are below
Per capita public debt, which is an agent of the fiscal situation, is positively associated with per capita public spending in all UEA categories – an expected result. The 95% CIs cover a wide range of populations across UEA categories except for McEAs. The ranges of 95% CIs are above
Discussion and conclusions
Through the analysis, we proved the hypotheses stated in Section ‘Literature review and research hypotheses’. Regarding the findings, three important points warrant discussion: cost-efficiency depending on the UEAs, the small-sized municipalities under various UEAs and the role of local municipalities.
Regarding the first hypothesis, after the stratification of UEA categories, the statistical significance and even the signatures of local environment factors differ depending on UEA category. For instance, public spending of cities in the three major UEAs had a positive relationship with built-up area and taxable income per capita, whereas these two factors in McEA cities and in cities without cores show opposite signatures. When we assume that built-up areas in large-sized UEAs are already agglomerated, increases in built-up areas would be a type of suburbanisation, leading to extra public spending (Hortas-Rico and Solé-Ollé, 2010). Conversely, built-up areas in small-sized UEAs would be dispersed, and an increase in built-up areas would not always mean expanding service provision areas to achieve cost-efficient public service provision per capital. On the other hand, the reason for the positive significance of taxable income per capita is spatial spillover; the residents of cities in large-sized UEAs can easily pass through the cities’ administrative boundaries and still benefit from a high level of public services provided by the core cities (Feldman, 1999).
Results for the second hypothesis imply that while small-sized cities in large-sized urban area are likely to gain CIs, the cities in small-sized urban areas do not tend to be statistically significant. Although the ratios of employees in secondary and tertiary industries show positive correlations in the small-sized cities of MEAs, no statistical significance was found in McEAs and cities without cores. To explain this result, small cities in MEAs may not have enough customers to support businesses and thus, secondary and tertiary industries would be subsidised. Meanwhile, a similar situation would exist across cities in McEAs and cities without cores, and statistical significance is not observed. Another explanation is that some small cities in MEAs have developed as either commercial or industrial cities such that extra spending is needed to maintain businesses facing decaying industries.
One of the findings associated with the third hypothesis is that we do not observe any statistical significance for the ratio of elderly people except in the three major UEAs. This tendency seems to differ from previous findings that suggest that the elderly population ratio is a cost-increasing factor (Faruqee and Mühleisen, 2003). However, this is because major expenses like pensions and elderly care do not depend heavily on local public spending. For instance, Japan’s central government spends the entire national pension and five-sixths of the medical care budget on the latter-stage elderly. In contrast, since 87% of the national education budget is allocated to local municipalities (MIAC, 2018), an increase in the ratio of the elderly, which sometimes coincides with a decrease in the ratio of children, leads to decreasing per capita public spending in the three major UEAs.
Overall, this study confirms our hypotheses, but some limitations should be addressed. The Cobb–Douglas form we used is fundamental yet may be too simple to estimate relationships between parameters. Furthermore, the data are cross-sectional, and the target municipalities are only cities. Towns and villages should be targeted in future analyses, as they may also be facing serious conditions.
Nevertheless, we believe that our findings can contribute to the sustainable management of cities in the advent of population decline. In response to these findings, one measure would be to establish an inter-municipal cooperation to internalise benefit spillover (Frère et al., 2014). This organisation would mitigate the spatial heterogenous effect and enable participating municipalities to enjoy economies of scale (Baba and Asami, 2020). Another possibility is to consider the balance of public expenses between central and local governments. We suppose that a high proportion of the national government’s elderly care spending is advantageous to local governments, but too great a subsidy would hinder cost minimisation of the public service provision. Overall, the urban area framework is effective for discussing local environment factors with a better understanding of local public sustainability.
Supplemental Material
sj-pdf-1-epb-10.1177_23998083211003883 - Supplemental material for Cost-efficient factors in local public spending: Detecting relationships between local environments, population size and urban area category
Supplemental material, sj-pdf-1-epb-10.1177_23998083211003883 for Cost-efficient factors in local public spending: Detecting relationships between local environments, population size and urban area category by Hiroki Baba and Yasushi Asami in Environment and Planning B: Urban Analytics and City Science
Footnotes
Acknowledgements
We are grateful to T. Takahashi, Y. Sadahiro, F. Seta and K. Hino for their helpful comments.
Declaration of conflicting interests
The author(s) declared no potential conflicts of interest with respect to the research, authorship, and/or publication of this article.
Funding
The author(s) disclosed receipt of the following financial support for the research, authorship, and/or publication of this article: This work was supported by JSPS KAKENHI Grant Number JP17K18919 and 18J11698.
Supplemental material
Supplemental material for this article is available online.
Notes
References
Supplementary Material
Please find the following supplemental material available below.
For Open Access articles published under a Creative Commons License, all supplemental material carries the same license as the article it is associated with.
For non-Open Access articles published, all supplemental material carries a non-exclusive license, and permission requests for re-use of supplemental material or any part of supplemental material shall be sent directly to the copyright owner as specified in the copyright notice associated with the article.