
Abstract
Many developed countries need to plan urban policies based on multidimensional factors related to population change. However, empirical research has been inconsistent with respect to identifying these factors, including economic-, social-, and urban-planning-related factors. The purpose of this study is to clarify the nonlinear multidimensional factors that are correlated with population changes according to the city size. In the analysis, the population change rate was defined as the outcome variable, and 269 economic, social, and educational index (ESE index) were used as predictor variables. Data were stratified according to three city sizes. Using the ESE index, the XGBoost algorithm was used to analyze the nonlinear relationship between the population change rate and multidimensional data. As a key result, population changes were strongly correlated with social-related indicators, such as the population change rate among persons ages 0–14 years in small-sized cities, the natural population change rate in medium-sized cities, and the migration change rate in large-sized cities. Regarding the population decline, Japan has 1304 shrinking cities, which are primarily comprised of medium-sized and small-sized cities. In such cities, other than social-related factors, population changes correlated with the financial strength index as an economic-related factor in medium-sized cities and the designation of underpopulated areas as an urban-planning-related factor in small-sized cities. Among the multidimensional factors, cities of different sizes were characterized by factors other than social-related indicators. These multifaceted factors could provide preliminary insights for urban policymakers to explore various policy measures on which they need to focus, depending on the city’s size.
Introduction
Urban policy is essential in shrinking cities in developed countries, such as post-East Germany and the United States’ Rust Belt (Hackworth, 2015; Mallach et al., 2017; Nelle et al., 2017). The concept of shrinking cities has been defined by the Shrinking Cities International Research Network (SCIRN), which is an important early consortium that developed the study of shrinking cities internationally: The SCIRN has defined shrinking cities as cities that have experienced an average population decline of more than 0.15% over five consecutive years (Aurambout et al., 2021). Urban policy in Japan has also faced the challenges of population decline related to low birth rates and an aging population (Buhnik, 2011; Hattori et al., 2017). In Japan, 28.9% of the total population is over 65 years of age, which comprises 36.21 million people (Statistics Bureau of Japan, 2022). China is facing a similar situation (Ye, 2022). Considering the population decline, these countries need to establish urban policies according to city size.
Based on the above discussion, urban policymakers must consider the multidimensional factors that are correlated with population change. Previous studies have conceptualized population decline as a relationship between economic decline and political change, both locally and globally (Haase et al., 2014). In addition, many studies have analyzed the statistical correlation between population changes and various factors such as deindustrialization, suburbanization, aging, and out-migration (Döringer et al., 2020). Population changes have been reported to correlate with industrial diversity (Wang et al., 2020). For example, some mining cities have experienced rapid population decline because of industrial changes (Martinez-Fernandez et al., 2012). In addition, population decline correlates not only with economic-related factors but also with social-related factors, such as the decrease in the young population because of the outflow of residents (Iwasaki, 2021). Regarding social factors, population change is more strongly influenced by educational factors than economic factors (Kato, 2023). Population decline is correlated with socioeconomic development and urban environments (Guo et al., 2021). In terms of the urban environment, population decline is correlated with bus stop density, road intersection density, distance to the nearest park, and the proportion of business areas (Ma et al., 2022). These studies illustrate that factors related to population decline have been studied from various perspectives. This is precisely the problem of urban complexity, as noted by Jacobs (1961). However, no consistent empirical research has identified multidimensional factors, including economic-, social-, and urban-planning-related factors. Such a multifaceted factor approach would provide preliminary insights for urban policymakers to explore the various policy measures on which they need to focus.
Our research question is to determine the multidimensional factors that correlate with population changes in cities of varying population sizes. Addressing this question according to city size can address the research deficit regarding the multidimensional factors that correlate with population change. Population decline has been found to be related to city size, especially in cities with a total population of less than 50,000 (Peng et al., 2023). In small-sized cities, peripheralization allows strategies to negate quantitative growth, such as the Slow City movement, which focuses on quality-of-life factors, well-being, and deceleration (Wirth et al., 2016). Meanwhile, the population decline in medium-sized cities in Spain correlates not with economic variables but with an increasing older population and loss of the working population (Escudero-Gómez et al., 2023). This difference makes urban planning difficult in small-sized and medium-sized cities (Batunova and Gunko, 2018). However, factors associated with population decline are multifaceted and pertain to a diverse range of perspectives (Haase et al., 2016). Therefore, the complex multifactorial relationships must be explored using empirical, observational data with a statistical model (Kato, 2023). A more accurate statistical model would strengthen the macro-theoretical conceptualization models of shrinking cities (Wolff and Wiechmann, 2018). However, no study has reported an empirical multifactorial analysis according to city size.
This study aims to clarify the nonlinear multidimensional factors that correlate with population changes according to city size. This analysis of multidimensional factors provides preliminary insights into the complex mechanisms underlying population decline. For the analysis, we set the population change rate as the outcome and multidimensional indicators as predictors. The analysis was stratified according to city size. Regarding city size in Japan, this study defined cities with a population of more than 200,000 as large-sized cities, cities with a population of more than 50,000 as medium-sized, and cities with a population of less than 50,000 as small-sized cities. The Japanese government categorizes large-sized cities as ordinance-designated cities and core cities, medium-sized cities as ordinary cities, and small-sized cities as towns/villages. This classification is appropriate because different authorities administer cities of these three different sizes. This study analyzed the nonlinear relationship between the population change rate and multidimensional data such as economic-related, social-related, and urban-planning-related indicators. The dataset used in this study was obtained from the Economic, Social, and Educational (ESE) Index, a cross-sectional dataset prepared as a complete enumeration of all cities in Japan. The analysis period of population change was set from 2005 to 2010. The 5-year analysis is valid from the perspective of SCIRN’s definition of shrinking cities (Aurambout et al., 2021). The nonlinear relationship was analyzed using XGBoost, which is typically more accurate than other modeling algorithms.
This manuscript comprises five sections based on the IMRAD format with introduction, method, results, discussion, and conclusion sections.
Method
Economic, social, and educational index
The dataset used in this study was the ESE index, which is a cross-sectional dataset of each city in Japan. In Japan, the Ministry of Education, Culture, Sports, Science, and Technology (MEXT) developed the ESE index as a complete enumeration of all 1747 Japanese cities. Through the ESE index, MEXT has promoted research that contributes to policymaking in Japan (MEXT, 2022b). The advantages of the ESE index are its reliability and coverage of most of the publicly available government statistics in Japan (Kato, 2023). The ESE index includes 270 indicators from sources such as the Japanese Census, Economic Census, National Survey of Family Income and Expenditure, Major Financial Indicators of Local Governments, Housing and Land Survey of Japan, Survey on Time Use and Leisure Activities, National Survey of Academic Progress, School Basic Survey, and Social Education Survey (MEXT, 2022a). These are key statistics collected by the Japanese government.
The ESE index of 270 indicators includes social-related indicators (such as the number of births and the migration change rate), economic-related indicators (such as the financial strength index and the labor force), and urban planning-related indicators (such as the number of community centers and the habitable area). In addition, the ESE index includes indicators that appear to be unrelated to population decline (such as gross floor area per house and average weekly working hours). The ESE index also includes some indicators that cannot be improved by urban planning (such as the number of divorces and annual commercial sales). In addition, some indicators are interrelated, such as the number of people by generation and the total population. However, this study used the ESE index to analyze multidimensional factors and provide preliminary insights into the complex mechanisms of population dynamics according to three city sizes. The 270 indicators used in this study are listed in Supplemental Table S1.
This study used the 2011 ESE index, which is the most recent cross-sectional dataset. Although the dataset is approximately 10 years old, the ESE index is appropriate for this study because population decline is a long-term urban phenomenon.
XGBoost
The XGBoost algorithm was used in this study. Using this algorithm, the nonlinear relationships between the population change rate in 2010 (PCR2010) and the other 269 indicators in the ESE index were analyzed. PCR2010 is the percentage change in population from 2005 (P
2005
) to 2010 (P
2010
), as calculated using equation (1)

Some machine learning algorithms are thought to be able to generate more accurate models than OLS regression analysis. Some urban planning studies have used various machine learning algorithms, such as random forests (Kato and Takizawa, 2022), neural network analysis (Raju et al., 1996), gradient boosting tree analysis (Cao et al., 2020; Kato and Takizawa, 2024a; Wang and Wang, 2021; Yin et al., 2020), and the eXtreme gradient boosting (XGBoost) algorithm (Kato and Takizawa, 2024b; Thackway et al., 2023). However, effective algorithms vary depending on the characteristics of the datasets and the analysis objectives (Bentéjac et al., 2021; Grossman et al., 2023; Shyam et al., 2020). XGBoost is characterized as a fast and scalable algorithm with optimized gradient boosting and the prevention of overlearning through L1 (lasso) and L2 (ridge) regularization (Chen and Guestrin, 2016). The characteristics of the XGBoost algorithm make it effective for analyzing large, complex, and structured datasets that have a risk of overfitting. Several studies have demonstrated the superior predictive accuracy of XGBoost over the random forest (Asselman et al., 2023; Budholiya et al., 2022), neural network (Basu et al., 2022), and logistic regression analysis (Wang et al., 2022). Therefore, the XGBoost algorithm was appropriate for this study to analyze the large-scale multidimensional factors of all 1747 Japanese cities over a 5-year period. For statistical analysis, we used JMP PRO 16.0, with the add-in software in Python for JMP software (Wolfinger, 2020).
XGBoost hyperparameters.
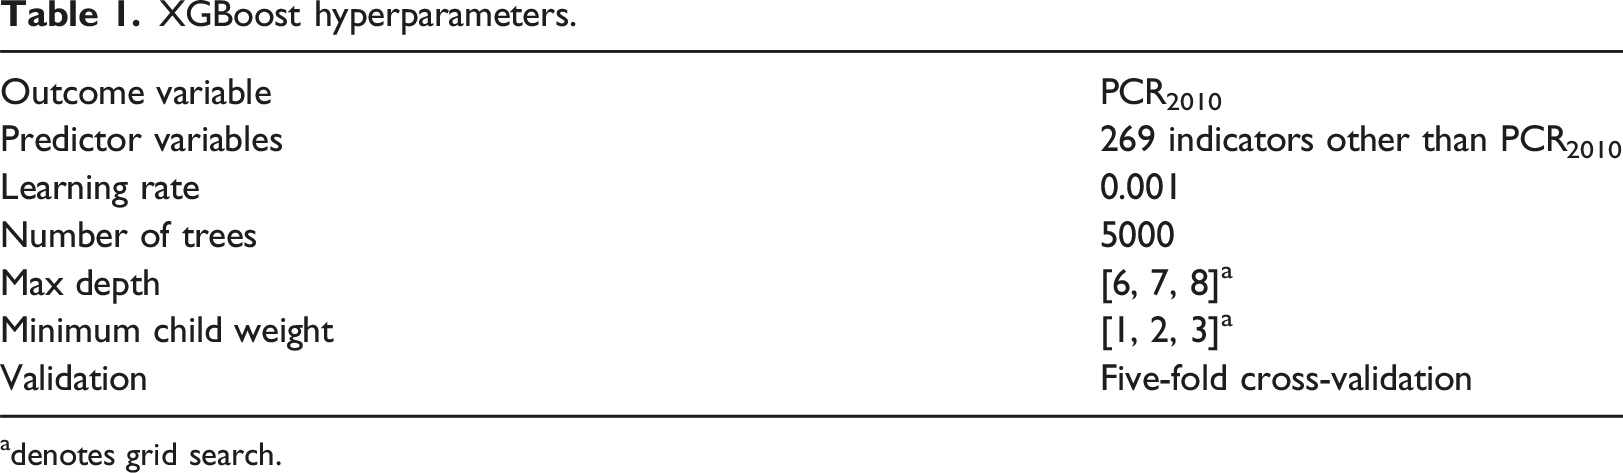
adenotes grid search.
This study analyzed the feature importance of the gain score in relation to the predictor variables based on the best combination of hyperparameters. The gain score indicates the relative contribution of the corresponding feature to the model, which was calculated by considering the contribution of each feature to each tree in the model. The score quantifies the average improvement in the objective function achieved by splitting the features across all tree branches (Xgboost Developers, 2022). Therefore, a higher gain score implied greater importance in predicting PCR2010.
City size
This study analyzed all the cities in Japan. The scale of analysis is city, which is a concept of administrative perspective. Therefore, cities have urban and rural areas, although the vast majority of people in Japan live in urban areas. In terms of administration in Japan, local governments are structured at two levels: prefecture and city. Prefectures are one level larger than cities and include few cities. Both prefectures and cities have electoral systems and parliaments that can develop ordinances within their authority. Prefectures and cities are mutually independent local governments with no hierarchical relationship in terms of their administrative systems. However, different levels have different functions. Prefectures are comprehensive local governments that include cities that deal with issues closely related to residents’ daily lives, such as necessities of life, safety, health, welfare, and urban planning.
In Japan, cities are classified into four size categories based on their roles and population size (Council of Local Authority for International Relations, 2020). These categories include ordinance-designated cities, core cities, ordinary cities, and towns/villages. According to local government laws, the characteristics of each city are as follows: • Ordinance-designated cities are the largest, with a population of approximately 500,000 people. Through assigned functions, ordinance-designated cities can have authorities similar to those in prefectures in areas such as social welfare, public health, and urban planning. Other individual laws grant similar powers in areas, such as compulsory education. Ordinance-designated cities are internally divided into administrative districts. • Core cities have populations of more than 200,000. These cities have health centers and deal with the same issues as ordinance-designated cities, except for issues that are dealt with more efficiently and uniformly by prefectures in their more comprehensive jurisdictions. This study analyzed ordinance-designated and core cities as large-sized cities, based on their roles. • Ordinary cities are medium-sized cities with a population of more than 50,000 people. These cities have different prefectural authorities. This study analyzed ordinary cities as medium-sized cities. • Towns/villages are small-sized cities located in rural areas that are not ordinance-designated, core, or ordinary cities. The population size is less than 50,000. The criteria are the same as those used in previous studies (Peng et al., 2023). Compared to villages, towns have a more urban appearance and more people in urban-type jobs, such as trade and industry. However, there are no differences in the functions of the governing authorities. Their essential role is the same as that in ordinary cities. This study analyzed towns/villages as small-sized cities.
Figure 1 compares large-sized (N = 83), medium-sized (N = 725), and small-sized cities (N = 939). According to the different authorities administering the cities, this classification has implications for population decline. City types in Japan. The upper figures indicate the location of each city type, on a satellite map of East Asia in the left panel (a) and in the Osaka Metropolitan Area in the right panel (b). The lower figures show photographs of each city type: Osaka City as a large-sized city (c), Ibaraki City as a medium-sized city (d), and Shirakawa Village as a small-sized city (e). The author photographed the images for (c), (d), and (e).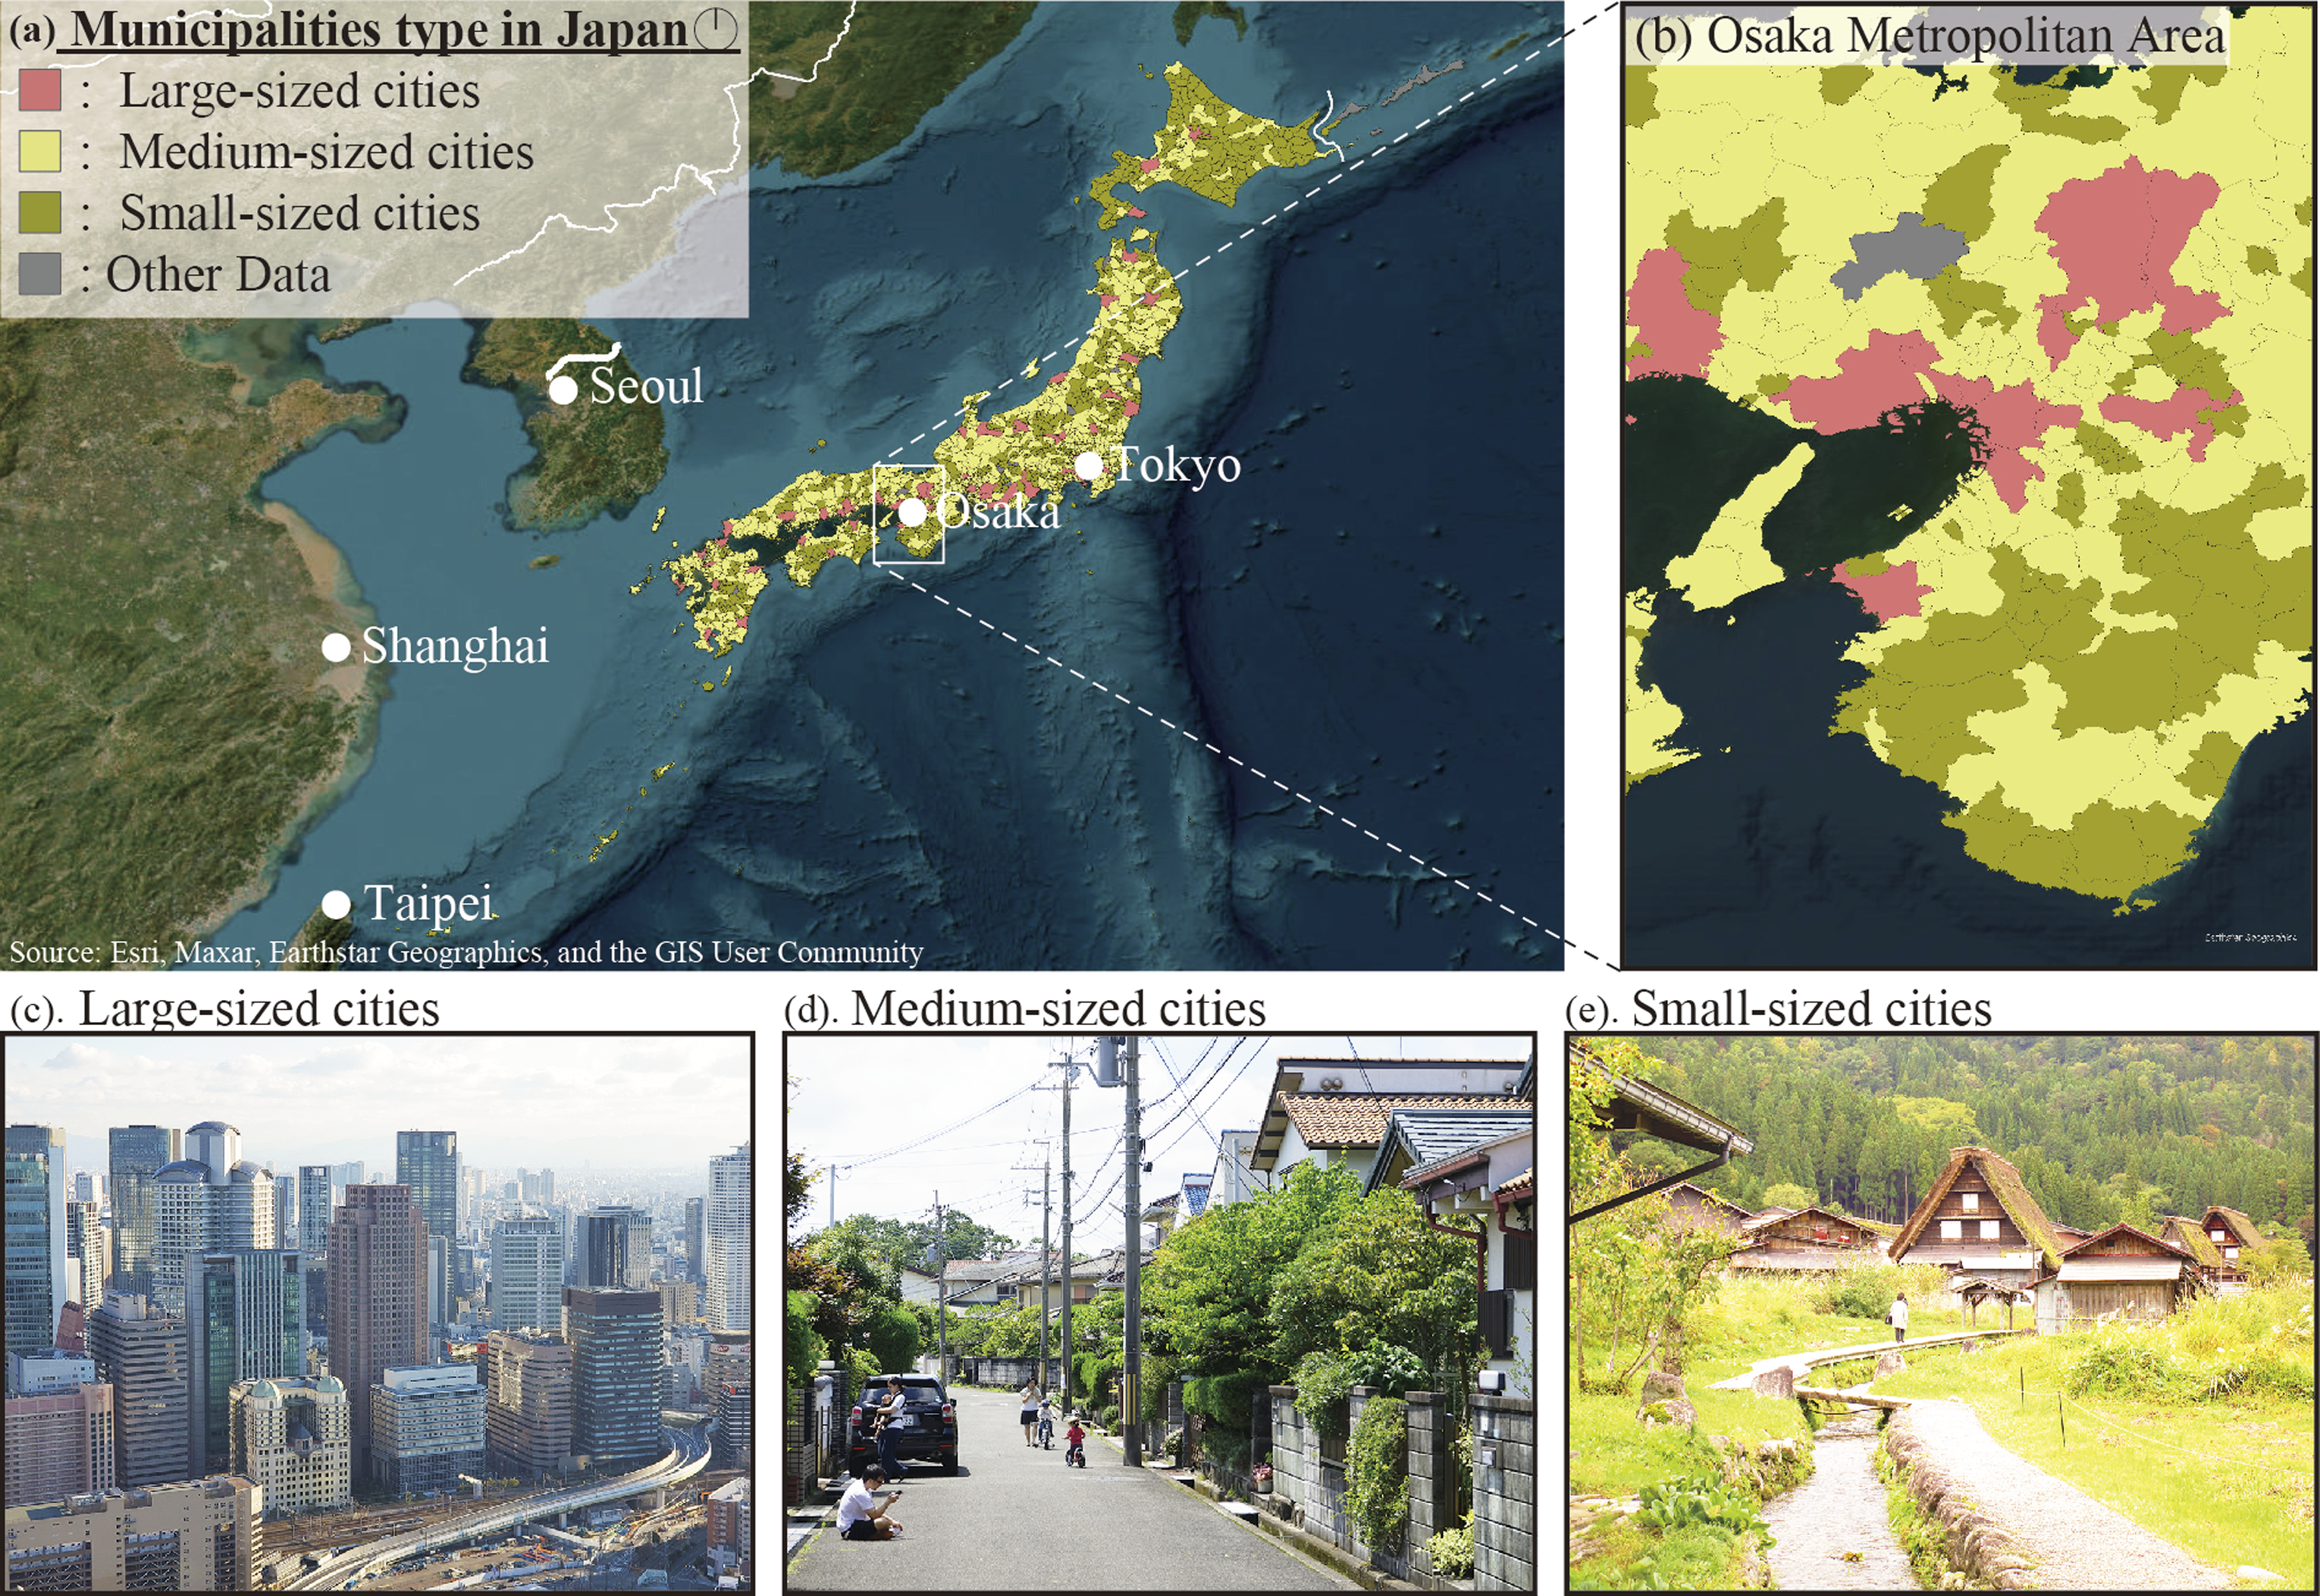
Results
Population change rate depending on city size
Tukey’s HSD test was used to compare the average PCR2010 by city size. The significance level of the p-value was set at 1%. Figure 2 shows that the average values of PCR2010 were 2.66, −1.92, and −5.08 for large-sized, medium-sized, and small-sized cities, respectively. The negative PCR2010 value for small-sized cities indicates a larger percentage decrease in their population compared to medium-sized and large-sized cities. Meanwhile, PCR2010 in large-sized cities increased at a higher rate than in small-sized and medium-sized cities. In addition, according to Tukey’s HSD test, there were statistically significant differences in population change rates (PCR2010) among the different city sizes. Average values of population change rate depending on city type. Significant differences in each city type were clarified using Tukey’s HSD test. The significance level was set to 0.01 (p-value <.01).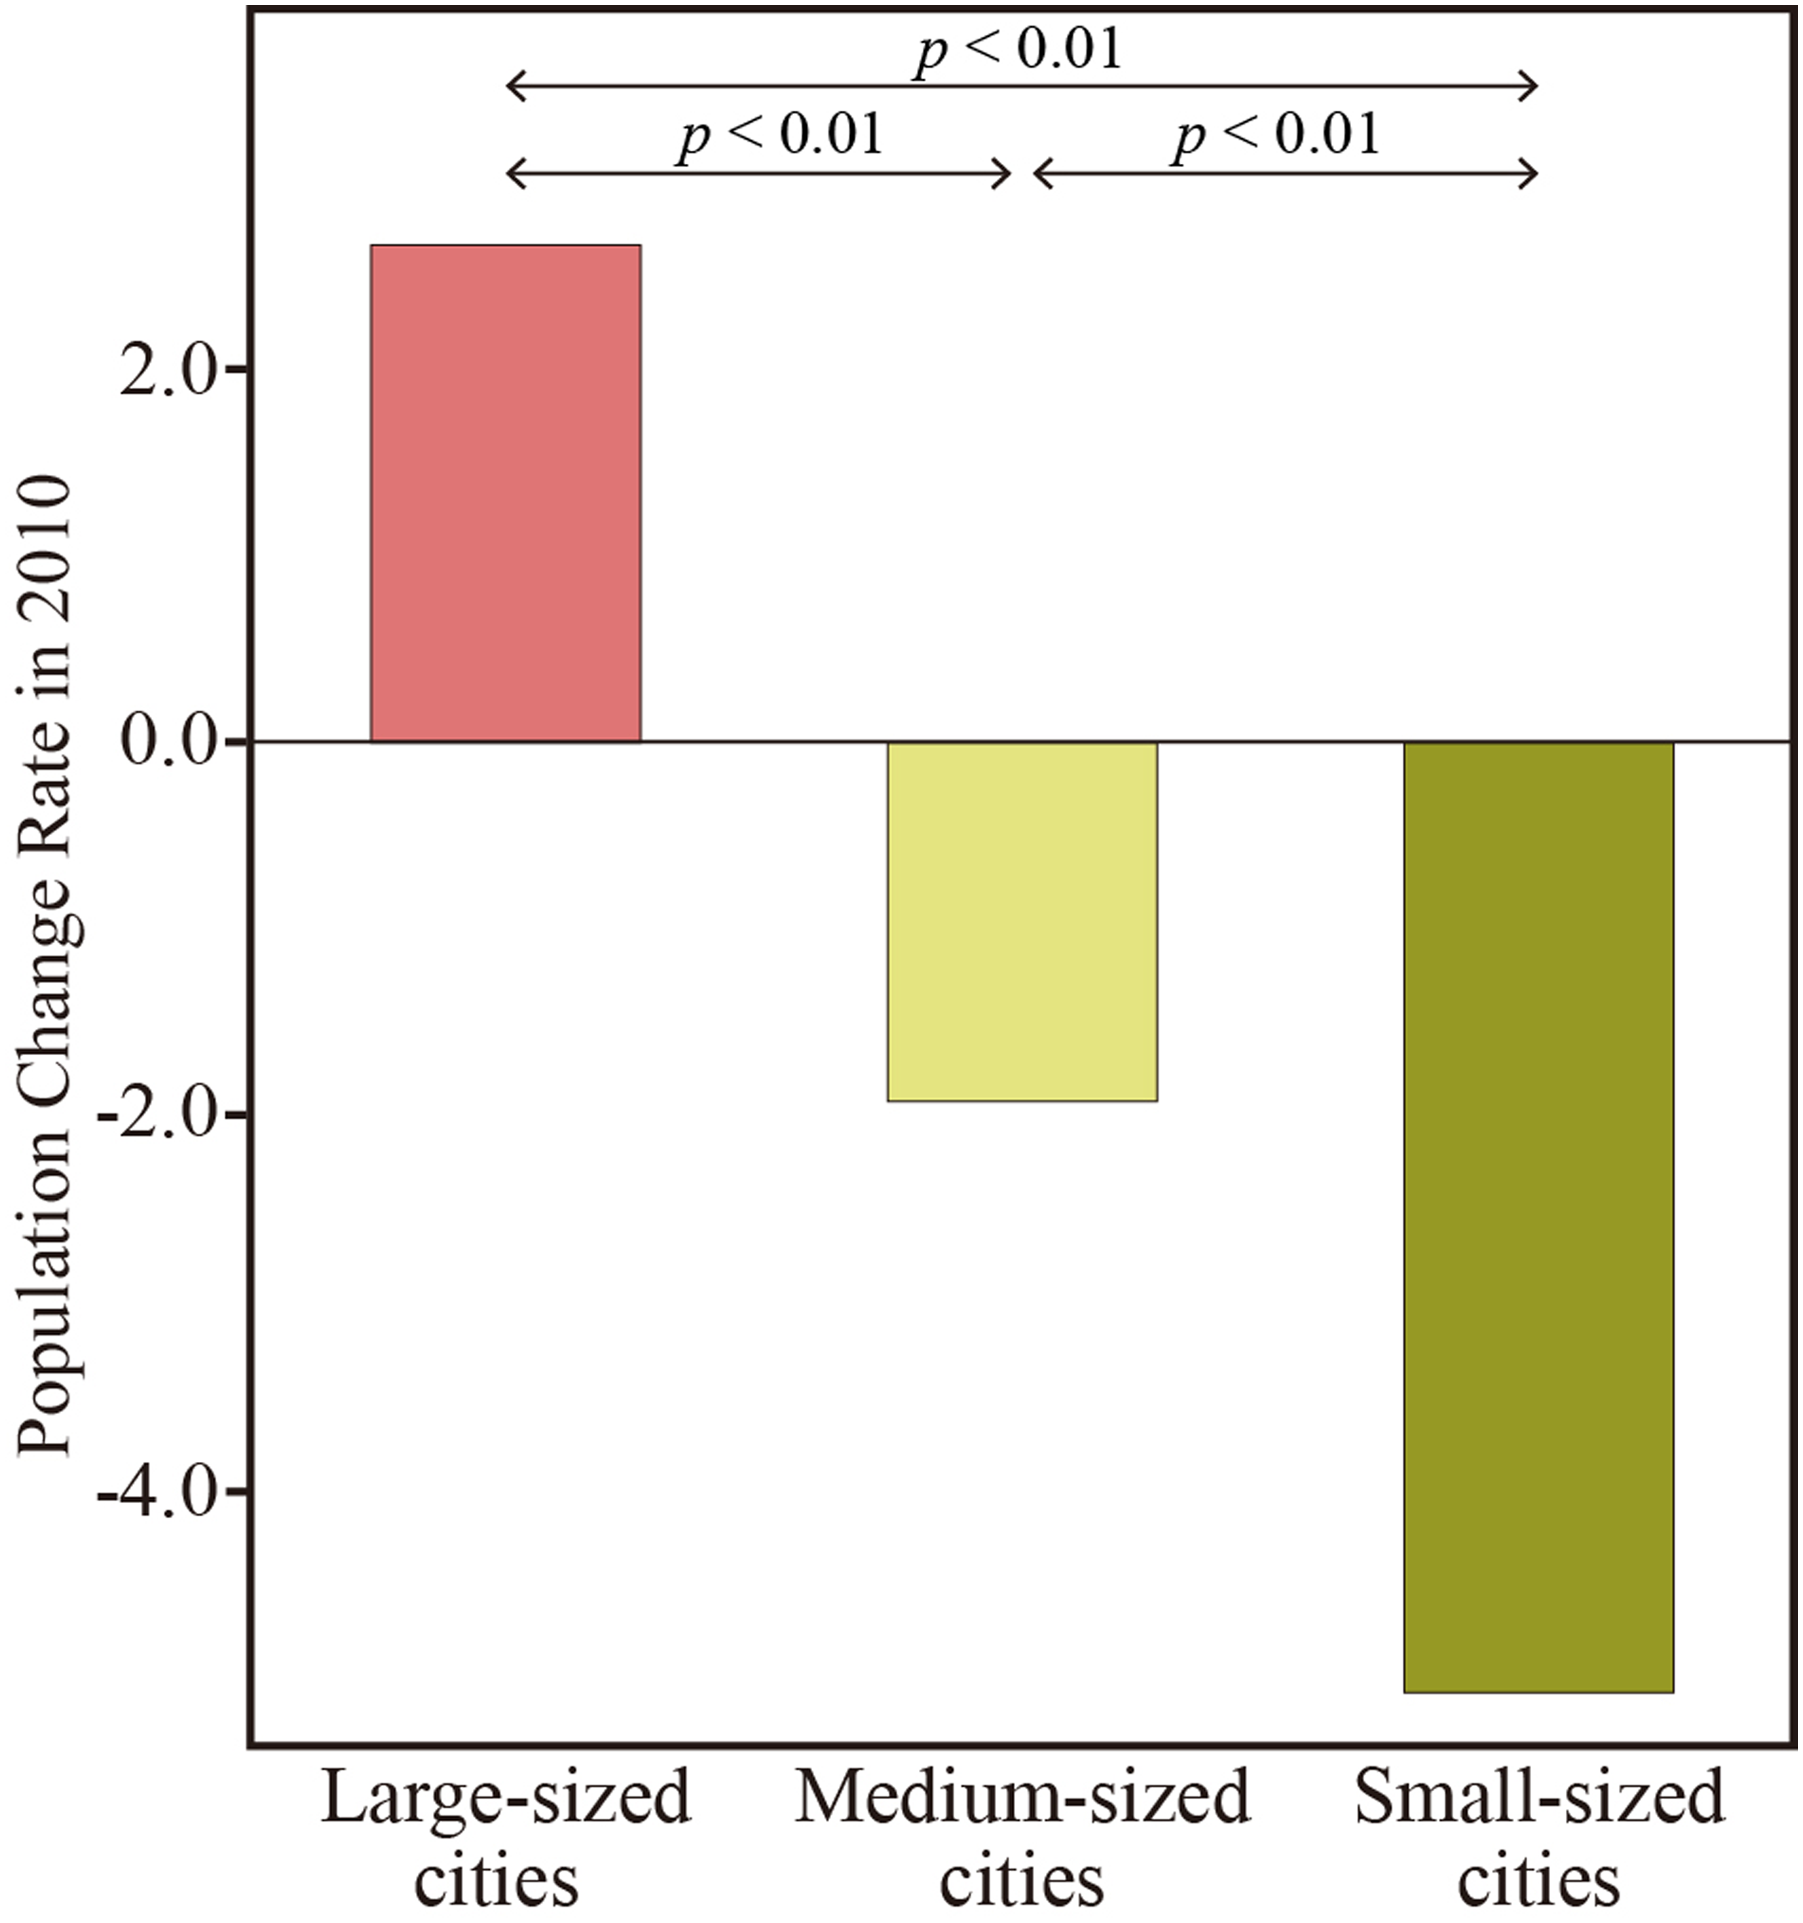
Figure 3 shows the PCR2010 for each city in Japan. In this figure, cities are classified into four categories based on their average PCR2010 scores in Figure 2: blue polygons have PCR2010 > −5.08 (N = 701), green polygons have −5.08 < PCR2010 < −1.92 (N = 398), yellow polygons have −1.92 < PCR2010 < 2.66 (N = 449), and red polygons have PCR2010 > 2.66 (N = 199). In more detail, there were 1304 shrinking cities, representing 74.6% of all cities in Japan, according to the definition of shrinking cities based on PCR2010 > −0.15. That is, three-quarters of Japanese cities are shrinking, according to the SCIRN definition. Population change rate in 2010. Left map (a) indicates the location of Japan and major East Asian cities. The right map (b) focuses on the Osaka Metropolitan area. The figure also shows population change in graduated colors, from red to blue.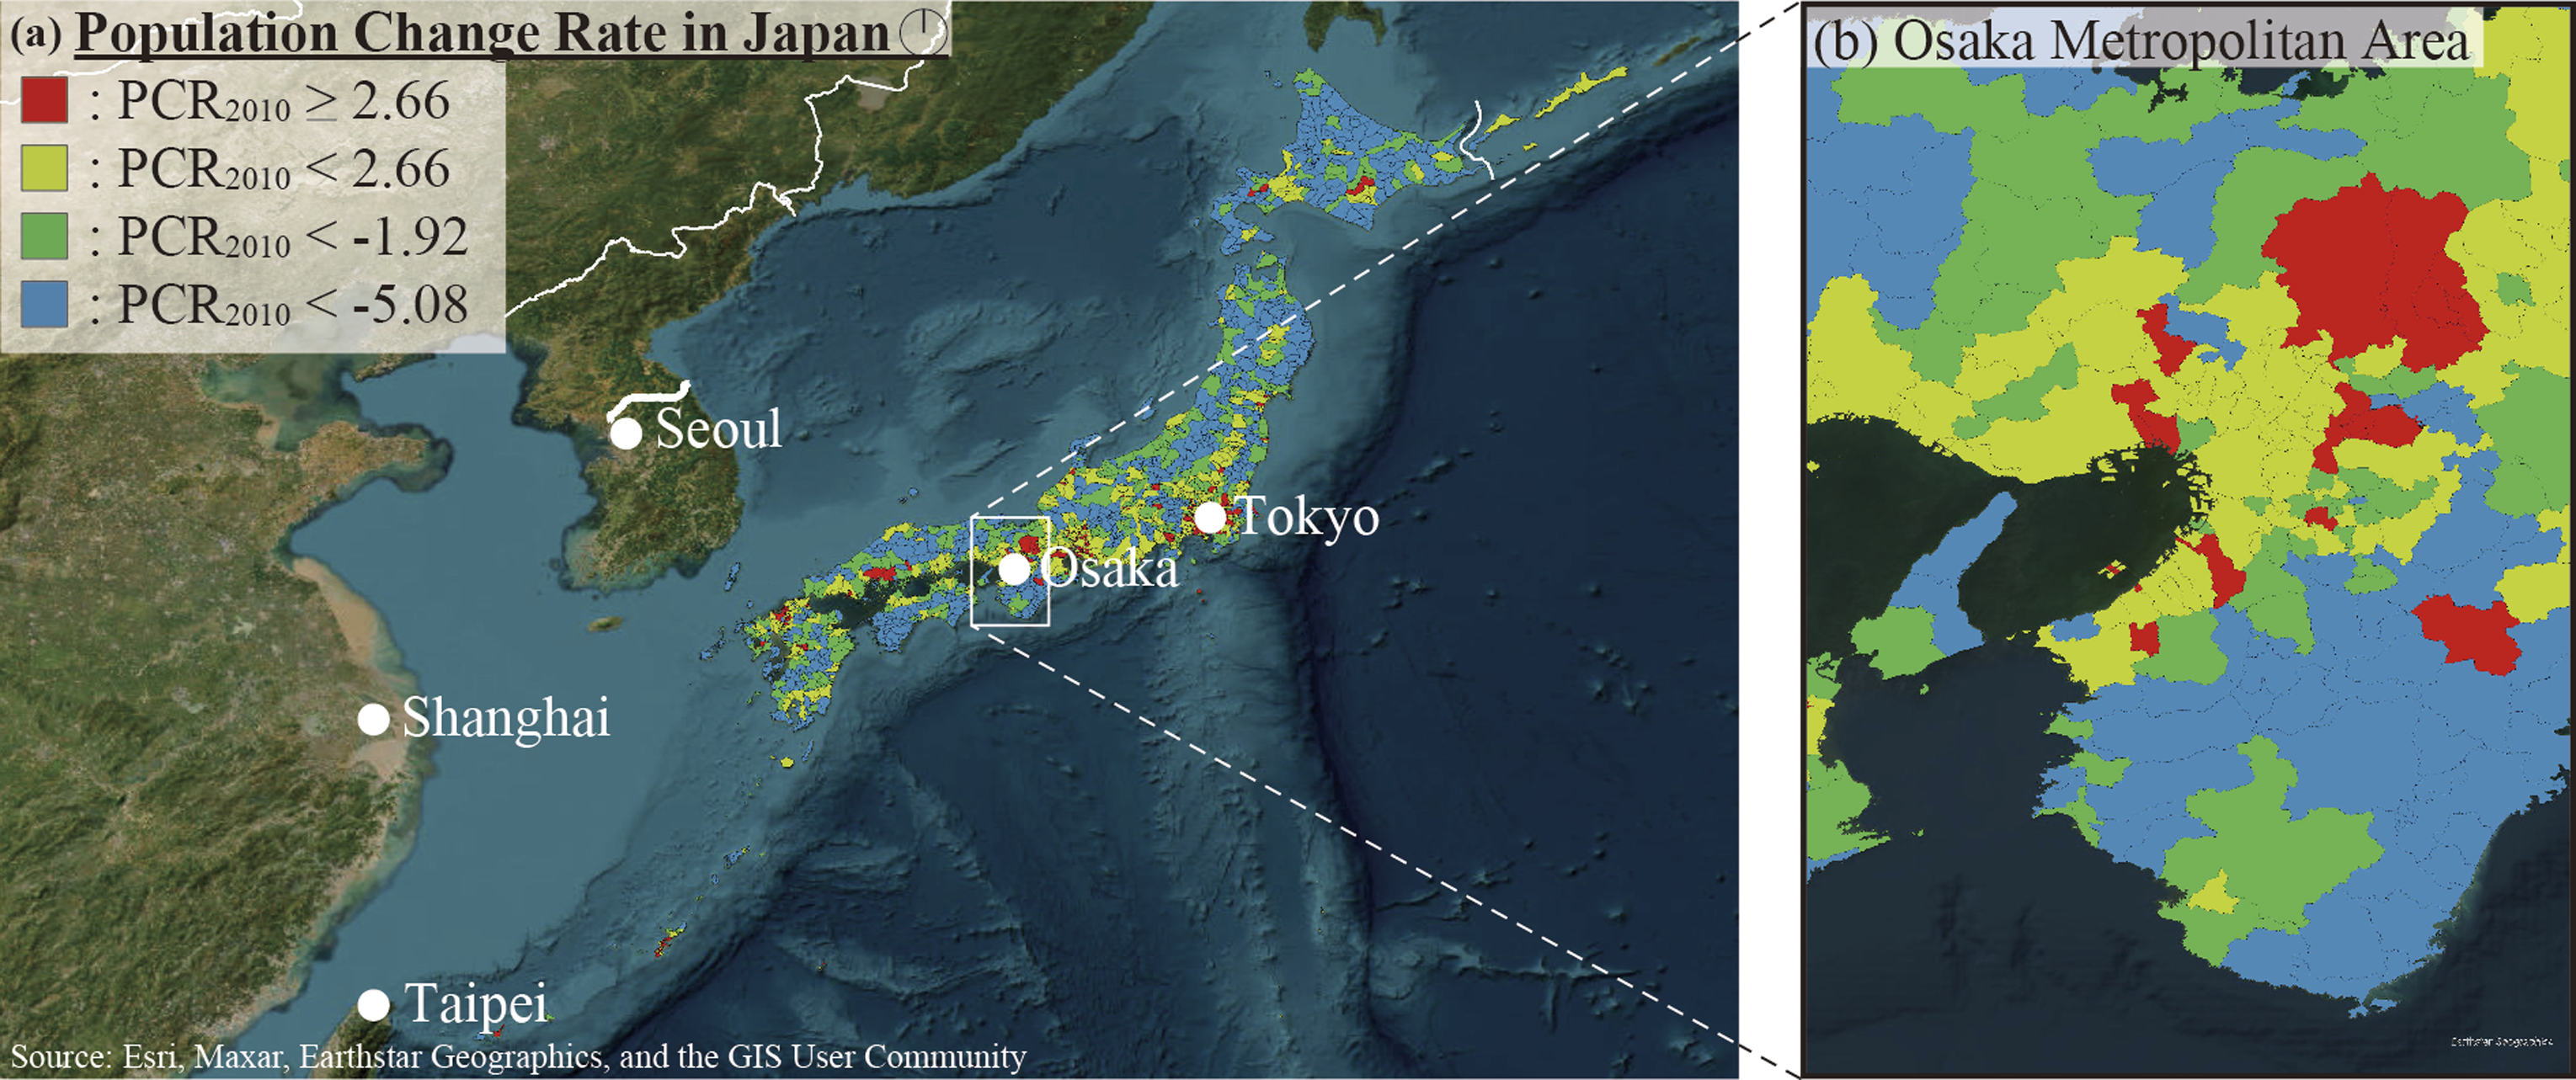
In Figures 2 and 3, cities with a positive high PCR2010 included many large-sized and some medium-sized cities. The results indicate that cities with a high PCR2010 tended to be located in urban centers. Cities with a medium PCR2010 were located in the periphery of those with a high PCR2010. In addition, approximately half of the cities had a low PCR2010. This includes medium-sized and small-sized cities located across the country in a continuous series of interconnected locations. Understanding the multidimensional factors that correlate with population change in cities is highly valuable.
Feature importance
Grid search of hyperparameters and evaluation metrics for each city size.
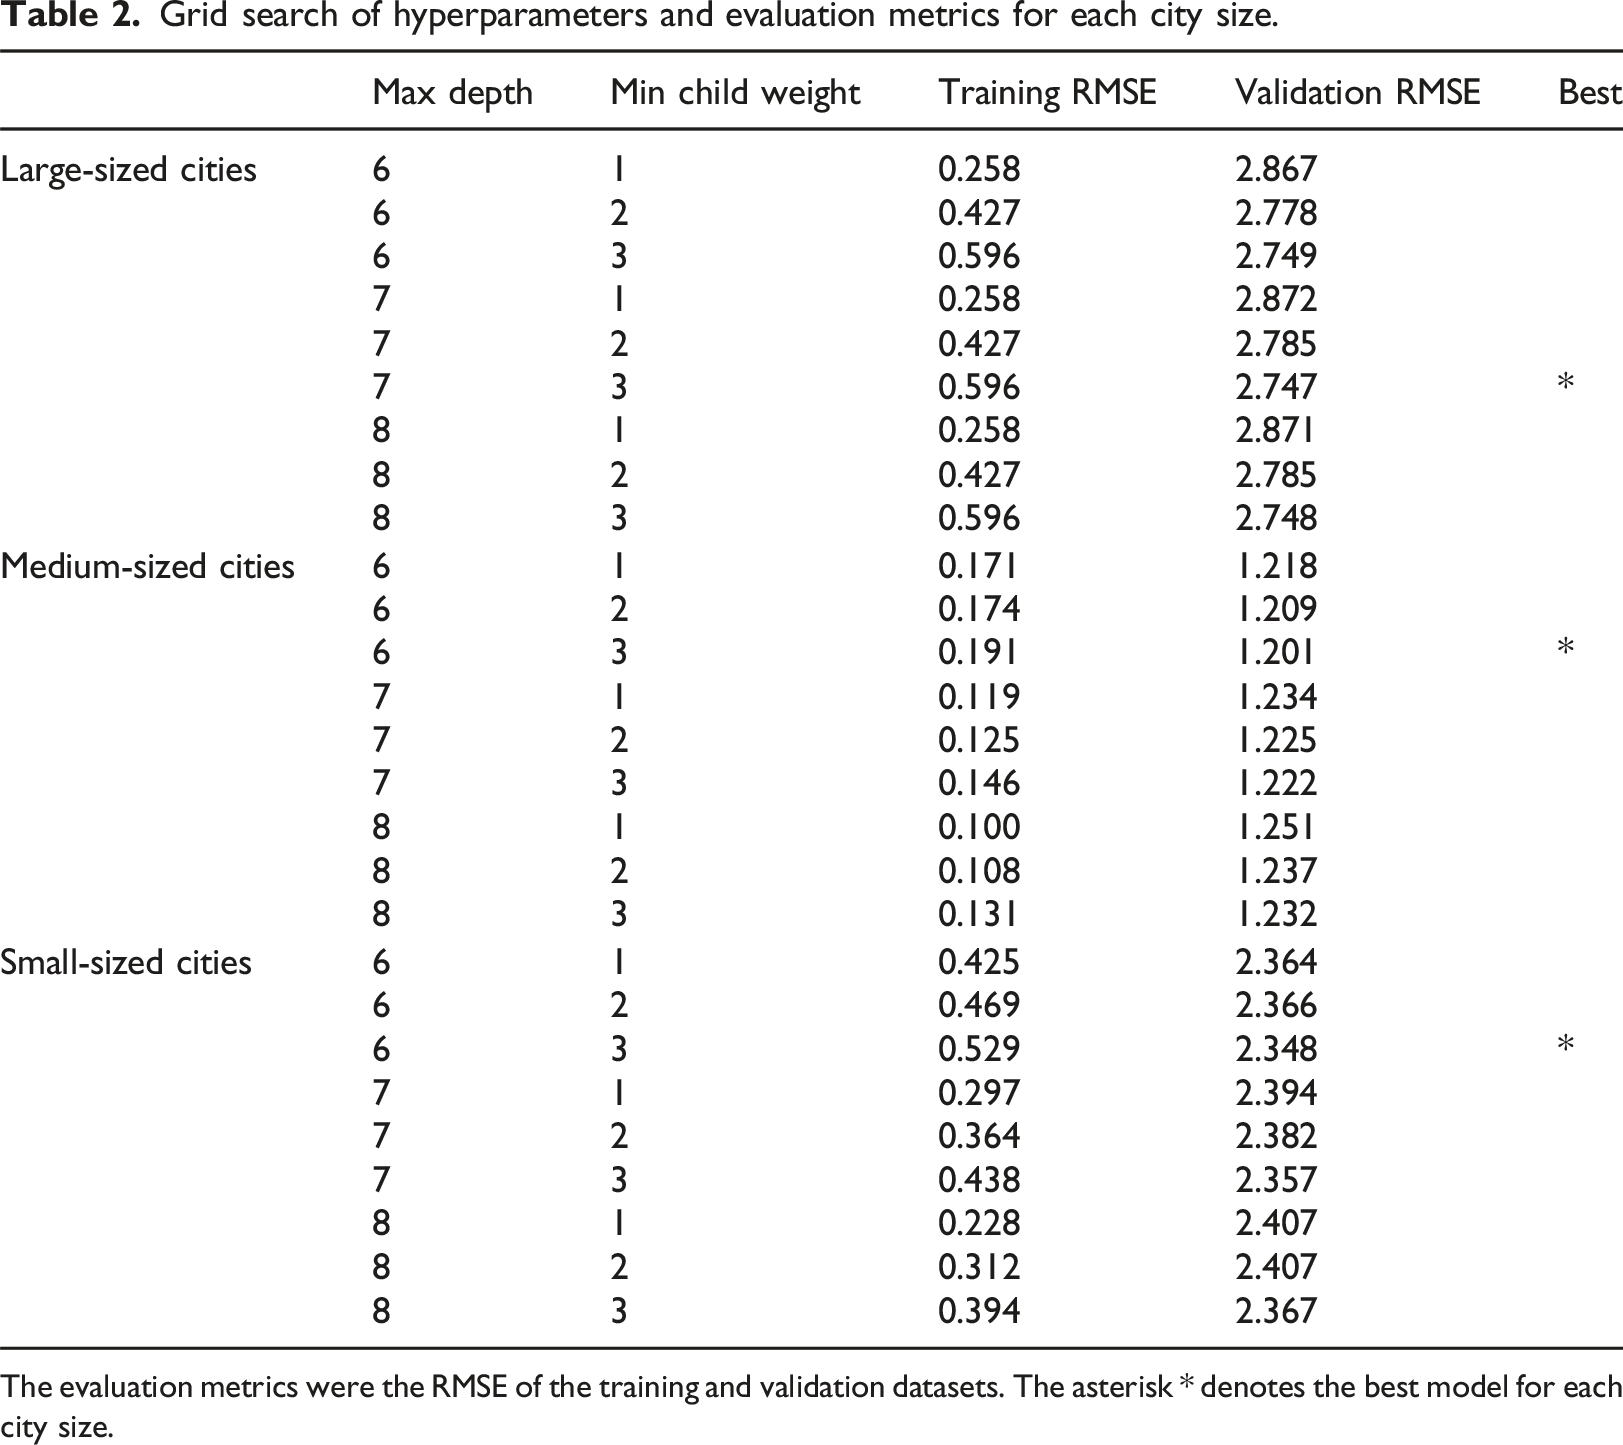
The evaluation metrics were the RMSE of the training and validation datasets. The asterisk * denotes the best model for each city size.
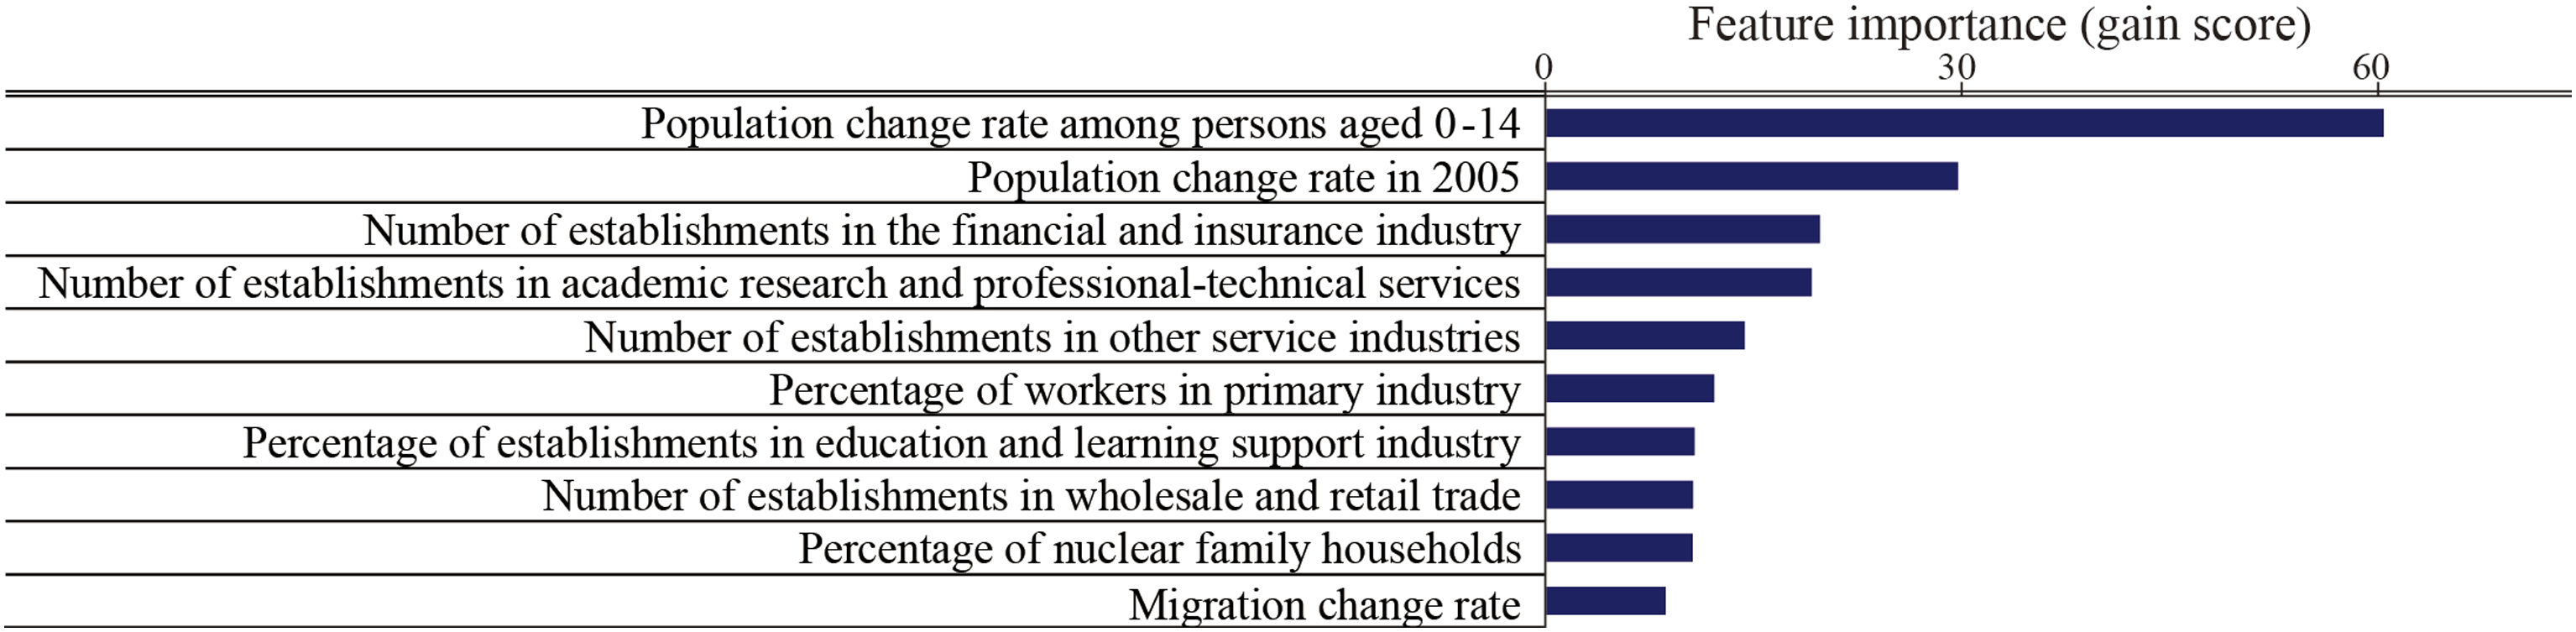
Feature importance (gain score) of large-sized cities. The 10 indicators with the highest F.I. among the 269 indicators are listed. The horizontal bars indicate F.I.
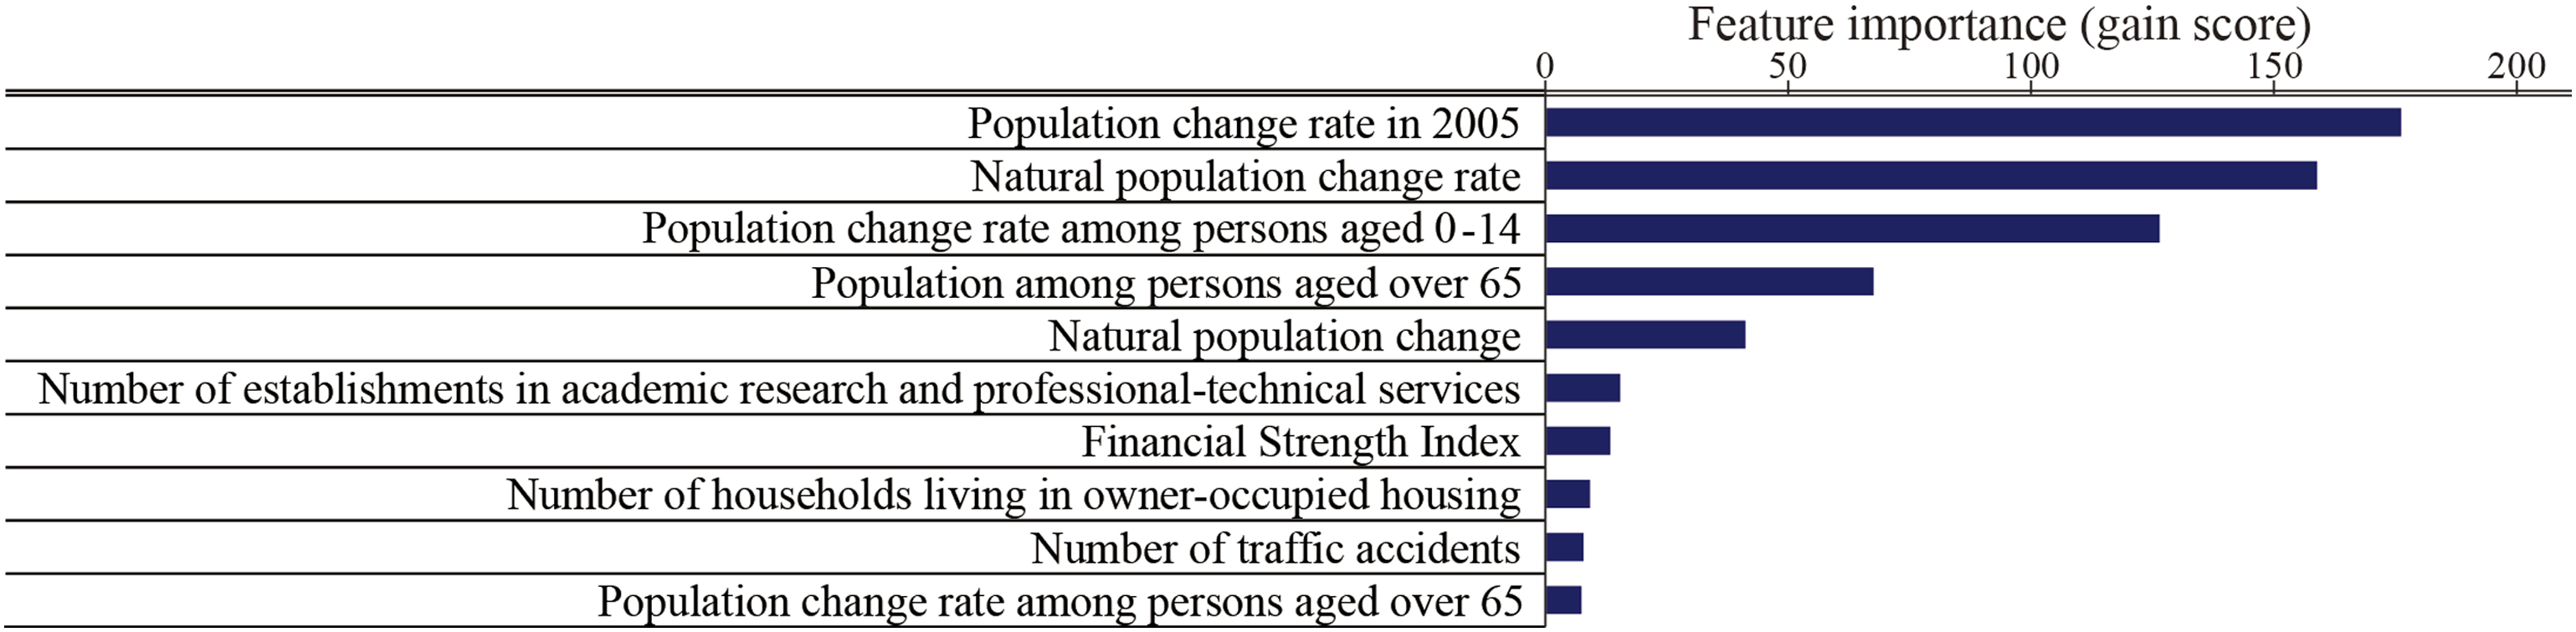
Feature importance (gain score) of medium-sized cities. The 10 indicators with the highest F.I. among the 269 indicators are listed. The horizontal bars indicate F.I.
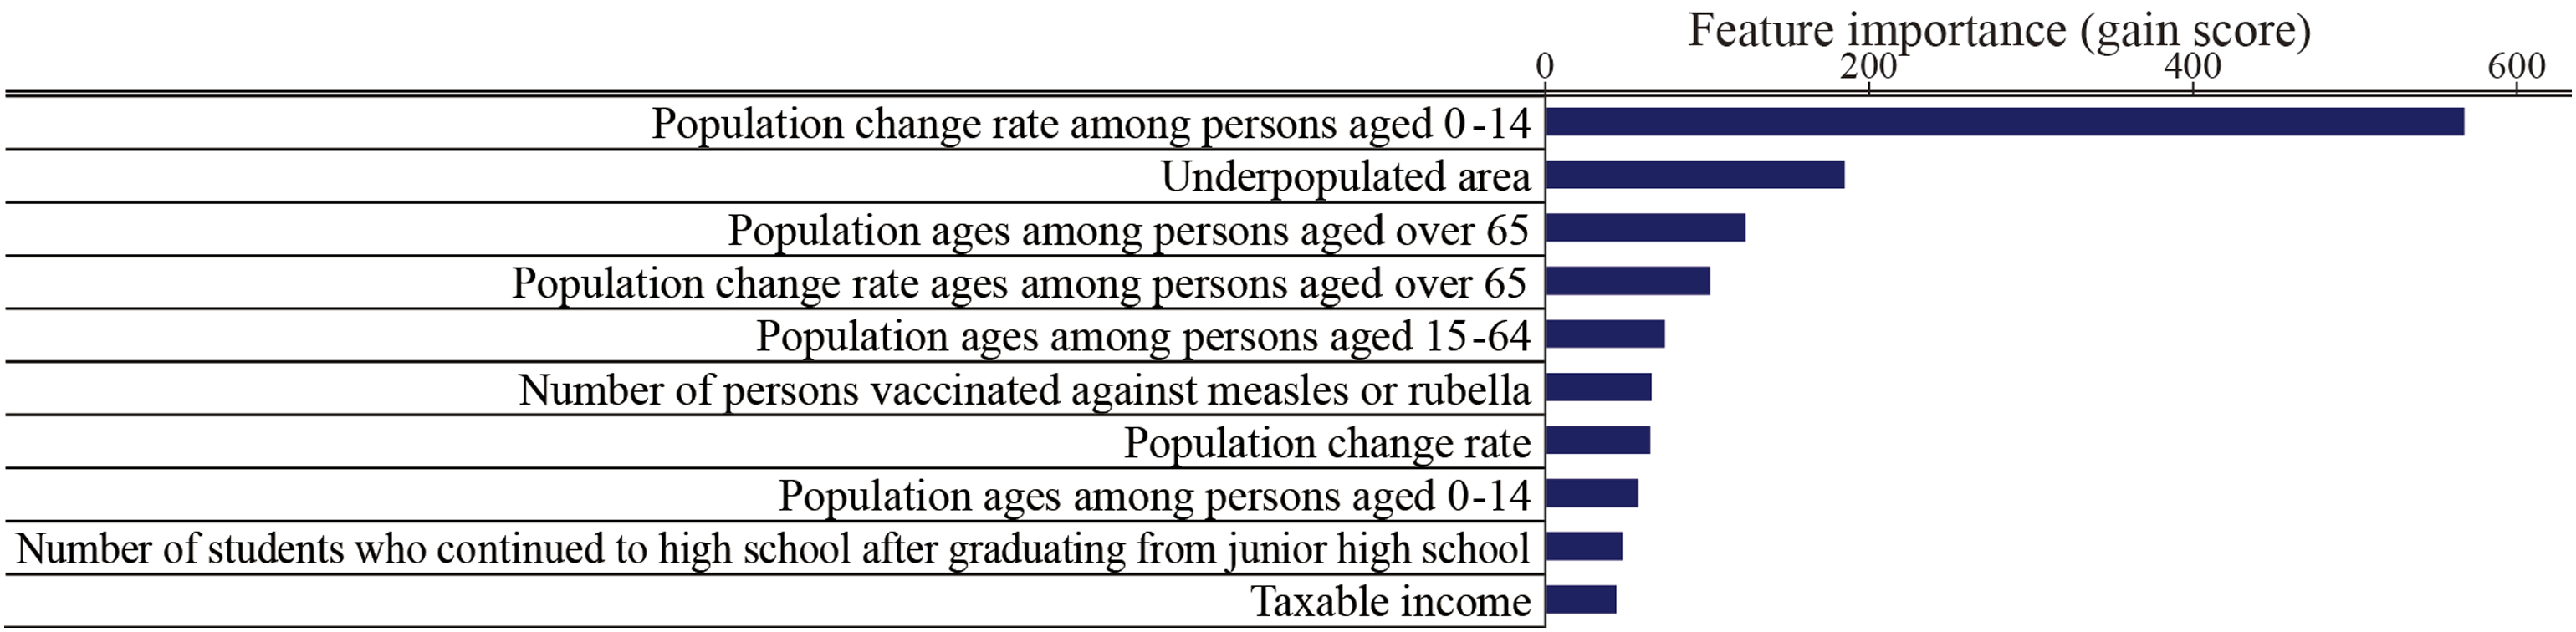
Feature importance (gain score) of small-sized cities. The 10 indicators with the highest F.I. among the 269 indicators are listed. The horizontal bars indicate F.I.
Large-sized cities
Figure 4 shows that PCR2010 was strongly correlated with social-related factors among the multidimensional data of the ESE index. These social-related factors were the population change rate among persons aged 0–14 years (F.I. = 60.41), the population change rate in 2005 (F.I. = 29.74), the percentage of nuclear family households (F.I. = 10.62), and the migration change rate (F.I. = 8.68). The PCR2010 in large-sized cities increased at a higher rate than that in small-sized and medium-sized cities. The results of the social-related indicators suggest that the migration of younger generations away from their hometowns might increase the inflow of the population into large-sized cities.
In addition to social-related indicators, industrial office indicators were strongly correlated with PCR2010 in large-sized cities. Industrial offices belong to the financial and insurance industries (F.I. = 19.78), academic research and professional-technical services (F.I. = 19.20), and education and learning support industries (F.I. = 10.75). In addition, PCR2010 was correlated with the migration change rate (F.I. = 8.68). The migration change rate is defined as the difference between the number of people moving in and out of a city (Statistics Bureau of Japan, 2023). These results suggest that the populations of large-sized cities may be related to their creative classes (Florida, 2002). This indicates that large-sized cities with numerous creative industries are likely to have larger populations. The results of the industrial office indicators show that large-sized cities provide jobs for an influx of young people.
Medium-sized cities
Figure 5 shows that PCR2010 was strongly related to the social-related indicators in the multidimensional data of the ESE index for medium-sized cities. These social-related factors were the population change rate in 2005 (F.I. = 176.15), natural population change (F.I. = 158.82), population change rate among persons aged 0–14 years (F.I. = 126.44), and population change rate among persons aged over 65 years (F.I. = 67.53). Natural population change is defined as the difference between the number of new births and deaths (Statistics Bureau of Japan, 2023). This result suggests that the reasons for the population decline in medium-sized cities are a low birth rate and an aging population, which are inevitable in Japan. This natural population change would also be related to PCR2010 correlating with the number of traffic accidents (F.I. = 7.86).
Other than social-related factors, PCR2010 was also correlated with the number of establishments in academic research and professional-technical services (F.I. = 15.42), as was the case for economic-related factors in large-sized cities. In addition to the industrial office indicators, the financial strength index was associated with PCR2010 (F.I. = 13.35) in medium-sized cities. The financial strength index is calculated by dividing standard financial revenue by standard financial demand. Therefore, medium-sized cities with strong financial resources are likely to maintain their populations by developing policies suitable for their urban characteristics. In addition, as a housing-related indicator, PCR2010 was correlated with the number of households living in owner-occupied housing (F.I. = 9.2). In medium-sized cities, PCR2010 was associated with owner-occupied housing rather than rental housing or other types of housing. Residents of medium-sized cities live in their own homes until the end of their lives, which is probably related to natural population decline.
Small-sized cities
In small-sized cities, similar to medium-sized cities, PCR2010 was strongly related to social-related factors in the multidimensional data of the ESE index in Figure 6. The social-related factors were the population change rate among persons aged 0–14 years (F.I. = 567.48), the population change rate for those aged over 65 years (F.I. = 101.76), the population change rate in 2005 (F.I. = 64.75), and the population aged 0–14 years (F.I. = 57.21). The results suggest that shrinking Japanese cities suffer from low birth rates and an aging population, except for large-sized cities. This problem is particularly serious in small-sized cities, which have a higher rate of population decline than medium-sized cities. Unlike medium-sized cities, natural population changes were not strongly related to PCR2010 for small-sized cities. Regarding natural population change issues in small-sized cities, an interesting result is that PCR2010 was related to the number of students who continued to high school after graduating from junior high school (F.I. = 47.68). This result suggests that educational problems might be related to population outflow in small-sized cities.
A feature of small-sized cities is that PCR2010 was related to underpopulated areas (F.I. = 184.82), which is an urban-planning-related indicator. Underpopulated areas were designated by the Japanese Ministry of Internal Affairs and Communications (MIC) based on the Act on Special Measures Concerning Support for the Sustainable Development of Depopulated Areas (MLIT, 2015). Small-sized cities designated as depopulated areas receive financial support from the Japanese MIC. However, the results suggest that this designation might have the risk of accelerating population decline in small-sized cities.
Discussion
This study examined the nonlinear multidimensional factors that correlate with population changes according to city size. The XGBoost algorithm was used to analyze the nonlinear relationship between PCR2010 and 269 multidimensional indicators in the ESE index. Using this algorithm, this study obtained accurate models of the complex factors that correlate with population decline. As a key result, according to the SCIRN definition, there are 1304 shrinking cities, representing 74.6% of all Japanese cities. The amounts and percentages of shrinking cities in Japan are higher than those in Europe; approximately 20% of European cities are classified as shrinking cities (Wolff and Wiechmann, 2018). The average value of PCR2010 in medium-sized cities (−1.92) and small-sized cities (−5.08) was significantly lower than that in large-sized cities.
Medium-sized cities have experienced a population decline, which correlates with low birth rates and an aging population. The results of this study show that natural population changes, such as the population change rate among persons aged 0–14 and over 65 years, correlate with PCR2010. In addition, this study indicates that feature importance of natural population change is higher than that of economic-related factors, such as the financial strength index and the number of academic research and professional-technical services. These results are similar to those of some previous studies (Döringer et al., 2020; Escudero-Gómez et al., 2023; Kato, 2023). However, this study’s novel findings are interesting because these social-related and economic factors were strongly correlated with PCR2010 in medium-sized cities, but not in small-sized and large-sized cities. These findings should encourage many medium-sized cities to develop policies to improve natural population change, financial strength index, and the number of academic research and professional-technical services in order to prevent population decline.
This study also indicated that the average PCR2010 in small-sized cities (−5.08) was significantly lower than that in medium-sized cities: that is, small-sized cities have experienced a population decline more rapidly than medium-sized cities. These results validate those of a previous study (Peng et al., 2023). PCR2010 was correlated with the population change rate among persons aged 0–14 years and the number of students who continued to high school after graduating from junior high school; natural population change was not strongly related to PCR2010 for small-sized cities. This result suggests that educational problems are related to population outflow in small-sized cities. Other than social-related factors, a feature of small-sized Japanese cities is that PCR2010 was related to the designation of underpopulated areas as urban-planning-related factors among multidimensional factors. This represents a unique finding in the Japanese context.
Certainly, there are cities in Japan with an increasing population increase. This includes many large-sized cities. In large-sized cities, the migration of younger generations away from their hometowns may increase population inflow. For example, in large-sized cities, PCR2010 correlated with the population change rate among persons aged 0–14 years, the percentage of nuclear households, and the migration change rate. In addition to social-related factors, industrial office indicators were strongly correlated with PCR2010 as economic-related factors among the multidimensional factors. This result is similar to findings on economic-related factors in large-sized cities (Martinez-Fernandez et al., 2012; Wang et al., 2020). Therefore, the results of this study for large-sized cities may be generalized in Japan, as well as worldwide.
The results of this study represent an empirical, statistical observation model obtained using the nonlinear relationship between the population change rate and multidimensional data using the ESE index, the latter of which is an enumeration of all cities in Japan. Compared to the findings of previous studies (Döringer et al., 2020; Guo et al., 2021; Iwasaki, 2021; Kato, 2023; Ma et al., 2022; Wang et al., 2020), the originality of this study lies in the different types of multidimensional factors that correlated with population dynamics, depending on city size. The differences in results according to city size indicate differences in the factors associated with population decline. In cities of all sizes, population changes correlated strongly with social-related indicators, such as the population change rate among persons aged 0–14 years in small-sized cities, natural population change in medium-sized cities, and migration change rate in large-sized cities. However, among the multidimensional factors, cities of different sizes are characterized by factors other than social-related indicators. Specifically, population changes correlated with the designation of underpopulated areas as urban planning-related factors in small-sized cities, the financial strength index as an economic-related factor in medium-sized cities, and industrial office indicators as economic-related factors in large-sized cities. The resulting differences may indicate the causes of population decline according to city size. Certainly, it is important to recognize the multifaceted nature of urban population dynamics and the interplay among various factors. These findings are valuable because they empirically identify interrelated multidimensional factors, including economic, social, and urban planning factors. This multifaceted factor approach could provide preliminary insights for urban policymakers to explore the various policy measures they must focus on as specific urban strategies, depending on the city’s size.
A limitation of this study is its short analysis period. This study analyzed 5-year population changes according to the SCIRN definition of shrinking cities (Aurambout et al., 2021). Despite the analysis period of just 5 years (2005–2010), this study was able to elucidate the complex factors correlated with the population change rate. The use of the XGBoost algorithm, which obtains accurate models by decreasing the risk of overfitting, contributed to this result. However, urban shrinkage is a long-term phenomenon. In addition, the rate of population change may affect multidimensional factors with a time lag. To overcome this limitation, researchers could combine recent and past datasets containing the ESE index of cities into decades of time-series data, and then apply the Granger causality test by focusing on the indicators clarified in the current study. Such an analysis would allow more thorough examination of the complex factors that drive population increase. The results could lead to the development of specific urban policies based on causal relationships.
Conclusion
This study clarified that Japan has 1304 shrinking cities, representing 74.6% of all cities. The number of shrinking cities in Japan is higher than that in Europe. Most shrinking cities in Japan are medium-sized cities (average values of PCR2010 = −1.92) and small-sized cities (average values of PCR2010 = −5.08). The result suggests that multidimensional factors that correlate with population changes vary by city size. Regarding the multidimensional factors, population change rates are strongly correlated with social-related indicators, such as the population change rate among persons aged 0–14 years in small-sized cities, the natural population change rate in medium-sized cities, and the migration change rate in large-sized cities. Other than social-related factors, population changes were correlated with the financial strength index as an economic-related factor in medium-sized cities. In addition, population changes were correlated with the designation of underpopulated areas as an urban-planning-related factor in small-sized cities. Due to urban complexity, population change dynamics are interrelated with multidimensional factors, including economic, social, and urban planning. This study’s findings from the empirical model could provide preliminary insights for urban policymakers to explore the various policy measures they need to focus on, depending on the city’s size.
These results implicate urban policies should be designed according to the size of the city. Medium-sized cities would effectively formulate policies other than urban planning. For example, reducing budgets related to urban planning and promoting childcare policies would contribute to improvements in natural population change and the financial strength index. Meanwhile, small-sized cities need to consider the designation of underpopulated areas. The designation of underpopulated areas in Japan is similar to a right-sizing policy that stabilizes dysfunctional markets and distressed neighborhoods by closely aligning the built environment of a city with the needs of existing and foreseeable future populations by adjusting the amount of land available for development (Schilling and Logan, 2008). However, implementing right-sizing policies in many cities is challenging (Ryan and Gao, 2019). Therefore, urban policymakers must propose right-sizing policies that consider the characteristics of small-sized cities (Batunova and Gunko, 2018). Finally, large-sized cities need to foster creative industries to increase the population. However, creative class policies have been reported to increase the risk of inequality and poor social justice in medium-sized cities in the United States (Heim Lafrombois and Park, 2023). Our finding suggests that creative class policies are effective only in large-sized cities in Japan.
However, this study’s results only show correlations between the population change rate and complex factors. Urban policymakers need to clarify the causal relationship as well as correlations in future studies. Therefore, future research would analyze the policies of advanced cities as natural experiments.
Supplemental Material
Supplemental Material - Multidimensional factors correlated with population changes according to city size in Japan
Supplemental Material for Multidimensional factors correlated with population changes according to city size in Japan by Haruka Kato in Environment and Planning B: Urban Analytics and City Science
Footnotes
Declaration of Conflicting Interests
The author(s) declared no potential conflicts of interest with respect to the research, authorship, and/or publication of this article.
Funding
The author(s) disclosed receipt of the following financial support for the research, authorship, and/or publication of this article: This work was supported by Japan Society for the Promotion of Science (21K14318, 23H01590, 24K17421).
Data Availability Statement
Economic, social, and educational index cannot be shared publicly because of government confidentiality. Data are available from the Japanese Ministry of Education, Culture, Sports, Science, and Technology (MEXT) Institutional Data Access for researchers who meet the criteria for access to confidential data.
Supplemental Material
Supplemental material for this article is available online.
References
Supplementary Material
Please find the following supplemental material available below.
For Open Access articles published under a Creative Commons License, all supplemental material carries the same license as the article it is associated with.
For non-Open Access articles published, all supplemental material carries a non-exclusive license, and permission requests for re-use of supplemental material or any part of supplemental material shall be sent directly to the copyright owner as specified in the copyright notice associated with the article.