
Abstract
Over the course of the last decade, sharing economy platforms have experienced significant growth within cities around the world. Airbnb, which is one of the largest and best-known platforms, provides the focus for this paper and offers a service that allows users to rent properties or spare rooms to guests. Its rapid growth has led to a growing discourse around the consequences of Airbnb rentals within the local context. The research within this paper focuses on determining impact on local housing prices within the inner London boroughs by constructing a longitudinal panel dataset, on which a fixed and random effects regression was conducted. The results indicate that there is a significant and modest positive association between the frequency of Airbnb and the house price per square metre in these boroughs.
Introduction
Background
The so called ‘sharing economy’ is a new and rapidly growing sector that revolves around the sharing of existing under-utilised physical assets on digital platforms, enabling the interaction of private sellers and private buyers (Allen, 2015: 25; Srnicek, 2017; Wallsten, 2015). Recent technological advancements, such as the proliferation of internet access and smart phones, has not only accommodated the rise in activity within this sector, but also shifted a large proportion of economic activity to the internet, which has since been coined the new ‘mother platform’ of economic activity (Kenney et al., 2015). Two of the biggest names within the sharing economy – Uber and Airbnb – were valued at over $30bn each in 2017 (Isaac, 2017). The peer-to-peer nature of Airbnb (founded in 2008) enables ‘hosts’ to advertise (‘list’) their spare living spaces to ‘guests’, who can use the website or mobile application to book short-term accommodation (Quattrone et al., 2016). The students who created the platform set out to provide an alternative to hotels, helping travellers save money and gain a more local experience (Lee, 2016). It now offers over six million listings in over 191 countries (Airbnb, 2019).
The platform allows anyone to sign-up to become a host and is constrained by relatively few regulations, in comparison to the incumbent hotel industry, meaning that the barriers to entry for new users are low (Coyle and Yeung, 2016). For example, in London (United Kingdom (UK)) Airbnb hosts are only required to ensure that their building lease, mortgages and landlords allow for the property to be sublet in the first instance. They are then subject to the 90-day restriction, if it is an entire home listing, which limits the number of nights hosts can rent out their property within a year. The optimist’s argument for the platform – and the sharing economy more broadly – is that hosts can gain extra income from the utilisation of their spare assets, while guests can benefit from a more local experience. This can also bring broader benefits to the surrounding areas with research showing that those guests staying in Airbnb accommodation spend more in the local economy as well as hosts acquiring additional disposable income which they can also spend within the locality (Airbnb, 2014; Kaplan and Nadler, 2015; Quattrone et al., 2016). In turn, this has a ‘multiplier effect’, helping local areas to grow and develop (Harrison et al., 2017). Benefits also extend beyond those within the local economy, with the reduction of environmental impacts around energy, waste, water and greenhouse gases (Airbnb, 2014).
However, there is also a rapidly growing body of literature that has identified a range of negative externalities associated with Airbnb and short-term rentals (STRs) in general. For example issues such as racial discrimination (Cheng and Foley, 2018; Edelman and Luca, 2014; Edelman et al., 2017) and gentrification (Gant, 2016; Lee, 2016; Wachsmuth and Weisler, 2018) as well as economic concerns regarding the struggle between the incumbent hotel industry and the new sharing economy have been acknowledged (Gutierrez et al., 2017; Quattrone et al., 2016; Zervas et al., 2017). In addition, local housing dynamics have been affected in some areas (Barron et al., 2017; Sheppard and Udell, 2016) with Airbnb listings reducing supply and thus increasing local house prices (Ayouba et al., 2019; Barron et al., 2017; Boone, 2018; Lee, 2016; Shabrina et al., 2019; Szabo, 2017).
This research will build on this growing body of work by seeking to quantify the impact of Airbnb on local housing markets. This paper follows the creation of a longitudinal panel dataset which has been used to understand the relationship between the number of listings and house prices (£per m2) within inner London boroughs.
Literature review
The growth of the sharing economy has been controversial. Advocates (usually users and beneficiaries) highlight the positive aspects of the sharing economy, whilst critics emphasise its negative externalities. There is a growing body of research spanning these perspectives but, as this literature review demonstrates, the central concern in Airbnb’s case is the impact of a growing number of listings on the value of local housing and its knock-on effects for the availability of housing for residents (Sheppard and Udell, 2016).
The growth of house sharing platforms has led to the growth of using property as investments in the STR market. This has shifted the views on property and housing away from a ‘shelter’ and a human right, towards an investment vehicle which has incited strong opposition from local residents who have been impacted by the arrival of Airbnb (Bone, 2014). This can be exemplified by the increasing number of ‘hosts’ who have more than one listing and in some cases, listings in cities around the world (Boone, 2018; Lee, 2016; Schor, 2014). These ‘hosts’ are typically commercial operators or individual investors who are using Airbnb as an advertising platform for their STR businesses (Boone, 2018). Therefore, the growing commercialisation of Airbnb listings has been a large contributing factor to the rapid growth of Airbnb listings in many cities. This is contrary to the ideologies of the sharing economy and seen as exploiting the growth of Airbnb, in turn, exacerbating the effects of existing housing crises (Edelman and Geradin, 2015).
This is especially true in Los Angeles (LA), which suffers from an affordable housing crisis that has created unrest in the city, with the average residents spending nearly 50% of their household income on housing alone (Lee, 2016; Szabo, 2017). There is evidence that the growth of Airbnb listings within the city has led to increased rent, increased gentrification and commercialisation as greater profits and cheaper costs incentivise a shift towards STRs (Bowers, 2017; Schor, 2014). This is similar to the housing market in Barcelona and New York, where the limited supply in central and tourist regions is increasing pressure, causing these areas to become increasingly gentrified (Gant, 2016; Wachsmuth and Weisler, 2018). Iceland is an extreme case in which the increase in STRs within the city of Reykjavik has led to the ‘total dying’ of the long-term rental market (Woolf, 2016). The increasing commercialisation has been identified as one of the major issues which are exacerbating issues on local housing supply (Boone, 2018; Lee, 2016). With little regulation and bureaucracy around the use of Airbnb as a platform for commercial use, small firms and investors are manipulating the essence of the sharing economy and utilising the space as a means to invest (Gant, 2016; Lee, 2016).
Although limited, there are studies which have conducted quantitative analysis on the relationships between Airbnb and local housing and rental prices. Szabo (2017), Barron et al. (2017), Sheppard and Udell (2016) and Zervas et al. (2017) are among the first to implement statistical methods to assess the impacts of Airbnb on the housing market. Both Zervas et al. (2017) and Sheppard and Udell (2016) use a difference in difference technique in order to assess the impacts of Airbnb listings on local house prices in Texas and New York respectively. Zervas et al. (2017) find that if there is a 10% increase in the number of listings, there is a 0.34% decrease in monthly hotel revenues. Sheppard and Udell (2016) build on this utilising a similar technique in order to be able to assess the impacts on local house prices. Here they find that doubling the total number of Airbnb listings is associated with a 6.46% increase in property prices. They caveat this by mentioning that although Airbnb may be associated with an increase in local house prices, there are other benefits to the community which need to be taken into account and therefore may not ‘diminish community well-being’ (Sheppard and Udell, 2016: 39).
Szabo (2017) investigates how the Ellis Act (1985), which permits the eviction of rent-controlled tenants in cases where the entire property is removed from the rental market (Poston and Khouri, 2016), facilitates an increase in the number of Airbnb listings within LA. Szabo utilises a fixed effects regression method to investigate this relationship and finds a strong positive correlation for all zip codes in LA, showing a strong shift in the use of housing into the STR market (Szabo, 2017). This removal of accommodation from the housing supply is a major driver of increased local house prices (Schäfer and Braun, 2016).
Barron et al. (2017) investigate how the increasing number of Airbnb listings has impacted housing and rental prices, again utilising a fixed effects regression analysis. In this analysis, the authors regress data on housing and rental prices at the zip code level in the United States against the number of listings, using an instrumental variable of Google search interest as a way to control for any endogeneity within the investigation. The study finds a small positive correlation between the listings and both housing and rental prices, as well as helping explain 0.27 and 0.49% of the changes in housing and rental prices between 2012 and 2016 respectively (Barron et al., 2017).
Airbnb is one of many direct influences on the complex housing market and therefore it is difficult to establish causal relationships between these variables. Coyle and Yeung (2016) emphasise the importance of context when investigating these relationships between Airbnb and local hotel and renting markets. The necessity for ‘policy makers to have evidence specific to their own locations’ (Coyle and Yeung, 2016: 4) has led this research to investigate this relationship in London, a city that is yet to be examined. Building on the techniques highlighted in this literature review, this research aims to extend the understanding of this complex relationship.
Methodology
Data sources and manipulation
For the purposes of this study, datasets were obtained from multiple sources with the intention of creating a longitudinal panel data frame. The Airbnb data were sourced from AirDNA, a private Airbnb data and analytics company which aims to turn ‘industry-savvy, STR data into strategic, actionable analytics’ (AirDNA, 2019). The company scrapes the Airbnb website in order to gather its data from 80,000 cities around the world. This data were supplied through the Economic Social Research Council Consumer Data Research Centre and contains data on the available listings in London on a monthly basis, including their location. For the purposes of this study, the coordinates of each listing were spatially aggregated, by counting the number of listings in each Lower Super Output Area (LSOA), for each month from January 2015 to May 2018.
The house price information in this paper is a mixture of Land Registry Price Paid data and Energy Performance Certificates (EPCs) from the Ministry of Housing Communities and Local Government (MHCLG). The Price Paid data contain information on all houses sold in England and Wales since January 1995, including the price and date at which each property was sold. The EPC data contain information on the energy efficiency of buildings in the European Union, which is a mandatory requirement for any house being sold or put up for rent. This dataset contains a range of attributes covering the physical properties of each type of accommodation including the total floor area, its energy efficiency rating, the number of extensions it has had, the property type and the likely carbon dioxide emissions (full list of variables can be found in online supplementary material). By matching the Price Paid data to the EPC certificates data at the address level, we are able to combine each property’s price to its energy efficiency rating. This enables us to calculate the price per square meter (£per m2) of each property sold. As with the Airbnb listings, this was spatially and temporally aggregated to the LSOA level for each month.
We also used the indices of multiple deprivation (IMD) score from 2015 as our main confounding variable within this analysis. The IMD is a relative measure of deprivation within small geographic areas around the UK, which is produced by the MHCLG and provides a great parameter to control for differences between LSOAs due to its composition. The IMD is calculated using weighted measures in seven main areas; income, employment, education, health, crime, barriers to housing and services and living environment. These are combined to create an overall score for each area and give a good holistic understanding of how these small areas compare.
The Airbnb and house price data were then combined to coincident temporal and spatial levels and IMD score treated as a separate time-independent fixed variable. The resulting data created have two hierarchical levels. The data are first nested within each LSOA, allowing for a comparison between LSOAs, as well as being nested by time (month and year), enabling a temporal analysis. Therefore, each row in the dataset contains the counts of Airbnb listings as well as the average house price (£per m2). There were instances where there were no sales and therefore no values for house prices within a LSOA and within that particular month, therefore it was necessary to impute these values based on the unadjusted multiple imputations using the nearest neighbour algorithm. In this case, for each LSOA, the algorithm takes the nearest before and after monthly house price values to predict the missing value that falls between them. The complete data were first run through a fixed effects regression to enable a holistic understanding of the impacts of Airbnb listings across London, which was later extended to hierarchical linear model analysis to assess the impacts of the number of Airbnb listings in each LSOA on the local house price (£per m2).
Study area selection
We chose London (UK) as our region of interest primarily due to its chronic housing shortage and the popularity of Airbnb given its status as a major tourist and business travel destination. London has an estimated population of 8.9 million inhabitants and is administratively organised into 32 boroughs (12 inner London boroughs, 20 outer London boroughs and the City of London), which can be further sub-divided into 4830 statistical units known as LSOAs. LSOAs contain between 1000 and 3000 inhabitants with a total number of households ranging between 400 and 1200.
Prior to conducting statistical analysis on the relationship between Airbnb listings and local house prices, a series of exploratory analysis techniques were employed to gain a deeper contextual understanding. The primary method employed was a series of choropleth maps, which were used to depict the changes in the spatial distribution of Airbnb listings and aggregate house prices (£per m2) throughout the years for which we have data.
Figure 1 depicts the results of the changes in the spatial distribution of Airbnb listings. Here, we find that the majority of Airbnb listings within the Greater London area are concentrated within the inner London boroughs. Between 2015 and 2018, we find that the listings increase in concentration in the centre of the city. In 2017, there was an average of over 25 listings in each inner London LSOA, whilst 20% of outer London LSOAs had no listings. We see a similar spatial distribution when considering the average house price (£per m2), which is depicted in Figure 2. Here we find that properties at a LSOA-level typically exceed £12,000 per m2, and that such patterns tend to be spatially concentrated in the inner London boroughs. Unlike Airbnb listings, the spatial distribution of average house prices appears to vary less temporally.
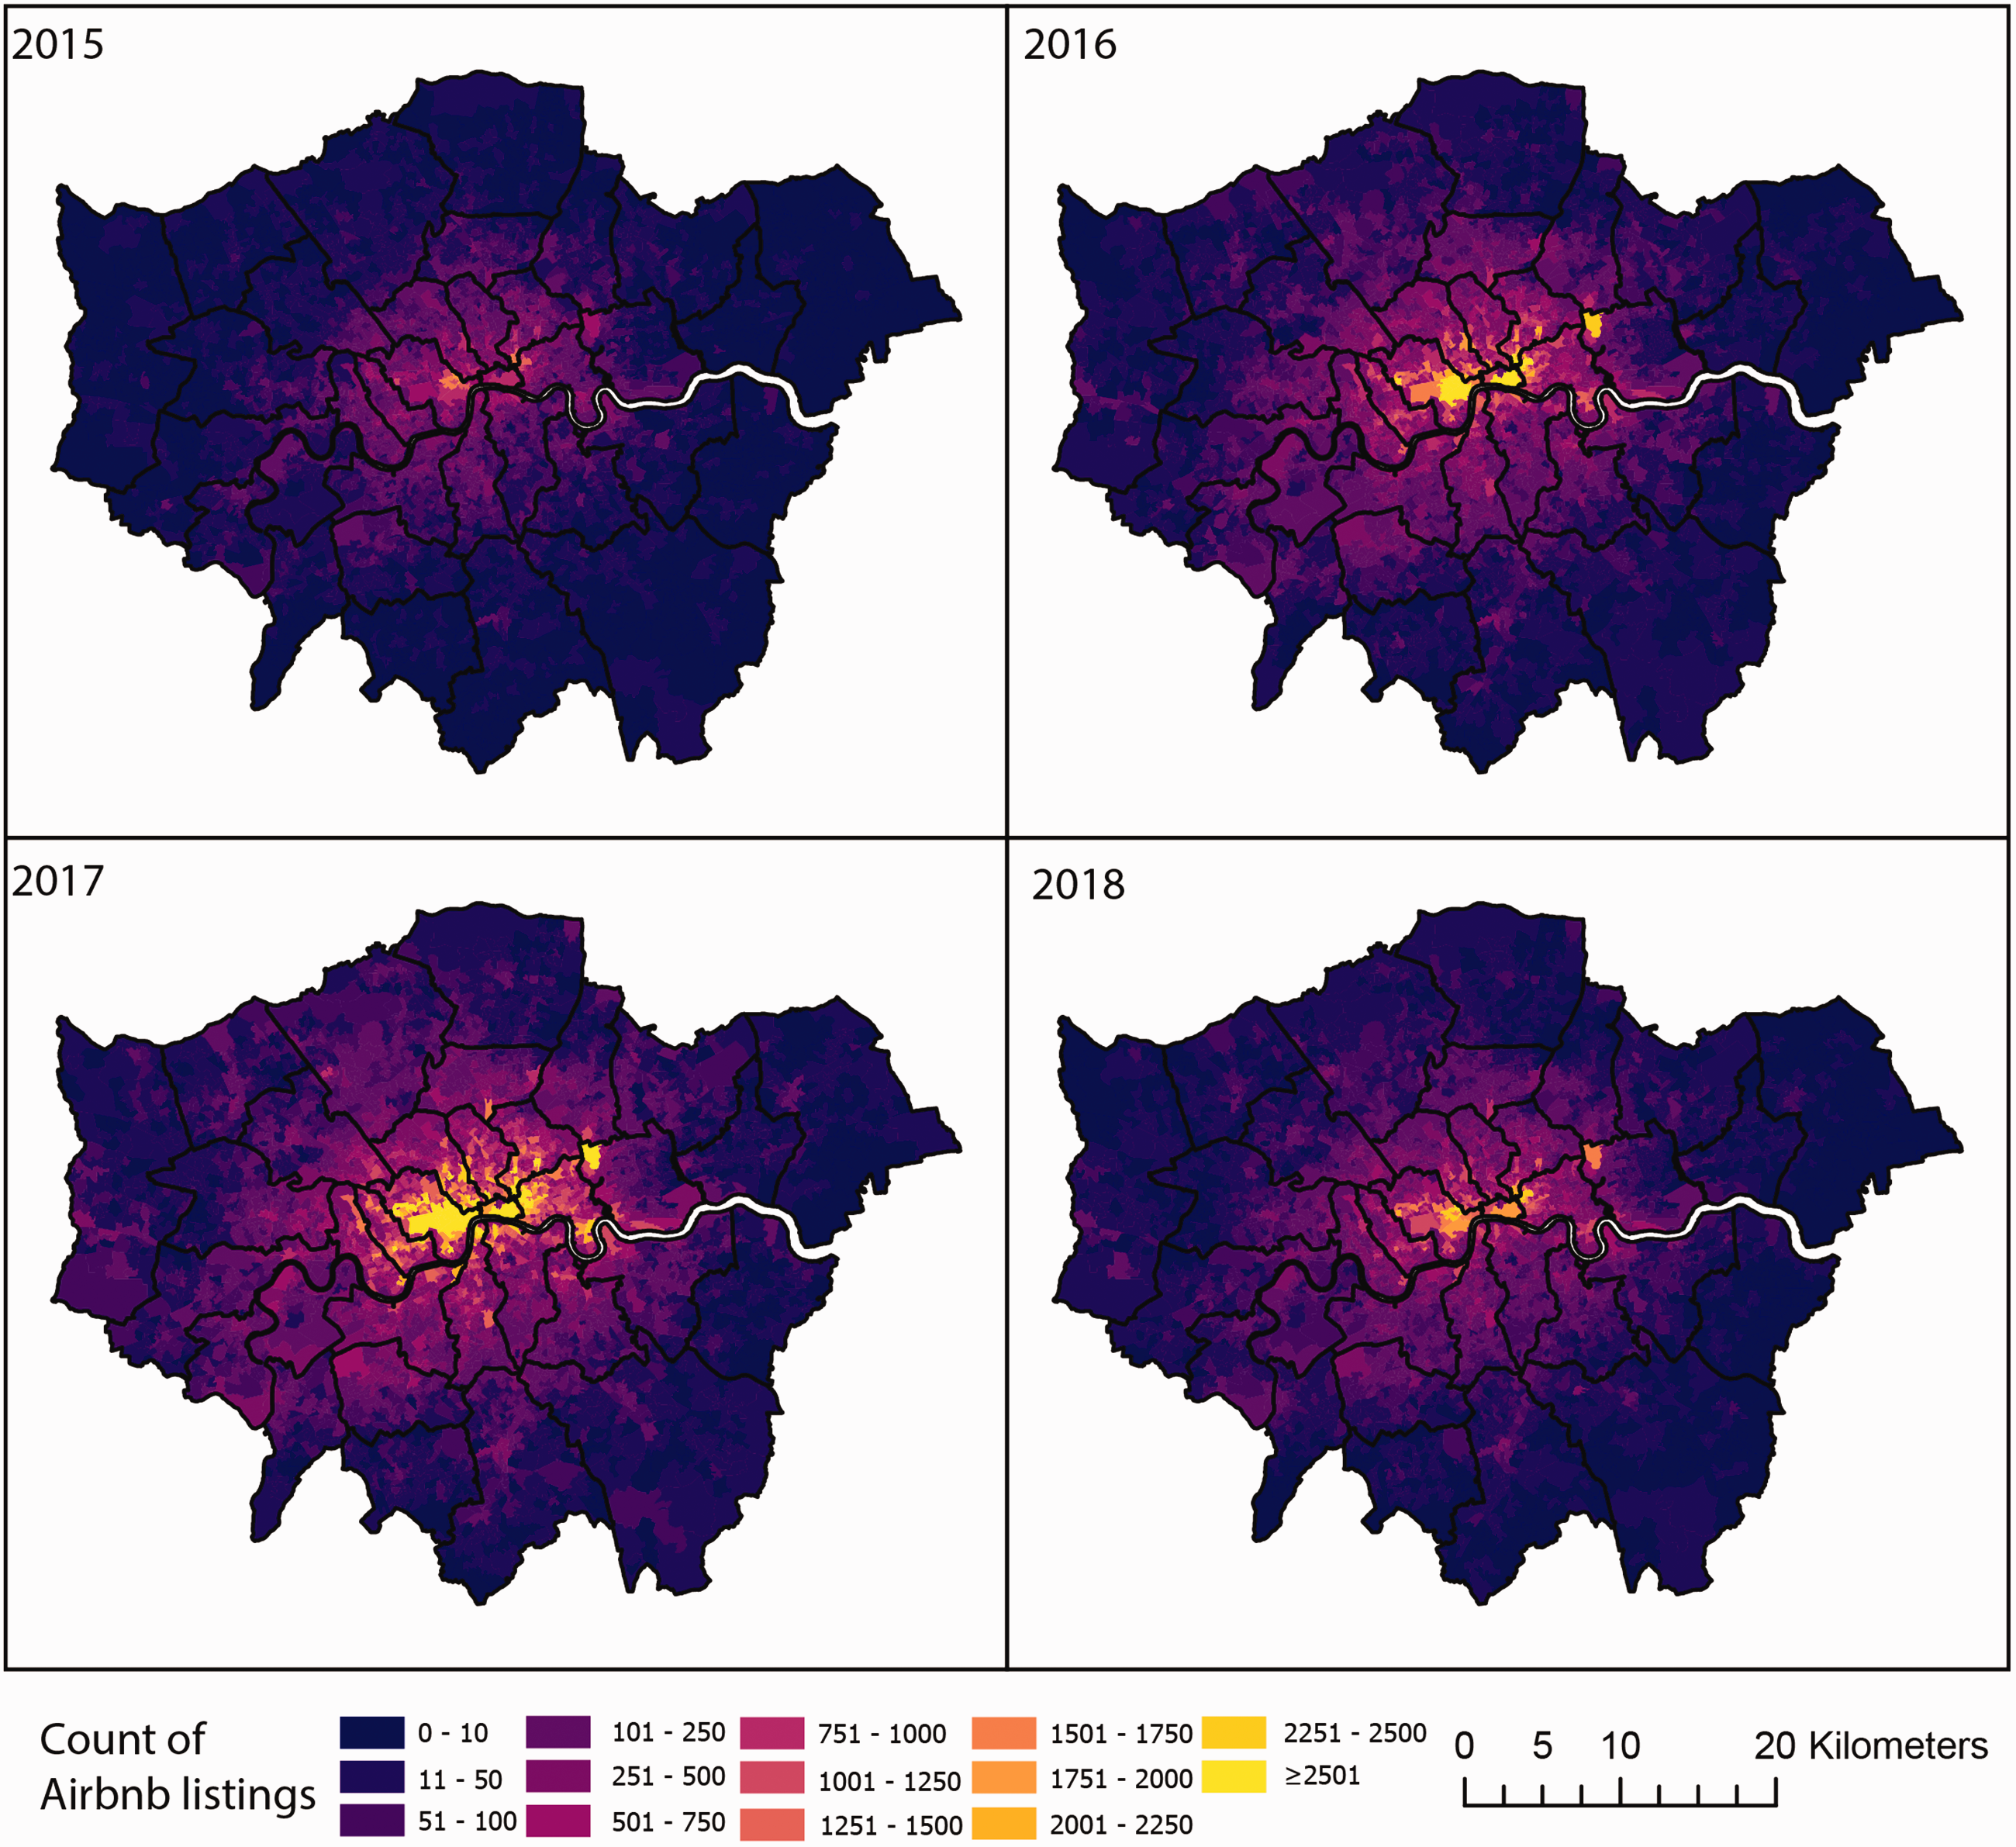
Map showing the overall spatial distribution of the number of Airbnb listings recorded in London from 2015 to 2018, inclusive.
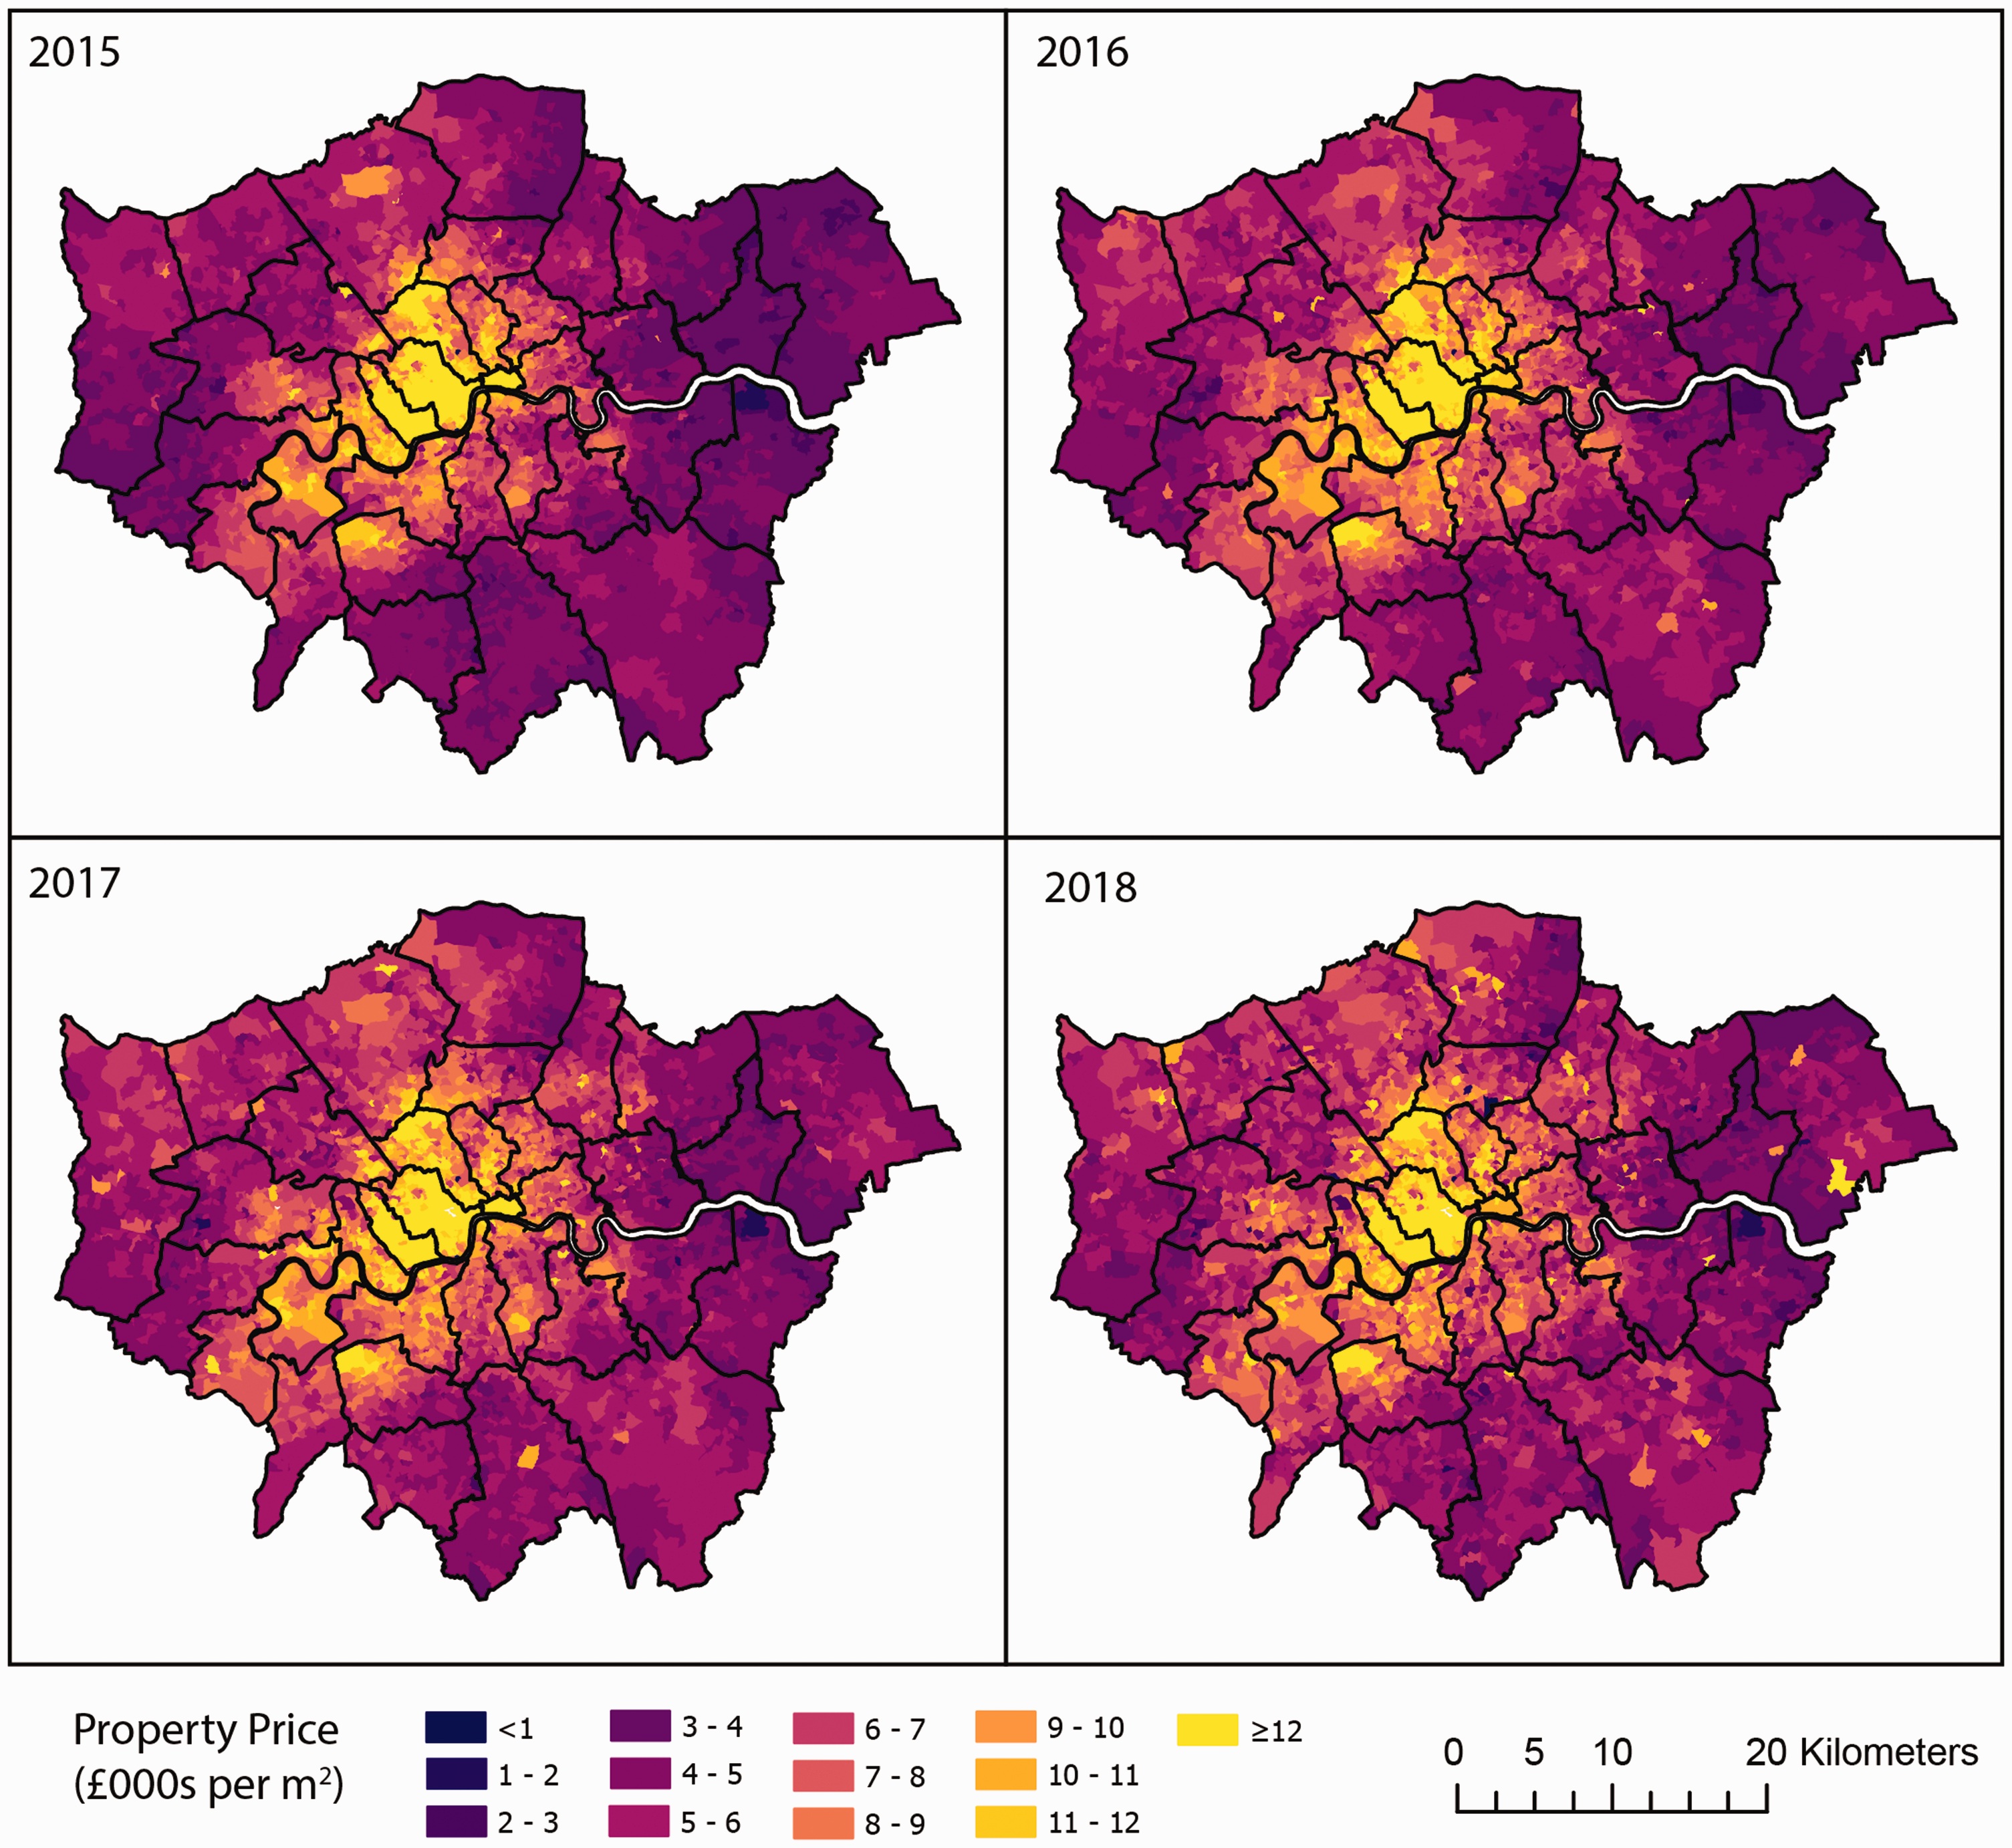
Map showing the overall spatial distribution of the annual average house prices in London (£per m2) from 2015 to 2018, inclusive.
Due to the sparse nature of Airbnb listings and fewer transactions in the house price data across the outer London boroughs, we opted to limit our substantive analysis to inner London boroughs (Camden, Greenwich, Hackney, Hammersmith and Fulham, Islington, Kensington and Chelsea, Lambeth, Lewisham, Southwark, Tower Hamlets, Wandsworth and Westminster) including the City of London.
Study design
The main unit of analysis was monthly observations of Airbnb listings and house prices from the period of January 2015 to May 2018 inclusive for each of the 1737 LSOAs in inner London. Due to the hierarchical data structure where each LSOA has observations reaching up to 41 months, we implemented a longitudinal panel study design for this research.
Definition of the main outcome, primary and secondary independent variables of interest
The main outcome for this analysis was the average house price (in £per m2) for each month starting from January 2015 to May 2018, inclusive. The main primary independent variable of interest is the number of Airbnb property listings recorded on a monthly basis from January 2015 to May 2018. The data exist in a longitudinal panel format and there are 1737 LSOAs within inner London, each having 41 months’ worth of house prices (£per m2) and frequency of Airbnb property listing records. As previously discussed, we included IMD scores only as an a priori independent variable since it is a function of the following seven indicators: income, employment, education, health, crime, barriers to housing and services and living environment; and the fact that it is a potential confounder that impacts the relationship between house price (£per m2) and Airbnb property listings. The IMD score data were used in their original form as continuous measures, whereby the larger scores represent an area that is socioeconomically deprived and lower scores represent areas that are least deprived.
Model formation
This research used a three-stage process for quantifying the association between the frequency of Airbnb property listings and house prices in inner London, as well as determining the spatial distribution of Airbnb’s impact on house prices for LSOAs in inner London. To this end, we implemented a series of models to examine the following: First, an univariable fixed effect that explores the direct relationship between the Airbnb property listings and house price (£per m2). Second, a two-level multivariable hierarchical model that explores the relationship between Airbnb property listings and house price (£per m2) while accounting for IMD as a level-2 predictor. Finally, we expanded the model from (2) to include Airbnb property listings as LSOA-specific random coefficients to the variation of its impact on house price (£per m2) throughout inner London.
The statistical formula for modelling such direct relationships is given as follows

In equation (1), the model parameter
To explore the geospatial impacts of Airbnb on house price (£per m2), we extend equation (1), our generic model, to allow Airbnb property listings to vary as a random coefficient. The statistical formula is given as follows

In equation (2), the parameter
All global regression coefficients from our mixed hierarchical linear model were reported with their corresponding 95% confidence interval (95% CI), whereby statistical significance was deemed if the 95% CI excluded the null value of 0 between its lower and upper limits. The intra-class correlation coefficient (
Results
Results from initial univariable fixed and multivariable regression model
A univariable regression was conducted, enabling a holistic understanding of the impacts of Airbnb listings on local house prices (£per m2), whilst controlling for all the differences between LSOAs. Conducting the model, we find there to be a significant £14.78 per m2 (95% CI: £13.08–16.49) increase in house prices, when there is a unit increase in the frequency of Airbnb listings. However, adjusting for IMD in a multivariable model causes a marginal increase in Airbnb’s relationship with house prices (β = £15.27, 95% CI: £13.57–16.97) (see Table 1).
Fixed and two-level hierarchical mixed linear model that quantifies the overall impacts of Airbnb frequency on house price (per m2) in Inner London.
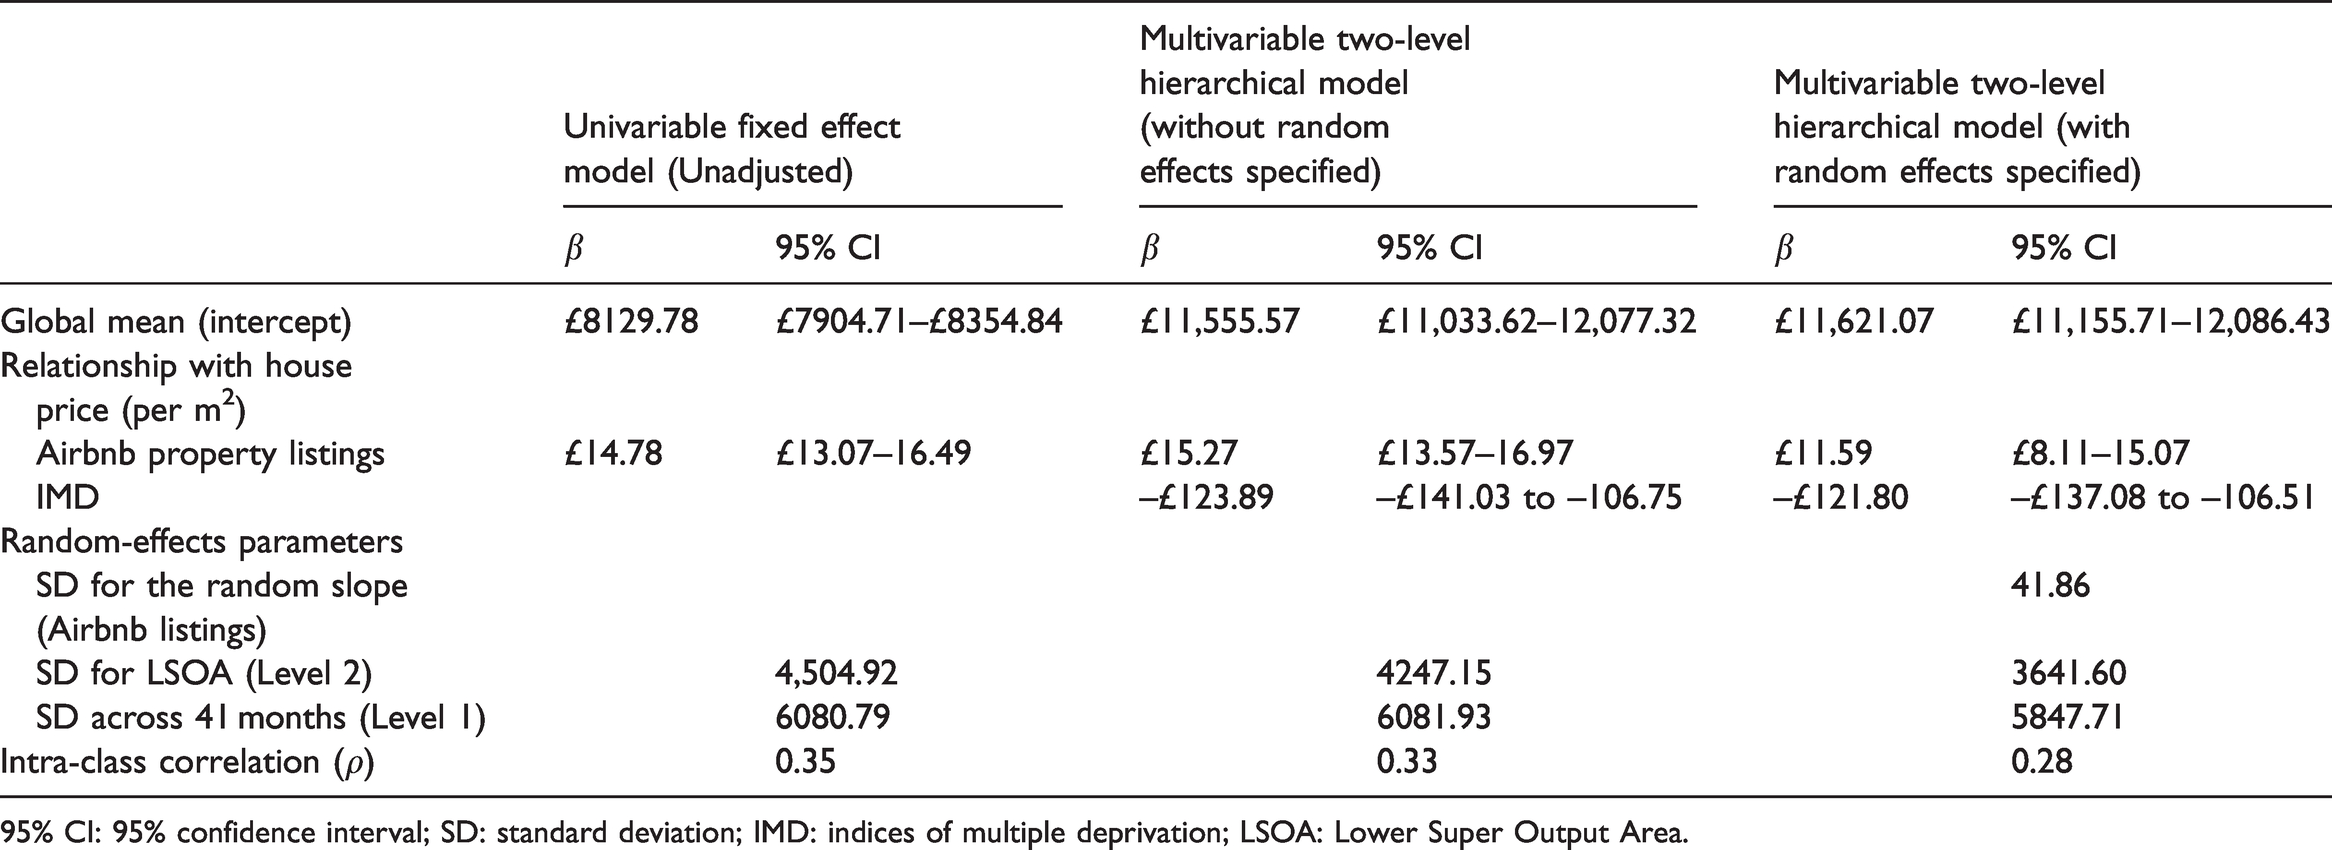
95% CI: 95% confidence interval; SD: standard deviation; IMD: indices of multiple deprivation; LSOA: Lower Super Output Area.
Results from multivariable models incorporating Airbnb listing as random slope
After including IMD (level-2) as a confounding variable and making further adjustments for Airbnb listings as a random slope, we found a marginal reduction in magnitude in terms of its association with house price (£per m2). We observed that a unit increase in the number of Airbnb property listings yielded a significant increase on the house price by £11.59 per m2 (95% CI: £8.11–15.07) (see Table 1). The overall intra-class correlation coefficient (
Geospatial impacts of the Airbnb property listings on house prices across administrative areas in London
Although there is large variability in terms of Airbnb’s impact on house price (£per m2), substantial increases in house prices tend to be concentrated for LSOAs in the boroughs of Kensington and Chelsea, Westminster and Camden (see Figure 3). It shows increase in house price (£per m2) in relation to Airbnb typically exceeds £20 (£per m2) (the maximum increase observed in prices was £390.90 (£per m2) in Camden). Conversely, there are a few LSOAs in the same borough that show a huge reduction in house prices in relation to Airbnb with such decreases exceeding £20 (£per m2) (the maximum reduction observed estimated as £221.77 (per m2)). Through the visual inspection of Figure 3, we observed that impacts of Airbnb on LSOAs, especially for those situated in the South-East beneath the River Thames, tend to exhibit less variability showing a modest increase of house price (£per m2) ranging from £8.00 to 13.00.
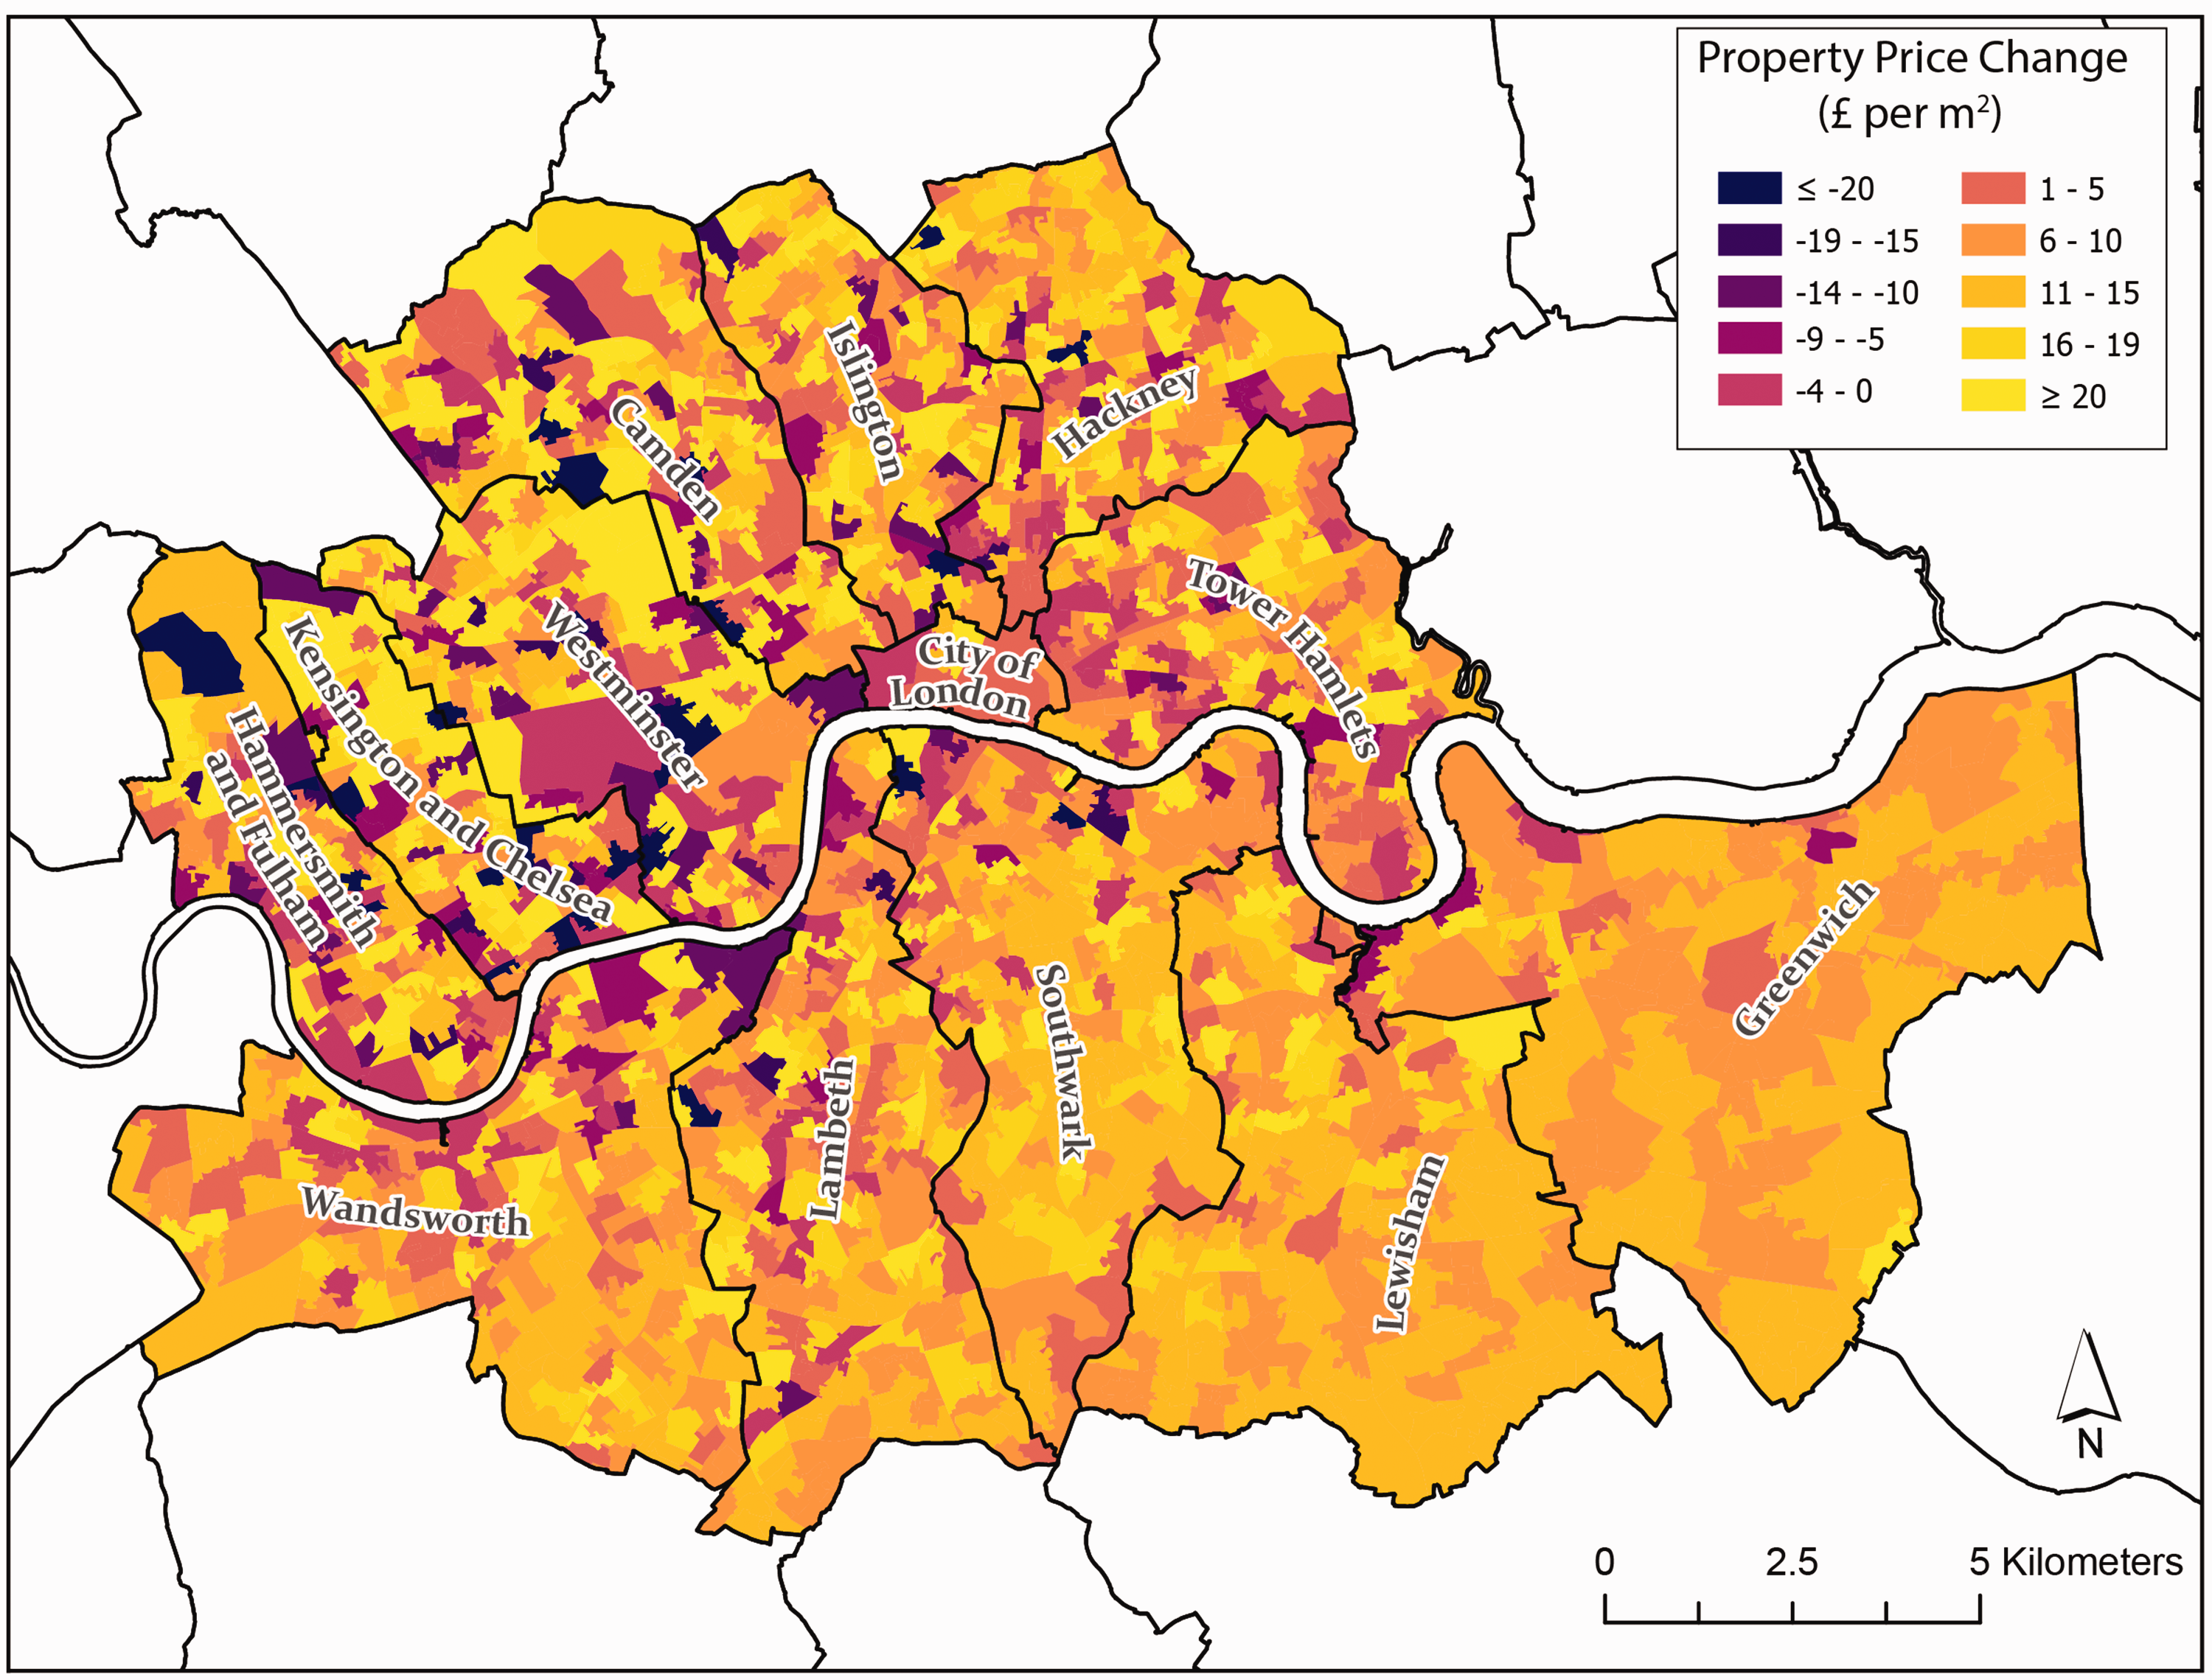
Map showing the spatial distribution for the effect of Airbnb frequency on house prices (£per m2) for LSOAs in London. Airbnb frequency was modelled as varying-coefficient in order to derive specific slope estimates for each LSOA.
We use a motivating example to further illustrate the interpretation of the random coefficients in context of this assessment, considering the example of properties located in the following LSOA: E01032771. This LSOA code corresponds to an area (which contains up to 545 households) that is in the London borough of Tower Hamlets. This LSOA was observed to have an increase in house price by £13.27 (per m2) per unit increase in the number of Airbnb listings. This means that Airbnb’s impact on a typical property (e.g. a large terraced home) in Tower Hamlets that has an average floor area of 100.98 m2 (equivalent to 1087 square foot) will yield an average overall monthly increase in house price by £1340.01.
Discussion
Merits and limitations
One of the main advantages of this study is the fact that the potential for systematic errors such as recall bias are minimal due to the high degree of accuracy and reliable nature of this dataset. The Airbnb listings, rentals and review information for houses in London are typically collated by AirDNA in a systematic fashion at a property-level on an incident and daily basis and not from a retrospective manner. Furthermore, this study uses a robust statistical approach to overcome problems concerning the complex structure of the data structure. The data has a hierarchical structure whereby the observations for house price and Airbnb listings are recorded across months from January 2015 to May 2018, inclusive, which are, in turn, nested within an LSOA. Therefore, using a fixed effects regression, we are able to control for all the differences at the LSOA level. In addition, the data lend itself to a two-level multivariable hierarchical linear model in this situation which estimates the global relationship between Airbnb listings and house price and derives LSOA-specific estimates for the LSOAs in London.
One of the major shortcomings of this work relates to the covariate included in our model. While we tried to make meaningful adjustments (e.g. IMD on its own as is a function of many other indicators for area-level socioeconomic deprivation) to reduce potential confounding between the outcome and main exposure, we must acknowledge the mere fact that there are still many other factors that remain unaccounted for in this analysis. These typically include LSOA- or other area-level information such as economic climate (e.g. amenity value) of households within an LSOA (Rehdanz, 2006), immigration (Sá, 2014), ethnic heterogeneity (Dustmann and Preston, 2007; Dustmann et al., 2005) and many more. In addition, we could have made added adjustments for LSOA measures of population density, number of houses and the average household size; however, we were acutely aware that these variables, again, were indirectly a function of IMD. The lack of such important adjustments may certainly lead to residual confounding arising in our analysis. Another limitation is related to the confounding variables modelled as a fixed effect as opposed to it being treated as a time-varying covariate (similar to that of the main outcome and property listings). While it is acceptable to assume that the confounders are fixed (or time-constant) covariates, as in the case of IMD status or number of houses in an LSOA where changes over time are seldom or marginal, this assumption is still somewhat unrealistic and therefore we acknowledge the potential for misclassification of exposure bias to arise in our result. Additionally, we see some potential for misclassification of outcome bias to arise in our result due to the use of multiple imputation techniques to fill in missing values in LSOAs with no sales in a given month.
While the above speaks of the lack of covariate adjustments that were measured at the LSOA level, the authors concede that the analysis performed at an individual-level (i.e. household units), as opposed to ecologic units (i.e. LSOA), would have reduced the uncertainty in the analysis. Our need to pursue an ecological study design was largely driven by the data comprising only of approximate locational coordinates of each Airbnb listing due to data anonymity, ethics and privacy reasons. These approximate coordinates ensure that the specific location of each listing would be very difficult to identify and hence were aggregated to the LSOA level. Since the identification of the precise locations of Airbnb listings were not possible, this also limited our selection of household characteristics to those which were included within the AirDNA data. This dataset does not contain many candidate indicators to include as a priori confounders for this analysis (see list of AirDNA variable under the online supplementary material section). With the exception of Airbnb listings, which was treated as our main independent variable of interest, out of the 23 indicators presented in the AirDNA file, only two viable variables were there that we could have included as a priori confounders (i.e. number of bedrooms and the listings property type (e.g. private, entire home or apartment)), and we acknowledge that not introducing these as modest adjustments is a limitation. However, due to the study design and the unit of analysis being LSOA, this would mean that we would have to convert these into LSOA-level aggregate measures (e.g. proportion of households classified as private (or full homes or apartments), and proportion of one (or two or more than three) bedroom houses etc.), which we believed was not a reasonable approach. We refrained from using them as proportions because we believed that it was not reasonable, and introducing these aggregated versions alongside the IMD score would have convoluted the analysis further bringing some level of multicollinearity on the level-2 component of our model, since IMD score is indirectly a function of these housing characteristics (i.e. via the barriers to housing and services).
In addition, the study design itself relies upon a retrospective longitudinal ecological study framework. In this study, the data that are being used are aggregated. This means that the interpretation of results needs to be done with the ecological fallacy in mind. If the data were available at the household level, we would have sought to implement a multivariable three-level hierarchical model, where the structure of the model would consist of several household-level characteristics being at level-1. Next, the level-2 component of the model would comprise of household units (along with its characteristics) being nested within LSOAs which are adjusted for the six constructs (excluding the barriers for housing and services) for creating IMD scores, rather than the IMD score itself to avoid multicollinearity with other household characteristics. Finally, level-1 which is nested level-2, are both components further nested within time units (i.e. months) forming the level-3 component of the model. The authors acknowledge that integrating such model design would be a more concrete approach for accounting for further micro-, macro- and temporal-scale variations, as well as reducing further residual confounding caused by household characteristics. This proposed approach can of course be explored for future research.
Possible explanations for research findings
This study sought to build on the techniques used in previous quantitative investigations on the impacts of Airbnb on local house prices (£per m2). The results show a positive correlation found between Airbnb listings and local house price (£per m2) in prior research. This closely matches the results found in the prior research (see section ‘Literature review’). There appears to be a global trend where Airbnb listings have a moderate but statistically significant impact on localised house prices which is what we would expect due to the transmission mechanisms identified in Sheppard and Udell’s (2016) paper. Increased demand for space caused by new income in the local area as well as increase in population numbers by increase in tourists and residents would cause property values to increase. Moreover, local neighbourhood quality is expected to rise as the guests bring localised economic impacts, again increasing local property values. Sheppard and Udell (2016) also include the influence of negative externalities such as noise, safety and an increased demand for publicly provided goods, which is expected to cause a decrease in the quality of the local neighbourhood and consequently cause a fall in local property values. Therefore, looking over the entire study period and area, we would expect there to be positive association between the number of Airbnb listings and local house prices (£per m2).
Airbnb was found to take up roughly 1.4% of the total housing supply in London (Shabrina et al., 2019), but its uneven geographic distribution is a factor which can be associated with its varied geospatial impacts reported in section ‘Geospatial impacts of the Airbnb property listings on house prices across administrative areas in London’. Although listings are more geographically dispersed than many other comparable establishments (Coles et al., 2017), in the initial exploration of the geographic distribution (see Figure 1), we see a greater concentration of Airbnb listings towards the centre of the city which we can attribute to the monocentric nature of activities and employment (Buck et al., 2013). This helps us to gain an understanding of the varied associations between Airbnb and local housing prices in inner and outer London. Outer London is mainly composed of smaller town centres surrounded by large areas of residential accommodation. These areas are typically home to the commuters into London and lack touristic activities. Therefore, this would make these areas less desirable to Airbnb guests; hence a fewer number of listings and smaller effects on house prices in comparison to the inner central areas of London.
Inner London is characterised by a more vibrant and varied landscape. Areas such as the City of London is the home to the UKs financial services industry, whilst Shoreditch has grown, more recently, into the technology and creative hub for London. Areas such as the West End cater more towards tourists and visitors, being the main commercial and entertainment centre of the city. In London, Airbnb listings have been found to be located in areas commonly associated with high public transportation accessibility that have a younger demographic of people who are born outside of the UK (Quattrone et al., 2016). Airbnb listings are also associated with areas of a high concentration of privately rented purpose-built flat dwellings (Shabrina et al., 2019). Since inner London has many areas that have different identities and activities, this may be cause large variations in the impacts of Airbnb on local house prices (£per m2). We can see that areas such as Euston, Kings Cross and Marylebone are associated with a large positive correlation, while areas around the Mayfair and Belgravia have a large negative correlation. The areas associated with high levels of correlation between Airbnb listings and house prices (£per m2) may be likely associated to the centrality of the location in a pleasant area within London. The stations also provide users of Airbnb within the area to have excellent access to public transportation, both locally within London (using the underground network) as well as nationally (National Rail, London North Eastern Railway, Thameslink, Great Northern and many more) and internationally (St Pancras Eurostar connection).
Potential implications and recommendations
Jacobs (1970) mentions cities reliance on one another to solve problems that they face, often copying one another. This mentality has also been adopted with the regulation policies on Airbnb in cities internationally. Governmental institutions around the world have implemented various policies from which Nieuwland and Van Melik (2018) have classified into four main categories; quantitative restrictions, locational restrictions, density restrictions and qualitative restrictions. London is one of many cities to have implemented quantitative restrictions, limiting the number of nights that entire home listings can be occupied in a year to 90 days (Ferreri and Sanyal, 2018; Simcock and Smith, 2016; Shabrina et al., 2019). Other cities such as Amsterdam, San Francisco and Paris have similar methods of restriction (Nieuwland and Van Melik, 2018). Unfortunately, the implementation of regulation is not that easy and there is no ‘one size fits all’ solution (Nieuwland and Van Melik, 2018), therefore attaining a contextual understanding of the relationship in a specific city is essential (Coyle and Yeung, 2016).
Among the research conducted on Airbnb and London, this paper is the first to quantify its relationship to local housing prices (£per m2). This enables policy makers to gain an understanding of how this new variable influences the local housing market, a very important and topical issue. London has been battling a housing shortage and affordability crisis in recent years, with a continuous housing shortfall (Shabrina et al., 2019). Housing raises particular issues due to its importance as a social right, with many first-time buyers finding it increasingly difficult to afford to live around the capital (Marsden, 2015). Airbnb is contributing to this issue and therefore raises pressures to help those which are negatively affected by the growth of the platform.
We believe that it is necessary to investigate and quantify the positive externalities, which are associated with the growth of the platform as well as the negative, in order to gain a holistic understanding of its overall impact on the city. An empirical investigation into the social and economic benefits that arise from the growth of Airbnb is necessary in order to make more informed policy decisions to best cater for the best interest of the city as a whole.
Conclusion
The housing market is very complex and has numerous influencing factors. This paper has found Airbnb to be a small but influential variable to add to this mix. It provides novel and contemporary estimates for exploring the relationship between Airbnb property listings and house prices (£per m2) in London. The analysis informs us that increased levels of property listings from Airbnb in general has a modest and positive association with an average increase in the house prices in London. It also informs us that there is much variation in the house prices in terms of Airbnb’s impact. Since this result is new, we can only advise that these estimates must be interpreted with caution. Equally, we cannot conclude that these results are representative of other cities (e.g. Leeds, Manchester, Edinburgh and Glasgow) in the UK. In order for them to be generalisable to other British cities, more studies with a similar approach are needed to confirm these findings.
Footnotes
Acknowledgements
The dataset used for this research was released by the Consumer Data Research Centre (CDRC), an ESRC data investment, under the project ES/L011840/1; ES/L011891/1. The dataset is safeguarded by the CDRC and original supplied by Airbnb Data and Analytics (AirDNA) LLC.
A special thank you to Dr Tom O’Grady, UCL Department of Department of Political Science, for his valuable help and contributions towards the research techniques developed in this paper.
Declaration of conflicting interests
The author(s) declared no conflict of interests with respect to the authorship and/or publication of this original research article.
Funding
The author(s) disclosed receipt of the following financial support for the research, authorship, and/or publication of this article: This research is funded by the Economic and Social Research Council (ESRC).