
Abstract
In this paper, we detail an individual-level analysis of under-exploited location-based social network (LBSN) data extracted from Sina Weibo, a comprehensive source for data-driven research focused on Chinese populations. The richness of the Sina Weibo data, coupled with high-quality venue and attraction information from Foursquare, enables us to track Chinese tourists visiting London and understand behaviours and mobility patterns revealed by their activities and venue-based ‘check-ins’. We use these check-ins to derive a series of indicators of mobility which reveal aggregate and individual-level behaviours associated with Chinese tourists in London, and which act as a tool to segment tourists based on those behaviours. Our data-driven tourist segmentation indicates that different groups of Chinese tourists have distinctive activity preferences and travel patterns. Our primary interest is in tourists’ consumption behaviours, and we reveal that tourists with similar activity preferences still exhibit individualised behaviours with regards to the nature and location of key consumption activities such as shopping and dining out. We aim to understand more about Chinese tourist shopping behaviours as a secondary activity associated with multi-purpose trips, demonstrating that these data could permit insights into tourist behaviours and mobility patterns which are not well captured by official tourism statistics, especially at a localised level. This analysis could be up-scaled to incorporate additional LBSN data sources and broader population subgroups in order to support data-driven urban analytics related to tourist mobilities and consumption behaviours.
Keywords
Introduction
Tourism is an important driver of urban mobility within major cities. A micro-level understanding of tourist characteristics, mobility trajectories and consumption-related behaviours is essential for urban planning and urban service analysis (McKercher and Lau, 2008). Headline statistics and survey-derived insights, such as those drawn from the UK International Passenger Survey (IPS), provide aggregate-level overviews of inbound tourist magnitudes, attitudes and self-reported behaviours. Headline estimates of tourist numbers and associated expenditures act as a barometer of tourism activity yet disaggregating these across space and by tourist origin or activity/expenditure type is notoriously tricky (Ashworth and Page, 2011; Song and Li, 2008; UNWTO, 2014).
Location-based social networks (LBSN) generate spatiotemporal data which could enable novel insights into these localised tourist behaviours (Chua et al., 2016; Comito et al., 2016; Vu et al., 2019). In a comprehensive review of the literature, Li et al. (2018) note that user-generated data for tourism research have grown rapidly, predominantly drawn from geo-located photos, microblogs or location-based check-ins. These insights can be broadly thought of as first aggregate-level indicators of tourist activity preferences captured by ‘hot spots’ of tourism activity at a destination (Salas-Olmedo et al., 2018; Vu et al., 2015); and second as more individualised insights into tourist itineraries and activity patterns, which is the focus of our discussion.
One difficulty in using LBSN data to infer these activity patterns is in classifying social network users into different groups (e.g. based on country of origin or individual demographics), especially when self-reported information (such as ‘place of residence’) in their user profile may be unreliable. We address some of these challenges by drawing on the social networking service Sina Weibo (referred to hereafter as Weibo). Weibo offers an opportunity to identify behaviours and mobility trajectories specifically associated with one important sub-group of UK tourists: Chinese inbound visitors. We use London as a case study city and exploit the under-utilised value in Weibo check-in data. Our analysis uncovers the ‘hot spots’ and movement patterns of Chinese tourist in London, but in contrast to many previous published studies, we distinguish the similarity as well as the differences of the multipurpose travel behaviour of these Chinese tourists in London. This tourist group also has the highest per capita expenditure of all inbound markets when in the UK (VisitBritain, 2018). Therefore, we also attempt to explore their consumption-related activities during their multipurpose trips in London.
Introducing the Weibo check-in data
Weibo is a comprehensive LBSN source for data-driven research focused on Chinese populations with approximately 210 million active users (Weibo, 2019). Recent examples of its application include studies of Chinese population mobility (Liu and Wang, 2015), cultural ties (Wu et al., 2016), urban planning (Zhen et al., 2017) and domestic tourism destination research (Shao et al., 2017). Weibo allows users to generate microblogs which can be associated with specific points of interest (POIs) at which the user ‘checks-in’ in a similar fashion to geo-located Tweets or Foursquare check-ins. Weibo offers the potential to undertake a comprehensive assessment of activity preferences and travel trajectories associated with inbound Chinese visitors in major destinations which attract tourists of Chinese origin, such as London. London received over 19.83 million international tourist visitors in 2017 (VisitBritain, 2019). Visitors of Chinese origin represented the eighth largest group of international inbound tourists in London by spending in 2018 (ONS, 2019). Headline statistics suggest that Chinese visitors to London have a longer length of stay and higher expenditures than other groups of international inbound tourists (VisitBritain, 2018).
Data collection
An iterative programme was set up to collect Weibo check-in data via the Application Programming Interface (API) (https://open.weibo.com/wiki/2/place/pois/users) within Greater London. Queries to the API return the latest 1500 user check-ins at any specific POI within a defined study area. Providing that the 1500 user check-in threshold is not reached, every user and all check-ins related to the POIs are returned by the free API. Each retrieved Weibo check-in contains information including user ID, check-in ID, check-in time, POI name, category, location and ID, alongside the user-generated textual message attached to the check-in. There were 2665 POIs checked in at by Weibo users during our study period of 1 January 2016 to 28 August 2018. Data collection began in 2016 to coincide with increased inbound Chinese tourism resulting from new visa regulations (GOV.UK, 2016). Only 31 POIs (0.01%) returned the maximum 1500 user check-ins and we therefore have a comprehensive sample of Weibo check-ins at almost 100% of the relevant POIs in London. By contrast, commonly used LBSN sources such as Twitter are typically available free of charge for a sample of only 1%–2% of all tweets. Our data thus enable a very comprehensive insight into Weibo-derived LBSN check-ins among Chinese tourists.
Tourist identification
Each check-in is associated with a uniquely identifiable user ID, enabling individual Weibo users to be tracked across multiple time and location stamped check-ins. Social bots (generated as ‘fake’ accounts used primarily for advertising) are first filtered out from our check-in dataset, identified by intensive check-ins at multiple locations over a very short time span. Tourists are further distinguished from local residents and long-stay non-tourist visitors (such as those studying or working in London). We used check-in frequency and check-in timespan to infer short-stay tourist visitors, applying a length of stay threshold of 20 consecutive days to distinguish tourists from other Weibo users. This threshold is based on surveyed data from the IPS and VisitBritain insight (ONS, 2018; VisitBritain, 2018). These tourists have an average length of stay of just over 6 days and reveal a propensity for users’ first and/or last Weibo check-ins to take place at London Heathrow Airport, a major international airport which accounts for over 90% of aircraft seat capacity between China and the UK (VisitBritain, 2018).
POI categorisation
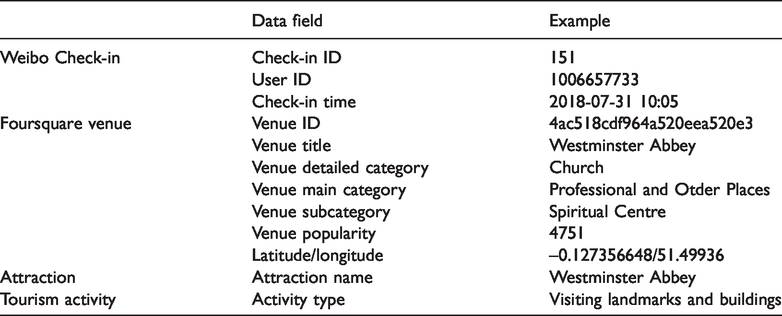
A set of 20,233 geolocated check-ins from 6,465 unique Weibo users were identified as tourism activity, approximately 20% of our raw dataset (the remainder attributed to Weibo users who are resident or on a long stay (e.g. student) visit). To avoid potential mis-categorisation of Weibo POIs and to generate data that are comparable with other LBSN datasets, we associated each Weibo POI with a named venue derived from Foursquare, which provides a high-quality set of categorised venues which we use as a consistent set of POIs. To do so, we used density-based spatial-clustering of applications with noise (DBSCAN) to identify groups of adjacent POIs which represent one destination or attraction (based on their location and venue categorisation), combining them to form a single Foursquare-derived venue (forming a cluster around a core Foursquare venue). This results in a total of 962 venues which are frequently visited (minimum of 10 unique user check-ins) by Weibo tourist users. We acknowledge that Weibo users will not check-in at all POIs visited and that there may be a higher propensity to check-in at major attractions. Nevertheless, these cleaned and processed data present a novel and unique opportunity to identify key mobility behaviours associated with this group of tourists. After data cleaning, the structure and format of an individual Weibo check-in is shown in Table 1.
Data structure of an individual Weibo check-in after pre-processing and assignment to a specific foursquare venue.
Extracting insight from the Weibo dataset
Our study employed the following methodology to investigate the activity and mobility patterns of Chinese tourists and to explore their consumption-related activities in London.
Identify the spatial distribution of Chinese tourist activities
Density maps provided an initial overview of the spatial distribution of our LBSN point dataset, with each point representing an individual timestamped and geo-located check-in. We use Kernel Density Estimation (KDE) to transform the check-in data (by activity type) into a series of smoothed density surfaces, presenting hot spots of tourism activity. KDE is a commonly used methodology to identify the intensity of the spatial distribution of georeferenced point data, with application in assessing human activity distribution from user-generated check-in data (e.g. see Lansley and Longley, 2016; Li et al., 2013). Density maps representing the venue distribution in London were also generated based on the Foursquare dataset, as a comparison to present the distinctive attraction choices of the tourism activities of Chinese tourist users.
Extract Weibo user’s check-in trajectories to understand Chinese tourist mobility behaviour
Network analysis (based on graph theory) has been applied in tourism research to understand the spatial structure of tourist behaviours in relation to the network of tourist attractions and other venues visited (Lee et al., 2013; Liu et al., 2017). In our study, Weibo tourist user’s daily check-in trajectories at the individual level have been aggregated to build a core attraction network specifically related to Chinese tourists observed behaviours. We employ eigenvector centrality, a measure of centrality drawn from graph theory which measures the importance of a node (in this case a venue or attraction) based on the number and relative importance of adjacent nodes (Bonacich, 1972; Prell, 2012). The concept has been widely adopted in urban network analysis to describe positions within a given system (Agryzcov et al., 2019) and evidenced in tourism research to understand the spatial hierarchical structure of tourist attractions (Kang et al., 2018), with implications for tourism planning (Asero et al., 2016; Lue et al., 1993). We use the revealed network of core attractions visited by Chinese tourists to infer aggregate-level sightseeing and consumption behaviours, while also assessing the extent to which individual users deviated from these ‘typical’ behaviours as a tool to help segment Chinese tourists based on their observed behaviours.
Segmentation of Chinese tourists based on their multipurpose travel behaviours
We explore specific attraction choices and mobility patterns exhibited by aggregate-level Weibo tourist check-ins, but at the individual level tourist travel motivation and interest preferences are varied. Therefore, we segment tourists based on their observed individualised multipurpose travel behaviours using a diverse range of indicators derived from these Weibo check-ins including trip characteristics (length of stay and number of different attractions visited), activity preferences (relative frequency and diversity of each activity type) and mobility patterns (the dimension, shape and structure) of travel trajectories at the individual level. In total, 41 variables are used as detailed below.
Our segmentation employs K-means, a widely applied clustering algorithm which partitions observations into a set of k groups, where k is pre-specified and represents the number of groups. It is highly efficient for a large volume of data and has been successfully applied in tourism research to segment tourists based on their characteristics (Grinberger et al., 2014; Huang and Wu, 2012). It works in an iterative way to classify objects into multiple clusters so that the intra-cluster variation is minimised, whereas the inter-cluster variation is maximised (Gan et al., 2014). The only user-input required is the specification of k – the number of clusters. In the research, we use the R ‘NbClust’ package (Charrad et al., 2014) and the ‘elbow’ method to determine the optimal number of clusters. The NbClust package provides 30 indices for determining the number of clusters and proposes to the user the best clustering scheme from the different results obtained by varying all combinations of number of clusters, distance measures and clustering methods. The K-means clustering is conducted within the R package ‘cluster’. We evaluate the goodness-of-fit of the clustering result by the average total within-cluster sum of square and average total between-cluster sum of square. The selection of k and the process of k-means clustering are detailed below.
Understanding Chinese tourist multi-purpose trips and their shopping-related activities
While our segmentation captures key observable travel behaviours of each cluster, the underlying multipurpose trip patterns of Chinese tourists require further investigation. The topic modelling technique Latent Dirichlet Allocation (LDA) is employed on a cluster-by-cluster basis to extract more detailed activity patterns exhibited by tourists within each segment, drawing on the within-cluster heterogeneity in terms of venue choice and activity patterns. We benefit from the individual-level richness of the Weibo data, along with the depth of venue category information within the check-in dataset (as shown in Table 1). LDA is a generative statistical model within natural language processing used to calculate the probability distributions of topics and associated words in a large collection of documents (Blei et al., 2003). It has been used in wider contexts to infer behavioural and lifestyle characteristics from Foursquare check-ins (Hasan and Ukkusuri, 2015; Qu and Zhang, 2013; Vu et al., 2019). Our research uses the ‘ldatuning’ R package in which four metrics are provided to estimate the best fitting number of topics (Nikita and Chaney, 2020). Then we apply the ‘topicmodels’ R package to each cluster according to the selected number of topics (Grun and Hornik, 2011). In the following sections we present and discuss our insights into these tourists’ destination-level behaviours.
Results
Spatial distribution of Chinese tourist activities
Weibo-derived check-in data from those users inferred to represent tourists suggest they are predominantly associated with check-ins related to visiting and sightseeing activities (museums, historical sites, art galleries, castles, monuments, etc.), with these venues representing 49% of check-ins in this sample. More than 70% of tourist users also checked in at ‘Travel and Transport’ venues, with these contributing almost a quarter of the total check-in activity, highlighting the importance of urban public transport infrastructure in enabling tourist mobility. Figure 1 illustrates the spatial distribution of five main Chinese tourist activities derived from the Weibo check-in data using KDE. As a comparison, similar KDE maps based only on the POI venue distribution of the respective categories are also constructed as in Figure 2. It is clear that hot spots of Chinese tourist activities within these categories are more spatially targeted on specific, localised, bounded and identifiable hot spots.
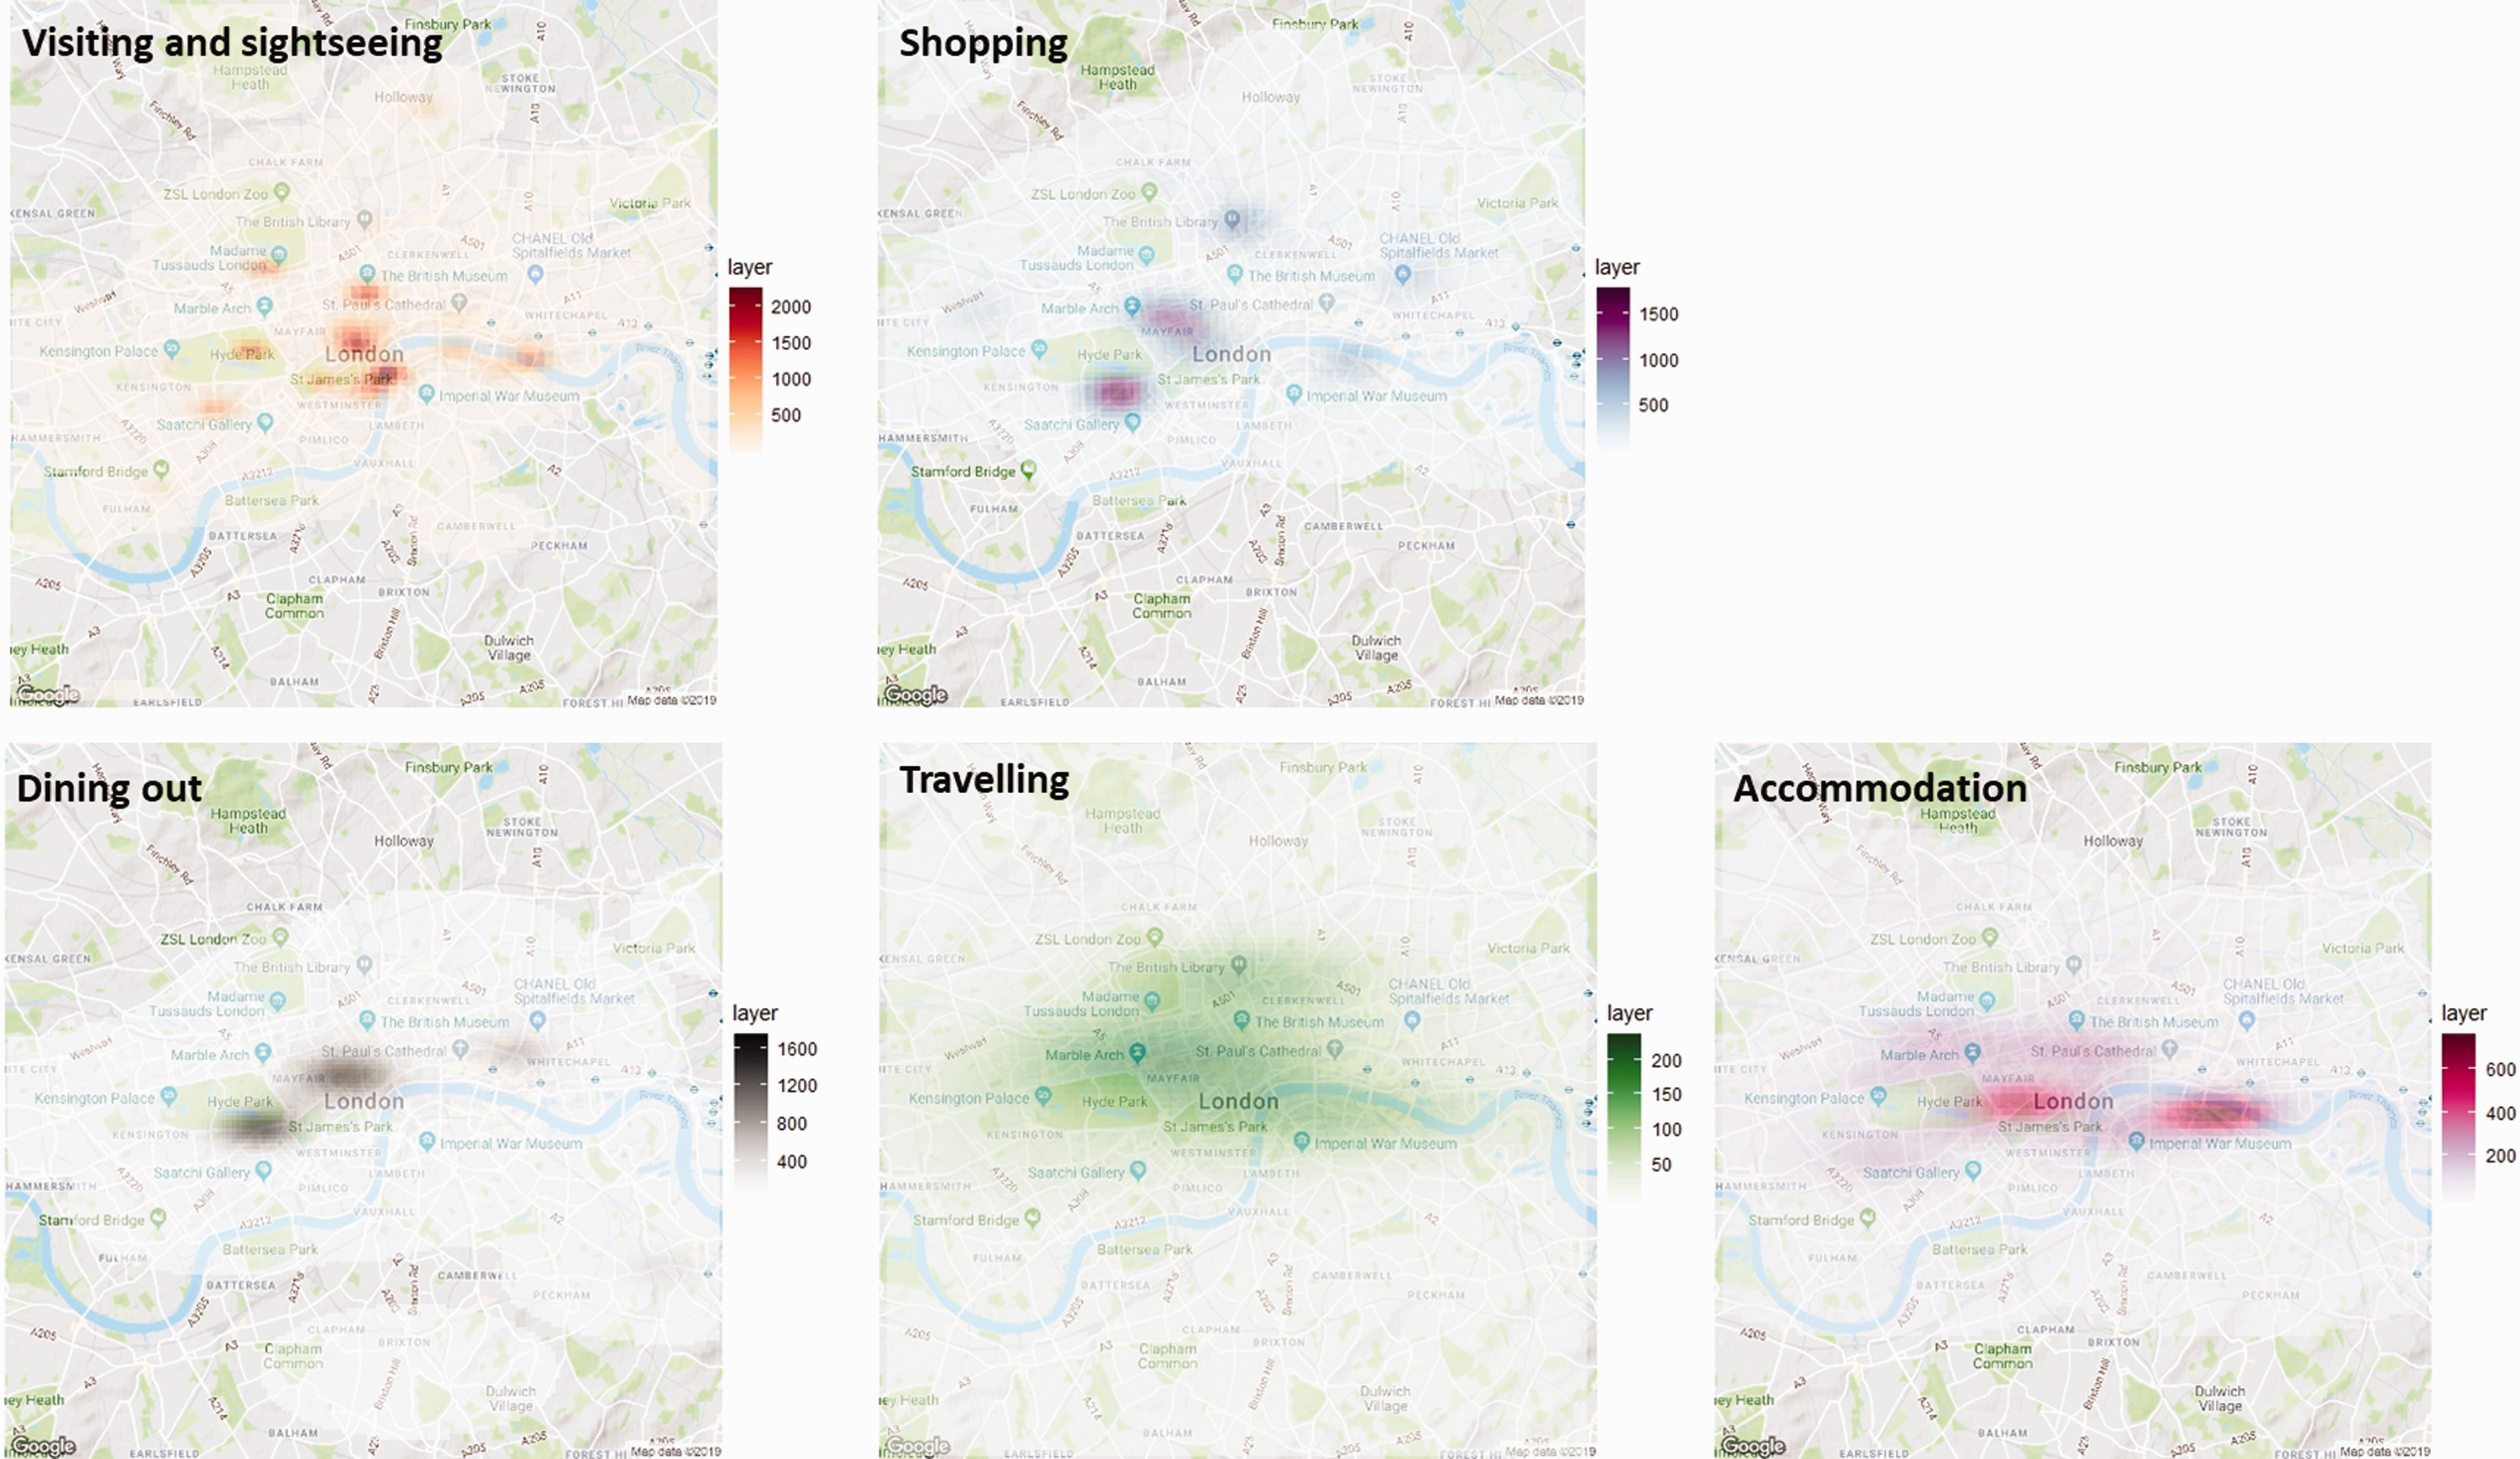
Kernel density estimation (KDE) of different tourist activities based on Weibo tourist users’ check-ins associated with Foursquare venues: (a) visiting and sightseeing, (b) shopping, (c) dining out, (d) travelling and (e) accommodation.
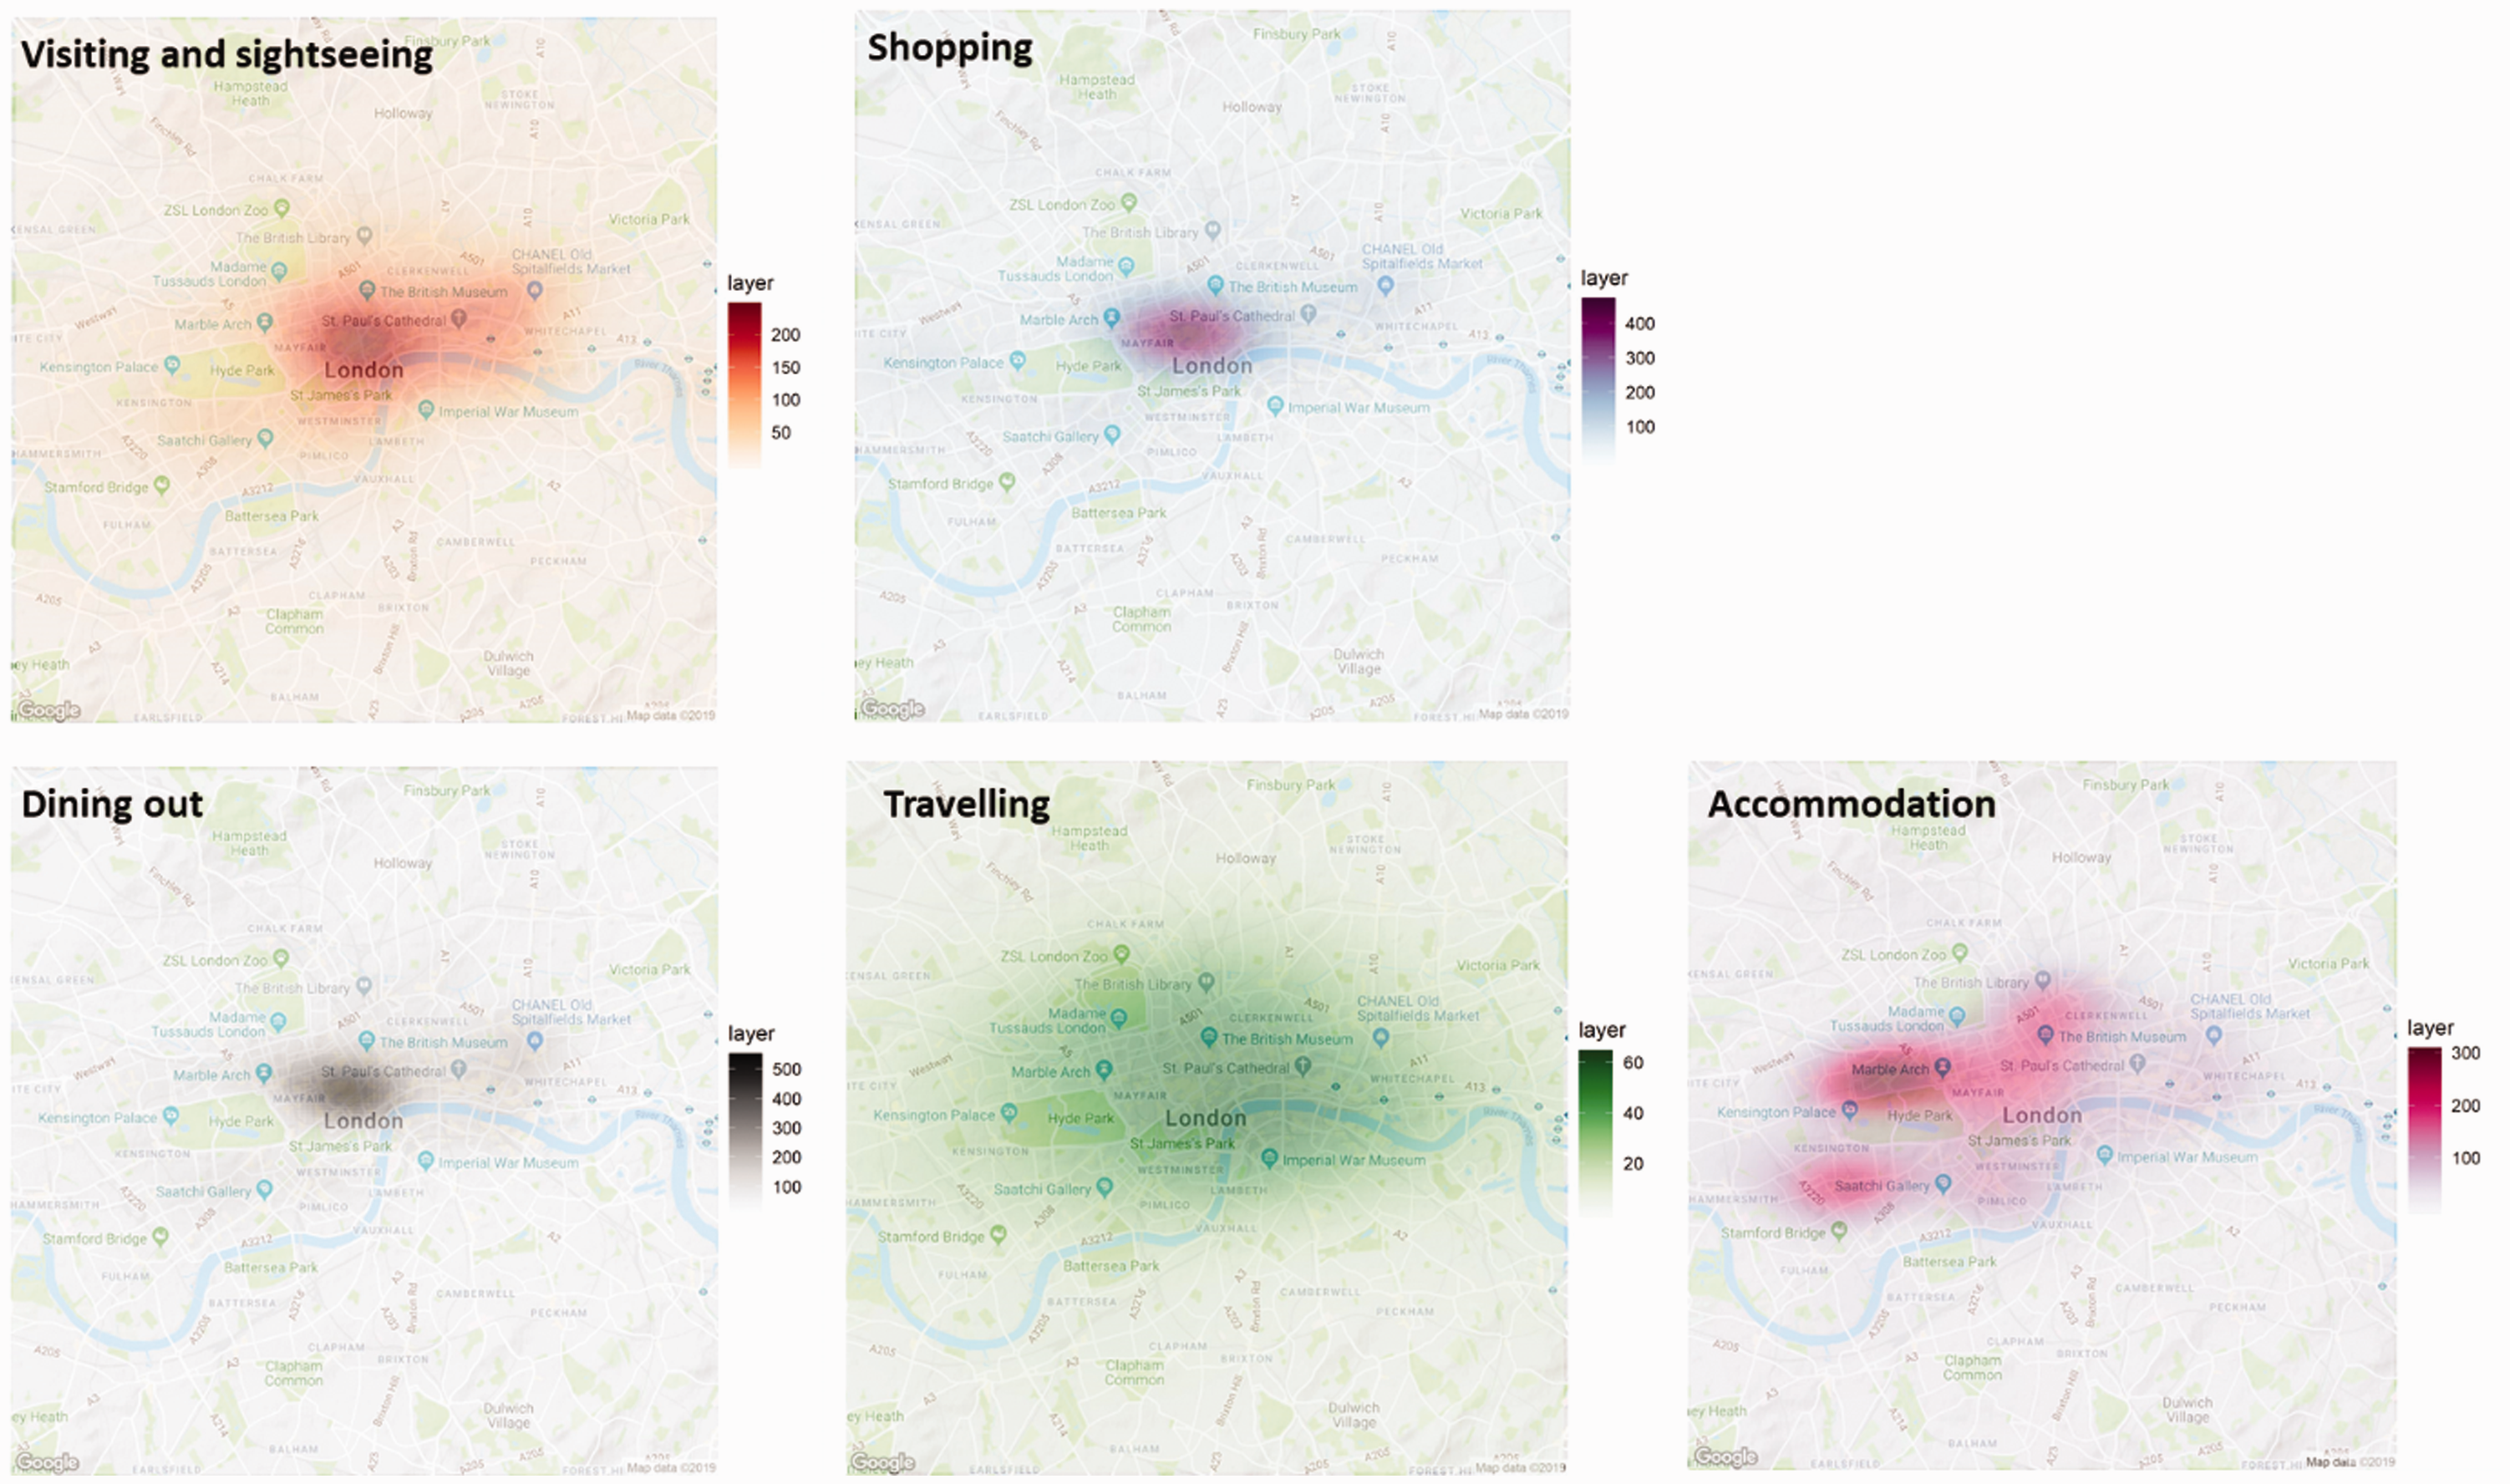
Kernel density estimation (KDE) of all Foursquare venues by category: (a) visiting and sightseeing, (b) shopping, (c) dining out, (d) travelling and (e) accommodation.
Although tourism attractions are widely spread over Inner London (Figure 2), Figure 1 suggests two significant and several secondary hot spots of Chinese tourist ‘Visiting and sightseeing’ activity. The two key hot spots are centred on Westminster (London Eye and Big Ben) and the Leicester Square/Covent Garden areas, both of which are major attractors for tourists. Secondary hotspots are centred on locations which correspond with key tourist attractions such as the British Museum, Hyde Park, Baker Street, Exhibition Road (home to many popular museums) and the Tower of London. In contrast to the concentration of overnight accommodation services evident around Hyde Park in Figure 2, the check-in data highlight a propensity for Chinese tourists to use accommodation which is spread across two large spatial clusters, one centred on the Southbank and one around Green Park. In both Figures 1 and 2, ‘Shopping’ and ‘Dining out’ activities have quite similar spatial patterns. For shopping (Figure 1), Chinese tourists focus on Knightsbridge (Harrods) and Oxford Street. There are clear spatial overlaps between different activity types in Figure 1, suggesting that tourists combine multiple activities within complex itineraries which include sightseeing/visits to attractions and shopping, alongside dining out, facilitated by the transport network and overnight accommodation.
In the following section, we consider the trajectories or visit sequences of individual Weibo users during their visits to London.
Understanding Chinese tourist mobility behaviours
Although the hot spots of tourist activity highlighted in Figure 1 enable us to draw interesting observations about the spatial distribution and density of different activity types, the activity and location-based behaviours from which these are built permit a far richer set of insights into tourist mobility patterns. Figure 3 illustrates the trajectory for one tourist Weibo user during a trip to London. Check-ins associated with each user have been sorted according to their timestamp and grouped into discrete days in order to extract their daily trajectories. The example illustrated has been chosen to demonstrate the richness of these data in uncovering the mobility and venue preferences associated with individual tourists. While it is acknowledged that users may visit a broader range of attractions and venues than those at which they choose to check-in, their revealed mobility trajectories could provide a valuable and previously under-exploited insight into the characteristics of tourist behaviour in London at the individual level.
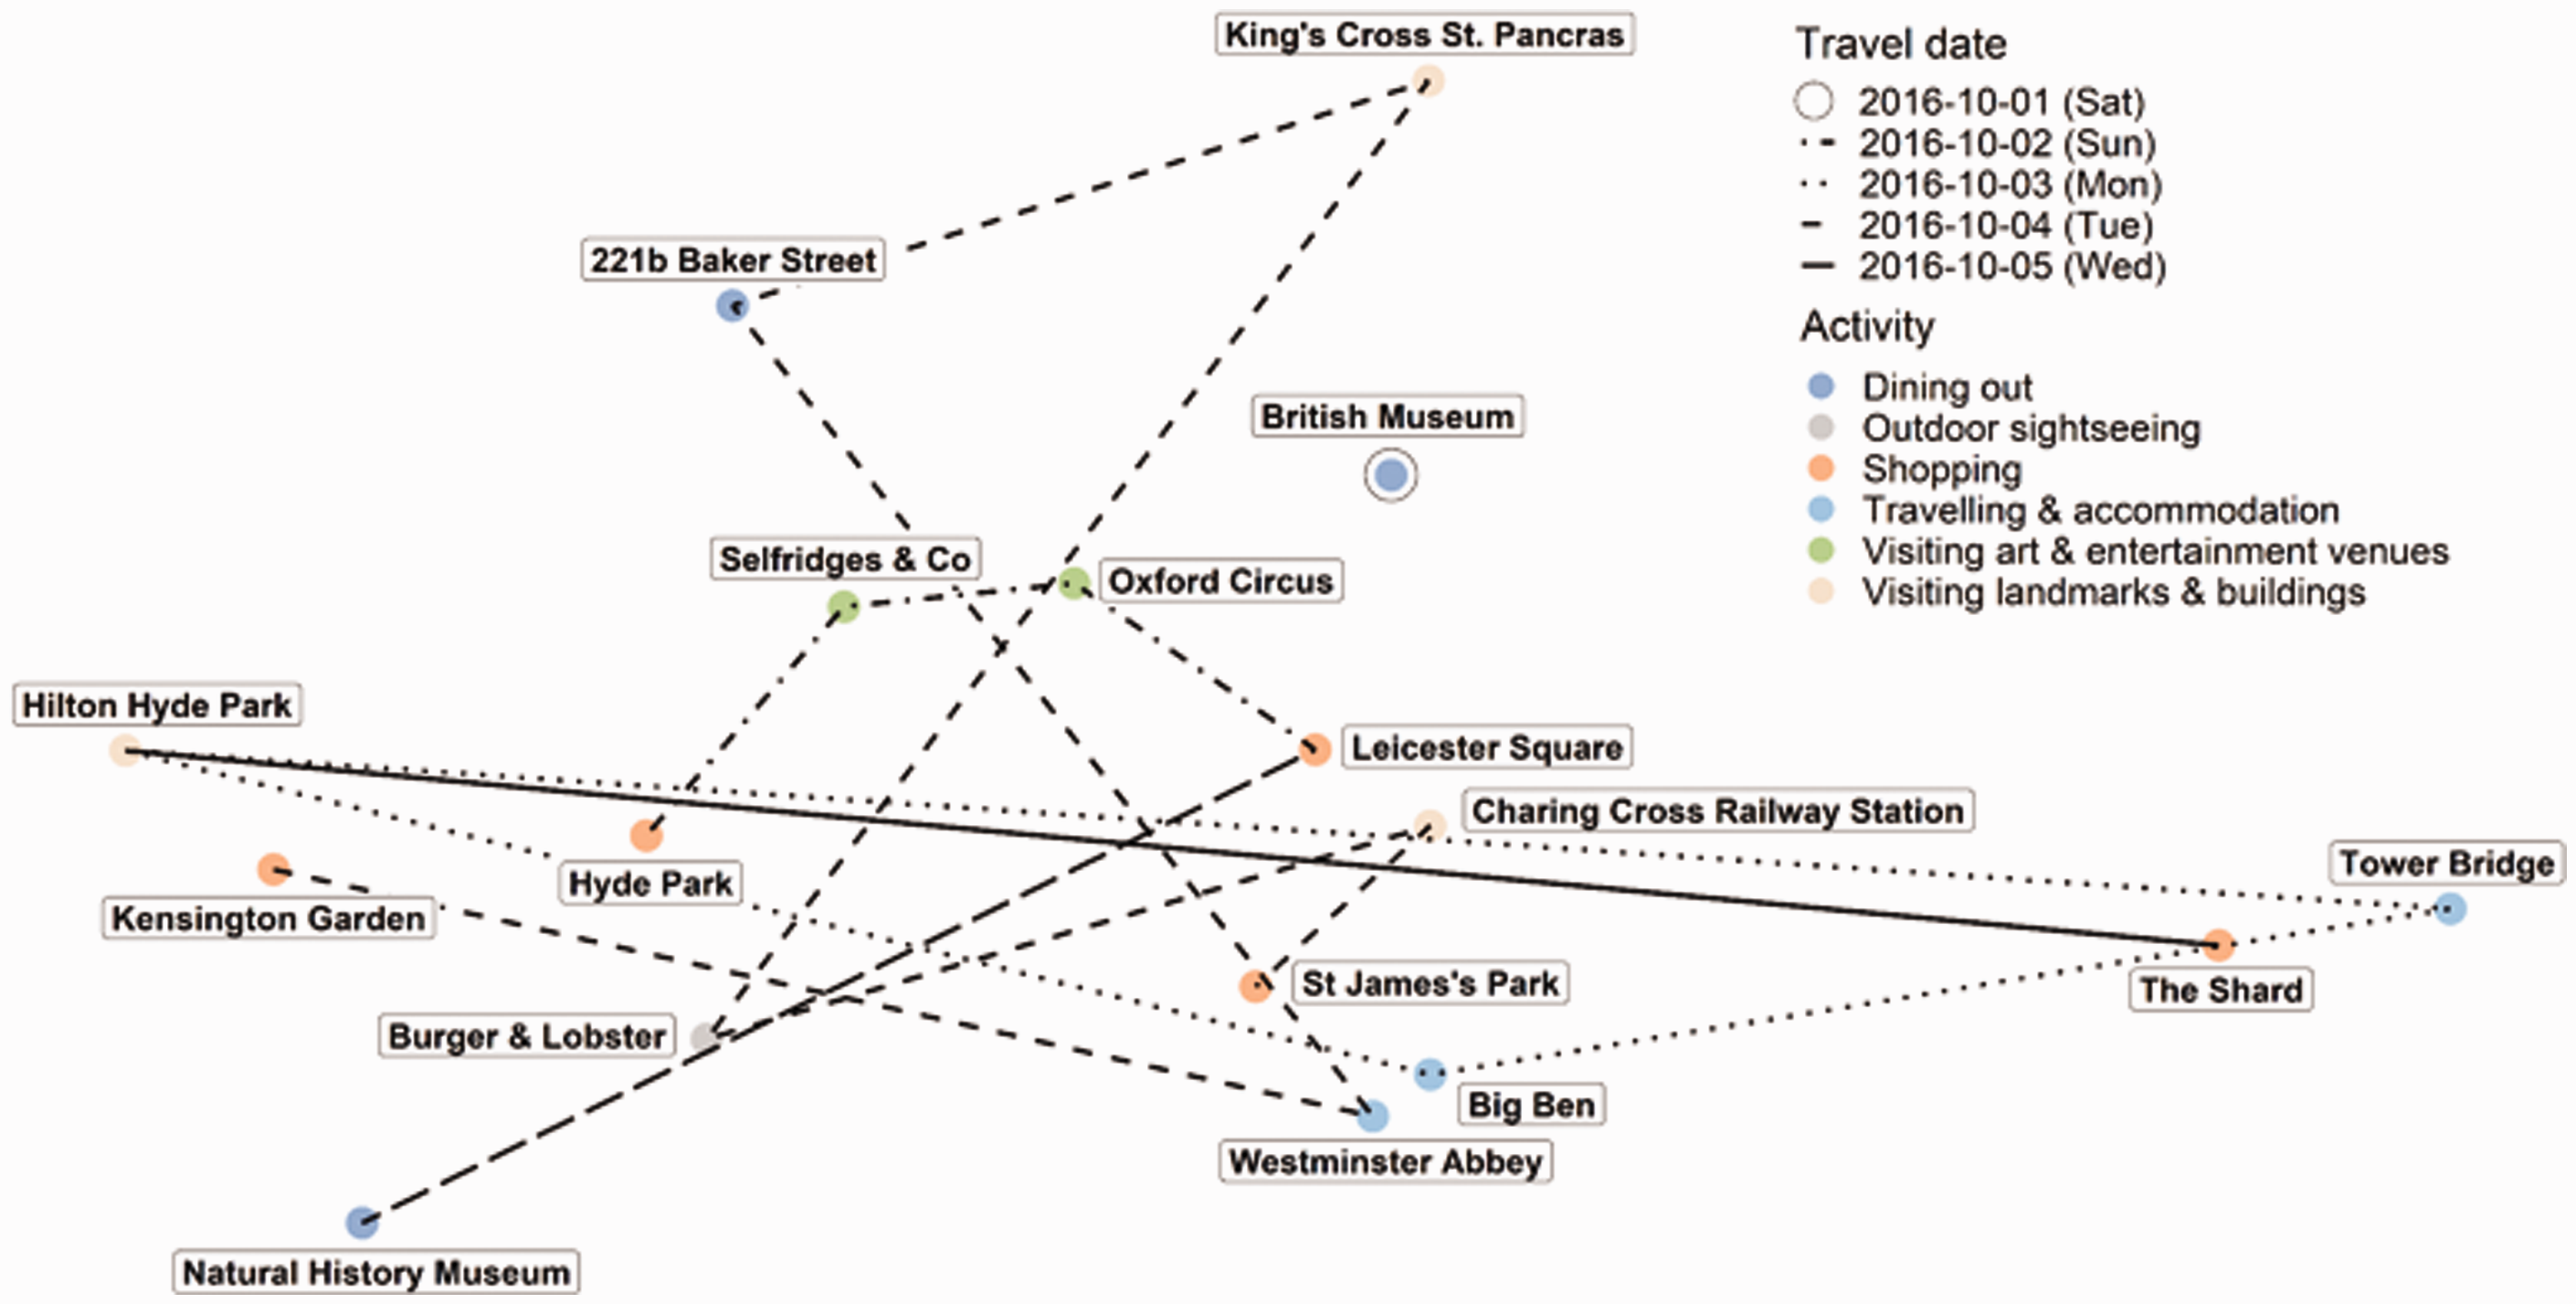
Indicative individual trajectory for a specific tourist Weibo user, capturing five separate days’ worth of activity during a single visit to London.
By aggregating all individual user-level trajectories (such as those shown in Figure 3 and derived for each of the 6465 individual tourist users), we can understand more about the core attraction networks in London. Our analysis reveals that 22 attractions act as key nodes based on their eigenvector centrality within the network, shown in Figure 4, which depicts the eigenvector centrality scores using graduated colours (while the size of the node reflects the number of check-ins according to the Weibo dataset). The results reveal that among all attractions in the network, The London Eye and Hyde Park are the most influential and vital attractions for Chinese tourists in London. Figure 4 shows an important trade-off between centrality and the number of check-ins, as highlighted by key transport interchanges. London King’s Cross Railway Station does not have as many check-ins as London Heathrow Airport, but exhibits much higher importance within this local network, forming an important node in Chinese tourists’ daily trip making behaviours while visiting London.
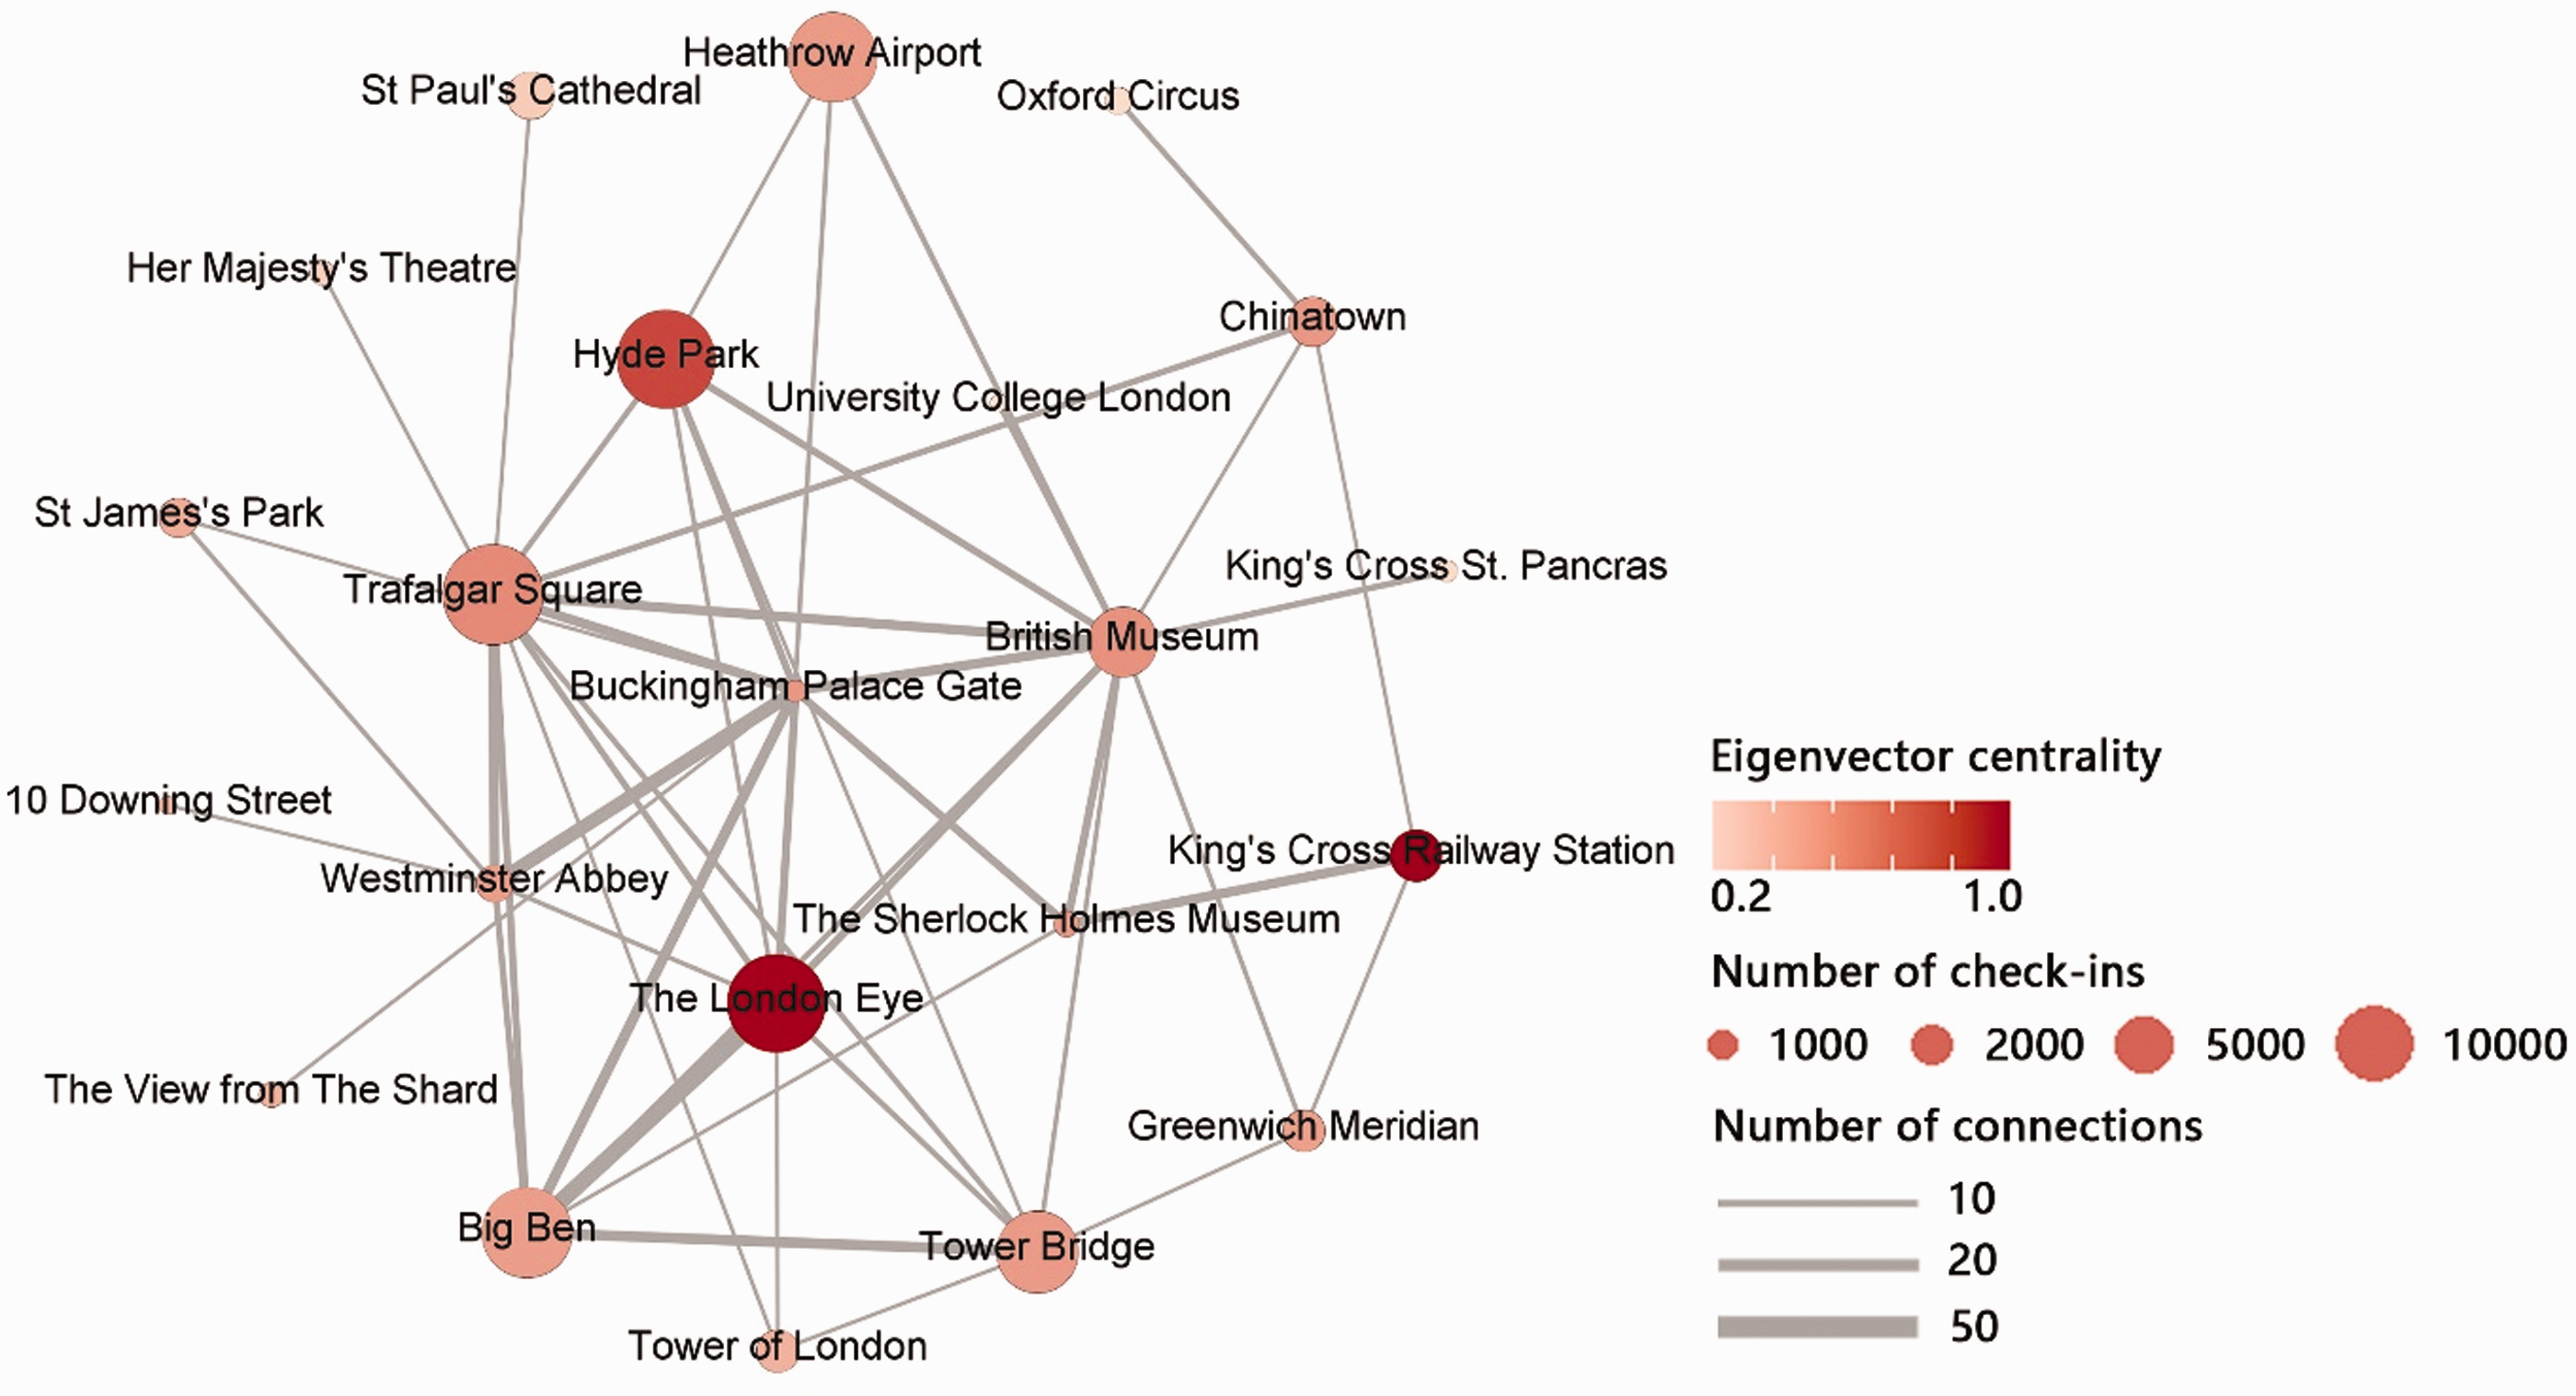
Core attraction network based on Chinese tourists’ daily Weibo check-in trajectories.
The thickness of the ‘edges’ (lines) connecting nodes is indicative of the volume of tourist flows between these two attractions, with 57 key edges identified. The strong links between central London attractions are clear, as is the importance of specific pairs of attractions such as The London Eye visited with Big Ben, Buckingham Palace and Westminster Abbey, and the British Museum with Trafalgar Square. These findings are compared with Comito et al. (2016) who use geotagged Twitter data to extract key connections between London attractions. We find that the Chinese Weibo tourist users share the same top connections as the Twitter users but that Chinese tourists show much stronger movements connected to the British Museum, Chinatown and the Sherlock Holmes Museum, which are not so popular in the Twitter data.
The ability to derive attraction networks from LBSN data, and thus construct aggregate-level indicators of centrality and connectivity between attractions can be useful for tourism destination management. The highlighted networks identify the importance of attractions along tourism routes with regard to both the visitation and their core–periphery position. The key origin–destination pairs could also offer benefits for urban planning in tourism destinations, including the evaluation and provision of visitor-oriented public transport, promotion of ancillary tourist services along principal routes utilised by tourists, support to enhance tourist safety and well-being along these routes, marketing opportunities or the effective provision of supplementary retail, leisure and catering opportunities.
Segmentation of Chinese tourists based on travel characteristics, activity preference and mobility patterns
In this sub-section, we attempt to investigate more on the individualised multipurpose trips of these Chinese Weibo tourists. A set of derived indicators (Table 2) are used to capture trip-related behaviours of each tourist user, utilising their individual trajectories (such as the example shown in Figure 3).
Outline of 41 variables capturing tourist Weibo users’ travel characteristics, activity preference and mobility patterns for use in segmentation.
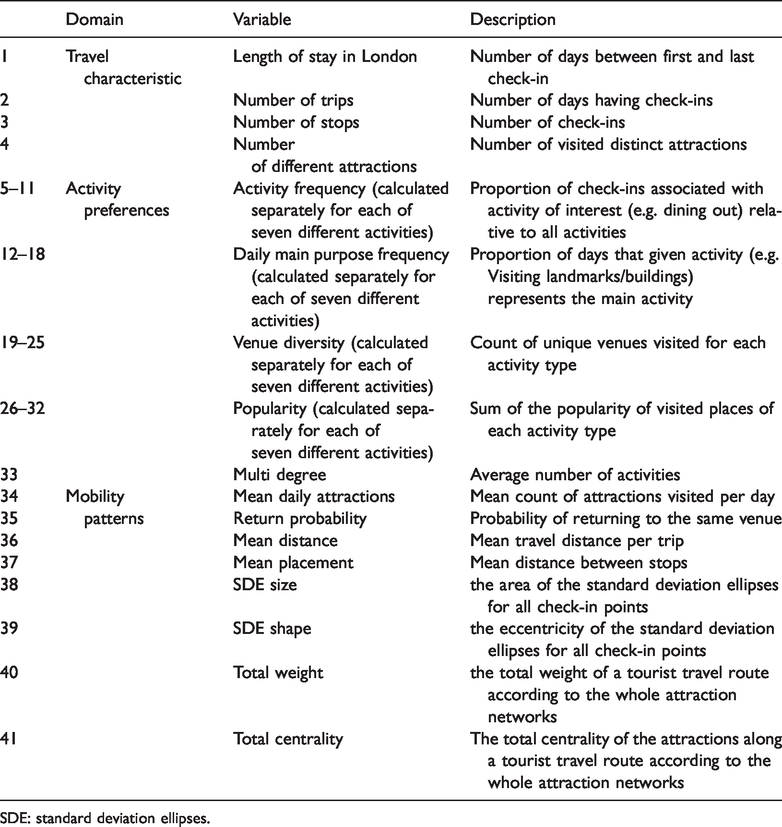
SDE: standard deviation ellipses.
The Travel characteristics domain captures the basic check-in behaviour of Weibo tourists during their stay in London, in common with approaches used to identify indicators such as length of stay from LBSN data (Chua et al., 2016; Preis et al., 2019). The activity preference indicators cover four dimensions of activity across seven key activity types and reflect the frequency of visit and relative importance of different activity types. The mobility pattern indicators capture the dimension, shape and structure of each tourists’ individual mobility trajectory. These include measures of the probability of a user returning to a previously visited attraction, their mean daily travel distance and the mean distance between attractions visited. We measure the size and shape of their spatial ‘footprint’ using Standard Deviation Ellipses (SDE), a centrographic measure to summarize the distributional trend for a set of point locations by reference to the centre of the ellipse and the lengths of the two orthogonal axes (e.g. Huang and Wong, 2016). We also assess the extent to which an individual user exhibits mobility patterns which are consistent with the typical behaviours within this dataset by considering the relative total weight and total centrality when compared to the aggregated typical attraction networks shown in Figure 4.
In total, we have 41 derived variables of individual tourist Weibo user behaviours, which we use in the following section to segment tourists based on those observed behaviours. Since these variables are derived from individual Weibo users’ observed behaviours and trajectories, we benefit from a rich and multi-dimensional dataset from which to classify these Chinese tourists into distinct groups or segments based on their observed behaviours.
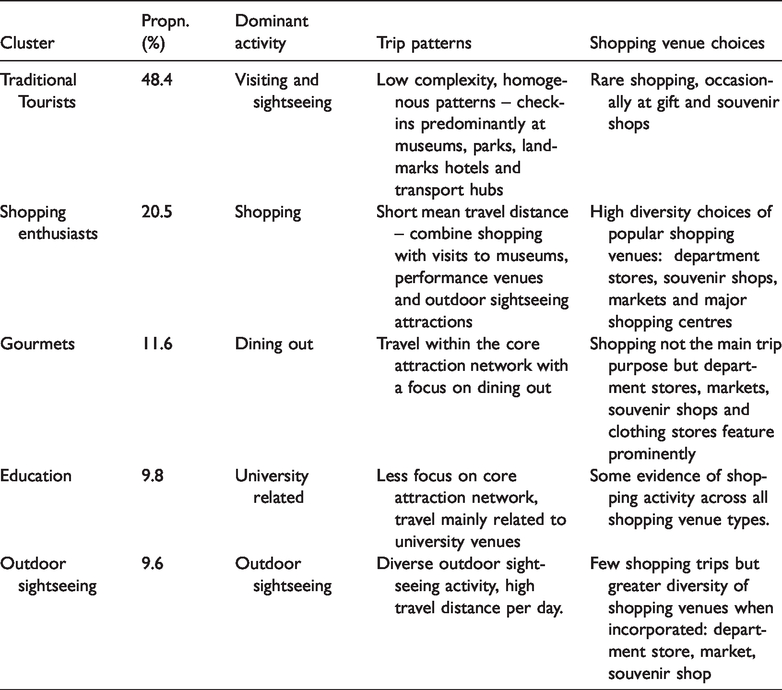
K-means is used to segment tourist Weibo users into distinct groups by the 41 variables outlined in Table 2, as described in the Section ‘Extracting insight from the Weibo dataset’. Before clustering, all the input data have been standardised by z-scores. The optimum number of clusters was determined via R package ‘NbClust’. Among the clustering solution from 2 to 10, the result of NbClust suggests 5 as the best number of clusters. When k = 5, the ratio of total between sum of squares to the total sum of squares is 78.3%, the best goodness-of-fit. The results are shown in Table 3. Our largest cluster ‘traditional tourists’ represents almost half of these tourist Weibo users with key attractions, landmarks and tourist amenities (such as accommodation) featuring prominently within their check-ins (Figure 5). Tourists in the ‘traditional tourists’ and the similar ‘outdoor sightseeing’ segments exhibit fairly homogeneous travel behaviours, linking together key attractions within the network utilising common routes.
Overview of Chinese tourists’ trip-related behaviours and activity preferences by segment.
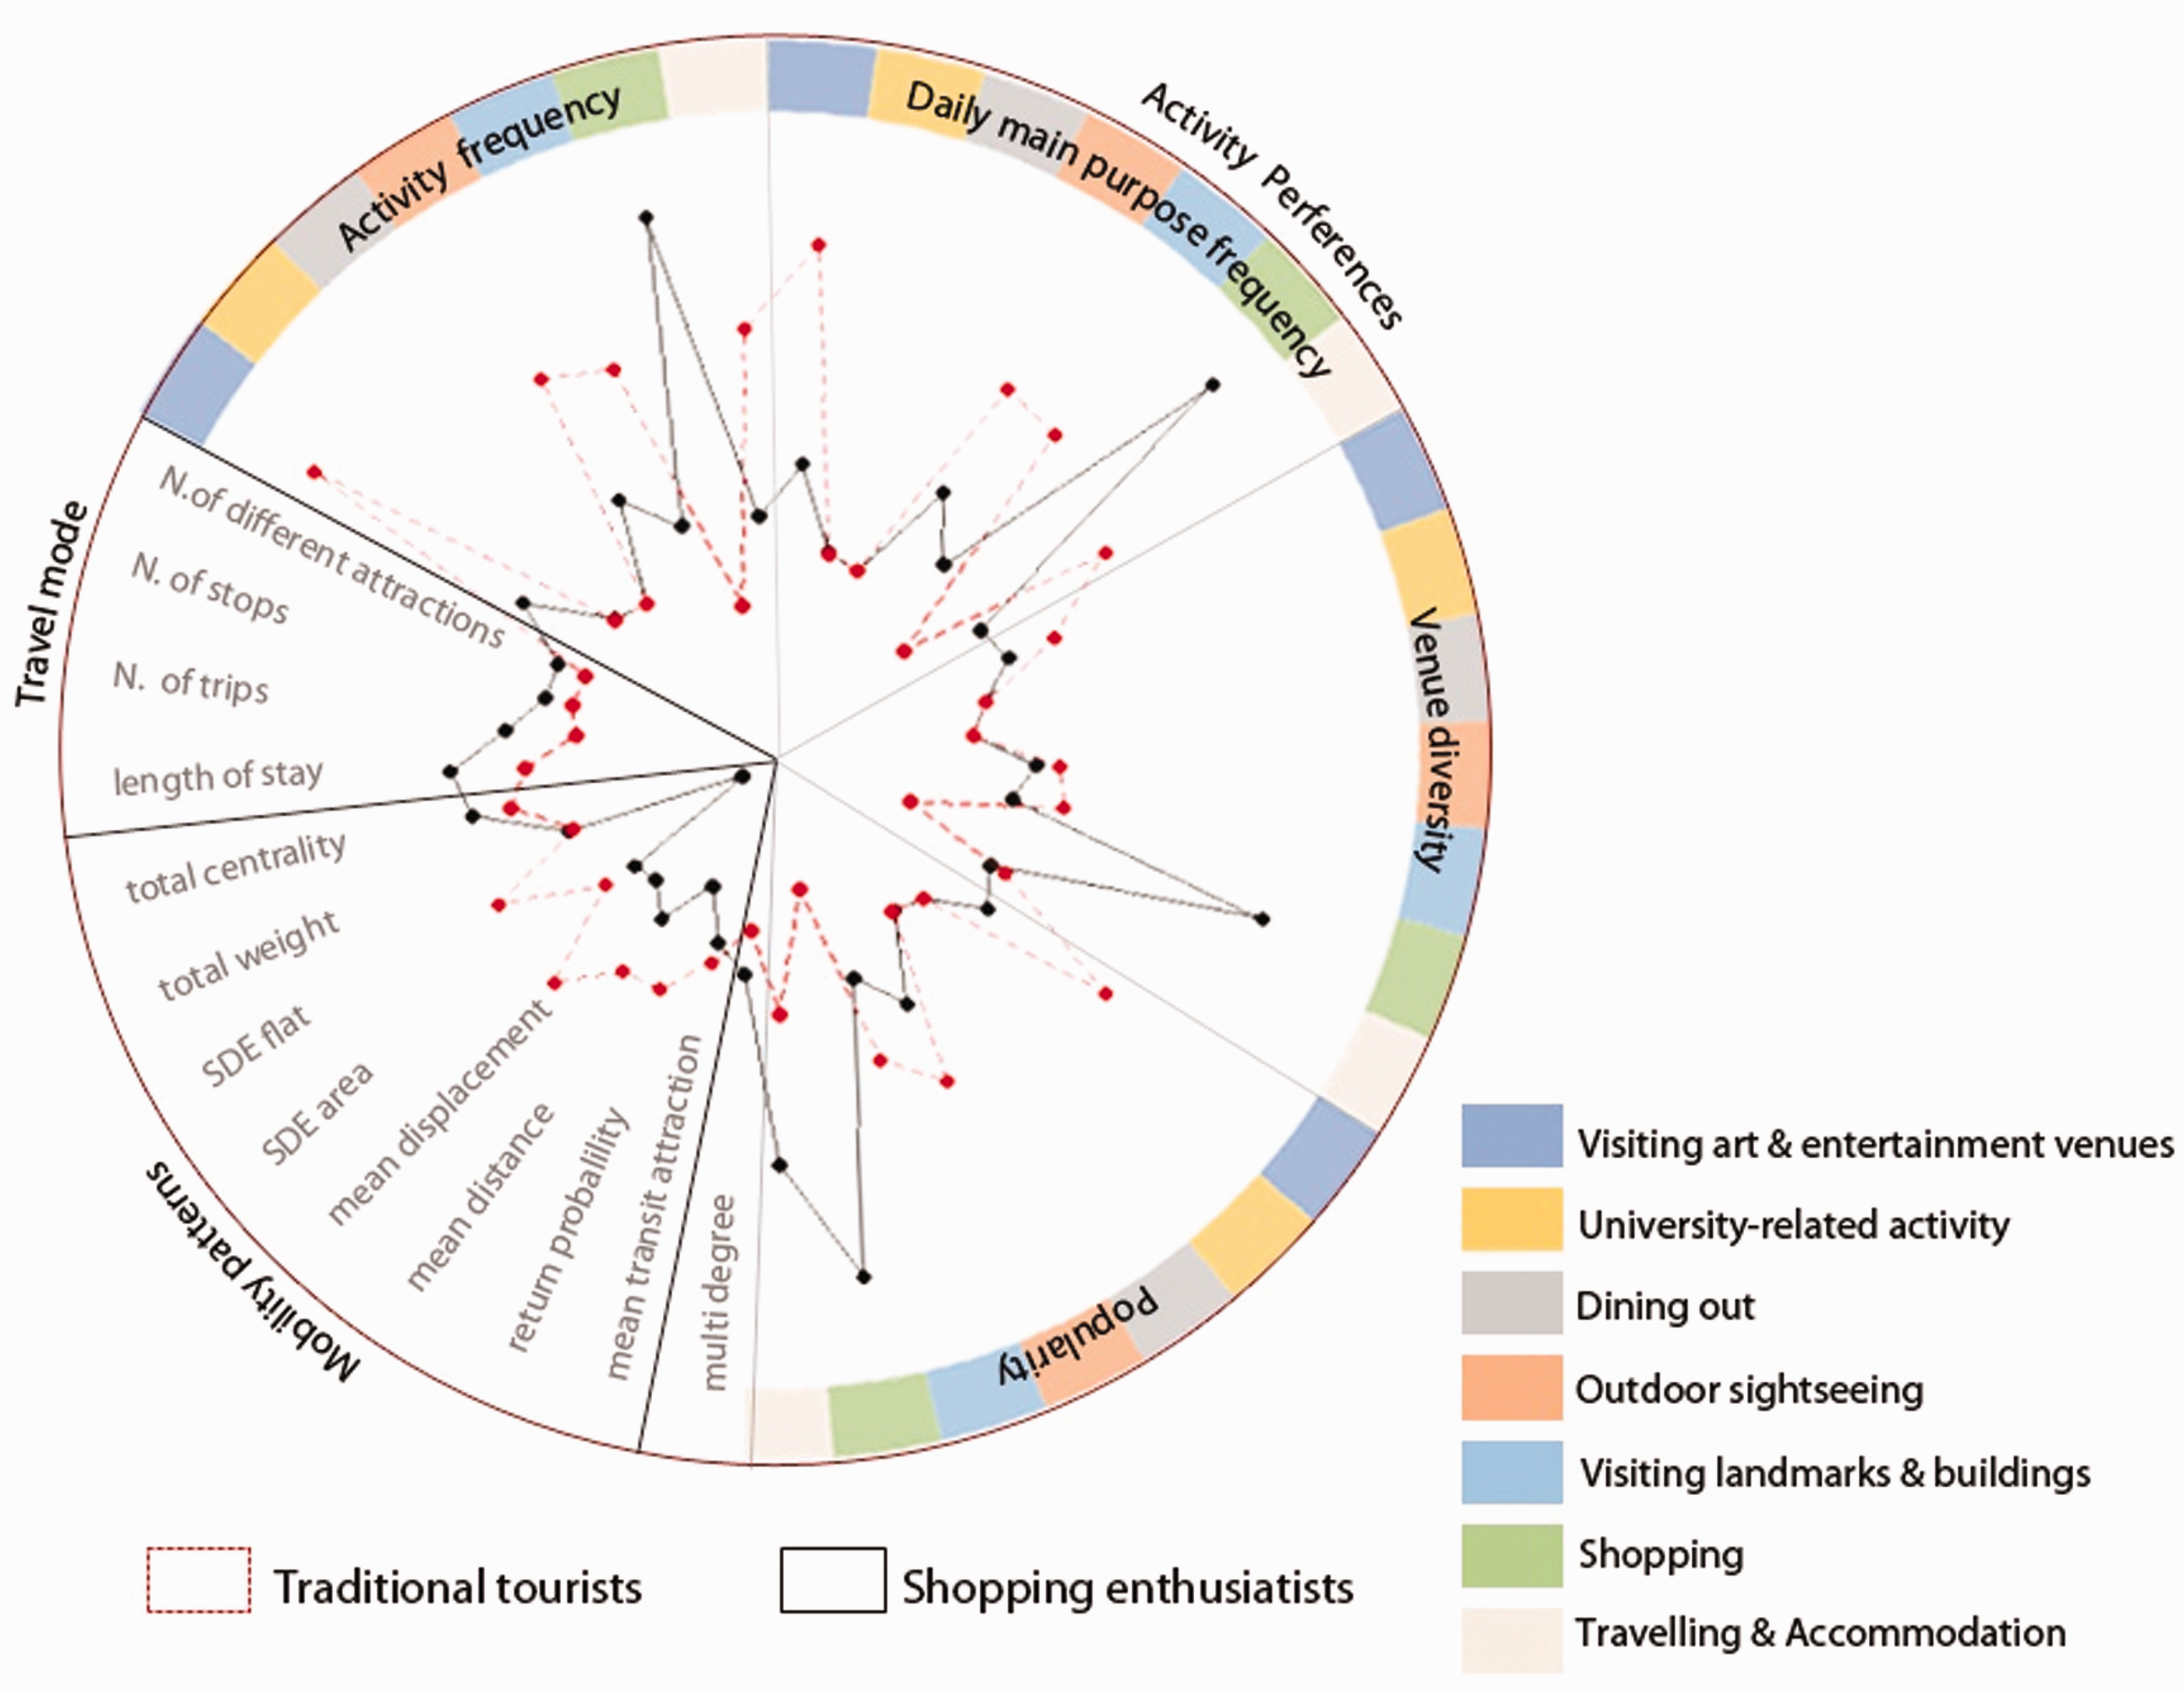
Radar charts to illustrate tourist Weibo users’ trip characteristics and behaviours on 41 key variables for (a) ‘traditional tourists’ and (b) ‘shopping enthusiasts’.
We are also interested in the remaining clusters which capture smaller groups of Chinese visitors who exhibit a preference for a broader range of activity and venue types, including shopping or dining out. These groups exhibit greater heterogeneity between tourists, with more dispersed spatial footprints and show less reliance on key nodes and common routes. Figure 5 illustrates key differences between ‘traditional tourists’ and ‘shopping enthusiasts’ with the latter (which comprise around one-fifth of the tourist Weibo users), exhibiting a higher propensity for their trips to be dominated by regular, prolonged and repeat visits to key shopping venues (major department stores and principal retail centres within Greater London). While these ‘shopping enthusiasts’ may typically exhibit a shorter length of stay than ‘traditional tourists’, the diversity of their individualised trajectories, greater than average travel distance and likelihood for return visits to individual attractions have important implications for the planning and management of tourist infrastructure. To illustrate the importance of any one activity group, we consider these shopping activity behaviours in more detail in the following section.
Shopping-related activities
Shopping-related activity is a key driver of Chinese tourist expenditures in London (China Tourism Academy, 2014; VisitBritain, 2018). Chinese tourists have a greater propensity to undertake high-value shopping as a core activity while in London (China Tourism Academy, 2014), spending an average of £2059 per visit to Britain in 2017, more than three times the average for all other international inbound visitor groups (VisitBritain, 2018). While shopping does not feature as a key driver of behaviour for all segments revealed from our clustering, all segments do exhibit some propensity to visit venues associated with shopping, highlighting the importance of major retail venues as a driver of Chinese tourist intra-destination mobility. Foursquare-derived venue-level POIs enable us to drill down further and exploit the depth and richness of venue-level information in order to understand the shopping activities undertaken as a secondary or tertiary activity by tourists with an alternative primary trip purpose, employing the topic modelling method LDA.
LDA enables us to mine the full richness of the venue information to understand more about activity preferences and how these activity choices connect as multipurpose travel patterns within each segment. As suggested by the outputs of the four metrics offered in R package ‘ldatuning’, the corpus of POI subcategories in each cluster has been generated into four topics summarised by the top prominent subcategories. Our LDA-driven insights are shown in Table 3 as part of the ‘multipurpose patterns’ and ‘shopping venue choice’ columns. These reveal that groups such as ‘Gourmets’ and ‘Outdoor sightseeing’ exhibit far more heterogeneous activity patterns than other clusters, revealing more individualised preferences at the venue sub-category level in relation to the types of cuisine favoured, the type of stores frequented or the less popular attraction types visited.
It is useful to explore one category in more detail: the shopping behaviours associated with tourists that fall into segments dominated by non-shopping activity types. We can use these to understand the shopping venue choices and the role of shopping for each segment. As the largest segment, ‘Traditional Tourists’ have a relatively low complexity and homogeneous multipurpose travel patterns, in which shopping activities are rare and only gift shops and souvenir shops are occasionally included. In contrast, shopping enthusiasts visit more diverse types of shopping venues: department stores, souvenir shops, markets, electronic stores, bookshops, shopping malls, flea markets and gift shops. They may intersperse these activities with visits to museums or other forms of sightseeing and their activity choices are likely to favour more popular venues. The ‘Gourmets’ also enjoyed varied shopping activities at department stores, markets, souvenir shops and clothing stores but seldom as their daily main purpose.
The LDA-driven enhanced venue-specific insight by cluster highlights the importance of mining the depth and richness of venue or POI information associated with LBSN check-ins, in this case enabling us to reveal venue-level specific insights for each cluster. Specifically, it has enabled the identification of shopping and consumption-related behaviours associated with tourists who have been classified as having different primary drivers of trip-related behaviours.
Conclusions
Weibo-derived user-generated LBSN data could offer spatial and temporal insights into the behaviours of this sizeable and important sub-group of tourists. We have cleaned and pre-processed these data, adding value by attaching high-quality venue-level information and distinguishing tourist users from other forms of temporary visitors or semi-permanent residents. The spatial characteristics of Chinese tourist check-ins are in keeping with our expectations of a tourist user base, with spatial clusters of Chinese tourists around core London attractions, museums, landmarks and major transport interchanges, in line with key tourist hot spots uncovered by previous research into tourist attraction preferences in London derived from LBSN sources (Comito et al., 2016; García-Palomares et al., 2015). However, we find that key hot spots of Chinese tourist activity are far more discretely clustered and delineated than the underlying distribution of those attractions themselves. Thus, clear spatial clusters of Chinese tourist activity are evident, and these are not entirely driven by the underlying distributions of core attractions, accommodation provision or opportunities for consumption activities. Analysis of this nature affords insights into the micro-level spatial distribution of subgroups of tourists.
Weibo thus presents an opportunity to focus on the behaviours associated with inbound tourists from a single country of origin. Given that Chinese outbound tourism is increasing rapidly, it is unsurprising that China has become the most important global outbound market in terms of expenditures (UNWTO, 2018). Our insights into the spatiotemporal dimensions of these tourists’ activities within a major receiving destination such as London are useful in their own right in order to understand the behaviours of this subset of tourists. Moreover, we demonstrate the potential which Sina Weibo affords researchers in uncovering observed behaviours associated with Chinese international tourists including the range and spatial extent of destinations visited and their trip purpose – extending far beyond the scale and volume of data that could be collected via survey mechanisms.
Our findings could also support wider interest in deriving new proxies that can be used to infer tourist flows and behaviours. There is considerable interest in deriving official tourism statistics from LBSN data streams, such as to supplement IPS sample survey estimates of inbound tourism magnitudes. For example, geotweets from Twitter and geotagged photo sharing from the Flickr platform have been found to offer great potential in inferring counts of visitors for a variety of inbound markets in the UK (see Barchiesi et al., 2015; Steiger et al., 2015) and other major tourist receiving countries (see Preis et al., 2019). Weibo-derived check-in data could offer similar headline insights along with within-destination mobility and consumption patterns which are not well captured by official tourism statistics. The availability of a comprehensive record of all check-ins (rather than the very limited 1%–2% sample of check-ins as afforded by the free Twitter API) and the clearly identifiable user group (predominantly tourists with a Chinese residential origin) heightens the potential usefulness of these data and warrants further study, especially in relation to their potential to support the production of official population statistics.
Construction of individual tourist mobility trajectories reveals that many Chinese tourist Weibo users restrict their activities to a core network of attractions, with distinct groups of tourists exhibiting behaviours associated with consumption activities (e.g. shopping) or a tendency to explore more peripheral locations and attractions. This level of insight is typically omitted from surveys or official statistics. We offer new perspectives on observed multipurpose tourist activity patterns, derived from those users’ digital footprints. This fills a gap in the existing literature and highlights the effectiveness of these data to generate insights into tourist destination choices alongside the value of these data within a data-driven segmentation of tourists based on destination-level behaviours and mobility patterns.
Our segmentation captures these spatial and attribute dimensions of users’ activities and indicates that each Chinese tourist segment has distinct multi-purpose travel behaviours and activity venue choices. These findings help to shed further light on Chinese tourist travel mobility and consumption-related behaviours in London. These insights could be utilised to understand Chinese tourist demand and support tourism package design (e.g. see Majid et al., 2013), in administering within-destination surveys (see Abbasi et al., 2015) and destination management. We are particularly interested in these tourist shopping behaviours, and our ongoing wider research focuses on extracting those behaviours to support retail demand estimation and store location planning.
Footnotes
Declaration of conflicting interests
The author(s) declared no potential conflicts of interest with respect to the research, authorship, and/or publication of this article.
Funding
The author(s) disclosed receipt of the following financial support for the research, authorship, and/or publication of this article: This work is part of a PhD studentship (Zi Ye) funded by the China Scholarship Council.