
Abstract
Aim:
Although the levels of cardiac troponin I (cTnI) have proved to be a useful diagnostic biomarker of acute myocardial infarction, there are a wide variety of point-of-care (POC) analysers, which provide measurements of cTnI. The aim of this study was to compare the results obtained by the ADVIA Centaur ultra-assay cTnI assay (us-cTnI), ADVIA Centaur high-sensitive cTnI assay (hs-cTnI) and a POC high-sensitivity assay using PATHFAST. We also aimed to explore total turnaround time (TAT) for laboratory results using the POC PATHFAST analyser.
Methods:
Samples from 161 patients were taken. Of these samples, 129 were tested with all three assays (us-cTnI, hs-cTnI and PATHFAST), and 32 samples were tested on PATHFAST for the comparison of whole blood, serum and plasma.
Results:
Comparison of the POC testing methods in this study demonstrated that there are strong linear relationships between all three cTnI assays (us-cTnI, hs-cTnI and POC on PATHFAST). Furthermore, we also show there are strong linear relationships between the two high-sensitive cTnI assays (hs-cTnI and PATHFAST) for blood serum samples, as determined by Passing–Bablok regression analyses. In our comparison of our new data with our older study, the TAT went down.
Conclusion:
The timeliness of laboratory results is, in addition to accuracy and precision, one of the key indicators of laboratory performance, and at the same time has a significant impact on the course of the patient’s condition. It is therefore important that the laboratory strives to meet the expectations of clinicians regarding the time from the order to the result of the analysis.
Introduction
The number of emergency department patients with suspected acute myocardial infarction (AMI) represents a large global burden. 1 Over the years, the levels of cardiac troponin I (cTnI) have proved to be a useful diagnostic biomarker of AMI. 2 The levels of cTnI have also been shown to be preferable to another marker, creatine kinase (CK)-MB, 3 as well as cardiac troponin T (cTnT). 4 Clinical practice has also been gradually changed with as improvements in the sensitivity of cTnI assays have been made. 5
There are a wide variety of point-of-care (POC) analysers, which provide measurements of cTnI in whole blood or plasma. These POC methods, as well as different laboratory analysers, yield considerable differences in numerical results, yet they have similar clinical interpretation. Differences may be the result of assay calibration, the use of different antibodies, assay designs, instrument limitations and matrix used.
The purpose of this work was to perform analysis of various matrices (whole blood, plasma and serum) on a PATHFAST POC analyser and compare the results with those obtained from central laboratory platforms, an ultra-sensitive cTnI assay (us-cTnI) and a high-sensitive cTnI assay (hs-cTnI). We also aimed to calculate the total turnaround time (TAT) for cTnI and determine the proportion of the results which are communicated to the ward on time, according to the pre-determined level of urgency using the POC PATHFAST analyser. Thus, an additional aim of this study was to separate TAT into different phases of work and compare these results with those from our previous study that examined TAT in the clinic. 6 We predicted that TAT would be shortened with the PATHFAST POC analyser.
Methods
Study participants
A total of 161 blood samples, with an order for cTnI, were collected at the University Medical Centre Ljubljana (UMCL) in Ljubljana, Slovenia, from 1 April 2019, until 4 June 2019. Of these samples, 129 were tested with us-cTnI, hs-cTnI and PATHFAST, and 32 samples were tested on PATHFAST alone for the comparison of whole blood, serum and plasma. This study was approved by the National Ethics Committee (approval no. #0120-405/2020-30), and the patients (from whom we took additional blood beyond that normally acquired during hospital intake) gave verbal informed consent during the triage process which was recorded in their patient record. Inclusion criteria for this study included admittance to the emergency room for chest pain. There were no exclusion criteria for subjects.
Sample collection
The total blood volume collected was 4 mL in a plain tube without an anticoagulant. To calculating cross-comparability of the different matrices (whole blood, serum and plasma), an additional tube with K3-EDTA anticoagulant was withdrawn (3 mL of blood) at the emergency room. Blood samples were obtained by routine venepuncture in accordance with the standard procedure at our UMCL. In addition, samples for POC analysis were analysed immediately after the sampling at the emergency department.
CTnI assays
Table 1 lists the characteristics of the three cTnI assays included in this study. The analytical performance of a laboratory method is defined with the limit of detection (LoD), limit of blank (LoB), functional sensitivity (LoQ) and the 99th percentile of a healthy reference population.7–9 These three methods have different analytical performance (Table 1), and have all the calculated ratio between 99th percentile and LoD greater than 1, us-cTnI method: 6.67; hs-cTnI method: 21.81; PATHFAST method: 11.97.
Characteristics of us-cTnI, hs-cTnI and POC hs-cTnI on PATHFAST.

POC: point-of-care; Bc: conjugated bilirubin; Bu: unconjugated bilirubin; EDTA P: ethylenediaminetetraacetic acid plasma; F: female; LHP: lithium heparin plasma; M: male; P: plasma; S: serum; WB: whole blood.
Values from the manufacturer’s website (https://www.pathfast.eu/hs-troponin).
The protocol of this study specified that all measurements in the laboratory (us-cTnI and hs-cTnI) were performed on the same analyser (ADVIA Centaur 2400, Siemens) at the same time and in accordance with manufacturer’s recommendations. The POC on PATHFAST assay was performed in whole blood immediately after the venepuncture. To obtain plasma and serum from whole blood samples, tubes were centrifuged at 1500g for 10 min and then analysed using PATHFAST.
Data analysis
Data analysis was performed with Medcalc, version 19.1. Linear regression analyses and the Passing–Bablok regression method were performed for assay comparisons, where appropriate. The Passing–Bablok regression method is a more advanced robust statistical method in which it is not necessary to exclude outliers. Cunsum tests for linearity were also performed. Statistical significance was defined as p < 0.05.
Results
Linear regression comparisons of us-cTnI, hs-cTnI and POC on PATHFAST
We used linear regression analyses to compare us-cTnI, hs-cTnI and POC on PATHFAST. We found strong linear relationships between all three methods (Table 2). These results suggest that the methods are comparable.
Strong linear relationships were observed between the three different cTnI methods compared in this study.

Analysis of whole blood, plasma and serum on the POC analyser and comparison of the results with those derived from the hs-cTnI method
The PATHFAST analyser was used to determine cTnI levels from whole EDTA blood. Then, the remaining blood was processed such that cTnI could be determined in serum and plasma on the same analyser. In addition, these results were compared with routine hs-cTnI method in serum. The results obtained by both methods were compared using the Passing–Bablok statistical calculations and are presented in Table 3.
Passing–Bablok regression analysis equations for comparison of troponin I in different matrices (whole blood, plasma and serum) on a high-sensitive PATHFAST POC analyser and with a routine high-sensitive method (hs-cTnI). Cunsum test for linearity indicates no significant deviations from linearity (p > 0.50).
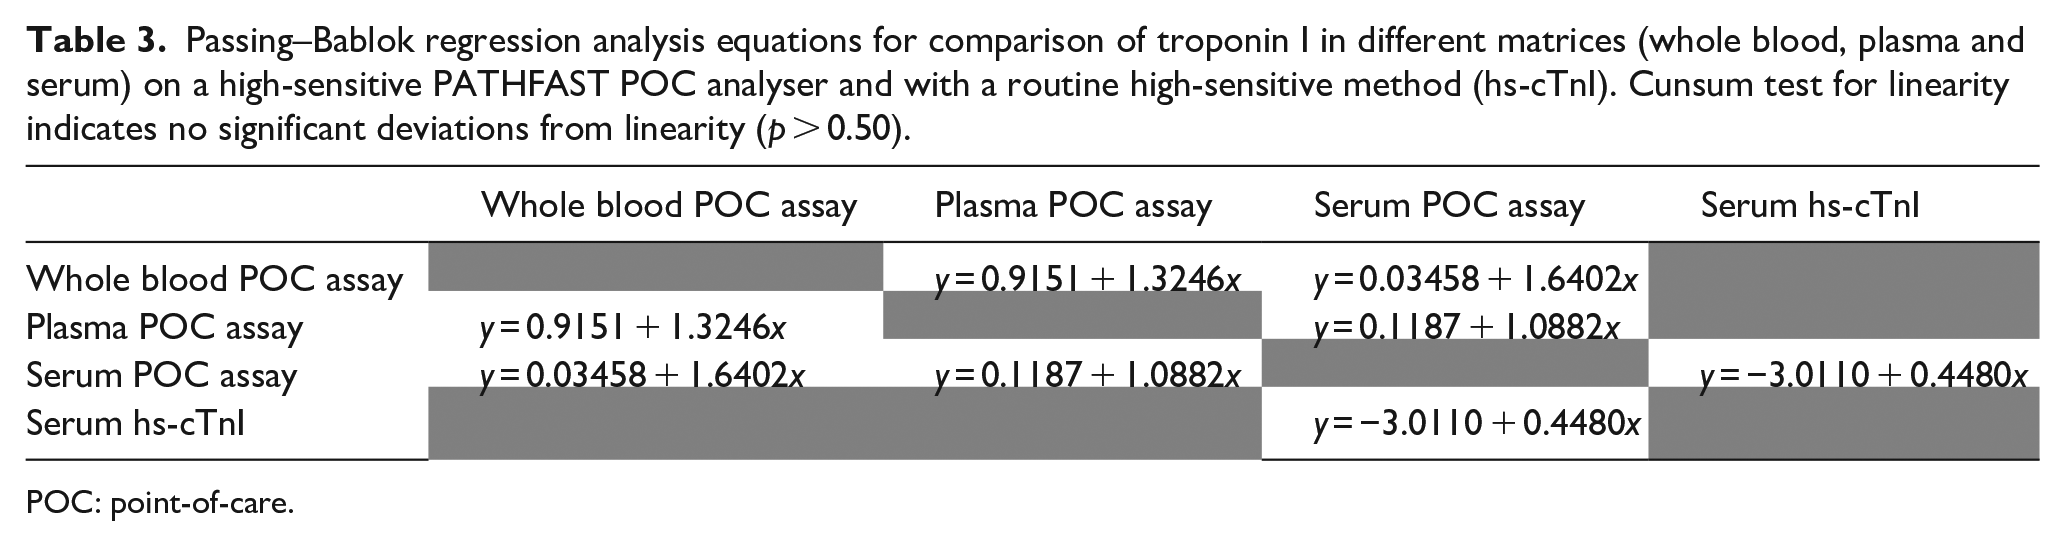
POC: point-of-care.
Calculation of TAT for cTnI and the proportion of the results which are communicated to the ward on time
For this evaluation, we divided the results according to the pre-determined level of urgency and compared the TAT for each level and the proportion of several tasks inside TAT. In the next step, we calculated how many results (%) were on time when using the pre-determined time, and how many results (%) are in the time frame according to guidelines. Practice guidelines suggest a turnaround time of 60 min or less from the receipt of the sample in the laboratory.10,11 The distributions of the turnaround time for the emergency department are shown in Figure 1.

The proportion of cTnI determination results at the emergency department over time.
In the protocol N (the highest emergency level) or level 2, we predicted that the result of the cTnI determination would be delivered to the doctor within 100 min, level 3 within 120 min, and level 4 in longer than 120 min. The calculations show that cTnI levels were determined within 100 min for protocol N at a rate of 89.67% and for the protocol 2 at a rate of 78.10% (Table 4). When calculating for levels 3 and 4, we found that orders in the information system were generated in a package, for example, during the night shift, and blood draws were made in the morning. To roughly evaluate the differences, we excluded all results where this time was more than 10 h. For the level 3, 46.46% of orders were delivered within 120 min, and for level 4, 42.02% of orders were delivered in longer than 120 min but less than 10 h. We also wanted to evaluate the actual time from when the sample was brought to the laboratory until the result was confirmed. We found that these times did not differ statistically significantly with respect to the emergency level (Table 4).
Total turnaround time by unit and the proportion of those completed during the scheduled time.
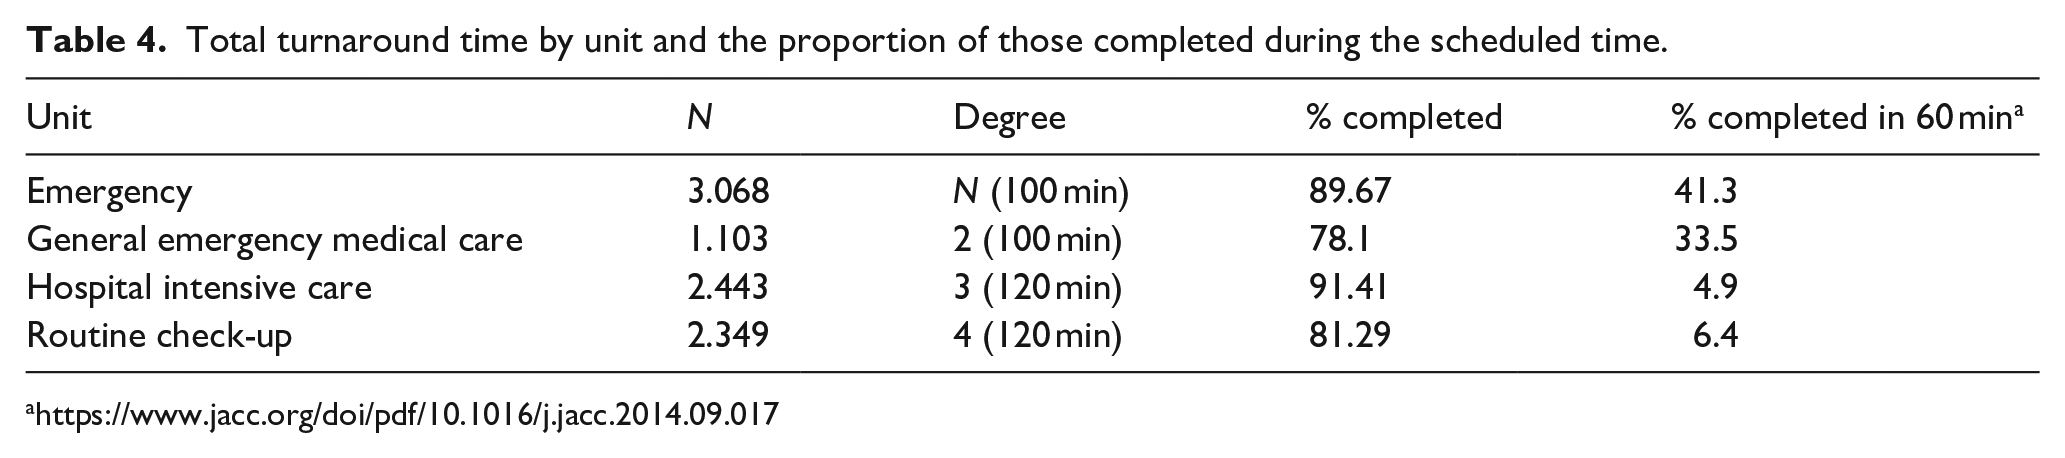
Concerning the 60-min recommendation, 4 our emergency department processed only 41.3% of the most urgent samples according to pre-determined levels of urgency, while 33.5% of samples from the general emergency medical care unit (urgency level 2) received results within 1 h. In addition, only 4.9% and 6.4% of samples from urgency levels 3 (hospital intensive care) and 4 (routine check-up) meet this recommendation, respectively. In the case of non-urgent samples, it should be emphasized that a longer turnaround time is largely dependent on the time of the order in the department, which is often several hours before the blood collection.
Comparison of TAT from these new data with the results of our previous study
We had previously performed a similar study. 6 In that study, we collected 480 samples and calculated the proportion of confirmed results in relation to TAT and the proportion of time needed for transport of the samples to the laboratory, the time needed for analysis and confirmation of the results. In the previous study, we confirmed 23.7% results in 60 min, while in this study, we confirmed 41.3% of results in 60 min. In addition, in the previous study, the percentage of confirmed results in 90 min was 33.7%; in this study, the percentage of confirmed results in the same time was 84.5%.
To obtain information on how much time is spent on certain tasks within the laboratory and on the transport of samples to the laboratory itself, we measured the necessary times for individual phases of analysis from the order to the confirmation of the result. A comparison of these times is shown in Table 5.
Time comparison of different tasks for the two studies.

When further comparing the urgency rates of this study and the previous study, 6 we found variations in the times from the order of analysis to the time when the sample was brought to the laboratory for urgency rates of three and four. The analysis has shown that these times are unrealistic because many departments often order an analysis during the night shift, while blood is taken in the morning. For this reason, only those samples where the difference was less than 10 h were considered. Nevertheless, we wanted to check the times related to the laboratory treatment in these samples, that is, the time of analysis and confirmation of the results. This comparison is shown in Figure 2.

Time proportions of cTnI determination at different emergency levels.
These data show that the calculated times for emergency department (N) are shorter than for urgency level 2 (72.8 min vs 83.8 min) (p < 0.0001). The difference in time may be in part due to the transport (pipe mail) established with the emergency department, and partly to the fact that all samples from pipe mail come directly to the work site and not through the central reception. The calculations show that there are no significant differences in the time of analysis and conformation of the results. As expected, there is a difference in time for samples from levels 3 and 4 (Table 6).
Proportion of the results of cTnI determination at the emergency department (N) and other levels presented in numbers and %.

Discussion
In this study, we found that there are strong linear relationships between all three cTnI assays in this study (us-cTnI, hs-cTnI and POC on PATHFAST). Furthermore, we also show there are strong linear relationships between the hs-cTnI and PATHFAST for blood serum samples, as determined by the Passing–Bablok regression analyses.
The turnaround time between a blood draw and the reporting of assay results is an important limiting factor to rapid decision-making. For years, there has been a drive to develop diagnostic strategies which allow accurate identification of patients without myocardial infarction at an earlier stage, which may not require admission to hospital for serial cardiac biomarker testing. One potential strategy to improve efficiency is using POC devices. Delivery of rapid and accurate measurements of cTn at the bedside could allow earlier diagnosis or rule-out of myocardial infarction. 12 High-sensitivity designation requires the assay coefficient of variation at the 99th percentile of a healthy population to be less than 10% and the assay measure troponin concentrations between the level of detection and the 99th percentile in at least 50% of healthy individuals. 8
Recently, one study has produced evidence that the cTnI assay PATHFAST cTnI-II (LSI Medience Corp., Tokyo, Japan) meets these criteria. 13 These findings have been confirmed by Sörensen et al. 14 concluded that this technology has overcome the limitations of the previous assays and that PATHFAST cTnI-II assay may be used in rapid diagnostic protocols. Our results also confirm these observations. They show comparability between all three different matrices (whole blood, serum and plasma) with PATHFAST cTnI-II assay and with both routine methods of measuring serum troponin (us-cTnI and hs-cTnI). Of all the matrices, the whole blood result matched the most compared to the hs-cTnI routine method, making the PATHFAST cTnI-II assay particularly useful in situations where we need the result quickly and we do not need to wait for the samples to be centrifuged and in situations where there is a delay in the laboratory. Studies performed in different laboratories, 15 as well as data from manufacturers indicate that there is no difference between heparinized plasma and serum, and that EDTA plasma gives lower results. 16 In addition, Clerico et al. 17 argue that POC testing for cTnI assays with high-sensitivity performance may represent a formidable progress because they may ensure a more rapid diagnostic turnaround time. Furthermore, hs-cTnI POC testing assays may open the possibility of a ‘decentralized’ diagnosis of myocardial injury and infarction, even in primary care and other remote clinical settings. Altogether, our data are in line with these observations.
We tracked turnaround time from the moment samples are received at the laboratory to the reporting of results. An important part is the organization of the hospital itself and its transport service. To meet these requirements, our laboratory has instituted fast-track protocols (emergency level N and 2; see Table 7), including the use of pneumatic tubes for sample delivery, and computer order entries by physicians at the emergency department. How much each segment contributes to the overall time can be seen by comparing today’s results with those of our smaller study we conducted previously. 6
Description of emergency levels at the hospital.

When comparing the time from the order of analysis to the result of different tests, we observed that there are different preparations and treatments for the samples, such that laboratory testing require longer time (e.g. centrifugation) and POC testing requires less time for pre-preparation (e.g. direct analysis). A good example of analysing the effects on time from order analysis to result is shown in the Q-Probes study where they found that the largest deviation occurs mainly when waiting for samples in the ward itself due to too slow transport. Another major discrepancy was observed in order processing, which they attributed to department overcrowding. The interval in sample collection and processing also deviated. As a reason, they stated that the samples were collected by nurses who are not as skilled as the more educated and quality staff, especially during the overcrowding of the department.18,19
There are several limitations to this study. First, our sample size is somewhat small. We also had the main protocol of introducing the hs-cTnI methods instead of the us-cTnI method. During this period, we performed more than 8000 paired tests. Along with this protocol, we took several samples for POC testing.
Most of the causes for the delayed time from the order of the analysis to the result in this study lie in the pre-analytical phase. The pre-analytical phase study showed that factors that most prolong the time from ordering the analysis to the result are missing samples from the patient, slow enrolment of samples in the information system, system overcrowding, slow communication between laboratory and clinic, unnecessary ordering of emergency tests and overcrowding of orders.
Conclusion
The timeliness of laboratory results is, in addition to accuracy and precision, one of the key indicators of laboratory performance, and at the same time has a significant impact on the course of the patient’s condition. It is therefore important that the laboratory strives to meet the expectations of clinicians regarding the time from the order to the result of the analysis. When setting target times, it makes sense to categorize patients into different urgency groups. The easiest way to control timeliness is to define the steps of the process from the order to the result of the analysis and then precisely define the interval, which is defined as the time from the order to the result of the analysis. In case of deviations from the set goals, it is necessary to identify the critical points that are the reason for the deviations and find solutions that would eliminate such deviations.
Footnotes
Acknowledgements
The authors thank Siemens Slovenia and GENOS d.o.o. for reagent donation for testing protocol. The authors thank Nada Snoj for monitoring of laboratory analysis and Miha Kovač and Pia Vovk for providing clinical data.
Author contributions
All authors met the criteria for this journal’s authorship credit as set forth by the author’s guide. Each authors’ name is given next to the appropriate category. J.O. contributed to the study conception and design. P.F. contributed to the laboratory analysis. K.K. and J.T. contributed to the PCO analysis. T.F. and K.K. contributed to the statistical analysis. J.O., L.P. and H.M. contributed to the interpretation of data. J.O. contributed to the drafting of manuscript. H.M. contributed to the critical revision.
Declaration of conflicting interests
The author(s) declared no potential conflicts of interest with respect to the research, authorship and/or publication of this article.
Funding
The author(s) received no financial support for the research, authorship and/or publication of this article.