
Abstract
Introduction:
In addition to clinical factors, blood-based biomarkers can provide useful information on the risk of developing post-stroke epilepsy (PSE). Our aim was to identify serum biomarkers at stroke onset that could contribute to predicting patients at higher risk of PSE.
Patients and methods:
From a previous study in which 895 acute stroke patients were followed-up, 51 patients developed PSE. We selected 15 patients with PSE and 15 controls without epilepsy. In a biomarker discovery setting, 5 Olink panels of 96 proteins each, were used to determine protein levels. Biomarkers that were down-regulated and overexpressed in PSE patients, and those that showed the strongest interactions with other proteins were validated using an enzyme-linked immunosorbent assay in samples from 50 PSE patients and 50 controls. A ROC curve analysis was used to evaluate the predictive ability of significant biomarkers to develop PSE.
Results:
Mean age of the PSE discovery cohort was 68.56 ± 15.1, 40% women and baseline NIHSS 12 [IQR 1–25]. Nine proteins were down-expressed: CASP-8, TNFSF-14, STAMBP, ENRAGE, EDA2R, SIRT2, TGF-alpha, OSM and CLEC1B. VEGFa, CD40 and CCL4 showed greatest interactions with the remaining proteins. In the validation analysis, TNFSF-14 was the single biomarker showing statistically significant downregulated levels in PSE patients (p = 0.006) and it showed a good predictive capability to develop PSE (AUC 0.733, 95% CI 0.601–0.865).
Discussion and conclusion:
Protein expression in PSE patients differs from that of non-epileptic stroke patients, suggesting the involvement of several different proteins in post-stroke epileptogenesis. TNFSF-14 emerges as a potential biomarker for predicting PSE.

Introduction
Post-stroke epilepsy (PSE) is a common form of adult-onset epilepsy, 1 occurring in 2%–20% of stroke patients. Almost 50% of newly diagnosed epilepsy cases in patients older than 60 years are attributable to this cause. 2 The number of patients with epilepsy and by extension, with PSE, is expected to increase significantly in forthcoming decades, 3 because of the ageing of the population.
Following a stroke, individuals may experience acute symptomatic seizures within 7 days of the event or develop late-onset seizures more than 7 days later. 4 According to the latest guidelines of the International League Against Epilepsy (ILAE), occurrence of one late-onset seizure meets the diagnostic criteria for epilepsy because of the high risk of recurrence. Several recent studies have reported various clinical risk factors for developing PSE (e.g. stroke severity, haemorrhagic stroke, young age),2,5 as well as some predictive models, such as the SELECT score. 6 However, additional biomarkers are needed to help identify which patients will develop epilepsy following a stroke.
Little is known about the underlying pathological mechanisms of post-stroke seizures. Acute cerebral infarction activates a neuroinflammatory response that occurs rapidly after the event in order to repair the brain injury. It is characterised by multiple procedures: hypoxia and global hypoperfusion, microglia activation, influx of peripheral immune cells, glutamate excitotoxicity, ion channel dysfunction and blood-brain barrier (BBB) disruption.
In the early stage, cells of the ischaemic core and penumbra suffer irreversible damage that ultimately leads to cell death by apoptosis. 7 This involves the release of multiple inflammatory molecules: damage-associated molecular patterns (DAMPs), cytokines and chemokines. Main pro-inflammatory cytokines that are released, such as IL-6, IL1-1B and TNF-α, have also been described in people with epilepsy. 8
Following the initial wave of inflammation, peripheral macrophages and brain-resident microglia phagocytes debris of dead cells and result in a mixed pro-inflammatory and anti-inflammatory phenotype stage that resolves the inflammation. In the late step, an astrocytic scar forms leading the microglia reappear with a partly inflammatory phenotype. 9 Overall, an excessive or very prolonged response in time may trigger the epileptogenic process. This condition can have an impact not only on the development of stroke complications, such as epilepsy, but also on worsening stroke recovery and thus worsening functional outcomes.
The stroke type and severity, the patient’s genetic background, and other external factors modulate the duration and intensity of the response. 10
There is increasing interest in the study of inflammatory molecules in epilepsy. In a report including 4 patients with acute symptomatic seizures following thrombectomy, Eriksson et al. observed elevated levels of some blood biomarkers: neurofilament light (NFL), tau, glial fibrillary acidic protein (GFAP), S100 calcium-binding protein B (S100B) and neuron-specific enolase (NSE). 11 In a previous study, our group evaluated associations between certain blood biomarkers during the acute phase of stroke and the occurrence of post-stroke seizures. We found that higher levels of neural cell adhesion molecule (NCAM) and lower levels of tumour necrosis factor receptor 1 (TNF-R1) were associated with acute symptomatic seizures. 12 In contrast, lower levels of S100B and heat shock 70 kDa protein-8 (Hsc70), and increased levels of endostatin were associated with epilepsy. 13
Nonetheless, current evidence on the role and function of specific biomarkers during the process of epileptogenesis is scarce. The aim of this study was to investigate blood biomarkers in the acute phase of stroke in patients who later develop epilepsy to help identify those most likely to experience this complication.
Materials and methods
Study design
This is a longitudinal study. Patients were selected from a previous study in which 895 acute stroke patients were followed-up for 5 years and analysed; 51 patients developed PSE. 13 For the present study, we conducted a two-step biomarker analysis: for the first stage 15 of these 51 patients were randomly selected and matched to 15 controls (stroke patients without epilepsy). For the second stage, we selected a group of biomarkers from the discovery analysis and validated them by ELISA in 100 patients: 50 PSE patients 13 and 50 controls (stroke patients without epilepsy). Due to technical reasons, one patient with PSE was excluded for the validation analysis. All the patients were matched for age, sex and type and severity of stroke for both analysis.
Epilepsy had been established when seizures occurred beyond the seventh day after stroke, in accordance with the ILAE 4 criteria. The diagnosis of stroke was based on neurological symptoms lasting longer than 24 h or neuroimaging evidence of a compatible lesion. When no lesion was observed, the event was considered a transient ischaemic attack (TIA) and excluded from the study.
Biomarker analysis
In all cases, blood samples were collected in EDTA tubes within the first 6 h after stroke onset and before administration of any treatment. Samples were centrifuged at 1500x g for 15 min at 4°C and plasma aliquots were frozen at −80°C until use.
A biomarker discovery analysis was performed. Serum levels of 480 proteins were analysed externally by Olink Proteomics (Uppsala, Sweden) in baseline samples from the 15 PSE patients and 15 controls. Five different 96-protein panels including neurology, inflammation, cardiovascular I, cardiovascular II and cardiometabolic proteins were analysed. The proximity extension assay (PEA) technology enables a high-throughput, multiplex immunoassay of each panel using 1 μL of serum in a 96-well-plate. It involves protein-specific antibody pairs labelled with unique complementary oligonucleotides. When both antibodies in the pair bind to the corresponding protein, a polymerase chain reaction (PCR) target sequence is generated, and this is subsequently amplified and detected using a standard real-time PCR protocol. 14
Protein interactions
To evaluate and visualise interactions between the various proteins showing statistical significance (p < 0.05) in the discovery analysis, we used the STRING database (11.5 version) and Cytoscape (3.8.2 version). STRING is a database of known and predicted protein-protein interactions. Cytoscape is an open-source software platform designed to visualise complex networks and integrate them with any type of attribute data. The interactions include direct (physical) and indirect (functional) associations; they stem from computational prediction, from knowledge transfer between organisms, and from interactions aggregated from other (primary) databases. An interaction network was plotted. The betweenness centrality and degree centrality of the network nodes (in this case, specific proteins) were obtained to assess the importance of each protein within the network. Proteins showing the strongest interactions (p < 0.05) were considered for the validation analysis.
Biomarker validation
Based on information in the related literature, evidence of the main function of each biomarker, and the statistical results, we selected a group of biomarkers from the discovery analysis and validated them by ELISA in 100 patients: 50 PSE patients and 50 controls (stroke patients without epilepsy) matched for age, sex and type and severity of stroke. In total, 14 biomarkers were analysed: Caspase-8 (CASP-8) (ng/mL), tumour necrosis factor superfamily 14 (TNFSF-14) (pg/mL), STAM binding protein (STAMBP) (pg/mL), extracellular newly identified receptor for advanced glycation end products binding protein (ENRAGE) (pg/mL), ectodysplasin A2 receptor (EDA2R) (pg/mL), sirtuin 2 (SIRT2) (pg/mL), transforming growth factor alpha (TGF-alpha) (pg/mL), oncostatin M (OSM) (pg/mL), C-type lectin domain family 1 member B (CLEC1B) (ng/mL), transcobalamin 2 (TCN2) (pg/mL), c-KIT (pg/mL), cluster of differentiation 40 (CD40) (pg/mL), C-C motif chemokine ligand 4 (CCL4) (pg/mL) and vascular endothelial growth factor A (VEGFa) (pg/mL). Assay procedures were performed according to the manufacturer’s instructions (Supplemental Methods, I).
Statistical analysis
Data analysis was carried out with R software (version 4.2.1; R Foundation for Statistical Computing, Vienna, Austria) and the IBM SPSS statistical package (version 25; SPSS Inc., Armonk, NY, USA).
To analyse data generated by the Olink Proteomics assay, proteins with more than 30% of values below the detection limit were first removed. Thereafter, differential expression analysis (epilepsy vs controls) was carried out using linear Bayes models in the limma Bioconductor package. 15 The Benjamini-Hochberg procedure was used to control the False Discovery Rate (FDR), a method for controlling the proportion of false positives among all significant results and used to correct p-values by multiple comparisons. The log fold change (logFC) was used to analyse the magnitude of the differences. Differentially expressed proteins were screened out using volcano plots.
The characteristics of the sample are reported as frequencies (percentages), and continuous variables as mean ± standard deviation (SD) or median (interquartile range [IQR]), as appropriate. The normality assumption for quantitative variables was checked with the use of quantile-quantile (Q-Q) plots.
Correlations between selected biomarkers after the discovery analysis (Olink), and the expression values obtained with ELISA were evaluated with the Spearman Rho or Pearson coefficient, depending on the variables’ distribution. Protein expression values were previously normalised using a base-2 logarithmic transformation.
For the validation sample, statistical significance between cases and controls were assessed using the Pearson chi-square or Fisher exact text for categorical variables, the Student t test for continuous variables, and the Mann-Whitney U test for quantitative variables without an approximately normal distribution. The ‘survivalROC’ R package was used to generate time-dependent receiver operating characteristic (ROC) curves to evaluate the predictive ability of significant protein biomarkers to develop PSE during follow-up. A p-value < 0.05 was considered statistically significant.
Results
Demographics and clinical characteristics
In the group of 15 PSE patients participating in the discovery analysis, mean ± SD age was 61.7 ± 13.3 years and 86.7% (n = 13) were men. The stroke had an ischaemic cause in 73% (n = 11) of cases, and the baseline median [IQR] NIHSS score was 9 [2–15]. Median [IQR] time between stroke and seizure onset was 286 [133–1405] days.
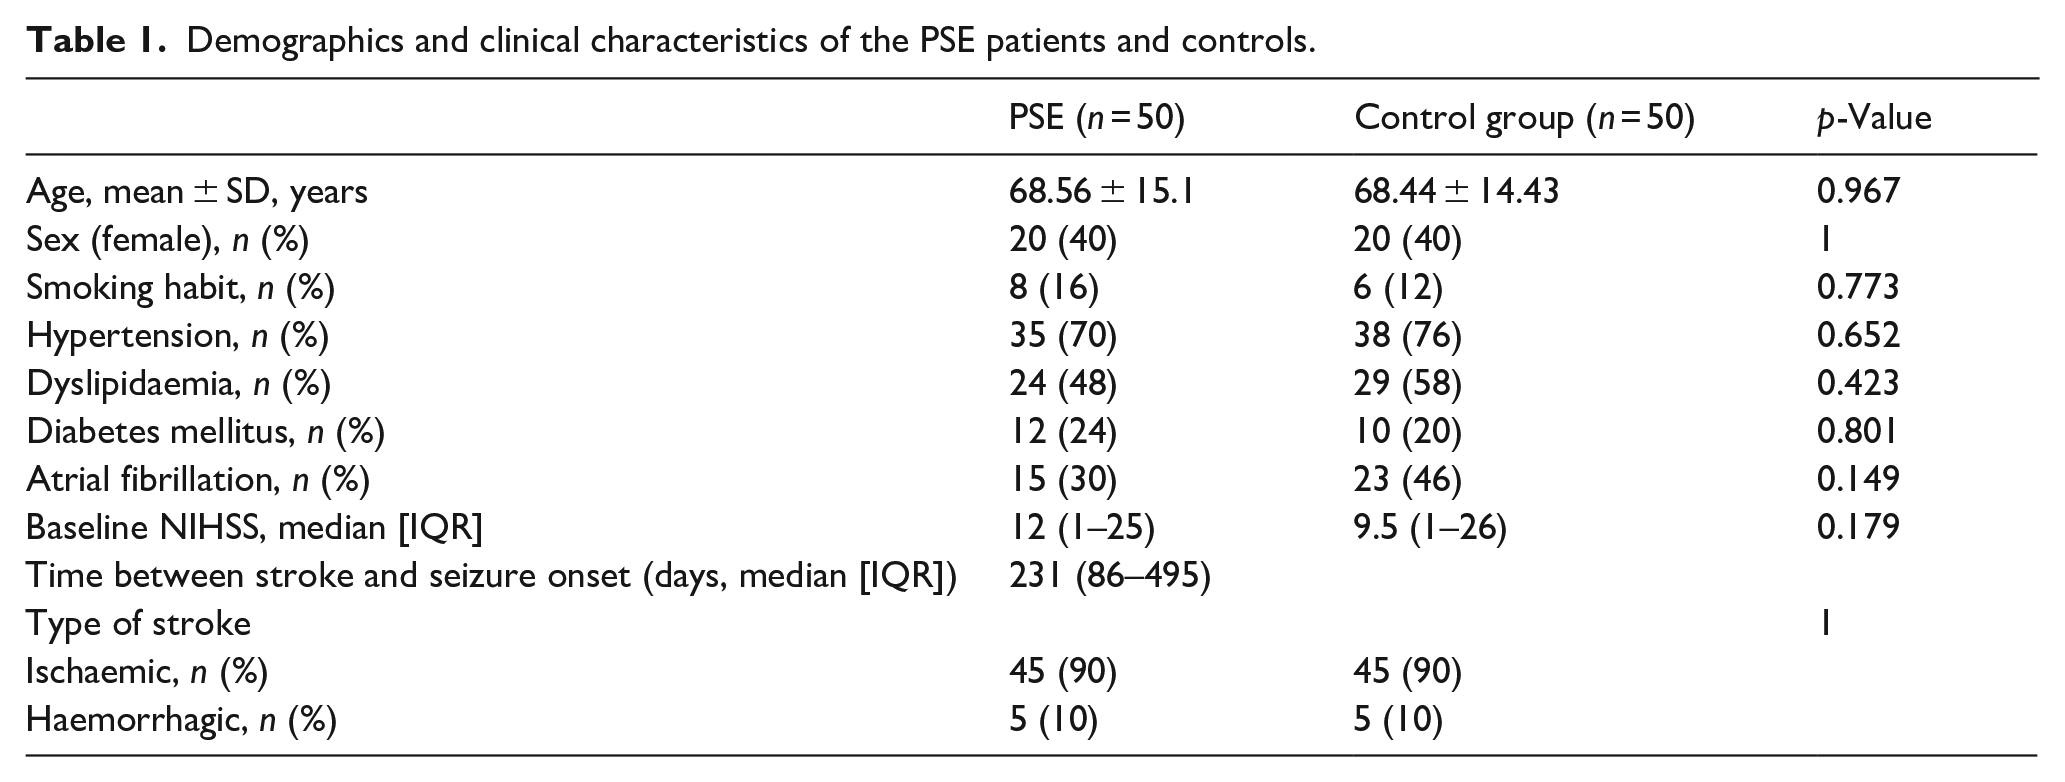
Baseline characteristics of the 50 PSE case patients are shown in Table 1. Mean ± SD age was 68.56 ± 15.1 years and 40% (n = 20) were women. The stroke had an ischaemic cause in 90% (n = 45) of cases, and the baseline median [IQR] NIHSS score was 12 [1–25]. Median [IQR] time between stroke and seizure onset was 231 [86–495] days.
Demographics and clinical characteristics of the PSE patients and controls.
Protein expression in baseline samples
The nine proteins showing lowest expression levels in PSE patients compared to controls (p < 0.01) were CASP-8, TNFSF-14, STAMBP, ENRAGE, EDA2R, SIRT2, TGF-alpha, OSM and CLEC1B. EDA2R and CLEC1B are the only biomarkers belonging to the neurology panel, whereas the remaining proteins belong to the inflammation panel. TCN2 and c-KIT were the only biomarkers that were overexpressed in PSE patients compared to controls (Figure 1).
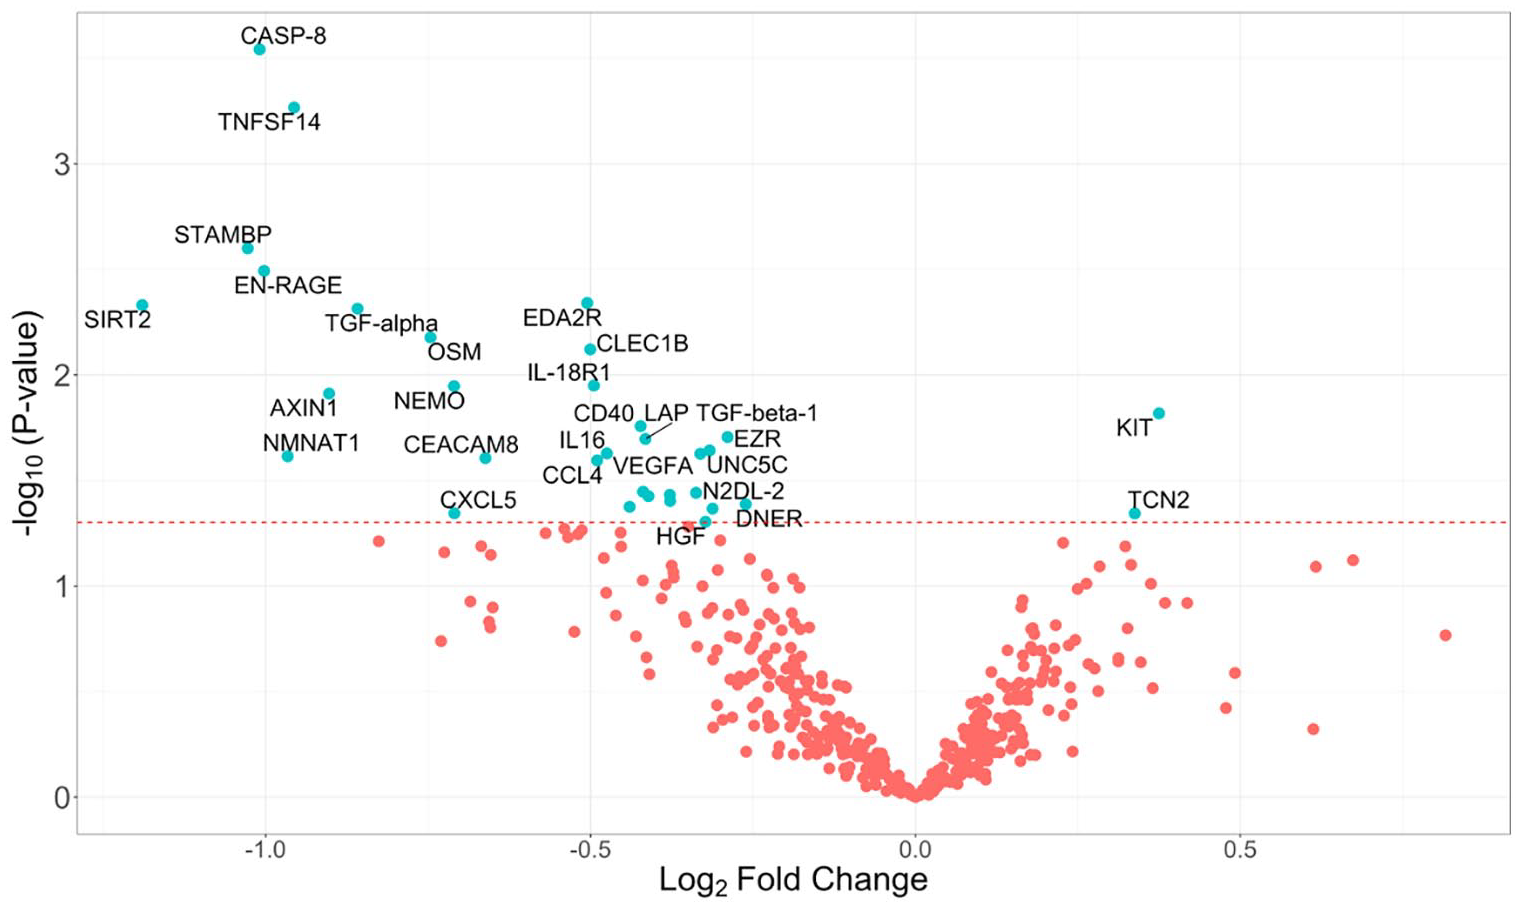
Volcano plot showing differentially expressed proteins between patients with PSE and controls obtained by Olink Proteomics assay. Proteins on the left side were down-expressed and proteins on the right side showed high levels. The dashed line indicates a significance level of 0.05.
STRING-Cytoscape analysis network
The biomarkers showing the greatest interactions with other proteins in PSE patients were VEGFa, CD40 and CCL4. These three biomarkers belong to the inflammation panel (Figure 2).
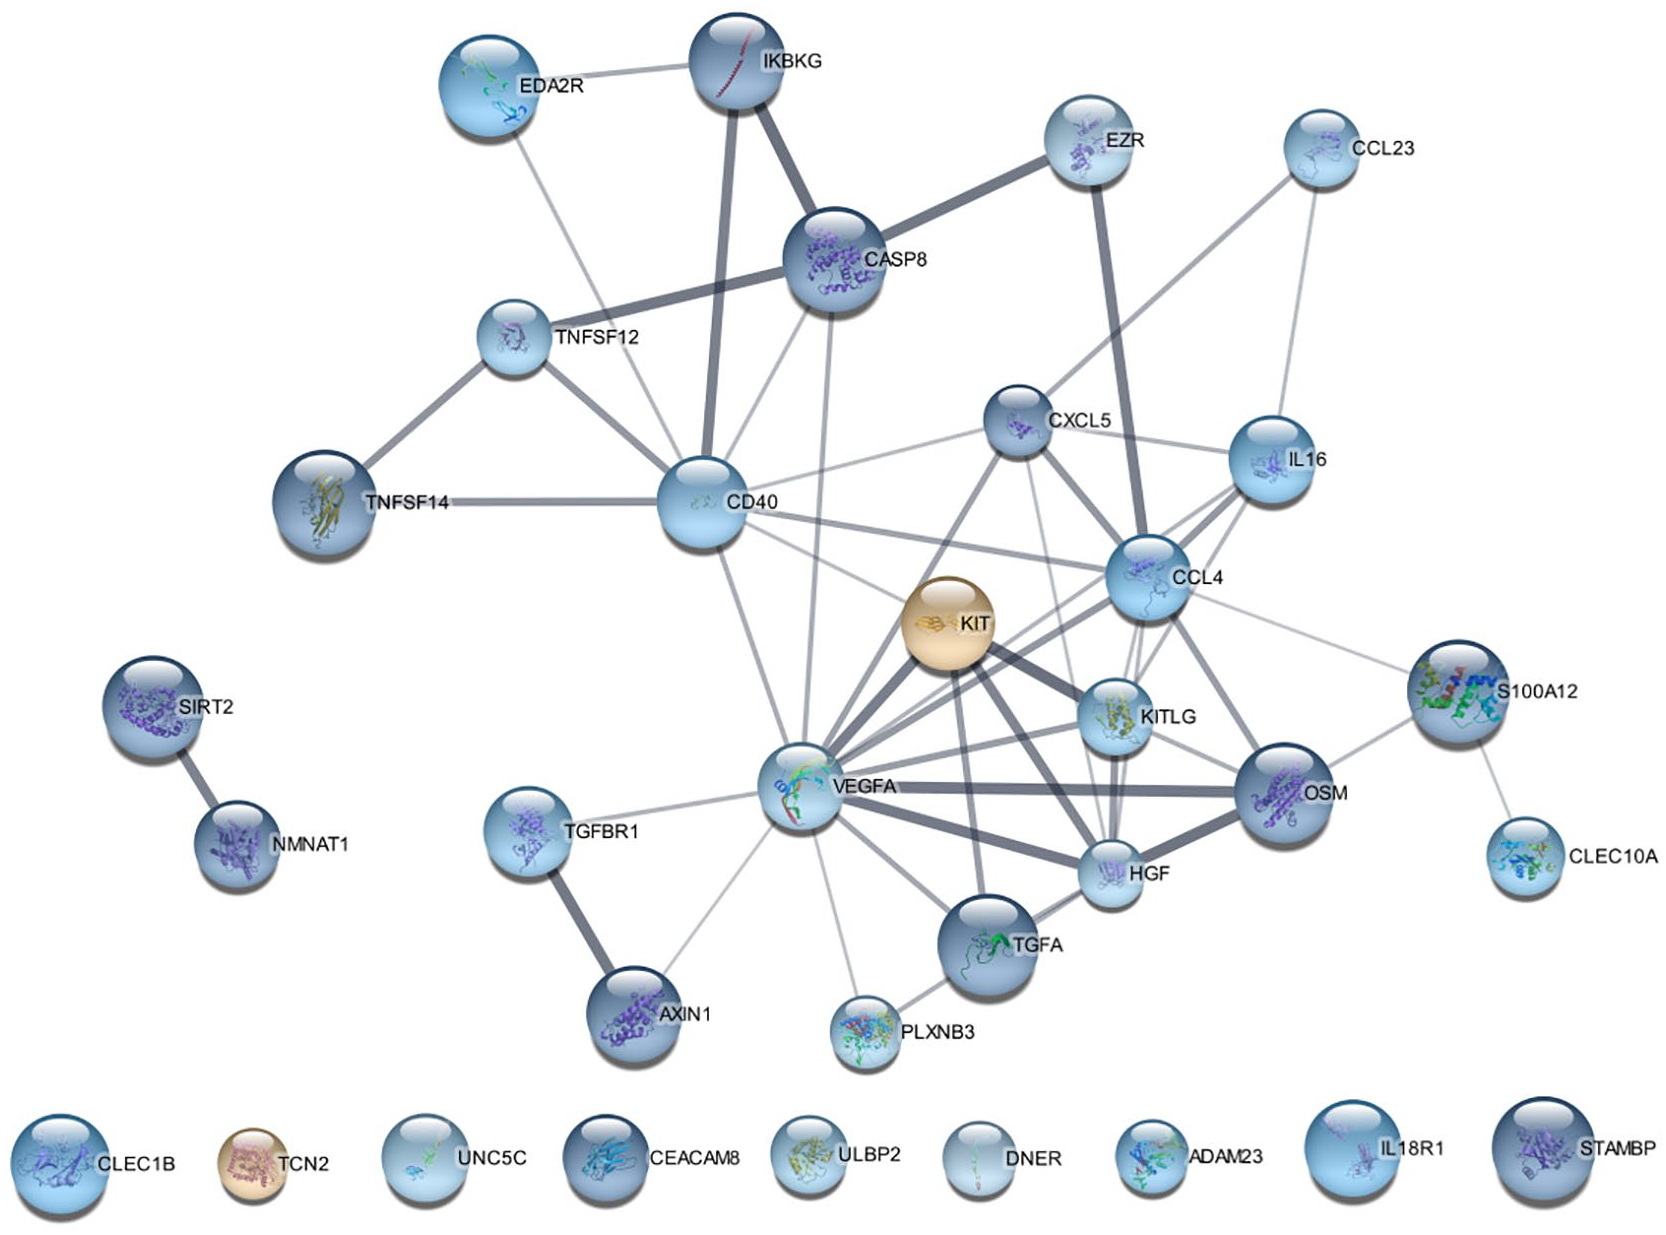
Computer-aided visualisation of protein-protein interactions. Each node represents a single protein. Proteins with no interaction partners within the network are shown at the bottom of the figure (CLEC1B, TCN2, UNC5C, CEACAMB, ULBP2, DNER, ADAM23, IL-18R1, STAMBP). Thicker connecting lines indicate a stronger association between proteins. Nodes represented in cooler and warmer colours showed lower and higher expression, respectively, in the cases. Greater intensity of the colours marks a higher fold change. Larger node size indicates higher statistical significance.
ELISA validation results
For the validation analysis, we selected the following biomarkers: those that were down-regulated in PSE patients (CASP-8, TNFSF-14, STAMBP, ENRAGE, EDA2R, SIRT2, TGF-alpha, OSM, CLEC1B), those that were overexpressed in PSE (TCN2, CKIT), and those that showed the strongest interactions with other proteins (VEGFa, CD40, CCL4). All biomarkers included in the validation except CLEC1B belong to the inflammation panel. The biomarkers EDA2R and TCN2 were not detectable by ELISA and are therefore not included in the results.
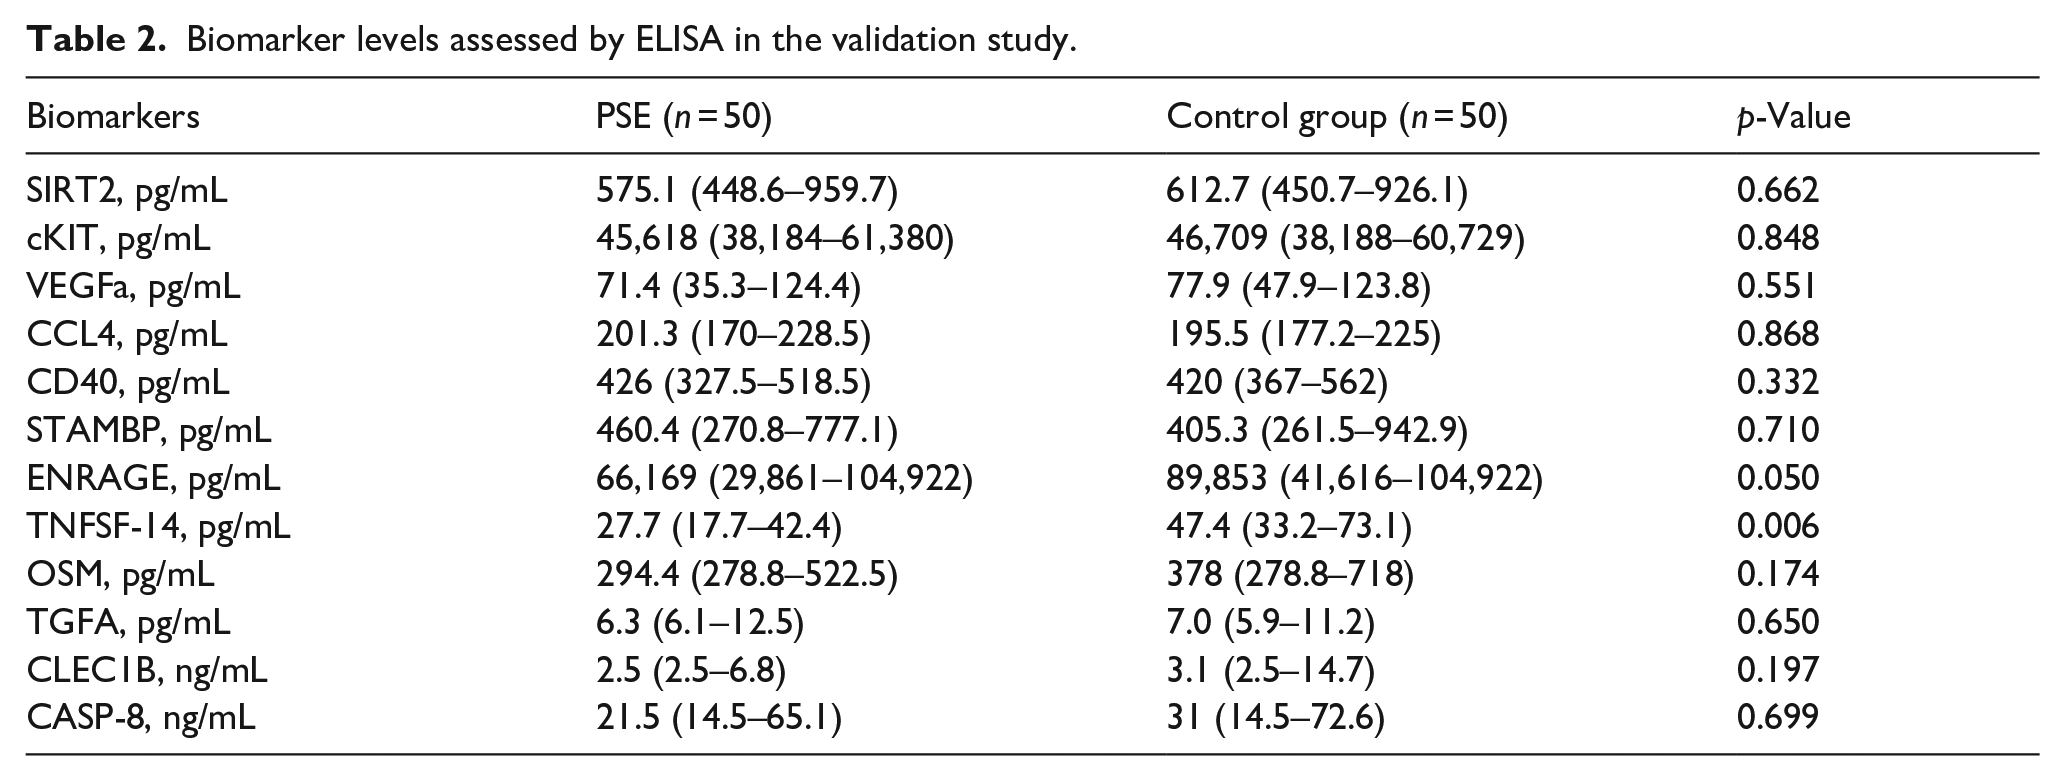
Levels of TNFSF-14 (p = 0.006), OSM (p = 0.174), CLEC1B (p = 0.197), CD40 (p = 0.332) and ENRAGE (p = 0.050) were lower in stroke patients with epilepsy than in those without, but only TNFSF-14 showed significant downregulation (p = 0.006) in PSE patients (Table 2, Figure 3). The expression values of this biomarker measured by ELISA correlated highly (r: 0.837; p < 0.001) with those obtained by the Olink Proteomics assay (Figure 3). A ROC curve analysis showed a good predictive capability of TNFSF-14 to develop PSE after 5 years of follow-up (AUC 0.733, 95% CI 0.601–0.865) (Figure 4).
Biomarker levels assessed by ELISA in the validation study.
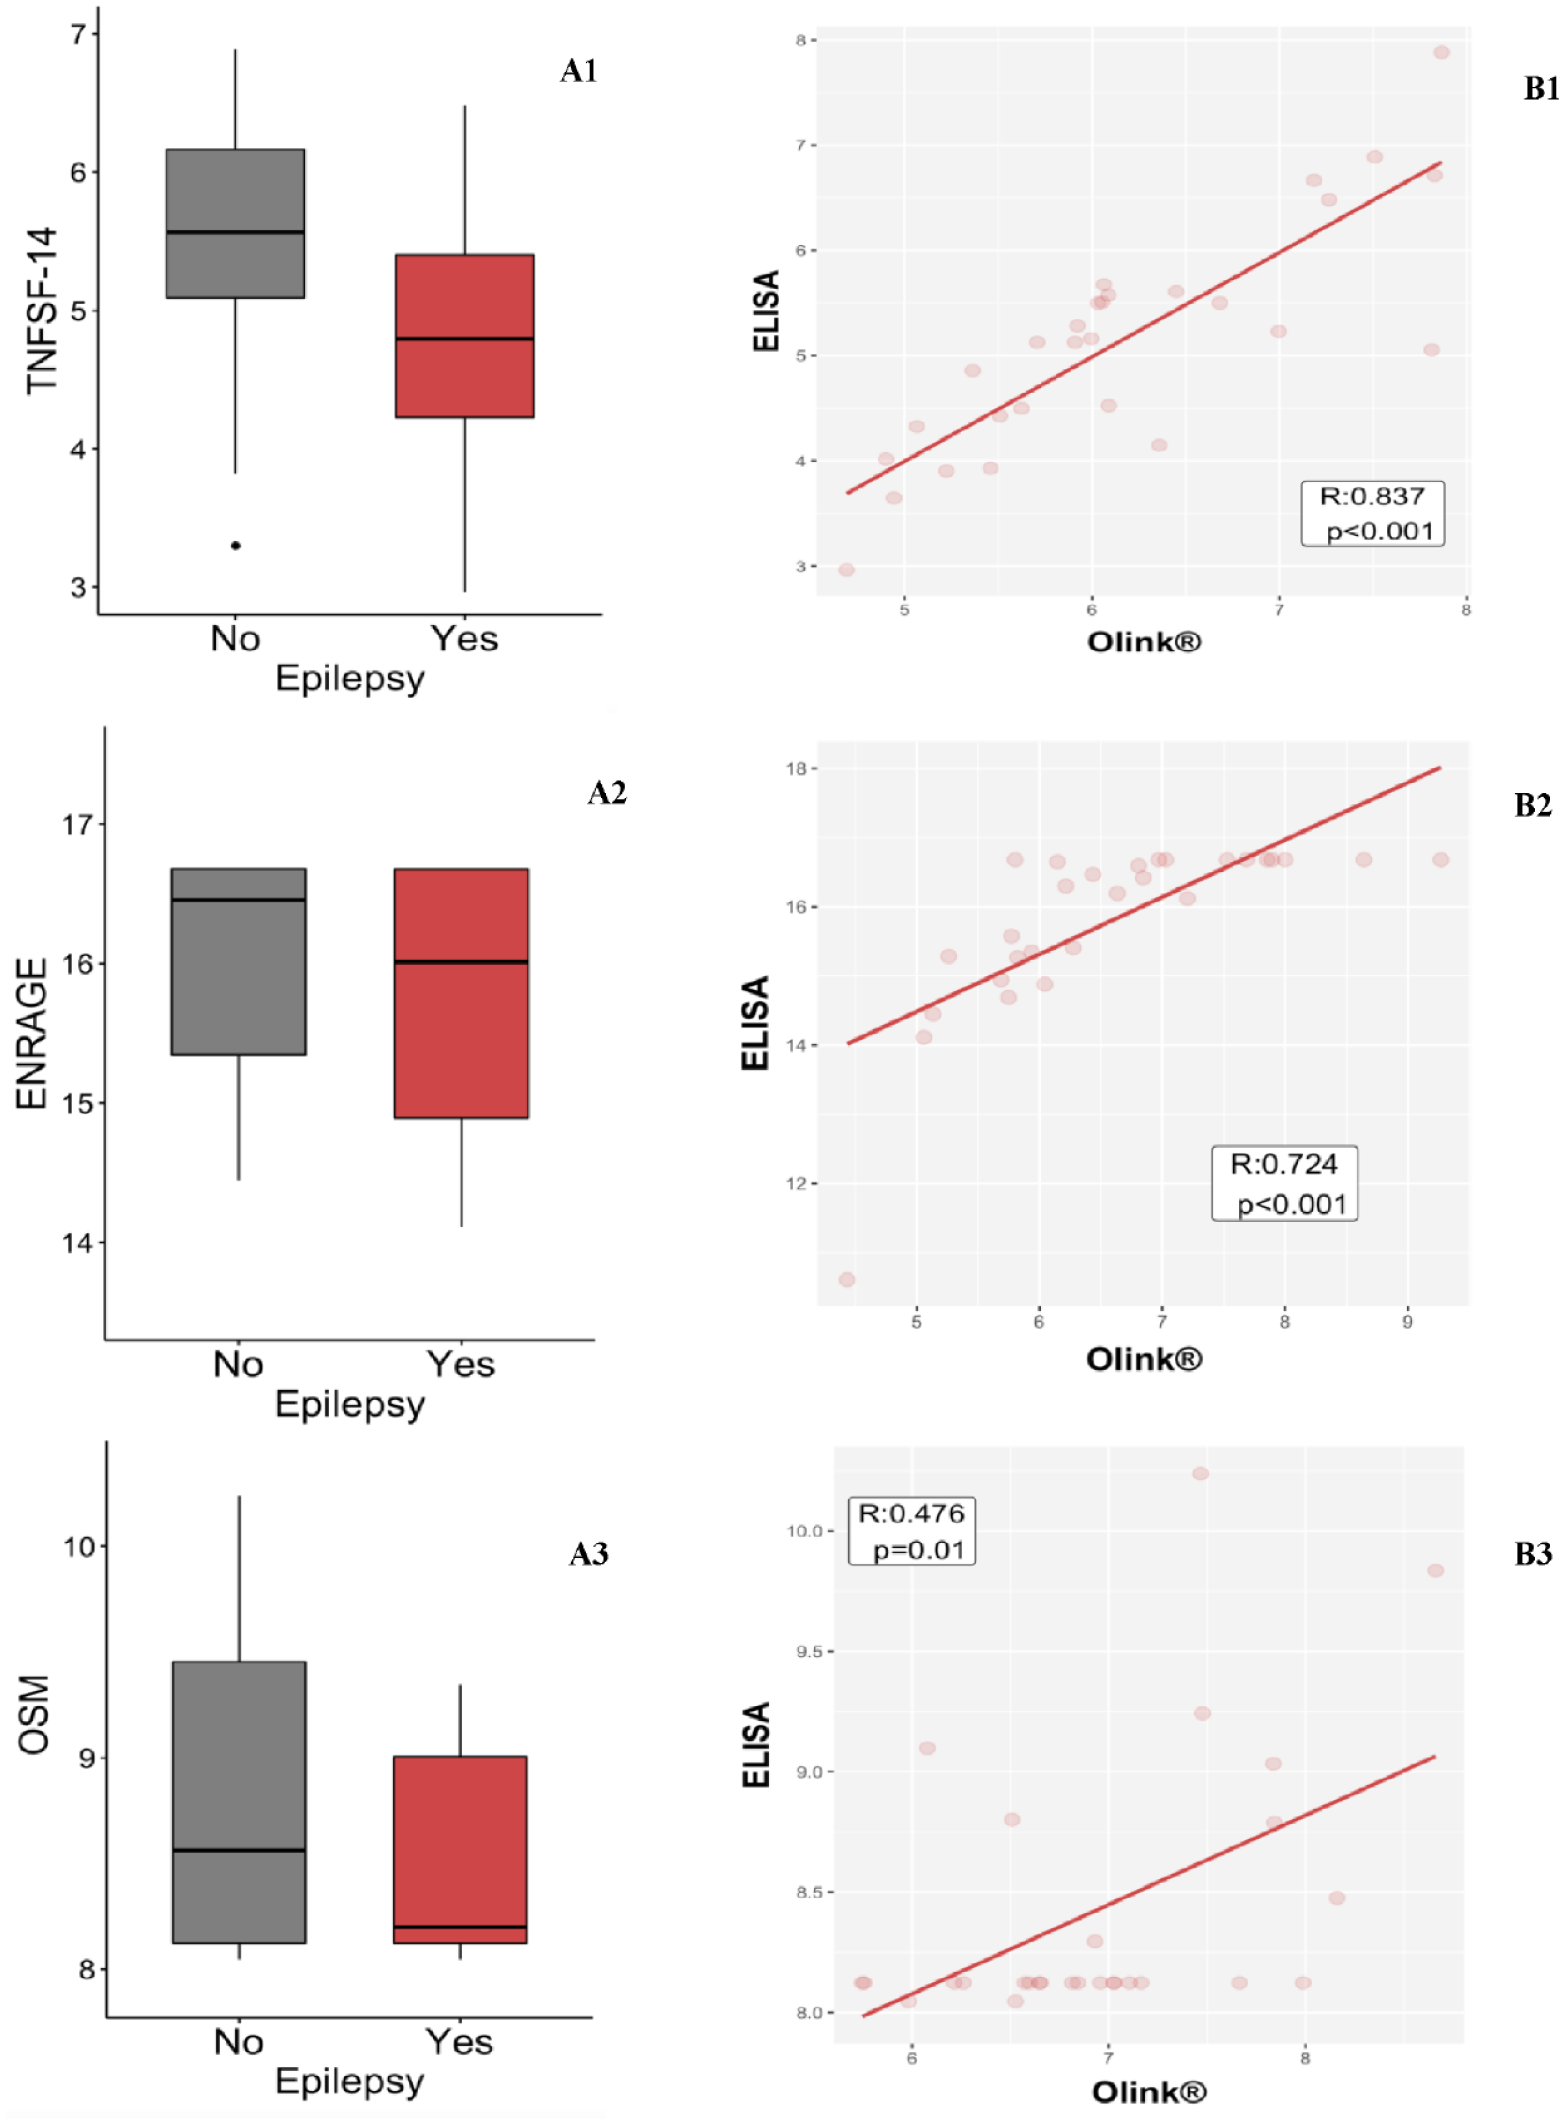
Evaluation of protein concentrations. The statistically significant protein and those showing a trend to significance are represented. Box plots, comparing TNFSF-14 (A1), ENRAGE (A2,) and OSM (A3) protein concentrations between PSE patients and controls. Scatter plots show correlations between ELISA and Olink results for TNFSF-14 (B1), ENRAGE (B2) and OSM (B3) concentrations.
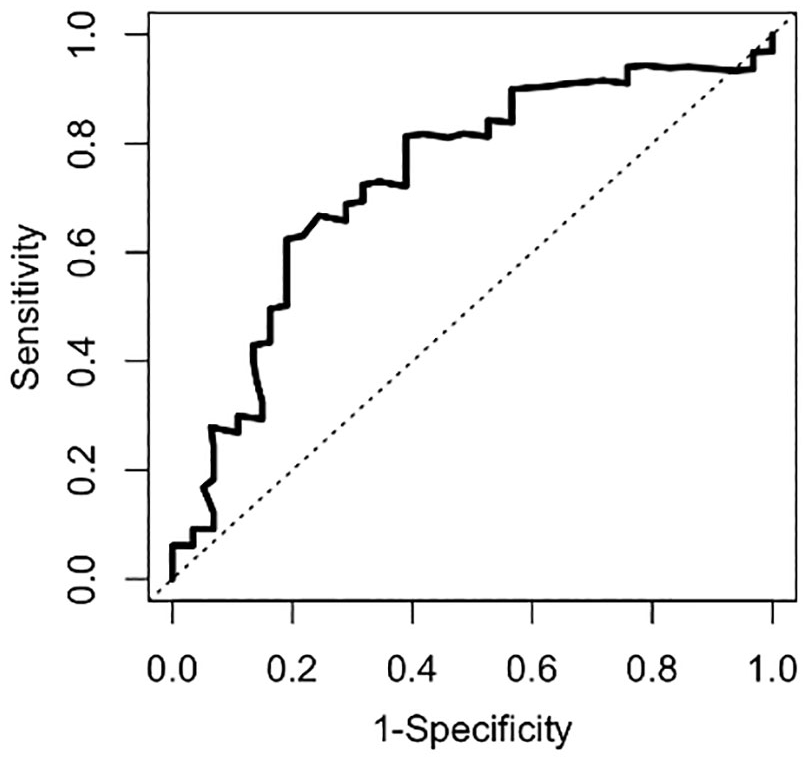
Time-dependent ROC curve (5-year follow-up) showing the ability of TNFSF-14 protein to predict the development of PSE. AUC: 0.733 (95% CI: 0.601–0.865).
Discussion
In this study, a discovery analysis was performed to investigate protein biomarkers in acute stroke patients who developed PSE. Since the blood samples were drawn within 6 h of stroke onset, this study evaluated the behaviour of these proteins during the first stage of the epileptogenesis process.
Levels of nine of the 480 proteins evaluated were down-regulated in patients with subsequent epilepsy. The three biomarkers showing the most promising results were ENRAGE, TNFSF-14 and OSM, but TNFSF-14 was the only one presenting statistical differences after validation. In parallel, VEGFa, CD40 and CCL4 displayed the greatest interactions with the remaining proteins studied. It should be noted that the only brain-specific proteins in our study were CLEC1B and EDA2R.
Immediately after a stroke, rapid activation of innate immunity and BBB dysfunction result in the generation of a neuroinflammatory cascade. It leads to microglial and astrocyte activation with the release of numerous inflammatory molecules such as: damage-associated molecular patterns (e.g. high mobility group box-1 [HMGB1], S100β), cytokines (IL-1β, TNF-α, IL-6), various chemokines.10,16 Subsequently, leucocytes may help to perpetuate the inflammatory response. Thus, if the inflammatory response exceeds the homeostatic threshold, it may cause hyperexcitability and lower the seizure threshold, contributing to the normal brain becoming epileptogenic.
Surprisingly, we found lower levels of several proinflammatory molecules in PSE patients than in controls during the acute phase of stroke. One explanation for this finding could be an aberrant neuroinflammatory response. Activated microglia appear to have a dual function, secreting both pro-inflammatory and anti-inflammatory factors. 17 In addition, inflammatory mediators may promote brain damage or contribute to tissue repair depending on their levels and persistence.
In a mouse model, defective microglial activation was associated with an increase in infarct size and the number of apoptotic neurons following ischaemia. 18 Thus, an aberrant neuroinflammatory response can lead to more severe consequences in ischaemia, and may have contributed to the epileptogenic process in our patients.
Levels of tumour necrosis factor superfamily-14 (TNFSF-14), also known as LIGHT (homologous to lymphotoxin) showed the most significant differences versus controls. TNFSF-14 is a transmembrane protein produced by activated T cells, exhibiting inducible expression. 19 It can either co-stimulate or restrict the immune response through different mechanisms, 20 and it has been related to certain neurological diseases such as multiple sclerosis and arteriosclerosis. 21 In line with a potential for neurological involvement, Schranz et al. reported that higher serum levels of TNFSF-14 and OSM are associated with lengthier survival in patients with aneurysmal subarachnoid haemorrhage (aSAH), whereas lower levels are more likely in delayed cerebral ischaemia. 22 Although some studies in humans and experimental animal models have shown that these proteins have a pro-inflammatory role in vascular tissues, down-regulated levels have also been reported during inflammatory processes. 21 In addition, metalloproteinase-9 (MMP-9), which plays key role in stroke patients by breaking down the BBB, may reduce TNFSF-14 levels in aSAH survivors. 22
Decreased OSM neuronal levels have also been associated with a poorer stroke outcome. OSM, which belongs to the gp130 cytokine family, regulates neuronal function. In line with our findings, significantly reduced OSM levels have been reported just 2 hours after stroke in MCAO (middle cerebral artery occlusion) mouse models. 23 As lower levels of TNFSF-14 and OSM proteins have been associated with delayed cerebral ischaemia in patients with other cerebrovascular conditions such as subarachnoid haemorrhage; we suggest that decreases in these markers may occur in other neurological complications such as seizures in stroke patients.
ENRAGE, also known as S100A12, is a calcium-, zinc- and copper-binding protein with pro-inflammatory activity recruiting leucocytes; thus, ENRAGE acts as a DAMP molecule. In contrast to our results, higher ENRAGE levels have been reported in stroke patients than in those with a TIA or in controls at 1 and 3 h after the event. 24 As is the case of other S100 proteins, the exact role of ENRAGE is unknown. We hypothesise that the neuroinflammatory response may be defective in PSE patients, as our results seem to indicate an impaired or slower response. However, as our study focuses on acute-phase biomarkers in baseline samples, we do not know if the protein would show changes over time.
Interestingly, of all the proteins evaluated, only CLEC1B and EDA2R belong to the neurological panel. CLEC1B, also known as CLEC-2, is an important platelet activating receptor in haemostasis and thrombosis. 25 High CLEC1B levels have been associated with a poor prognosis in ischaemic stroke and traumatic brain injury patients.26,27 In contrast, experimental animal studies have reported that exogenous CLEC1B may have neuroprotective effects in traumatic brain injury, improving oedema and reversing BBB damage. 28 EDA2R is a type III transmembrane protein of the tumour necrosis factor receptor TNFR superfamily. Higher levels have been associated with poorer cognitive ability and smaller brain volumes. 29 So far, there is no information on its role in vascular disease or epilepsy.
Multiple proteins are involved in the inflammatory response. In addition to determining their levels and function, it may be equally important to investigate protein-protein interactions to understand what happens and what potentially fails during the response to inflammation. CD40, CCL4 and VEGFa showed the greatest interactions with other proteins. Both CD40 and CCL4 have a pro-inflammatory profile, and VEGFa is involved in the angiogenesis process. CD40 belongs to the tumour necrosis factor superfamily and its activation induces pro-inflammatory and pro-coagulant genes. Up-regulated levels have been reported in PSE patients. 30 CCL4 is a proinflammatory chemokine belonging to CC chemokine family. Increased CCL4 levels have been observed in prolonged status epilepticus in experimental animal models 31 and in patients with mesial temporal lobe epilepsy hippocampal sclerosis. 32 Interestingly, VEGF seems to have a dual effect on blood vessels and nerves in the nervous system. VEGFa promotes the growth of new blood vessels and it is involved in post-ischaemic BBB breakdown. Preclinical models reported that VEGF may contribute to the development of epilepsy after status epilepticus. In contrast, it seems that VEGFa may also have a potential neuroprotective effect, 33 it may inhibits hippocampal cell apoptosis and promotes de proliferation of neural stem cells. 34
In contrast, abnormal levels of individual proteins may lead to changes in protein-protein communication and thus, may alter the normal inflammatory response, contributing to the epileptogenic process.
Our study has certain limitations. We had the results of biomarker analysis within 6 h after the event in the baseline blood sample, but we were unable to assess changes in these parameters over time. The release and elevation of inflammatory molecules may occur at a later time point. 16 Furthermore, as cerebrospinal fluid samples were unavailable, we could not analyse the brain-specific response after brain injury.
In conclusion, TNFSF-14 was the sole biomarker showing significant differences in PSE patients compared to controls. This finding suggests that low TNFSF-14 levels after stroke onset may serve as a predictive indicator for the development of PSE, complementing existing clinical risk factors. As was seen here, TNFSF-14 analysis can be performed easily using various laboratory techniques. The differences found in protein expression levels between stroke patients who develop PSE and those who not suggest a dysregulation of protein function, which may contribute to post-stroke epileptogenesis. To further understand the role of these proteins in PSE, further longitudinal studies with larger sample sizes should be performed.
Supplemental Material
sj-docx-1-eso-10.1177_23969873241244584 – Supplemental material for Exploratory study of blood biomarkers in patients with post-stroke epilepsy
Supplemental material, sj-docx-1-eso-10.1177_23969873241244584 for Exploratory study of blood biomarkers in patients with post-stroke epilepsy by Laura Abraira, Samuel López-Maza, Manuel Quintana, Elena Fonseca, Manuel Toledo, Daniel Campos-Fernández, Sofía Lallana, Laia Grau-López, Jordi Ciurans, Marta Jiménez, Juan Luis Becerra, Alejandro Bustamante, Marta Rubiera, Anna Penalba, Joan Montaner, José Álvarez Sabin and Estevo Santamarina in European Stroke Journal
Footnotes
Declaration of conflicting interests
The author(s) declared the following potential conflicts of interest with respect to the research, authorship and/or publication of this article: L. Abraira has received research funding and speaking fees from UCB Pharma, BIAL Pharmaceutical, Jazz Pharmaceuticals, EISAI Inc, Neuraxpharm, Exeltis, Angelini Pharma and Esteve Laboratorios. E. Fonseca has received funding and speaker fees from UCB Pharma, BIAL Pharmaceutical, Jazz Pharmaceuticals, EISAI Inc, Neuraxpharm, Sanofi Genzyme, Angelini Pharma and Esteve Laboratorios. M. Toledo has received research funding and speaking fees from UCB Pharma, Angelini, Arvelle, Jazz Pharma, BIAL Pharmaceutical, EISAI Inc and Esteve Laboratorios. E. Santamarina has received research funding and speaking fees from UCB Pharma, BIAL Pharmaceutical, EISAI Inc and Esteve Laboratorios. D. Campos has received travel support from UCB Pharma, BIAL Pharmaceutical, Jazz Pharmaceuticals and Angelini Pharma S. Lallana has received travel support from UCB Pharma, BIAL Pharmaceutical, Jazz Pharmaceuticals and Angelini Pharma. The remaining authors have no conflicts of interest. We confirm that we have read the Journal’s position on issues involved in ethical publication and affirm that this report is consistent with those guidelines.
Funding
The author(s) disclosed receipt of the following financial support for the research, authorship and/or publication of this article: This study was supported by La Fundació La Marató de Tv3 (Reg. 84/240 proj. 201702, 2017).
Ethical approval
The study was approved by the ethics committees of Vall d’Hebron University Hospital (PR(AG)397/2016) and Germans Trias i Pujol University Hospital (PI-17-113), and was funded by La Fundació La Marató (Reg. 84/240, project 201702).
Informed consent
Not applicable.
Guarantor
Laura Abraira del Fresno.
Contributorship
LA, ES, AB, DCF, MQ and AP were involved in the design and planning of the work. LA and MQ drafted the manuscript. All authors reviewed and approved the manuscript.
Supplemental material
Supplemental material for this article is available online.
References
Supplementary Material
Please find the following supplemental material available below.
For Open Access articles published under a Creative Commons License, all supplemental material carries the same license as the article it is associated with.
For non-Open Access articles published, all supplemental material carries a non-exclusive license, and permission requests for re-use of supplemental material or any part of supplemental material shall be sent directly to the copyright owner as specified in the copyright notice associated with the article.