
Abstract
Introduction
It has been suggested that the development of post-stroke apathy (PSA) and depression (PSD) may be more strongly associated with generalised brain pathology, rather than the stroke lesion itself. The present study aimed to investigate associations between imaging markers of lesion-related and generalised brain pathology and the development of PSA and PSD during a one-year follow-up.
Patients and methods
In a prospective cohort study, 188 stroke patients received 3-Tesla MRI at baseline (three months post-stroke) for evaluation of lesion-related, vascular, and degenerative brain pathology. Presence of lacunes, microbleeds, white matter hyperintensities, and enlarged perivascular spaces was summed to provide a measure of total cerebral small vessel disease (cSVD) burden (range 0–4). The Mini International Neuropsychiatric Interview and Apathy Evaluation Scale were administered at baseline and repeated at 6- and 12-month follow-up to define presence of PSD and PSA, respectively.
Results
Population-averaged logistic regression models showed that global brain atrophy and severe cSVD burden (score 3–4) were significantly associated with the odds of having PSA (ORGEE 5.33, 95% CI 1.99–14.25 and 3.04, 95% CI 1.20–7.69, respectively), independent of stroke lesion volume and co-morbid PSD. Medium cSVD burden (score 2) was significantly associated with the odds of having PSD (ORGEE 2.92, 95% CI 1.09–7.78), independent of stroke lesion volume, co-morbid PSA, and pre-stroke depression. No associations were found with lesion-related markers.
Conclusions
The results suggest that generalised degenerative and vascular brain pathology, rather than lesion-related pathology, is an important predictor for the development of PSA, and less strongly for PSD.
Keywords
Introduction
Post-stroke apathy (PSA) and post-stroke depression (PSD) are frequent neuropsychiatric consequences of stroke, with estimated mean prevalences around 30% based on previous meta-analyses.1,2 Though there is substantial overlap in symptoms,3,4 these syndromes seem to develop from different anatomical bases. Earlier studies suggested that PSA is associated with right hemispheric subcortical lesions,5,6 while PSD is associated with left (anterior) lesions.7,8 However, meta-analyses did not show strong support for this.9,10 Recently, studies have focused on damage to neuronal networks being involved in the development of PSA and PSD.11–14 As damage to these networks can arise from both stroke lesion-related and more generalised brain damage, a broad range of imaging markers may be involved in the development of PSA and PSD.
Apathy and depression are prevalent in patients with cerebral small vessel disease (cSVD),15–17 a condition that is radiologically characterised by extensive white matter hyperintensities (WMH), lacunes, enlarged perivascular spaces, and cerebral microbleeds (CMBs). In addition to the contribution of individual cSVD markers, the role of total cSVD burden may be of interest, as a recent cross-sectional study showed that increased total cSVD burden on magnetic resonance imaging (MRI) was associated with PSD three months post lacunar stroke. 16
Next to cSVD markers, previous studies have shown that also atrophy might play a role in the development of PSA18,19 and PSD,20,21 and microstructural damage to white matter tracts has been associated with the development of PSA.22,23
More insight in the underlying pathophysiology of PSA and PSD is important, as it may help to design better treatment strategies and prevention of these syndromes. In the present study, we aimed to investigate associations between imaging markers of lesion-related and generalised brain pathology and the development of PSA and PSD during a one-year follow-up period.
Methods
Participant selection and study design
Participants were enrolled in the ‘Cognition and Affect after Stroke – a Prospective Evaluation of Risks’ (CASPER) study, a prospective clinical stroke cohort study. The study was approved by the local Medical Ethics Committee of Maastricht University Medical Center (MUMC+). Its design has been described in detail elsewhere. 24 All 250 eligible participants gave written informed consent. To avoid interference with acute care and rehabilitation, baseline measurements (T0) were scheduled approximately 3 months after stroke onset. At T0, neuropsychiatric questionnaires were administered by a trained research psychologist and these were repeated at nine (T1) and 15 months (T2) post-stroke. A subset received 3-Tesla (3 T) structural brain MRI at T0.
Clinical measures
At each assessment during the one-year follow-up period, patients were classified as having no-PSA or PSA based on a cut-off score ≥374 for PSA on either the clinician-rated Apathy Evaluation Scale (AES-C) or informant-rated Apathy Evaluation Scale (AES-I), 25 and as having no-PSD or PSD based on the criteria for Major Depressive Disorder (MDD) or minor depression (MIND) of the Mini International Neuropsychiatric Interview. 26
Magnetic resonance imaging
A 3 T structural brain MRI was conducted at T0 (Philips Achieva, Philips Medical Systems, Best, The Netherlands). For details see Douven et al. 24 Freesurfer software 27 was used to segment cortical gray and white matter on T1-weighted scans. WMH volume was segmented automatically on FLAIR images according to an automatic brain tissue segmentation method. 28 A manual correction was performed by two trained researchers (ED and DH), under supervision of an experienced neurologist (JS) (Supplementary Figure 1(A)). WMH volume was normalised to the intracranial volume (ICV) (WMH volume/ICV×100) and a natural log transformation was applied to normalise the data distribution.
Symptomatic and old stroke lesions and lacunes were indicated by an experienced neurologist (JS) and segmented manually (Supplementary Figure 1(B)). Stroke lesion volume was normalised to ICV and divided into tertiles (i.e. small, medium, and large lesion volumes). Stroke patients without a visible symptomatic lesion on MRI were classified into the small stroke volume group. The ratio of brain parenchymal volume to total ICV was used to measure whole brain volume. Global brain atrophy (GA) was calculated as 1 minus brain volume, and multiplied by 10 to ease the interpretation of odds ratios. Left and right hippocampal volume (HCV) was obtained using the Learning Embeddings for Atlas Propagation (LEAP) method. 29 HCV was normalised by dividing the native space volume by the affine scaling factor. Scores were divided by one thousand to ease interpretation of odds ratios.
Stroke type (ischemic/hemorrhagic), location (laterality, frontal location yes/no, basal ganglia location yes/no), laterality, and lesion type (i.e. cortical/non-lacunar, lacunar, infratentorial), presence of lacunes and other old infarcts, presence of CMBs, medial temporal lobe atrophy (MTA), 30 presence of extensive WMH 31 and enlarged perivascular spaces in basal ganglia were visually rated (for details see Data Supplement I). A well-validated scale for total cSVD burden on MRI was used, which is based on counting the cumulative presence of lacunes, CMBs, perivascular spaces, and extensive WMH. 32 cSVD burden scores were recoded into low (score 0/1), medium (score 2), and severe (score 3/4) burden.
Statistical analyses
Statistical analyses were performed with Stata version 13.1 (StataCorp, USA). Statistical significance was set at 0.05 (two-sided tests). Baseline differences between patients with or without PSD (or PSA) were tested using χ2-tests and t-tests, as appropriate.
A generalised estimating equation (GEE) for the binomial family with a logit-link function (population-averaged logistic model) was used to evaluate the effect of individual baseline imaging markers on the odds of PSA and PSD at any time point. An unstructured correlation matrix was included, and in order to further control for the influence of differences in standard errors across the correlation matrix, we specified robust standard errors using the Huber-White/sandwich estimator. 33 This yielded marginal odds ratios (ORGEE) and 95% confidence intervals (95% CI). In model 1, each imaging marker was tested separately, adjusted for age, sex, level of education (low, middle, high), and the categorical variable time (T0, T1, T2). The latter was included to average effects over all three time points. For the models with PSD as outcome, history of depression was added to model 1 in an additional step because of its significant association with PSD. In model 2, individual imaging predictors with a p-value < 0.10 in the previous model were added and adjusted for stroke lesion volume in addition to the previous covariates to control for the correlation with other imaging markers. Then, in model 3 all variables with a p-value < 0.10 in the previous model were included in the model. In addition to the previous covariates, the model with PSD as outcome was additionally adjusted for PSA as a time-varying covariate in model 3, and vice versa, to control for overlap in symptomatology at each wave. Post-hoc, we repeated the analyses with apathy measured on the continuous AES-C scale as outcome variable to examine if the results were robust. We performed a GEE for the Gaussian family with an identity-link function, which yielded parameter estimates and 95% confidence intervals.
Results
Baseline characteristics
Of the 250 participants, brain 3 T MRI at T0 was available for n = 189. One patient was excluded from the analyses because responses given on questionnaires were considered unreliable, resulting in a total sample of 188 participants (Supplementary Figure 2 and Supplemental Table 1). Only 168 participants had volumetric imaging data available (17 patients were scanned for clinical purposes according to a different scanning protocol; in three patients there were technical problems during image processing). CMBs were counted on SWI, which were only available for 147 participants.
Compared with the no-PSA group, patients with PSA were significantly older, had a higher WMH volume, more GA, a higher frequency of severe cSVD burden, and smaller right-sided hippocampal volume (Table 1). Compared with the no-PSD group, patients with PSD were significantly more frequently female and had more frequently a history of depression. Numbers of cases with PSA or PSD at each time point during the study, and numbers of incident and chronic PSA or PSD are presented in Supplemental Table 2.
Patient characteristics at baseline.
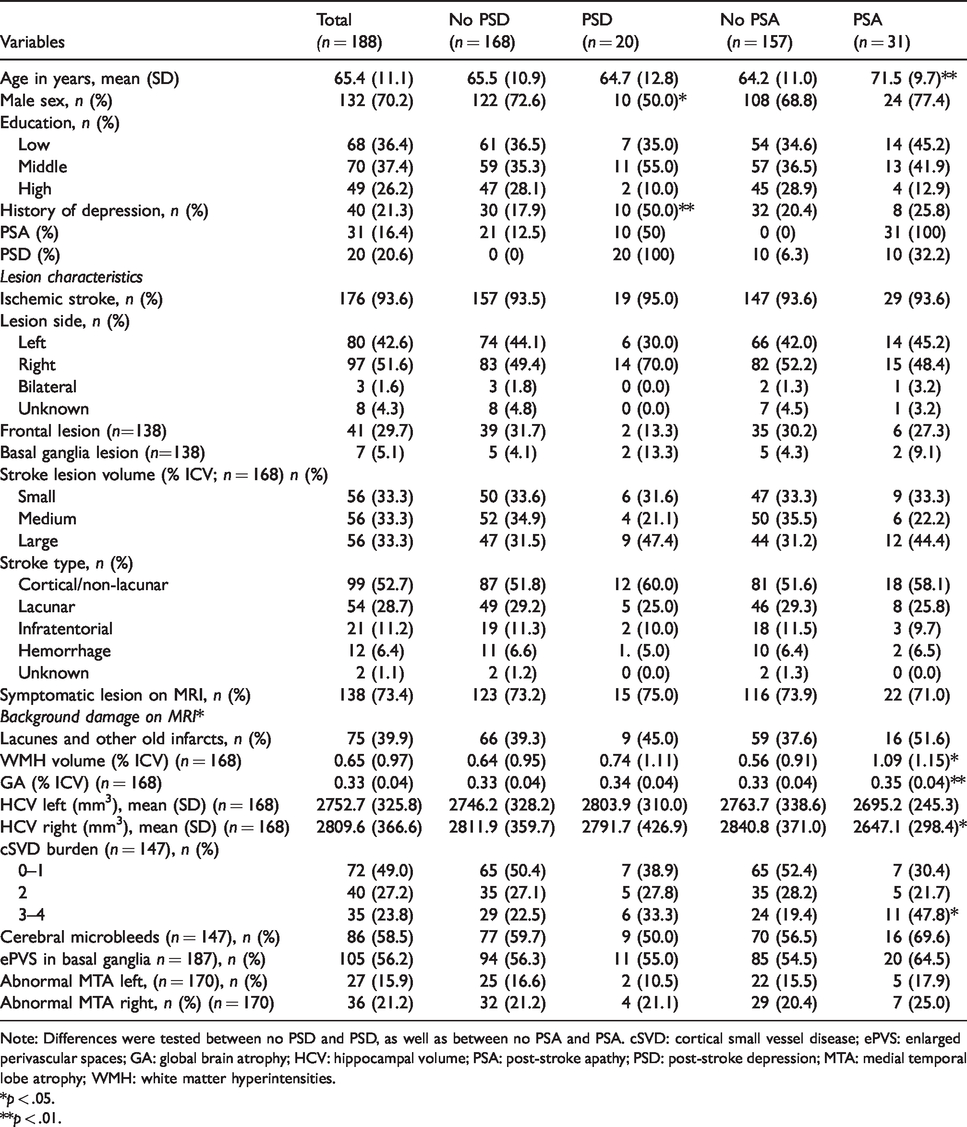
Note: Differences were tested between no PSD and PSD, as well as between no PSA and PSA. cSVD: cortical small vessel disease; ePVS: enlarged perivascular spaces; GA: global brain atrophy; HCV: hippocampal volume; PSA: post-stroke apathy; PSD: post-stroke depression; MTA: medial temporal lobe atrophy; WMH: white matter hyperintensities.
*p < .05.
**p < .01.
Imaging markers associated with PSA in the first year after stroke
A population-averaged logistic regression models with PSA as outcome showed a significant association between GA and the odds of having PSA during the one-year study period after adjusting for age, sex, and highest level of education (ORGEE 5.92, 95% CI 2.36–14.86, Model 1 in Supplemental Table 3). In addition, total cSVD burden was associated with the marginal odds of having PSA during the one-year study period (χ2(2) = 7.43, p = .024), but was only significant for severe total cSVD burden (ORGEE 2.92, 95% CI 1.28–6.67, model 1 in Supplemental Table 3). In the multivariable model (Model 2 in Supplemental Table 3), which was additionally corrected for stroke lesion volume, the association for GA (ORGEE 6.51, 95% CI 2.54–16.73) and severe cSVD burden (ORGEE 3.36, 95% CI 1.05–10.72) was significantly associated with PSA. After we controlled in a final step for comorbid PSD (Model 3 in Supplemental Table 3), both GA (ORGEE 5.33, 95% CI 1.99–14.25) and severe cSVD burden (ORGEE 3.61, 95% CI 1.34–9.68) remained significantly associated with the odds of having PSA. The results were similar when we repeated the analyses with PSA as a continuous measure (Supplemental Table 4).
Imaging markers associated with PSD in the first year after stroke
A population-averaged logistic regression models with PSD as outcome showed a significant association between GA and the marginal odds of having PSD at any timepoint during the one-year study after adjusting for age, sex, and highest level of education (ORGEE 2.82, 95% CI 1.07–7.44; Model 1a in Supplemental Table 5). As there was a significant difference in frequency of history of depression between patients with and without PSD, we tested whether history of depression was a significant covariate. History of depression was significantly associated with the marginal odds of developing PSD (ORGEE 4.14, 95% CI 1.98–8.66), and therefore we corrected for this in an additional step (Model 1 b in Supplemental Table 5) resulting in that the association with GA was no longer significant (ORGEE 2.20, 95% CI 0.80–6.07). Total cSVD burden was associated with the marginal odds of having PSD during the one-year study period (χ2 (2) = 4.73, p = .094), but was only significant for medium, not severe, total cSVD burden (ORGEE 2.42, 95% CI 1.01–5.80; Model 1a in Supplemental Table 5), also after additional correction for history of depression (ORGEE 3.11, 95% CI 1.24–7.79; Model 1 b in Supplemental Table 5). In Model 2, which was also corrected for stroke lesion volume, the association for medium total cSVD (ORGEE 3.31, 95% CI 1.16–9.46) remained significantly associated with PSD (Supplemental Table 5). After we controlled in a final step for comorbid PSA in Model 3, medium total cSVD burden remained significantly associated with the odds of having PSD (ORGEE 2.92, 95% CI 1.09–7.78; Supplemental Table 5).
Discussion
The present study showed that stroke patients with more GA or higher total burden of cSVD at baseline had elevated odds for the presence of PSA, independent of stroke lesion volume and co-morbid PSD. Patients with more GA or medium cSVD burden showed elevated odds for the presence of PSD after adjusting for relevant confounders. Further analyses suggested that the association of PSD with GA was however due to co-morbid PSA, as only medium cSVD burden remained significantly related to PSD after correction for co-morbid PSA and stroke lesion volume. No associations were found between PSD/PSA and lesion-related imaging markers (i.e. location, type, or stroke lesion volume).
Our findings suggest that GA and total cSVD burden are important predictors of PSA and regression diagnostics did not indicate any influential outliers, thus the findings are not the result of a small group of patients with PSA or PSD showing very large GA values and severe cSVD burden. Our findings are supported by different studies in stroke as well as general population studies. In two longitudinal stroke studies with 6-month follow-up, frontal cortical atrophy 18 and atrophic change in the dorsal posterior cingulate cortex 19 were associated with PSA. However, these studies used a visual rating scale for atrophy 18 or had a small sample size. 19 In patients with symptomatic atherosclerotic disease, an association was found between greater cortical volume loss and anhedonia. 34 This is of interest, as anhedonia is a core symptom of depression, 35 which overlaps with the symptomatology of apathy. In a large population-based study of healthy older adults without dementia, apathy symptoms were associated with a reduction of gray and white matter volume. 36 Noteworthy, these associations were found to be independent of depression. Previous studies have indicated that GA is not necessarily of degenerative origin, but is often found to be associated with cSVD. 37 However, in contrast with the other cSVD markers included in the total cSVD burden score, atrophy is not specifically due to cSVD, as it may also occur in other conditions and is part of normal aging. 33 Therefore, GA was not considered as a marker of cSVD burden here. To further explore associations between atrophy and PSA, it would be interesting to examine whether cortical thickness is specifically reduced in neuronal networks that are involved in the development of PSA.
A previous cross-sectional study found that greater total cSVD burden was associated with the presence of PSD three months after acute lacunar stroke. 16 Though associations between individual MRI markers of cSVD and apathy have been found before, this is the first study that found an association between total cSVD burden and PSA, suggesting that global or cumulative brain burden is more important than the presence or location of single symptomatic lesions in stroke patients. This is in line with the suggestion that cumulative brain pathology plays an important role in the development of PSA and PSD,11,12 possibly by damaging microstructural networks that are involved in the regulation of mood and motivational processes. However, we cannot completely rule out the possibility that stroke location does impact the development of PSA and PSD since we included a limited number of stroke location aspects in our analyses that were associated with PSA or PSD in our recent literature review 38 (stroke located in frontal lobe, stroke located in basal ganglia, and stroke laterality). It remains unknown whether stroke lesions were located in neural networks that are known to be involved in the development these neuropsychiatric symptoms.13,14 Lesion-symptom mapping studies could possibly shed light on this matter, while taking into account cumulative brain pathology.
The present study has several important strengths. First, a broad range of imaging markers were assessed, using both visual and volumetric ratings. Other strengths are the longitudinal design (which increased our statistical power by allowing us to include more observations of PSA and PSD), and minimal loss to follow-up. Presence of PSA and PSD was determined by validated measurement instruments and assessed at several time-points, enabling us to evaluate predictive associations. However, some limitations should be addressed. In a quarter of patients, the symptomatic stroke lesion was not visible on MRI. This limited the possibility to look at associations with specific lesion locations. In addition, our models are based on the assumption that associations remain stable over time, irrespective of whether PSA or PSD was measured at the first, second, or third measurement. Therefore, we can only conclude that we found associations with the development of PSA or PSD over the one-year follow-up period, but cannot tell whether these associations were stronger for a certain time point. This could have been studied by looking at the interaction with time, but the small incidences of PSA and PSD in our sample resulted in lack of power for these analyses. We used stepwise model building to assess associations between multiple imaging markers of the recent stroke lesion as well as cSVD and neurodegeneration as this is a standard approach to build a parsimonious model. However, it should be noted that multiple testing in step 1 (model 1) increases the chance of making a type I error due to multiple statistical comparisons, while the inclusion of multiple predictor variables in the subsequent models may increase the chance of making a type II error because the model may be underpowered due to the limited number of PSA/PSD observations. Our conclusions are based on all analysis steps, not just the final model. Finally, information on the presence or absence of apathy prior to stroke was not available in the present study, and therefore it remains unknown to what extent stroke was a contributing factor to the observed associations between the imaging variables and PSA.
In conclusion, GA and severe cSVD burden, rather than lesion-related markers, were associated with the development of PSA, independent of PSD. Only medium cSVD burden was associated with the development of PSD, independent of PSA and pre-stroke depression. Large stroke cohort studies with long-term follow-up and repeated neuroimaging over time are needed to establish how generalised degenerative and vascular brain pathology, and changes therein, are involved in the longitudinal development of PSA and PSD.
Supplemental Material
ESO883445 Supplemental Material - Supplemental material for Imaging markers associated with the development of post-stroke depression and apathy: Results of the Cognition and Affect after Stroke – a Prospective Evaluation of Risks study
Supplemental material, ESO883445 Supplemental Material for Imaging markers associated with the development of post-stroke depression and apathy: Results of the Cognition and Affect after Stroke – a Prospective Evaluation of Risks study by Elles Douven, Julie Staals, Whitney M Freeze, Syenna HJ Schievink, Danique MJ Hellebrekers, Robin Wolz, Jacobus FA Jansen, Robert J van Oostenbrugge, Frans RJ Verhey, Pauline Aalten and Sebastian Köhler in European Stroke Journal
Footnotes
Declaration of Conflicting Interests
The author(s) declared no potential conflicts of interest with respect to the research, authorship, and/or publication of this article.
Funding
The author(s) disclosed receipt of the following financial support for the research, authorship, and/or publication of this article: This project was supported by Maastricht University, Health Foundation Limburg, and the Adriana van Rinsum-Ponsen Stichting.
Acknowledgements
The authors thank the participants of the CASPER study and their proxies for their participation and Nico Rozendaal for expert design and management of the electronic database. M. Wolters contributed to the semiautomatic detection of white matter hyperintensities. S.M. Wong, H.J. van de Haar, M. Geerlings, and J. Slenter assisted in the acquisition, anonymisation, and preprocessing of imaging data.
Ethical approval
Ethics approval was obtained from the local institutional review board.
Informed consent
All patients provided written informed consent.
Guarantor
SK.
Contributorship
JS, SHJS, RJvO, FRJV, SK, and PA were involved in the protocol development and gaining ethical approval. ED, SHJS, and DMJH conducted the data collection. ED wrote the first draft of the manuscript and conducted the statistical analyses. SK (project coordinator) assisted with conducting the statistical analyses. ED, JFAJ, WMF, RJvO, JS, RW, and DMJH contributed to the acquisition of MRI data. All authors critically read and approved the final version of the manuscript.
Supplemental Material
Supplemental material for this article is available online.
References
Supplementary Material
Please find the following supplemental material available below.
For Open Access articles published under a Creative Commons License, all supplemental material carries the same license as the article it is associated with.
For non-Open Access articles published, all supplemental material carries a non-exclusive license, and permission requests for re-use of supplemental material or any part of supplemental material shall be sent directly to the copyright owner as specified in the copyright notice associated with the article.