
Abstract
Background
Neuroimaging in older adults commonly reveals signs of cerebral small vessel disease (SVD). SVD is believed to be caused by chronic hypoperfusion based on animal models and longitudinal studies with inter-scan intervals of years. Recent imaging evidence, however, suggests a role for acute ischaemia, as indicated by incidental diffusion-weighted imaging lesions (DWI+ lesions), in the origin of SVD. Furthermore, it becomes increasingly recognised that focal SVD lesions likely affect the structure and function of brain areas remote from the original SVD lesion. However, the temporal dynamics of these events are largely unknown.
Aims
(1) To investigate the monthly incidence of DWI+ lesions in subjects with SVD; (2) to assess to which extent these lesions explain progression of SVD imaging markers; (3) to investigate their effects on cortical thickness, structural and functional connectivity and cognitive and motor performance; and (4) to investigate the potential role of the innate immune system in the pathophysiology of SVD.
Design/methods
The RUN DMC – InTENse study is a longitudinal observational study among 54 non-demented RUN DMC survivors with mild to severe SVD and no other presumed cause of ischaemia. We performed MRI assessments monthly during 10 consecutive months (totalling up to 10 scans per subject), complemented with clinical, motor and cognitive examinations.
Discussion
Our study will provide a better understanding of the role of DWI+ lesions in the pathophysiology of SVD and will further unravel the structural and functional consequences and clinical importance of these lesions, with an unprecedented temporal resolution. Understanding the role of acute, potentially ischaemic, processes in SVD may provide new strategies for therapies.
Keywords
Introduction
Cerebral small vessel disease (SVD) is the most important vascular contributor to cognitive decline and dementia and causes up to 25% of all ischaemic strokes worldwide.1,2 SVD affects the structure and function of the smallest cerebral blood vessels, including the perforating arterioles, capillaries and venules. 3 Although these small vessels themselves cannot yet be visualised on conventional magnetic resonance imaging (MRI), MRI reliably detects a spectrum of tissue alterations thought to arise from SVD. These include white matter hyperintensities (WMH), lacunes, microbleeds, enlarged perivascular spaces, brain atrophy, and more recently, acute (micro)infarcts and loss of white matter microstructural integrity. 2
Within this spectrum of imaging findings, WMH are the most ubiquitous and extensively studied. The established paradigm for WMH development is that they arise slowly over the years and are caused by chronic hypoperfusion. 3 However, this notion is mainly based on animal studies, which do not reliably capture the complex pathophysiology of a disease that develops over decades. 4 In a recent meta-analysis including human in vivo studies measuring cerebral blood flow (CBF) using various techniques, evidence of reduced CBF in individuals with more severe WMH was observed, both globally and in the majority of grey and white matter regions. 6 However, this association was not confirmed in all longitudinal studies. 6 Studies comparing CBF within WMH and potentially at risk normal-appearing white matter show variable results.7–9 These data suggest that additional processes may play a role in the conversion of normal-appearing white matter towards WMH.
The notion of gradual progression of SVD caused by chronic hypoperfusion may also have arisen because progression has usually been studied with inter-scan intervals of several years. For instance, the majority of de novo WMH over a four-year course appeared to be due to growth of existing lesions, supporting the notion of a slow, continuous process rather than a series of acute events. 10 However, sudden, rather than chronic progression or even regression11,12 may go unnoticed with MRI scan intervals of years.
Similar to WMH, a previous study demonstrated incidental lacunes to occur predominantly at the edge of WMH. 13 These findings suggest that WMH and incidental lacunes share an underlying pathological mechanism, potentially being acute ischaemia.
Indeed, a recent study among five subjects with moderate to severe WMH with 16 weekly MRI assessments showed evidence of acute progression of WMH. 14 In three participants, a total of nine incidental diffusion-weighted imaging lesions (DWI+ lesions) were observed in the white matter, considered to be suggestive of acute infarcts, which in the weeks thereafter approached the imaging characteristics of WMH. 14 Of note, patients did not experience any clinical symptom, although detailed serial neuropsychological examinations had not been performed.
A growing body of evidence now suggests that DWI+ lesions are rather common in SVD, but often go unnoticed because most of them remain clinically silent and the imaging evidence for a DWI+ lesion is strongest within the first four weeks. 15 In cross-sectional studies, the prevalence of DWI+ lesions ranged from 0% in a population-based study including relatively young (58% of the cohort being younger than 60 years) and cognitively healthy individuals with low SVD burden 16 to 8% in patients with severe SVD and a history of a lacunar stroke. 17
In addition to the evolution of DWI+ lesions into WMH, other studies have shown that these lesions have different fates and may as well develop into a lacune, transform into a (micro)haemorrhage or even disappear.2,18–21 However, the exact temporal dynamics of DWI+ lesions are largely unknown.
Apart from a focal effect of SVD on brain structure and function, converging evidence suggests that SVD also affects remote areas of the brain, well beyond the original lesion.22–25 However, the time course of these events is largely unknown as this cannot be accurately monitored by longitudinal studies with large follow-up intervals.
Therefore, to investigate the origin, evolution and consequences of SVD, we set up the RUN DMC – InTENse study (
Methods
Participants
Individuals were recruited from the 503 subjects of the RUN DMC study. This prospective study, on the causes and consequences of SVD, comprised baseline MRI and clinical data collection in 2006 and follow-up examinations in 2011 and 2015. 26 Individuals for the RUN DMC – InTENse study were recruited between February and September 2016.
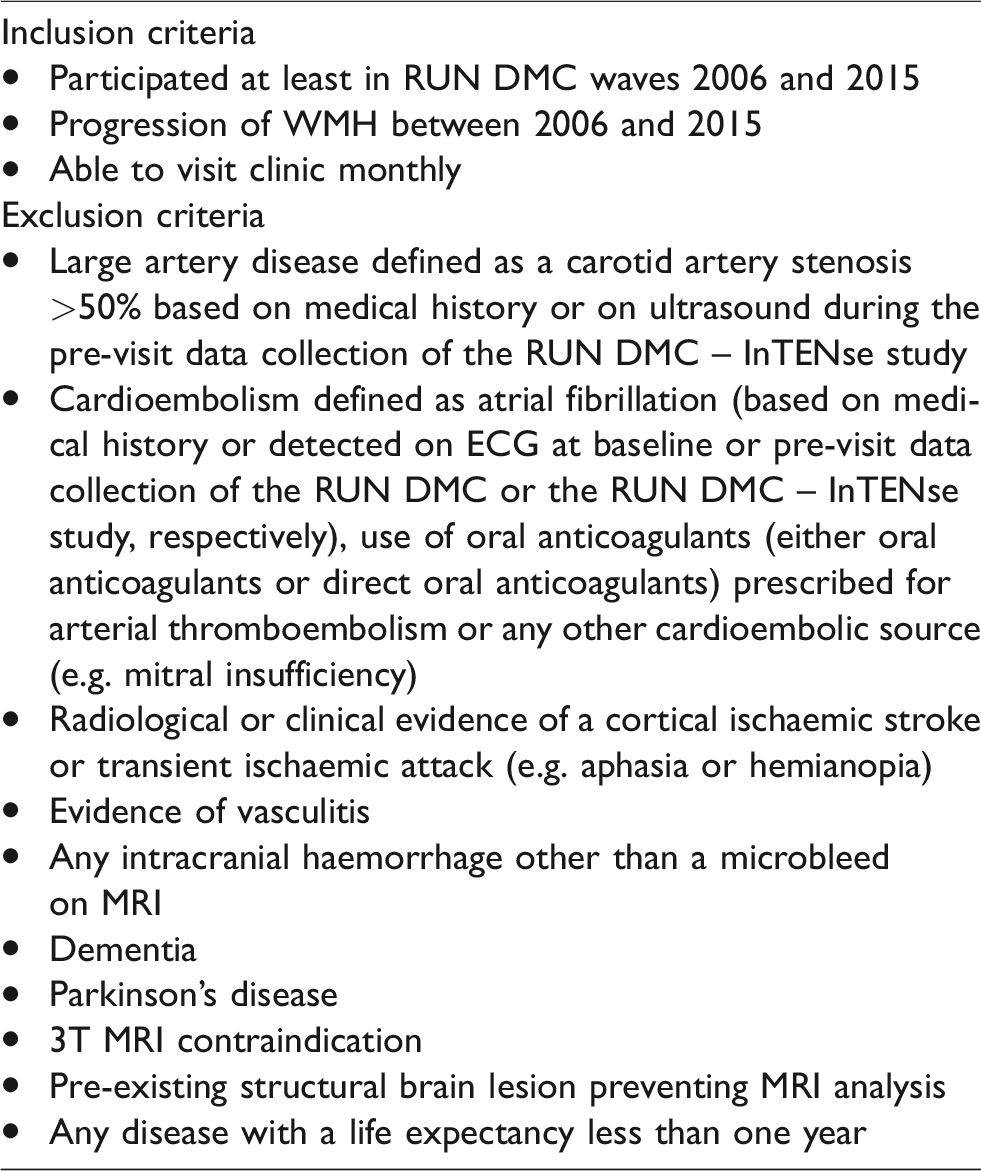
Inclusion and exclusion criteria for the RUN DMC – InTENse study are summarised in Table 1. In short, we aimed to include 50 individuals with a high likelihood of progression of SVD markers during the study period, which could be attributed as much as possible to the underlying SVD pathology. Therefore, we first carefully scrutinised the medical history and previous data collected in the RUN DMC study of all participants who underwent MRI in 2006 and 2015 and excluded those with any evidence of other presumed causes of ischaemia, 27 including large-artery disease, cardioembolic source and other determined cause of stroke, i.e. vasculitis, or with evidence of intracranial haemorrhage other than a microbleed on MRI. As cognitive and motor decline were among our secondary outcomes, patients with dementia and Parkinson’s disease (according to international diagnostic criteria28,29) were also excluded. Subsequently, considering previous progression of WMH as the most important determinant of future WMH progression, all remaining eligible individuals were ranked by their WMH change between 2006 and 2015. Individuals were then invited by volume of WMH progression, those with the highest progression first, until we attained a sample of 50 individuals. Figure 1 summarises the subject recruitment in a flowchart.
Inclusion and exclusion criteria of the RUN DMC – InTENse study.
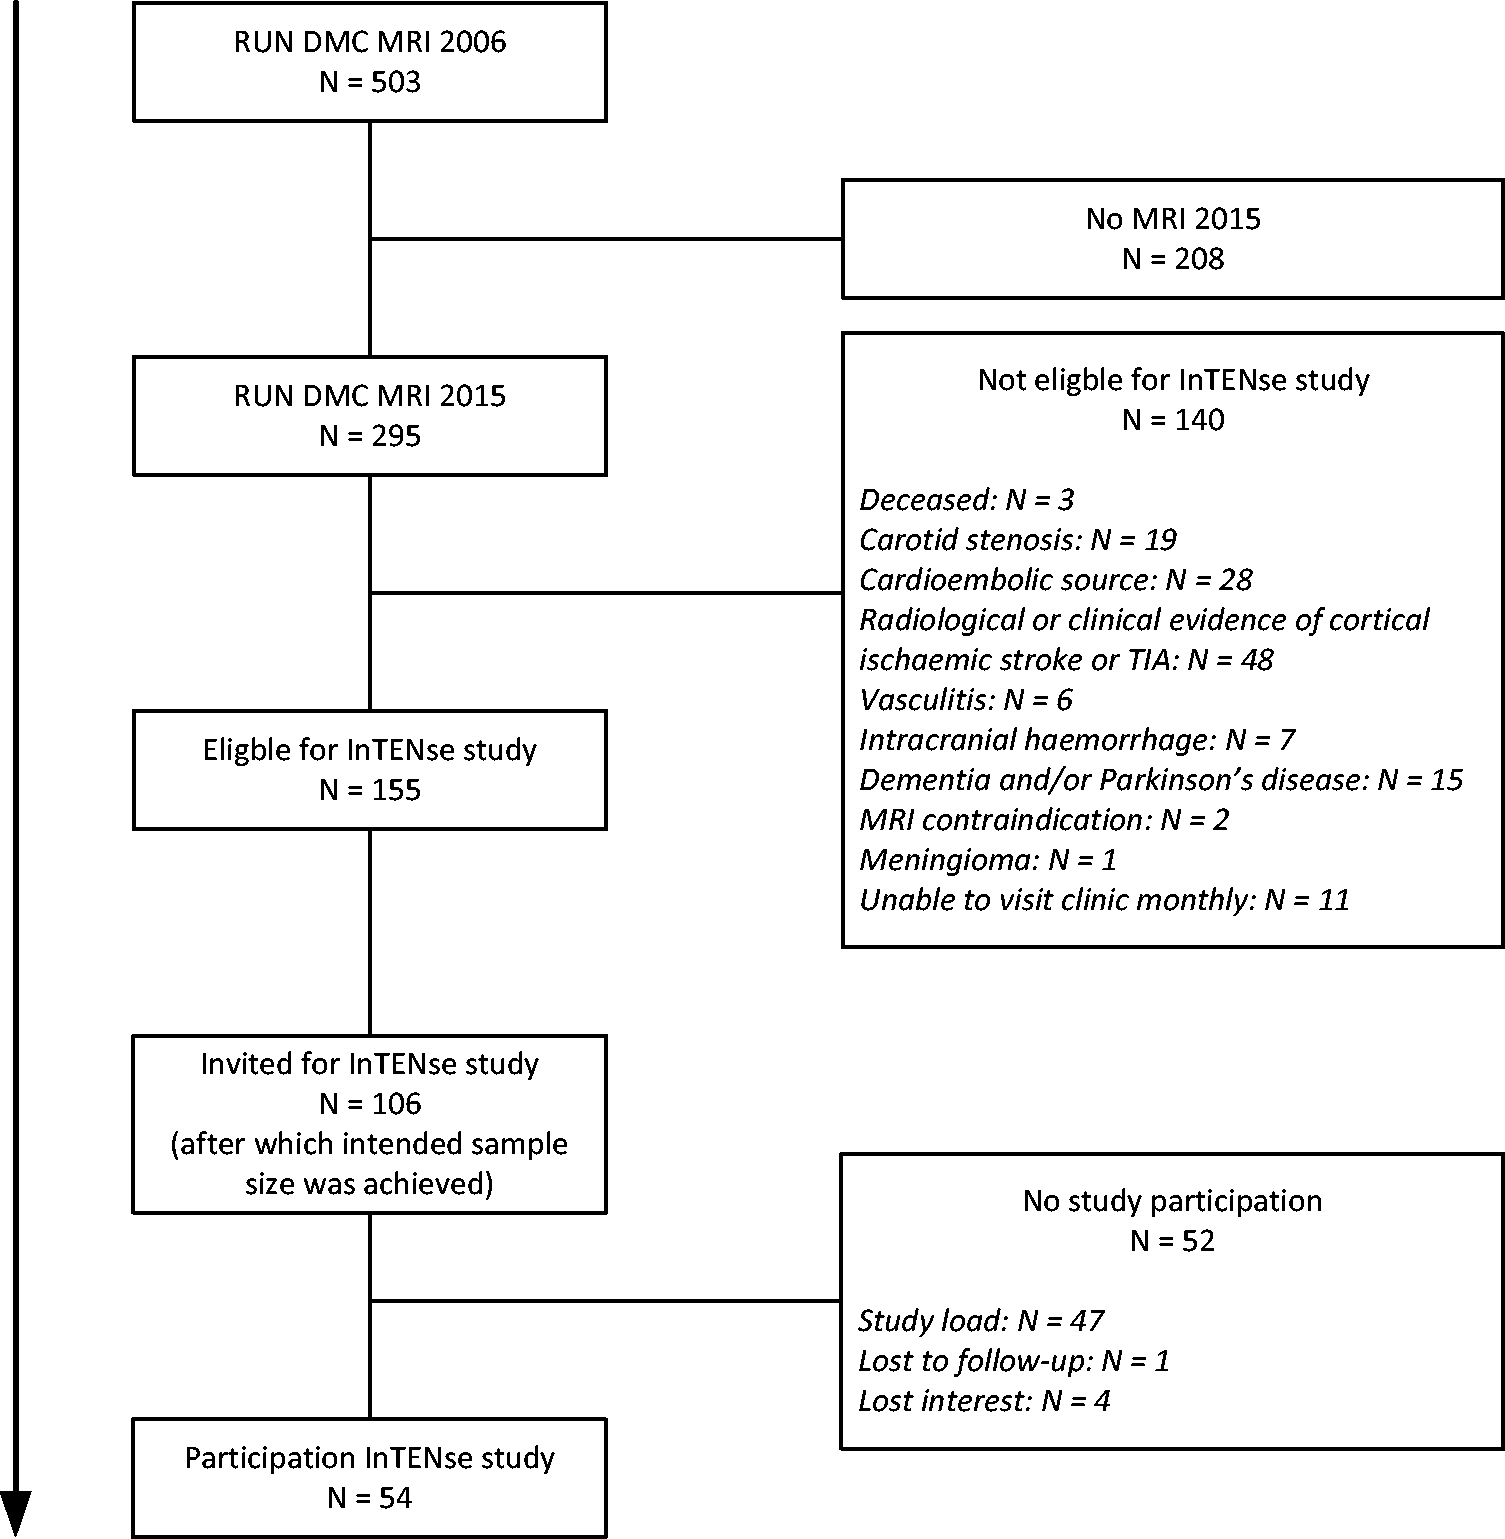
Flowchart of subject inclusion.
Finally, the RUN DMC – InTENse study included 54 individuals with mild to severe SVD as documented on preceding MRIs (2006, 2011, 2015). The median[interquartile range] WMH volume at the RUN DMC follow-up in 2015 and the annual WMH progression between 2006 and 2015 were 5.6[2.5;9.8] ml and 0.35[0.20;0.58] ml/year, respectively. All individuals gave written informed consent. The study was approved by the medical ethics committee region Arnhem–Nijmegen.
Study design
The RUN DMC – InTENse study is a longitudinal observational study encompassing 12 visits, that is, a pre-visit, 10 monthly visits including a MRI and a follow-up visit one year after the start of the study. Table 2 depicts the type of data that was collected for each study visit. Data collection took place between March 2016 and November 2017.
Schedule of all assessments in the RUN DMC – InTENse study.
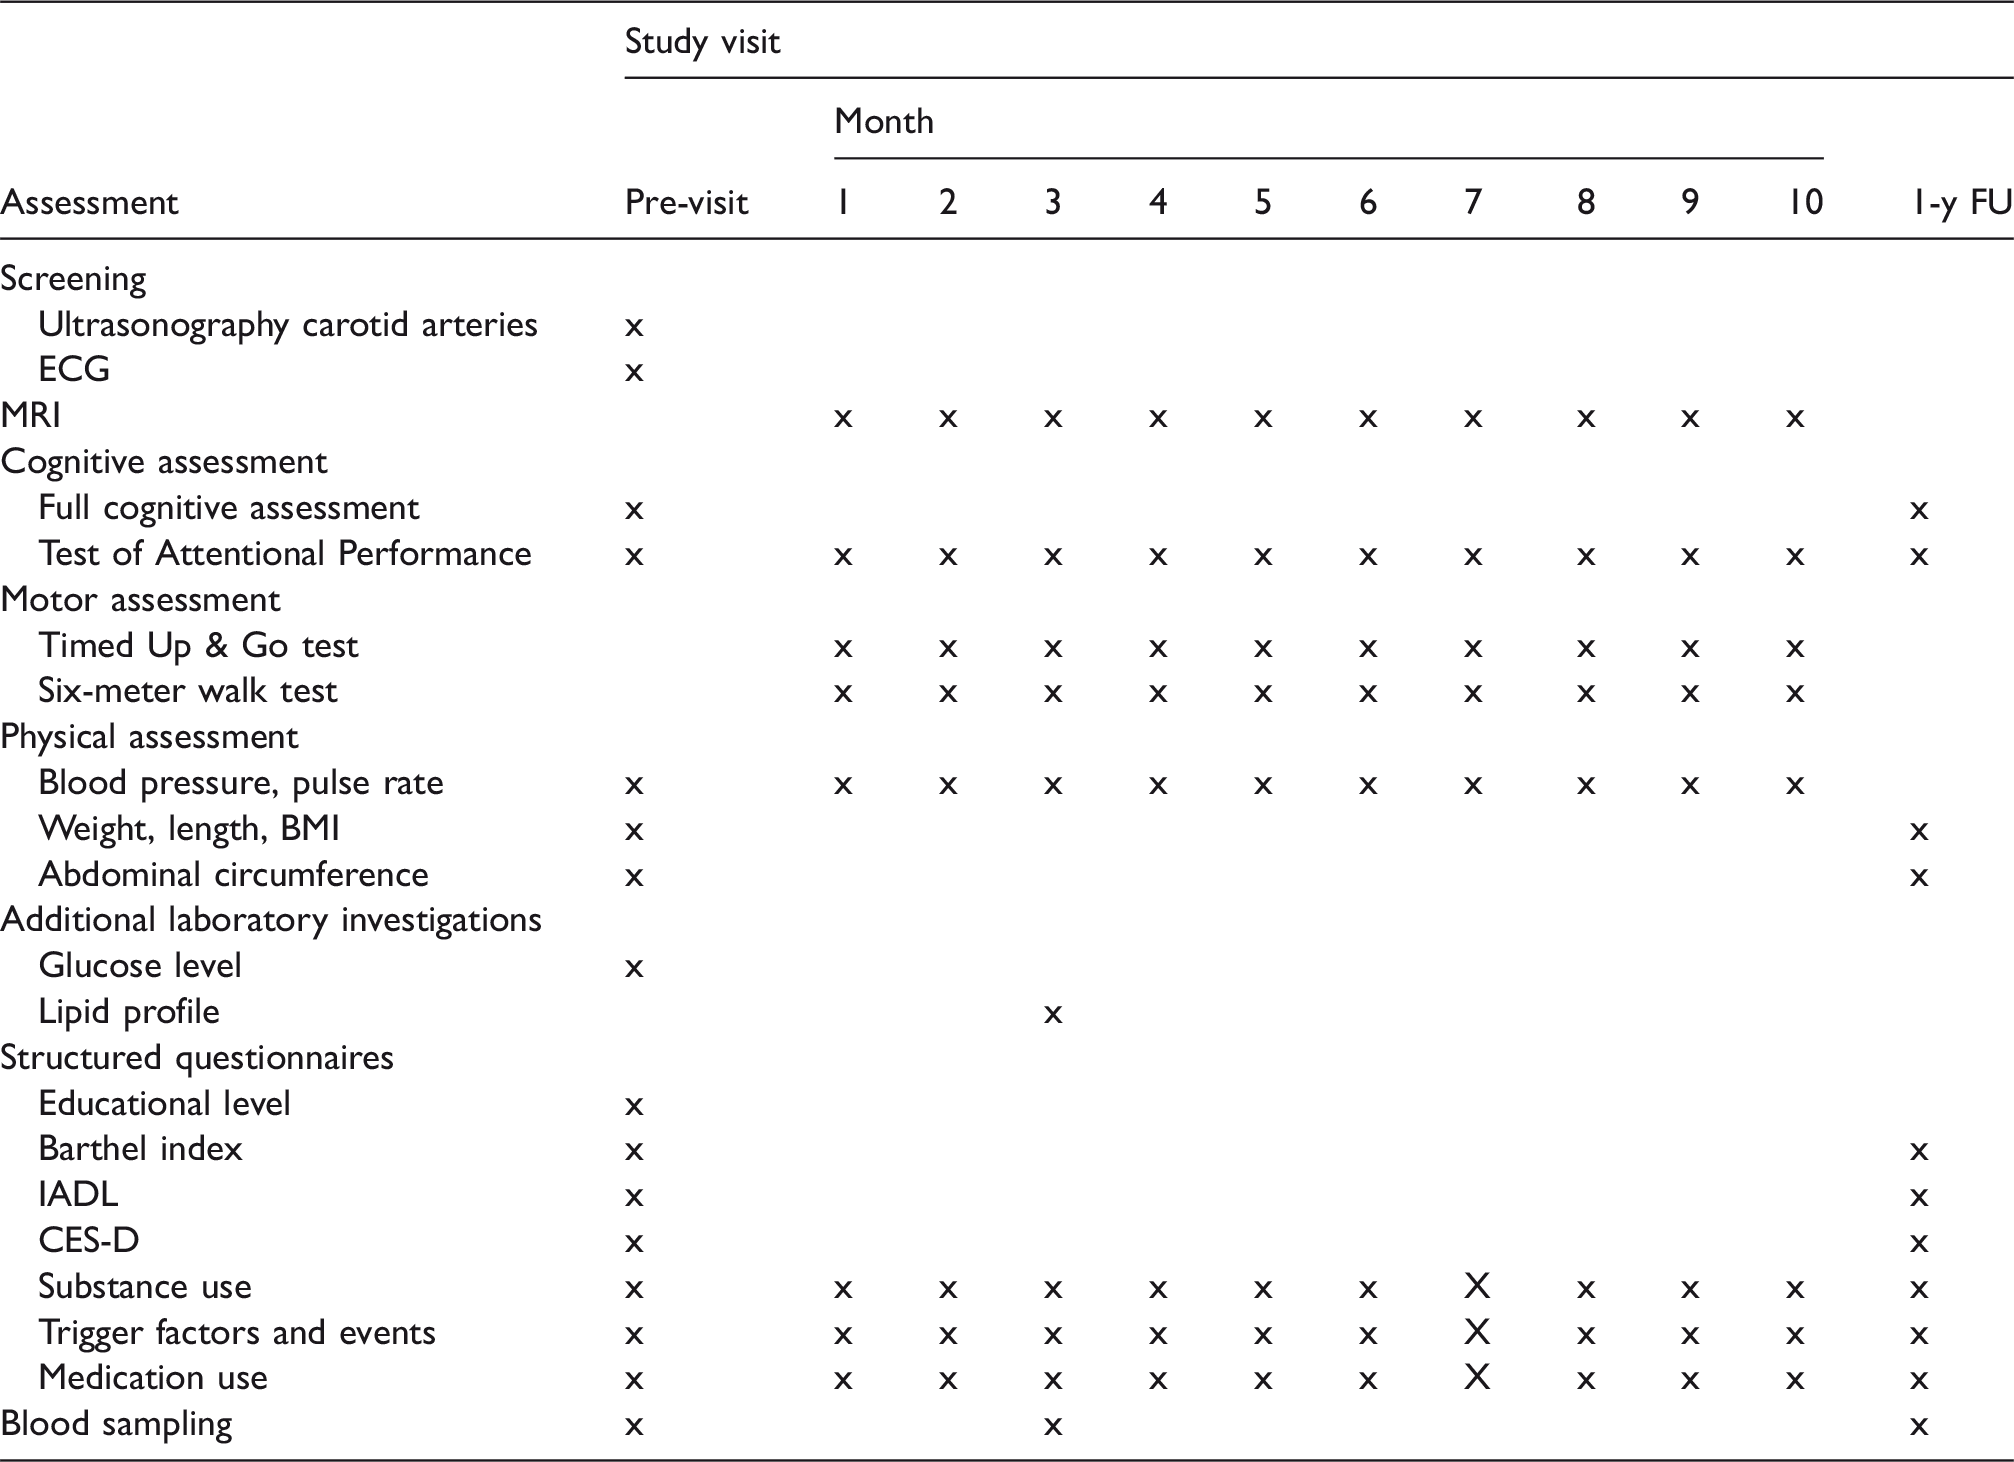
Note: Physical activity was assessed once in the month March to take out seasonal effects. 1-y FU: 1-year follow-up; IADL: Instrumental Activities of Daily Living; CES-D: Center of Epidemiologic Studies Depression Scale.
Screening for exclusion criteria
Ultrasonography of the carotid arteries. During the pre-visit, ultrasonography of the carotid arteries was performed to detect an internal carotid artery stenosis >50%, as indicated by a peak systolic velocity ratio between the internal and common carotid artery >2. The intima media thickness (mm) was determined and averaged over a length of 1 cm in the far wall of the left and right distal common carotid artery near the bifurcation.
ECG. During the pre-visit, an ECG was made to detect atrial fibrillation. All ECGs were assessed by a cardiologist.
MRI acquisition
Participants were scanned on a 3T MRI system (MAGNETOM Prisma, Siemens Medical Solutions, Erlangen, Germany) with a 32-channel head coil. To allow for detection of a spectrum of SVD consequences, the following sequences were applied:
3D fluid-attenuated inversion recovery (FLAIR) with repetition time/echo time/inversion time (TR/TE/TI) 5000/394/1800 ms, 0.85 × 0.85 × 0.85 mm, 192 slices, acquisition time (TA) 7.02 min; Magnetisation Prepared 2 Rapid Acquisition Gradient Echoes (MP2RAGE),
30
to obtain a quantitative T1 map and a uniform bias-corrected T1-weighted image, TR/TI1/TI2 5500/700/2500 ms, flip angle α1/α2 7/4°, 0.85 × 0.85 × 0.85 mm, 256 slices, TA 11.51 min; Presaturated turbo flash sequence to obtain a quantitative B1 map (transmit radiofrequency [RF] map) to correct for residual RF inhomogeneities in the T1 map with TR/TE 11310/2.23 ms, 3.3 × 3.3 × 2.5 mm, 42 slices, 100% slice gap, TA 23 s; Multi-shell DWI using multi-band accelerated echo planar imaging (EPI, developed at the Center for Magnetic Resonance Research, CMRR) including 99 diffusion-weighted directions (3 × b = 200, 6 × b = 500, 30 × b = 1000, 60 × b = 3000 s/mm2) with uniform coverage within and across shells
31
and 10 b = 0 images, one acquired before each series of 10 diffusion-weighted images, multi-band acceleration factor 3, TR/TE 3220/74 ms, 1.7 × 1.7 × 1.7 mm, 87 slices, TA 6.36 min; One b = 0 image to correct for susceptibility-induced distortions in DWI
32
with acquisition parameters equal to the previous b=0 images, but acquired in opposite phase-encoding direction, TA 48 s; Multiple spin echo sequence to obtain a quantitative T2-map (via model-based nonlinear inverse reconstruction33,34) with TR/ΔTE 4000/10 ms, 16 echoes, 0.7 × 0.7 × 3.0 mm acquisition voxel size reconstructed at 0.36 × 0.36 × 3.0 mm, 48 slices, 10% slice gap, TA 3.22 min; 3D multi-echo fast low angle shot (FLASH) providing magnitude and phase images for quantitative susceptibility imaging and R2* mapping, TR/ΔTE 35/4.92 ms, 6 echoes, 0.8 × 0.8 × 2.0 mm, 72 slices, no slice gap, TA 5.57 min; Resting-state functional MRI (rs-fMRI) using multi-band accelerated EPI (CMRR) with multi-band acceleration factor 8, 700 measurements, TR/TE 700/39 ms, 2.4 × 2.4 × 2.4 mm, 64 slices, TA 8.19 min; Two spin-echo EPI acquisitions acquired with opposite phase-encoding direction (anterior-posterior) to compute displacement maps to correct for susceptibility-induced distortions in rs-fMRI images
32
with TR/TE 7100/66 ms, 2.4 × 2.4 × 2.4 mm, 64 slices, TA 7.1 s each.
During the last two MRI sessions, the following sequences were applied instead of rs-fMRI:
Triggered single-slice quantitative flow of the carotid and vertebral arteries, coupled to the peak of each cardiac cycle, TR/TE 23.6/7.44 ms, 0.6 × 0.6 × 5.0 mm, TA 2.26 min; pseudo-continuous arterial spin labelling (PCASL), labelling duration 3000 ms and post-labelling delay 2000 ms, TR/TE 5500/29.6 ms, 3.8 × 3.8 × 3.8 mm acquisition voxel size reconstructed at 1.9 × 1.9 × 3.8 mm, 24 slices, TA 5.30 min, including two M0 acquisitions with opposite phase-encoding direction and TA 11 s each.
All imaging sequences were automatically aligned using an auto-align localiser sequence. If necessary, manual adjustments were made. For PCASL, the labelling plane was manually positioned perpendicular to the orientation of the internal carotid arteries distal to the bifurcation using acquired single-slice coronal and sagittal phase contrast vessel images covering the head and neck.
To reduce within-subject variability in MRI scans, we followed recommendations as previously described, 35 that is, careful positioning of the participant in the scanner, use of same scanner and head coil throughout the study, automated checks of sequence parameters on every acquired dataset and standardised visual image quality control.
Cognitive assessment
Full cognitive assessment. During the pre-visit and one-year follow-up visit, participants underwent an extensive cognitive assessment, directed to measure especially (change in) information processing speed and attention and executive functioning, being the cognitive domains particularly affected by SVD.36,37 Information processing speed was assessed using cards I and II of the Stroop Color-Word test, 38 the Symbol Digit Modalities task 39 and the Trail Making Test A (TMT-A). 40 Attention and executive functioning was assessed using Stroop card III, TMT-B, the Brixton Spatial Anticipation Test 41 and a verbal fluency task in which participants had to name as many animals as possible in one minute. Furthermore, the Mini-Mental State Examination (MMSE) 42 was administered to evaluate global cognitive functioning. Working memory was investigated with the Digit Span Forward and Backward of the Wechsler Adult intelligence Scale-III 43 and verbal memory with the three-trial version of the Rey Auditory Verbal Learning Test (RAVLT) 44 including delayed free recall and recognition after approximately 30 min, during which no other memory or language tests were carried out. At one-year follow-up, a parallel version of the RAVLT was used to prevent material-specific learning effects. Additionally, during the pre-visit premorbid intelligence level was determined with the Dutch version of the National Adult Reading Test (NART). 45
Test of Attentional Performance. To investigate possible acute effects of SVD, participants performed two subtasks of the Test of Attentional Performance (TAP) 46 on a laptop, parallel to each monthly MRI session. The computer session started with the Alertness subtask, a sensitive test for attention and processing speed, which has also found to correlate with executive dysfunction, working memory deficits and apathy in patients with CADASIL. 47 The Alertness subtask consists of four sessions including 20 trials, in which participants are instructed to press a response button as quickly as possible once an X (target stimulus) appears on the screen. During sessions two and three, the trials are preceded by an auditory warning cue. Furthermore, to examine mental flexibility as part of executive functioning, participants performed successively the letter, digit and alternating sessions of the Flexibility subtask, in which the target stimulus is a letter, digit or alternating a letter or digit. During each trial, a letter and digit are presented on each side of the screen. Participants were instructed to respond as soon as possible by pressing the button on the side of the target stimulus. The letter and digit sessions contain 50 trials and the alternate session 100 trials. For both subtasks, reaction times are given as output. To reduce non-specific learning effects on the TAP, which are generally observed between the first two test administrations, participants performed the TAP for practice purposes during the pre-visit, but these results are not taken into account.
Motor assessment
Parallel to each MRI session, participants performed two motor function tasks. Functional mobility was examined using the Timed Up & Go test. 48 The number of steps and the time required (s) were reported. Gait speed (m/s) was determined over a distance of 6 m. For both tests, participants were instructed to walk at their preferred walking speed.
Physical assessment
Blood pressure and pulse rate. Blood pressure and pulse rate were measured in sitting position after 5 min of rest. During the pre-visit, blood pressure was assessed once on both sides. Next, blood pressure and pulse rate were measured three times with 1-min rest between each measurement, both during the pre-visit and every subsequent monthly visit at the arm with the highest recording. Furthermore, blood pressure and pulse rate were measured once during the pre-visit after 1 min in standing position. All measurements were performed with the same blood pressure monitor and time of day was reported.
Weight, length and waist circumference. Body weight and length were measured without shoes in light clothing. The body mass index (BMI) was calculated as weight divided by height squared (in meters). Additionally, waist circumference was measured between the lowest rib and the iliac crest after a normal expiration.
Additional laboratory investigations
Glucose level. During the pre-visit, random plasma glucose level was tested through a finger prick test. In case of a glucose level 7.8–11.0 mmol/l, the overnight fasting plasma glucose level was measured parallel to the third MRI visit. In case of a random plasma glucose level >11.0 mmol/l, we considered this as indication for diabetes mellitus.
Lipid profile: Lipid profile after overnight fasting was determined, including total cholesterol, high density lipoprotein cholesterol (HDL-C), low density lipoprotein cholesterol (LDL-C), non-HDL cholesterol and triglycerides in EDTA plasma.
Structured questionnaires
Educational level
During the pre-visit, educational level was determined using a seven-point Dutch rating scale, 49 ranging between one (less than primary school) and seven (academic degree).
Physical activity
The Physical Activity for the Elderly (PASE) 50 was used to assess physical activity. This standardised questionnaire evaluates leisure, household and occupational or voluntary activities of the past seven days. To take out seasonal effects, the PASE was administered once in March in all participants.
Activities of daily living
During the pre-visit and the one-year follow-up visit, disability and level of independence were assessed using the Barthel Index 51 and the Instrumental Activities of Daily Living (IADL). 52
Depressive symptoms
During the pre-visit and the one-year follow-up visit using the Center of Epidemiologic Studies Depression Scale (CES-D), 53 the presence of depressive symptoms was assessed.
Substance use
Participants were asked about smoking habits, alcohol consumption and drug use. For each we recorded during the pre-visit whether they ever used the substance, age started, current consumption and if quitted, age quitted and previous consumption. Thereafter, during each visit, changes in substance use were recorded.
Trigger factors and events
Any clinical event for which participants sought medical attention or any stressful life event, investigated through the List of Threatening Experiences (LTE), 54 during the past year and subsequently since each previous study visit was reported. Furthermore, prior to MRI scanning, participants were asked about fever, influenza and alcohol consumption during the previous 24 h and cigarette smoking and liquid consumption during the previous 1 h. In case of hospitalisation during the study period, the treating physician was contacted to obtain the relevant information on the event, which was adjudicated by the appropriate specialist to confirm the diagnosis. In case of death, the general practitioner was contacted to obtain information about the cause of death.
Medication use
Baseline medication use and any change therein during the study period were reported and classified according to the Anatomical Therapeutic Chemical (ATC) classification system (World Health Organization, Collaborating Centre for Drug Statistics and Methodology, www.whocc.no/atc_ddd_index/).
Blood sampling
30 ml blood was collected at three different time points. During the pre-visit and the last study visit, non-fasting blood (serum and plasma) was collected for future biochemical analyses. Part of the samples was stored for future DNA and biomarker analyses. Parallel to the third MRI visit, fasting EDTA blood was drawn for immunological analyses. Briefly, flow cytometry analysis was used to determine monocyte subsets and ex vivo stimulation of peripheral blood mononuclear cells was performed to explore cytokine production capacity, as described previously. 55
Primary and secondary outcomes
The primary outcome is the monthly incidence of DWI+ lesions. Secondary outcomes are the evolution of DWI+ lesions on MRI (into WMH, lacune, microbleed or disappear) and the effects of these lesions on cortical thickness, structural and functional connectivity and cognitive and motor performance.
Sample size consideration
This study is powered to detect an increase in WMH, proposed to be caused by DWI+ lesions. The progression of WMH is low (<0.5 ml/year) in individuals with mild SVD, but higher (>2.0 ml/year) in individuals with severe SVD. 56 The current study is powered to detect a mean increase of 1.2 ml WMH over a 40-week period in individuals with mild to severe SVD. To detect this increase (with a power of 80% and an α = .05), a sample size of 39 participants is required. Taking into account a loss to follow-up of 20%, we aimed to include 50 participants.
Discussion
To the best of our knowledge, the RUN DMC – InTENse study is the first study performing both neuroimaging and extensive clinical assessments with such a high frequency among a relatively large number of individuals with SVD.
The main innovative aspect of the study includes its high-frequency serial imaging design. Due to our monthly visits, we are less likely to miss acute events and we are able to closely monitor the evolution of SVD lesions. Another strong element of our study includes the in-depth phenotyping of subjects with SVD. Since all individuals were retrieved from the RUN DMC study, nine years of prior imaging and clinical data was available. Therefore, we could carefully select our participants, making sure to include individuals with a high likelihood of SVD progression during the study period and to exclude individuals with other possible or additional causes of ischaemia, such as carotid stenosis or atrial fibrillation. Moreover, our participants have extensive experience with participation in research, reducing the chance of drop-out. Another powerful aspect of the study includes the state of the art multimodal imaging protocol, enabling us to apply advanced imaging analyses such as advanced diffusion modelling and iron mapping.
However, a few limitations should also be noted. First, although recruitment from the RUN DMC is a major strength, the sample of relatively healthy individuals selected in the RUN DMC – InTENse study may not be representative of the entire population, limiting the external validity of our results. Second, although the current study contains the largest sample size of individuals with short-term serial imaging data in its field, we acknowledge that the sample size is still relatively small.
The RUN DMC – InTENse study will shed new light on the role of DWI+ lesions in the pathophysiology of SVD, which will be of importance for clinical practice. Determining the role of acute, potentially ischaemic, processes in SVD progression might be informative for the development of new treatment strategies. Furthermore, the occurrence of DWI+ lesions may be used as surrogate marker in future clinical trials aimed at slowing SVD progression. Finally, our study will provide a time lapse of (remote) sequelae in the brain following the development of a DWI+ lesion and will provide insight in the effects of these lesions on cognitive and motor performance.
To conclude, the RUN DMC – InTENse study will provide a better understanding of the role of DWI+ lesions in the pathophysiology of SVD and will further unravel the structural and functional consequences and the clinical importance of these lesions, with an unprecedented temporal resolution. Understanding the role of acute, potentially ischaemic, processes in SVD may provide new strategies for therapies.
Footnotes
Acknowledgement
We would like to thank Sjacky Cooijmans, Surekha Gadgil, Daniek van Gils, Karlijn Keizer, Jabke de Klerk, Iridi Stollman and Joost Wissink for their help in collection of the data.