
Abstract
OBJECTIVES
Residency programs must gather and track data on the diversity of their applicants, interviewees, and matched residents as part of the process of checking for bias in the interview and rank process. As such, the aims of this study were (1) to provide data from a large, regional network of family medicine residencies on who is applying, interviewing, and matching into our programs as a baseline for the family medicine residency community; and (2) to assess potential differences in the gender and racial diversity of the eligible applicants to programs across settings, including in rural and underserved communities.
METHODS
Survey of programs in Alaska, Idaho, Montana, Washington and Wyoming about their applicant pool in the 2020-2021 interview season.
RESULTS
Programs received a median of 100 applications per position, 57 of which were considered eligible. Programs offered 17 interviews per position and 15 of these were completed. Programs in rural and underserved communities did not have fewer eligible applicants per position, nor was there less diversity within that pool of applicants. Most programs are working to increase their program's diversity.
CONCLUSION
On average, the racial and gender diversity of eligible applicants to programs in rural and underserved settings is no different than other programs. What is important in terms of diversity varies across programs, based on community needs and program mission, but having a mechanism to extract and review data and to then be able to assess progress is a place to start.
Keywords
Introduction
Research has shown that healthcare outcomes improve when the characteristics of the workforce match the characteristics of the patient population.1-5 However, the current family medicine workforce does not resemble the demographics of the U.S. population, for example, in 2019 13.4% of the U.S. population was Black and 18.5% identified as Hispanic but only 7.8% of family medicine residents were Black and 9.1% identified as Hispanic. 6 In response, as one part of the solution, increased attention has been given to addressing diversity, equity, and inclusion (DEI) in graduate medical education in recent years.7,8 In 2020 the Accreditation Council for Graduate Medical Education (ACGME) released updated Common Program Requirements, which require all residency programs to address DEI. 9 Many programs are struggling to incorporate the requirement to address DEI; a 2020 survey from the Association of Family Medicine Residency Directors (AFMRD) Diversity and Health Equity (DHE) Committee indicated that 50% of family medicine program directors were not confident implementing the common program requirement change pertaining to diversity. 10
A first step for programs to address DEI and aim for a diverse body of residents that more closely matches their patient population and local needs is having access to data that can help identify opportunities to increase diversity, identify points of bias, and track progress over time. The 2022 AFMRD DHE Committee diversity milestones, which offer a familiar structure to residency program directors for evaluating their organizational efforts in DEI, 11 detail DEI efforts in recruitment at Level 1: “Data tracking of diversity of applicants to program, holistic review of applicants, best practices to reduce bias in interview and rank process, integration and recognition of systemic oppression in rank process.” 12 Although access to demographic data is increasing nationally, there is a lack of data specific to family medicine graduate medical education. The Association of American Medical Colleges (AAMC) has been collecting data for decades on medical student diversity (gender, racial, and ethnic identification) allowing for comparisons over time. 13 Data is also available for diversity among residents, but this is large aggregate data from the annual ACGME Resident Survey, broken only into surgical versus nonsurgical specialties and not specific to family medicine. 14
The primary aim of this study was to provide the family medicine residency community a baseline from which to grow our DEI efforts, by providing data from a large, regional network of family medicine residencies. Additionally, we recognized a particular gap in data regarding both racial and gender diversity in programs in underserved and rural settings; the secondary aim of this study was to compare racial/ethnic and gender diversity of applicants across program settings.
Methods
The Washington, Wyoming, Alaska, Montana, and Idaho (WWAMI) Family Medicine Residency Network (FMRN) began collecting applicant data from member programs in 2003 through an annual “census”-style survey. This survey has an expectation of 100% completion so no sample size or power calculations were required. We recognize this is a narrow sample, but data on the resident recruitment process are hard to obtain and the trust built into our annual “census”-style survey provides a unique opportunity to observe trends across a range of very different family medicine residency programs.
At the time of the initial survey, the FMRN comprised 15 family medicine residency programs and 1 rural training program (RTP) with a total of 110 intern positions. In the nearly 2 decades since then, the FMRN has grown to 32 programs and 9 RTPs with a total of 254 interns in the 2021 incoming class. Historically, the applicant data collected by the FMRN was used for internal sharing and thus is a nonvalidated tool. It included the total number of applicants, how many applicants were interviewed, as well as how many applicants were from allopathic, osteopathic, and international schools. Additionally, FMRN asked programs for the number of positions filled through the National Resident Matching Program Match, through the Supplemental Offer and Acceptance Program and if any positions went unfilled. Recognizing the need to learn more about the diversity of applicants and the changes in the pool of diverse candidates across the applicant process, and the potential for this data from a large group of programs being useful to others more broadly, FMRN collected demographic information starting in 2021. Although we recognize that there are many types of diversity, in this study we focused on gender diversity and racial/ethnic diversity, specifically underrepresented in medicine (URM), partly due to data gathering constraints (more below).
Specifically, we expanded the 2020-2021 interview season applicant data survey to include race/ethnicity and gender demographic data at each of the following stages: applicants after filtering/prescreening (eligible applicants), applicants offered interviews, applicants interviewed, and applicants matched. Survey questions are completed using data from the Electronic Residency Application Service (ERAS), which programs use to manage their applications. These requested demographic data were based on the preexisting categories in ERAS and included a number of applicants who self-identified as male or female and applicants who self-identified as American Indian or Alaska Native; Asian; Black or African American; Hispanic, Latino or of Spanish origin; Native Hawaiian or other Pacific Islander; White; or other race/ethnicity. Programs were also asked if they used filtering or prescreening criteria to narrow their applicant pool (eligible applicants), and if so, what those criteria were. The final question on the survey asked if programs had a formal process to increase diversity and if so, how long ago it was initiated.
We began development of the online version of this expanded survey in January 2021. A staff member from one of the FMRN programs with expertise in ERAS was consulted to guide survey instrument design to maximize consistency of data across programs. Before the survey was sent out, we pilot-tested it for readability and flow with two staff members minimally familiar with the ERAS platform. The survey was sent electronically on April 1, 2021, to all FMRN residency administrators and coordinators representing the 40 civilian programs and RTPs; the one military program was excluded given that the military match is a separate process from that of civilian programs. Additional reminders were sent weekly for the following three weeks. Programs that failed to complete the survey by the end of April were followed up with and the survey was closed at the end of May 2021. All data were collected, stored, and managed via Research Electronic Data Capture hosted at the University of Washington.15,16
Data analysis
To make sure our 2021 data were in range with a typical year, given the COVID-19 pandemic, we compared our programs’ median total applications across the last 5 years (2017 to 2021). To analyze the 2021 data, given the wide range of a number of applicants and interview numbers across programs, we used medians for comparison and normalized by dividing per intern positions in that program (eg, applicants per position). We used descriptive statistics to summarize the general data trends and then conducted independent-sample median tests to compare trends across the application process. Specifically, we compared total applications per position and eligible applications per position across two main program factors of interest: whether a program was a core program or an RTP (as defined by the ACGME), and whether a program was located in a highly underserved community, classified for this study as a Health Professional Shortage Area (HPSA) 17 numerical score ≥16, calculated as the highest HPSA score attributed to their practice site(s), as identified on the program website, or county in which the residency practice site(s) was located on June 9, 2021.
Across these program factors, we also compared the numbers of applicants who were URM and a number of female applicants among eligible applicants and each subsequent stage of the recruitment process. We defined URM for our study as those who self-identified in ERAS as American Indian/Alaska Native, Black, Latino, Native Hawaiian/Pacific Islander or Other following the general AAMC definition 18 ; those who identified as any URM category were included as URM and we excluded those who self-identified as white or Asian and those who did not respond to the question. We conducted analysis in SPSS Version 27 and for all analyses, we considered p-values of .05 or less to be significant. This study was reviewed by the University of Washington Human Subjects Division and was considered exempt from IRB review as research not involving human subjects; as such, no written informed consent was required.
Results
We had a 100% response to our 2021 applicant data survey. No statistical differences were observed between the FMRN programs’ median total applications across the last 5 years (2017 to 2021).
In 2021, across the 40 core programs and RTPs in the FMRN, there was a median of 602 applicants per program, 314 of which were considered eligible (median of 58% of total applicants considered eligible), averaging out to a median of 100 applications per position (min 23, max 387). A median of 17 interviews were offered per position and 15 were completed (Table 1).
Median applications, eligible applications by type, interviews offered, and interviews by intern position across FMRN programs.
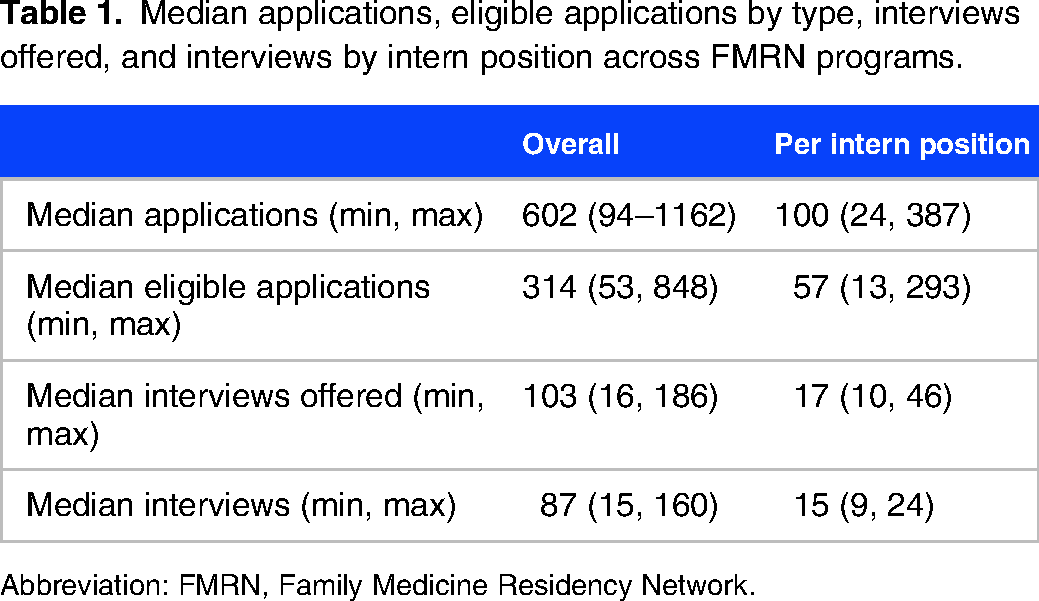
Abbreviation: FMRN, Family Medicine Residency Network.
Overall, RTPs received significantly more applications per position than core programs (p = .001) (Table 2). However, once applicants were filtered there was no difference; RTPs do not have more eligible applicants per position than core programs (p = .715). Programs with higher HPSA scores (16+) did not receive significantly more applications per position or have more eligible applicants per position than programs with lower HPSA scores (15 or less) (Table 2).
Median applicants and eligible applicants per position by program rural designation and HPSA score (independent-samples median test).
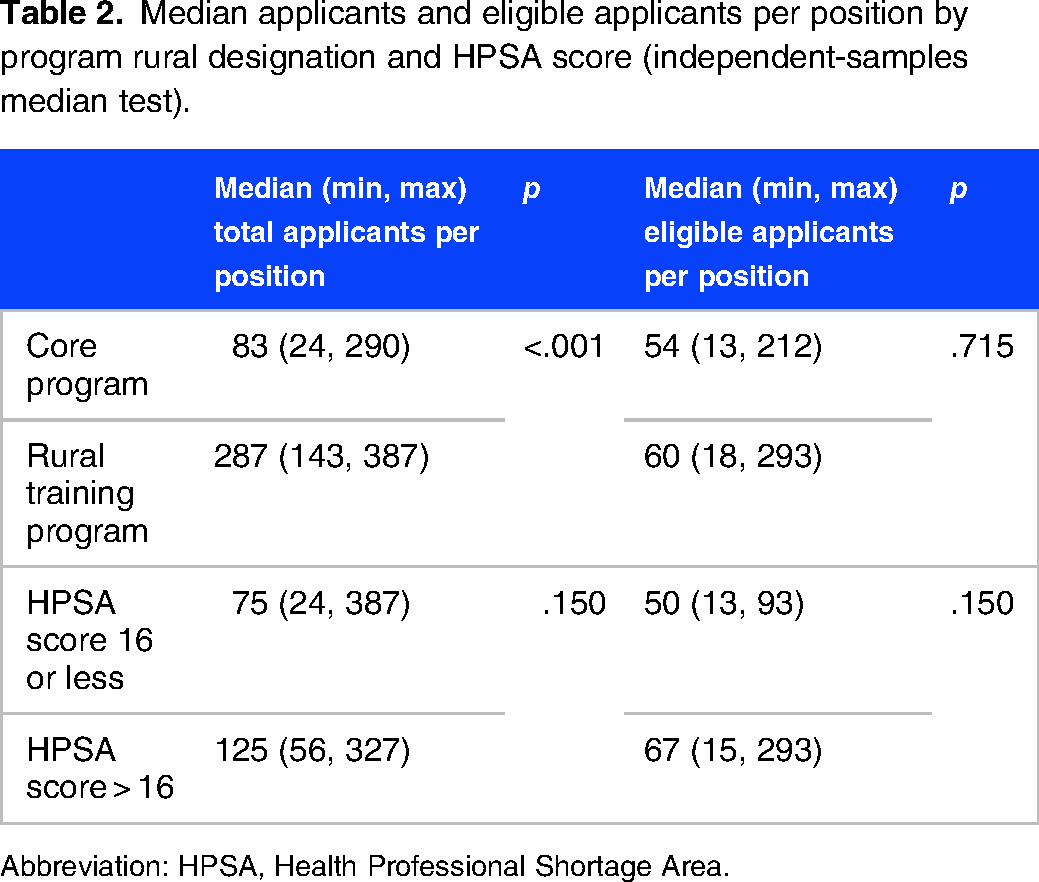
Abbreviation: HPSA, Health Professional Shortage Area.
URM applicants
RTPs did not have significantly different numbers of URM eligible applicants (p = .715), URMs offered interviews (p = .715), URMs interviewed (p = .715), or matched URM individuals (p = .361) per position than core programs (Table 3).
Median per position eligible applicants, interviews offered, interviews and matched URMs by measures of by program rural designation and HPSA score (independent-samples median test).

Abbreviations: URM, underrepresented in medicine; HPSA, Health Professional Shortage Area.
Programs with higher HPSA scores (>16) did have significantly more URM eligible applicants (p = .038) than programs with a lower HPSA score but do not have significantly different numbers of interviews offered to URMs (p = .150), interviews with URMs (p = .876), or matched URM individuals (p = .266) per position (Table 3).
Female applicants
RTPs did not have significantly different numbers of female eligible applicants (p = .273), interviews offered to females (p = .201), interviews with females (p = .855), or matched female individuals (p = .305) per position than core programs (Table 4).
Median per position eligible applicants, interviews offered, interviews and matched females by program rural designation and HPSA score (independent-samples median test).

Abbreviation: HPSA, Health Professional Shortage Area.
Programs with higher HPSA scores (>16) did not have different numbers of female eligible applicants (p = .150), interviews offered to females (p = .639), or interviews with females (p = .863) per position than programs with a lower HPSA score (Table 4). The number of matched female individuals per position was significantly lower in programs with higher HPSA scores (p = .049).
Processes to increase diversity
Most FMRN programs have been working to increase diversity in recent years, with 30 (75%) reporting that they initiated a process to increase diversity less than 2 years ago. Four programs (10%) initiated a process 3 to 5 years ago and 2 programs (5%) have had a process to increase diversity for more than 5 years. Additionally, 4 programs (10%) reported that they have never undergone a formal process to increase diversity.
While individual programs might observe a difference, in aggregate these initiatives did not show a statistical difference in changing the diversity of the applicant pool. There were not significantly different numbers of URM eligible applicants (p = .163), interviews offered to URMs (p = .259), interviews with URMs (p = .472), or matched URM individuals (p = .349) per position by time spent working on diversity efforts. There were also not significantly different numbers of female eligible applicants (p = .163), interviews offered to females (p = .837), interviews with females (p = .837), or matched female individuals (p = .444) per position for programs compared by time spent working on diversity efforts.
Discussion
The primary aim of this study was to provide some baseline data on a number of applicants and interviews per intern position for other family medicine residency programs. We found that across the WWAMI FMRN, there is a wide range of programs attracting applicants of varied backgrounds, with an average of 100 applications per intern position in a given program. We also embarked on this effort with the notion that some program types may have fewer gender or racially diverse eligible applicants and final recruits, either as a result of more bias in their recruitment process or as a result of applicant preference for particular program types. This did not hold true: rural programs and underserved programs did not have fewer eligible applicants per position, nor did they have less racial/ethnic and gender diversity within their eligible applicant pool. In fact, programs with higher HPSA scores had more eligible URM applicants than programs with lower HPSA scores though they matched fewer female applicants.
As part of this work, we hoped to help programs identify areas within their application review and interview process where bias might be playing a role, for example, if many fewer female applicants are being interviewed despite equal numbers of eligible male and female applicants. In addition to the analysis reported here, we provided FMRN programs with individual reports to serve as a baseline and show whether (and where) they are filtering out diverse candidates during the recruitment and application process. Unfortunately, as noted above and below, we could not show explicitly how much diversity was lost through the filtering/prescreening process, which is already known to create bias, because we did not gather demographics of the “all applicant” pool, though this is planned for the future. Despite this, we were able to see that programs that have had a formal process to increase diversity among residents within their programs for longer amounts of time did not show significant differences in diversity of eligible applicants on average across the application/interview process than those who have not been working on formal diversity efforts for as long. This means that on average, FMRN programs are still considering similar numbers of URM and female candidates as “eligible” even if their attention to this and efforts are widely varied. However, we acknowledge that using medians for our aggregate analysis has the potential to mask efforts at enhancing diversity in individual programs and encourage each program to consider exploring diversity at each stage of their own application process to track their program-level change as they implement DEI efforts.
Using data from ERAS was a major limitation of our study despite it being the only place where these data are found in most programs. ERAS is a system designed for processing residency applicants, not data tracking, and thus some data may have been incomplete or inaccurate because of the challenge of extracting them. Additionally, the demographic data in ERAS are limited and their requirements for self-identification of gender and race/ethnicity do not appropriately reflect the spectrum of diversity that we recognize. For example, in ERAS, male/female are binary choices. Additionally, although some racial subcategories are available in ERAS, they are hard to find and the burden of data extraction on our survey respondents made them impractical to gather and analyze. In particular, and consistent with the AAMC definition of URM as noted above, we excluded those who self-identified as Asian from our definition of URM, although we recognize that some subgroups of the “Asian” category are indeed URM. While this level of detail was not feasible for the purposes of our survey, ERAS does contain more granular data to allow individual residency programs to better identify and track URMs for themselves.
In our study, programs reported on which filters they use to narrow down the applicant pool to “eligible” applicants. We know from prior studies that students from underrepresented backgrounds are more likely to be screened out with filters using a cutoff score for step exams19–21 and tactics like holistic review have been suggested to help mitigate bias. Unfortunately, we did not ask the right questions to fully analyze whether filters might be screening out diverse candidates in our data and found this to be a major limitation and an opportunity for a future study. Finally, the geographic region of our study may be a limitation. We have an incredibly diverse array of programs across the FMRN, with a variety of sponsor types, community locations, program sizes, and missions, however, our states have less population diversity than other regions, which almost certainly has some impact on who our programs attract as applicants, interviewees, and ultimately as residents.
In addition to the HPSA score and RTPs, we initially also examined the age of the program, programs with ACGME Osteopathic Recognition, and two other measures of rurality—Rural-Urban Commuting Area score and whether a program had a “rural emphasis” or not—recognizing that some programs may focus on rural even if they are not RTPs. These results are not reported as they did not change our findings and made the reporting overly complicated. However, these might be worth considering in future studies as we gather more data. An additional area of future study is the changes that the COVID pandemic has had on the application and interview process and whether that has impacted applicant diversity in programs in different settings.
Conclusion
Overall, we hope these findings might give a baseline for some applicant data in family medicine and inspire other programs to think about how they can measure and track the diversity of their applicant pool through the application and interview process to begin improving inclusivity and reducing bias in the process. On average, the racial and gender diversity of eligible applicants to programs in rural and underserved settings is no different than other programs. Our programs found that even the process of gathering these data was a useful exercise, particularly identifying and extracting the data from ERAS, which is not designed for this purpose. What is important in the diversity of applicants may vary across programs, based on community needs and program mission, but having a mechanism to extract and review data, compare it to an average, and to then track progress is a place to start.
Footnotes
Acknowledgments
The authors would like to thank Renee Thompson, Recruitment and Fellowship Coordinator at the Idaho State Family Medicine Residency Program, for her assistance with developing and refining our survey instrument.
DECLARATION OF CONFLICTING INTERESTS
The authors declared no potential conflicts of interest with respect to the research, authorship, and/or publication of this article.
FUNDING
The authors received no financial support for the research, authorship, and/or publication of this article.