
Abstract
Objective:
American College of Graduate Medical Education (ACGME) recommends ongoing care of 10 patients per resident however its implication is unclear. We hypothesized EMR quality to vary based on patient load and call status.
Methods:
We conducted a double-blind, single-center, retrospective observational study between 2017 and 2019 to investigate the quality and accuracy of resident documentation using the Responsible Electronic Documentation (RED) Checklist, a validated scoring system.
Results:
A total of 234 independent charts were analyzed and 80 met scoring criteria. Average patients per residents was 4, 9.1, 7.2, and 5.5 on “call” day (D0), “post-call” day (D1), “mid-call” day (D2), and “pre-call” day (D3), respectively. Mean RED checklist scores were 68.1%, 57%, 68.6%, and 72.1% on the above call status. The difference in score between D3 and D1 was statistically significant (P = .00042). There was a negative correlation between score and number of patients per resident (r = −0.286, P = .010).
Conclusion:
EMR documentation quality is directly impacted by patient load and resident call status with the lowest documentation quality on post-call day, correlating with patient load.
Introduction
Documentation forms one of the most important part of clinical care of the patients. It is the primary source for protected health information (PHI) for the primary team, consultants, nurses, and other paramedic staff and help in providing a higher quality of care, as well as monitoring patient safety. The introduction of Electronic Medical Records (EMR) was intended to improve analysis and management, improve clinical documentation, clinical decisions, increasing compliance with standard of care, and reduce allegations of negligence and thereby improving patient care and safety. 1 Incomplete patient records are a source of gap in patient care and vice versa.
EMRs introduce new kinds of risks into an already complex health care environment and between the years 2010 and 2013, the Joint Commission identified 120 adverse events related to information technology in the health care with, 33% related to Human-computer interface resulting in data-related errors, 24% related to workflow or team communication, and another 23% related to the clinical contents. 2 Another independent study on EMR-error related patient safety incidents by a private health care analytic firm showed the numbers reaching as high as 3769 in 2018, 3% of which resulted in patient harm including 7 deaths. 3 A national medical liability insurer’s review of EMR-related malpractice claims showed that incorrect information in EMR (16%) and copying and pasting (13%) formed the major user-related factors linked to malpractice claims. 4 About 20% of these EMR-related claims were in internal medicine specialties and 16% in the primary care setting. The introduction of technology was expected to have a good impact on physician burnout rates, but the finding from the studies following introduction of EMRs were not very encouraging. Studies have consistently shown that EMR figures in the top 5 reason for physician burnout and resident physicians are spending more time for documentation than with the patients.5,6 In a study among 4696 resident physicians, nearly half of them reported burnout. Burnout was reported among 42.6% of internal medicine residents with 12.2% expressing career-choice regret. 7 The American College of Graduate Medical Education (ACGME) require residency programs to ensure that a first-year internal medicine resident is not be responsible for ongoing care of more than 10 patients at a time in order to reduce burnout among residents and improve patient care. 8 This is a randomly assigned number and the implications have not been assessed especially with regards to the technology-in-medicine. We hypothesized that EMR documentation quality would vary depending on the workload and the call status of residents.
Methods
This is a double blind, single-center, retrospective observational study done at Monmouth Medical Center, a community teaching hospital in New Jersey, USA. The quality of EMR documentation of 20 post-graduate year 1 (PGY1) internal medicine residents between the years 2017 and 2019 were assessed using the Responsible Electronic Documentation (RED) Checklist (Supplemental File 1). This is a validated scoring system to assess quality and accuracy of physician EMR progress notes and evaluates if notes were updated, succinct, truthful, and accurate in the documentation of symptoms, physical examination, laboratory and imaging investigations, diagnostic assessment, and management plan. 9 As per institutional policy, the study was exempt from institutional review board process being a quality improvement study by educators (Residency Program Director and Chief Residents) without deviation from routine educational practices.
Two investigators screened a total of 234 patient charts independently. The notes were stratified based on the call status as described in the section “Call Schedule and Responsibilities.” The investigators randomly identified 1 progress note per resident for D0, D1, D2, and D3 for a total of 80 progress notes on different patients. The selected notes needed to have a progress note from the previous day by the same resident for comparison as per the Responsible Electronic Documentation Checklist (RED Checklist) criteria.
To maintain uniformity of scoring on validated RED checklist, a single investigator assessed and scored all the progress notes. For scoring, for yes/no questions, a score of 1 was given for “yes” and 0 for “no.” For items with three-level rating scale, 0 receives no points, 1 receives half a point, and 2 receives full point. Scores are reported as percentages. “Not applicable” items were removed from the denominator when calculating the total percentage score. We calculated the scores for progress notes of each resident and compared it to their call status and number of patients to evaluate how the patient load affected documentation quality. We also extracted de-identified information from the information-technology department regarding the frequency of patient chart access by each resident. Data on the number of patients per resident per day was obtained using hospital electronic sign-out sheets called E-Systems™ and the EMR lists from the morning of the corresponding day as patients could be discharged later in the day.
Descriptive statistics including mean and standard deviation were calculated to summarize the scores of each resident on each of the days. For each resident, a one-way analysis of variance (ANOVA) was employed to compare the scores across the 4 days of measurement along with pairwise comparison between days. Test for homogeneity of variance across groups as well as normality assumption for the ANOVA model was evaluated. Statistical analyses were performed using IBM SPSS Statistics 25 software.
EMR
The EMR system in use, Cerner™ could be accessed from any computer in the hospital with a single username and password entry. The EMR had the option of opening multiple patient charts at a time, but only 1 being active at a time and had the ability to switch between the charts using double clicks. The system had the ability to copy forward contents from previous days to be included in progress notes. Vital signs, laboratory values were mostly auto populated.
Call schedule and responsibilities
The call schedule at the residency program is comprised of a structure where a team of 3 residents (1 PGY-2/PGY-3 and 2 PGY-1s) is on-call every fourth day during a 4-week inpatient service rotation. During any 4 weeks duration of inpatient service, there were 4 teams (Team A, B, C, and D). Based on the call status, there would be on-call, post-call, mid-call, and pre-call teams on each calendar day. The work hours were 7 AM to 5 PM for all 4 teams when they would be in charge of a maximum of 10 patients per PGY-1. All the teams sign out to the on-call team after the work hours with clinical care responsibilities until 10 PM. The on-call resident would then endorse the patients of all 4 teams to the night float resident, who would then take the patient’s responsibilities between 10 PM and 7 AM. The morning shift team would resume the responsibility for their patients from 7 AM onwards. The on-call team is responsible for all rapid response and resuscitation calls from 7 AM to 10 PM and new admissions to inpatient services between 5 PM and 8.30 PM. The team admission cap was 10 patients, equally distributed among team residents (4 admissions for PGY-2/PGY-3 and 3 admissions each for PGY-1). Overnight admissions were first redistributed to the post-call team until the cap of 10 patients, followed by redistribution to mid-call and pre-call teams. All residents, irrespective of call status was expected to attend daily noon didactics and attending rounds.
Results
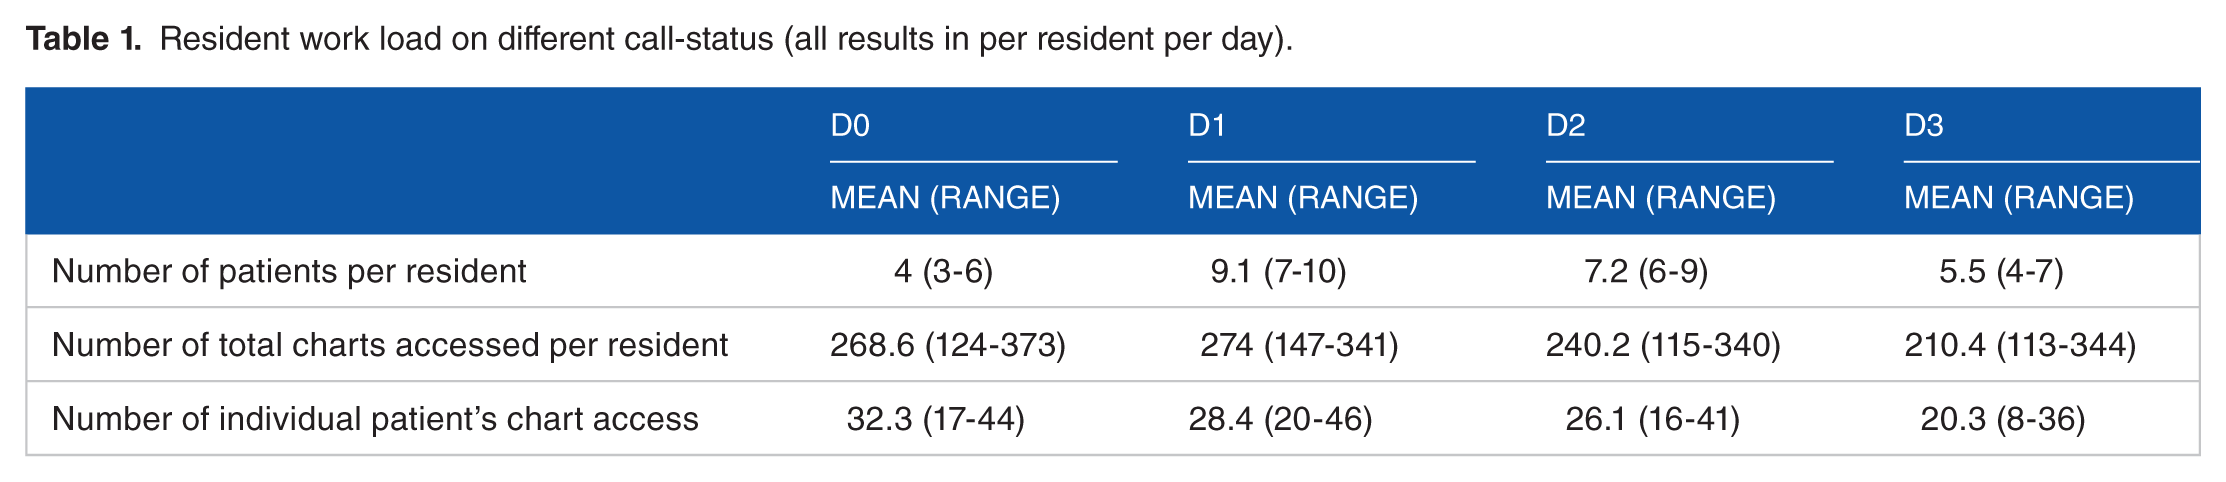
The residents during the study period took care of a mean of 4 patients on a “call” day (D0), 9.2 patients on a “post-call” day (D1), 7.2 patients on a “mid-call” day (D2), and 5.5 on a “pre-call” day (D3) (Table 1). From analysis of the EMR data from the Information Technology department at the hospital, we found that a resident accessed patient charts an average of 244.2 times a day during the inpatient floor-rotation and opened an average of 27 individual patients’ charts. The accession of chart was highest on D1 and lowest on D3, however was not statistically significant.
Resident work load on different call-status (all results in per resident per day).
From the 234 patient charts screened for documentation quality scoring, 80 which fulfilled requirements for RED checklist were analyzed. Only 7 (8.8%) progress notes had summary statement and 43 (53.8%) had impression or summary of study reports. Residents scored higher on the checklist questions on succinct vitals and physical examination of relevant systems included (mean score 93.75%), updated patient symptoms (mean score 92.5%), and a problem-based assessment (mean score 89.38%). The lowest individual question scores were for updated impression of study reports (mean score 20.93%) and examination being different from the previous day (mean score 33.75%) (Figure 1). The mean checklist score was 68.1%, 57%, 68.6%, and 72.1% on D0, D1, D2, and D3, respectively (Table 2).

Mean percentage scores of 20 residents for each question on the RED checklist on different call-status.
RED checklist scores of 20 residents on D0, D1, D2, and D3. Shades from yellow to green indicate better scores.


A significant difference in RED checklist score was noted between post-call day and any other call status with the most pronounced difference between D3 and D1 (t = −3.626, P = .00042) (Table 3). No significant difference in score was observed between D0 and D2, D0 and D3 as well as D2 and D3. There was a negative correlation between progress note scores and number of patients per resident on the day of documentation (Pearson correlation = −0.286, P = .010).
Comparison of RED checklist scores between different call-status.

P-values by Wilcoxon signed rank test.
Discussion
The ultimate goal of implementing electronic medical records (EMRs) is to provide the highest level of care at the lowest cost with the least risk. However, there are underlying assumptions that EMRs save time, provide real-time access to patient information at the point of care, facilitate the work of the clinician, provide decision support capabilities, support clinical care and research, and improve quality and safety of care. However, the complexities of EMR technology have led to the emergence of new types of errors with their widespread adoption. 10 Among spectrum of issues associated with EMRs, one of the most commonly encountered error is “copy and paste” which is routinely used by 66% to 69% of clinicians. 11 Despite such widespread use of “copy and paste”, there is no direct evidence supporting patient safety effects. Nonetheless, it remains a challenge and a survey by the Kaiser Family Foundation found that 1 in 5 patients spotted an error in their own EMR. Managing EMR seems to a continuous and evolving process where there is a need for continuous troubleshooting, assessment, reevaluation, and implementation. A number of measures have been adopted in the training of medical residents to minimize errors related to EMR, including the use of checklists to evaluate the quality of documents and limiting patient load to ensure an optimal learning environment. 9
The core committee of Accreditation Council for Graduate Medical Education (ACGME), the regulating body for graduate medical education ACGME in the United States recommends a team cap of 20 patients for a supervising resident when supervising more than 1 first-year resident and a cap of 10 patients for a first-year resident for ongoing care. 8 A recent study published showed that in US teaching programs, residents spend more time participating in indirect patient care than interacting with patients. 12 There is a lack of data on the appropriateness and outcomes of the suggested patient workload and clinical documentation of residents. Also, the workload of residents is subject to significant variation throughout the week and call status. 13
Our study revealed that medical residents had the least number of patients on their on-call as well as pre-call days and the highest number of patients on post-call days. The mean RED checklist scores were also the lowest on post-call days. The most pronounced difference in resident documentation quality was also noted between D3 and D1 and this was statistically significant as well. This directly correlated to the number of patients under the care of residents on these days respectively. There was an improvement in documentation quality on all other days compared to post-call days thereby denoting an effect of resident workload on documentation. On post-call days, the residents also had the highest average patient chart access per day of 274 times. This “electronic work burden” could also have negatively impacted on documentation quality. Significant to note, residents on the on-call days had a similar red checklist score than residents on mid-call days (68.1% vs 68.6%) despite having lesser patients (4 vs 7.2 patients D0 and D2, respectively). We believe this could be attributed to the additional clinical workload on the on-call residents compared to mid-call residents.
Residents were found to more likely use the physical examination findings from the previous day’s progress note and were less likely to update the impression of the tests being ordered. Residents did routinely update patient symptoms, succinct vitals, and include a problem-based assessment as part of their documentation.
In environments where increasing numbers of healthcare organizations are digitizing patient health data and enabling data sharing among healthcare providers and health researchers, it is critical to ensure that these data are of the highest quality. It is imperative that this training be imparted to medical residents to ensure these future clinicians continue to document with the highest accuracy. It is also essential to minimize fatigue among residents in training to ensure they are attuned to their patients’ needs and continue in the path of learning. Our study is the first such study to show the negative effect of resident’s workload on the quality of documentation. Prior research has shown effectiveness of some interventions like multipronged education, paper or electronic templates, and audit/feedback help in improving overall quality and accuracy of physician documentation. 14 We speculate that such measures along with reduction of patient workload during the early months of training, mitigation of documentation tasks on post call days to senior residents are needed to ensure residents are adequately trained in the usage of EMR. Nonetheless, additional studies validating its impact on resident training are necessary before it can be implemented in the real-world due to the potential of unintended negative consequences on residents’ learning owing to reduced patient exposure.
Our study has several limitations. Ours is a single center, retrospective study. We could not directly identify the effect of post-call fatigue and burn out on the quality of resident documentation although we believe post call fatigue owning to limited time off of 9 hours (10 PM to 7 AM) before the start of post call day had a significant implication on documentation quality. We were also not able to measure the effect of patient familiarity on the quality of resident documentation. 15 Although we indirectly measured access to patient charts, we could not directly measure time spent per patient chart by resident with respect to quality of documentation. Further prospective studies including the above suggested limitations in multiple centers are needed to validate our findings. The effect of such deficiencies in documentation on patient safety and litigations have to be further studied. The extension of our findings to residents on overnight shifts/extended shifts will be of further interest as well.
Conclusion
Quality of documentation by medical residents is significantly impacted by resident workload and call status of the resident. The lowest documentation quality was noted on post-call days and highest quality was noted on pre-call days. The documentation quality also had a negative correlation with number of patients per resident per day. Prospective, multi-center studies are needed to accurately determine the appropriate patient workload of residents on different days to ensure consistent quality in resident documentation as well as optimal training of residents without burnout.
Supplemental Material
sj-pdf-1-mde-10.1177_2382120520988597 – Supplemental material for Impact of Patient Load on the Quality of Electronic Medical Record Documentation
Supplemental material, sj-pdf-1-mde-10.1177_2382120520988597 for Impact of Patient Load on the Quality of Electronic Medical Record Documentation by Aasems Jacob, Rishi Raj, Sayee Alagusundaramoorthy, Jing Wei, Wu Jianrong and Margaret Eng in Journal of Medical Education and Curricular Development
Footnotes
Funding:
The author(s) received no financial support for the research, authorship, and/or publication of this article.
Declaration of conflicting interests:
The author(s) declared no potential conflicts of interest with respect to the research, authorship, and/or publication of this article.
Author Contributions
AJ, RR and SA were involved in the conceptualization, data curation and manuscript preparation. JWe and JWu were involved in statistical analysis. ME was involved in oversight and manuscript review.
Supplemental Material
Supplemental material for this article is available online.
References
Supplementary Material
Please find the following supplemental material available below.
For Open Access articles published under a Creative Commons License, all supplemental material carries the same license as the article it is associated with.
For non-Open Access articles published, all supplemental material carries a non-exclusive license, and permission requests for re-use of supplemental material or any part of supplemental material shall be sent directly to the copyright owner as specified in the copyright notice associated with the article.