
Abstract
Highlights
The risk of infectious disease transmission, including COVID-19, is disproportionately high in correctional facilities.
We used machine learning methods with data collected from 24 prison facilities in the Pennsylvania Department of Corrections to determine which sources of data best predict a coming COVID-19 outbreak in a prison facility.
Key predictors included county-level measures of COVID-19, facility population, and the test positivity rate in a facility.
Fortifying correctional facilities with the ability to monitor local community rates of infection (e.g., though improved interagency collaboration and data sharing) along with continued testing of incarcerated people and staff can help correctional facilities better predict—and respond to—future infectious disease outbreaks.
As of autumn 2023, COVID-19 had caused more than 1.1 million deaths in the United States. 1 The risk of COVID-19 and other infectious diseases is disproportionately high in correctional facilities due to close living conditions, relatively low levels of vaccination, and reduced access to testing and treatment, among other factors. Previous studies have quantified the risk of COVID-19 in terms of level of transmission, death rates, and intervention effectiveness. One study found that between April 2020 and January 2021, COVID-19 case rates were 2.8 times higher among prison staff than the general population and 3.1 times higher among the prison population than the general population. 2 Other work has found similar discrepancies in incidence and a death rate 2.5 times higher in prisons than in the general US population. 3
While much progress has been made in describing and mitigating COVID-19 disease risk in jails and prisons,4–6 and prison systems have adaptively made a variety of changes in response to outbreaks that have already occurred,7–9 there are open questions about which data can best predict outbreaks and why health outcomes differ between correctional facilities. Previous studies forecasting COVID-19 incident cases on a national level in several countries have used machine learning methods ranging from simple linear regression to deep learning models. 10 Models vary in their prediction accuracy, but many models focus on using time series data (e.g., past cases) and autoregressions to predict future cases, deaths, or hospitalizations.11–14
Future risk of COVID-19 infection or other infectious diseases, however, is not strictly limited to the current or previous number of infected individuals. Some research suggests that in correctional facilities, the correctional facility size, facility wastewater surveillance, correctional officer infection rates, and even community rates of infection affect transmission in the facility.15,16 A study of zip codes near Cook County Jail in Chicago found that jail-community cycling was the most important factor in predicting COVID-19 cases. 16
Previous work forecasting outbreaks among incarcerated populations has not used multilevel data, including facility data (e.g., prison size, demographics of incarcerated individuals) and county data (e.g., country deaths, hospitalizations, and incident cases). In this article, we use comprehensive individual-level, facility-level, and community-level data collected from a state prison system to determine which data elements best predict a coming COVID-19 outbreak in a prison facility. We hypothesized that community-level data would be important to predicting outbreaks within correctional facilities. This analysis adds important insights for local and state public health agencies and correctional administrators on how best to allocate resources to collect data and harness available elements to forecast an upcoming outbreak. Although we focus on COVID-19, our methodology and qualitative conclusions are applicable to other infectious diseases of an epidemic nature.
Methods
Setting
We used data collected by the Pennsylvania Department of Corrections and publicly available data from the Pennsylvania Department of Health from March 2020 to May 2021 to build our prediction models. The Pennsylvania Department of Corrections houses incarcerated individuals in 24 facilities across the state in both rural and urban areas. Throughout the pandemic, the Department of Corrections collected detailed individual-level data on COVID-19 tests, results, and vaccination status as well as facility-level data on wastewater COVID-19 surveillance testing, facility layout, population demographics, COVID-19 outcomes, and comorbidities of incarcerated residents.
Data
We used different types of data to perform the clustering and prediction tasks. For the clustering task, we used descriptive data composed of 1) facility data, including the number of housing zones, security level, bed utilization, total facility footprint (square footage), and number of buildings; 2) demographic data, including population custody level mix (custody levels include community, minimum, medium, close, and maximum), total population, average age, variance of age, average racial and ethnic mix, average fraction with chronic conditions, and percentage of staff who live outside of the county in which they work; 3) facility COVID-19 data, including vaccine uptake after 90 d, number of incarcerated people vaccinated in the first 30 d after vaccine availability, wastewater testing frequency, average daily incident cases, largest single-day incident cases, and number of deaths; and 4) county COVID-19 data, including average vaccinations per day in the first 30 and 90 d of vaccine availability, average daily incident cases, largest single-day incident cases, average daily hospitalizations, average daily deaths, and largest single-day deaths.
For the prediction model, we used time series demographic data including facility population categorized by age, race, number of correctional staff, and number of people who are incarcerated; facility COVID-19 data including cumulative cases in the last 3, 7, 14, and 21 d; incident cases in the last 0 to 35 d (with cases separated into total, staff, incarcerated, vaccinated, and unvaccinated populations); number of tests administered in the last 0 to 35 d; test positivity in the last 0 to 35 d; days since the most recent wastewater test; number of wastewater tests in the last 14 d; number of wastewater detections in the last 14 d; and county COVID-19 data including county cases, deaths, hospitalizations, and vaccinations in the last 0 to 35 d. These features capture the range of individual-level and facility-level data provided to us by the Pennsylvania Department of Corrections and community-level data available from the Department of Health and include features to explore autoregressions that forecasted well in previous work.11–14
We divided the prediction data into pre- and postvaccination data sets. The first day of the postvaccination data set corresponds to the day of the first recorded vaccination of any person living or working in a prison facility. Therefore, the pre- and postvaccination data set sizes vary slightly by facility.
Each of the data sets (clustering, prediction prevaccination, and prediction postvaccination) has features with different measurement units. To make the features comparable, we scaled them using z-score standardization. The z-score of each data point,
Facility Clustering
After splitting the data into pre- and postvaccination periods, the number of observations in each training set was too low to generate accurate predictions. For example, for the Coal Township facility, there were 141 observations prevaccination and 360 observations postvaccination. Therefore, we expanded the number of observations in the training data by clustering similar facilities. We first determined the number of clusters to use. We evaluated the sum of squared distances of prisons to their closest cluster center for 1 to 24 clusters (Figure 1). Using the “elbow” method, 17 we visually identified the lowest number of clusters for which the rate of decline in the sum of squared distances decreases substantially and determined this to be 8 clusters. By using 8 clusters, we expand the size of the training and test set for each cluster while keeping cluster sizes small enough to keep results tailored to very similar types of institutions. We then used the k-means algorithm via the sklearn library in Python 18 to group the 24 prison facilities into 8 clusters. We used random initial seeding of the cluster centroids and tested 10 different initial seeding positions.
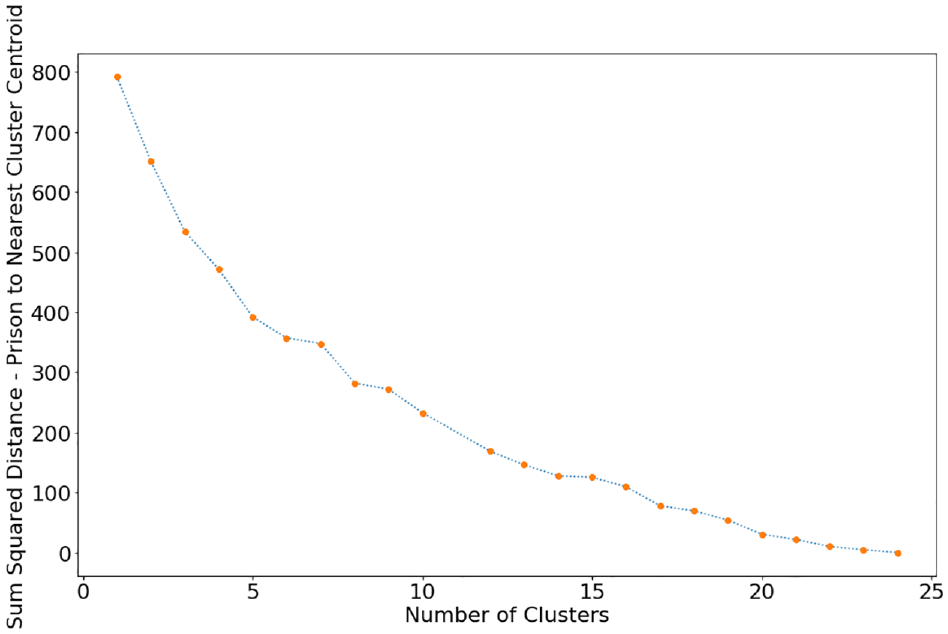
Sum of squared distances of prisons to their nearest cluster centroid for 1 to 24 clusters.
Sensitivity Analysis
We also analyzed the effect of cluster size on prediction model performance. To do so, we performed the same analysis with 4 clusters instead of 8.
Outbreak Prediction Model
We used the clustered facility data in the machine learning prediction model. The goal of the prediction task is to determine which features best predict an impending outbreak. We investigated prediction accuracy for a variety of outbreak sizes and prediction windows. Specifically, we developed several logistic regression classification models to predict for each cluster, pre- and postvaccination, whether there would be no cases, an outbreak with 2 or more cases, or a large outbreak with 10 or more cases in the next 1, 2, and 3 d; thus, for each cluster, we trained 18 different logistic regressions. Logistic regression was used because it is a type of regression that estimates the probability of a binary event occurring. 18
As a first step, we split the data into training and test sets. The training set is the first 80% of days in the overall data set, and the test set is the remaining 20%. We filtered out some features using the index of dispersion,
Then, we used feed-forward selection 18 to identify the 4 most predictive features of a given outbreak scenario. To do so, we trained the logistic regression model using only 1 feature at a time and recorded the accuracy of the predictions compared with the test set for each feature in the data set. The feature with the highest accuracy on its own is the best feature. We then trained the logistic regression model using the best feature combined with one other feature at a time and recorded the accuracy of the predictions compared with the test set for each remaining feature in the data set. The feature with the highest accuracy when paired with the best feature is the second-best feature. We repeated this process twice more to find the feature that had the highest accuracy when paired with the best- and second-best-performing features and then with the best, second-best, and third-best-performing features. The result of the feed-forward feature selection is the 4 most predictive features for each of the 18 logistic regressions for each cluster.
Results
Facility Clustering
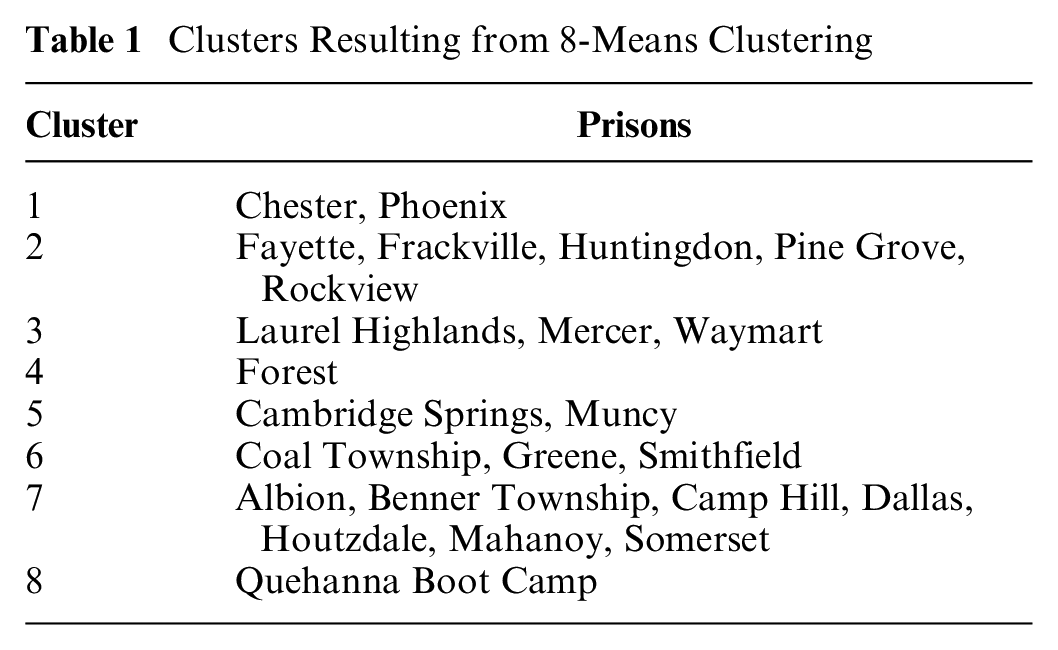
The 8 clusters consisted of varying numbers of prisons (Table 1). Several features stood out as delineating the clusters. Clusters 5 and 8 are women’s prison facilities. Cluster 8 (Quehanna Boot Camp) has the highest proportion of individuals at the community custody level, which was the lowest level of carceral control at around 10% of the population compared with 0% to 1% in other clusters (Supplementary Figure S1). This facility is unlike the other prison facilities in that it is designed as a military-style boot camp. Prisons in cluster 1 have a higher Hispanic population than any other cluster (Supplementary Figure S2) and also have the highest average county daily incident cases, hospitalizations, and deaths (Supplementary Figures S3–S5). Both cluster 1 prisons are close to a major urban area, possibly explaining the demographic difference. Clusters 6 and 8 have low vaccination uptakes in the first 90 d after vaccine availability, while clusters 4 and 7 have high vaccination uptakes (Supplementary Figure S6). Clusters 4 and 5 had the largest single-day COVID-19 outbreaks (incident cases; Supplementary Figure S7).
Clusters Resulting from 8-Means Clustering
For visualization purposes, we used principal component analysis to reduce the 33-dimensional feature space to 2 dimensions. Since k-means clustering is based on Euclidean distance, this visualization gives an approximate 2-dimensional visualization of the results (Supplementary Figure S8). Clusters 2 and 7 and clusters 3 and 5 are similarly located on the 2-dimensional plane, meaning that those clusters are more similar to each other than other clusters are. Clusters 1, 4, and 8 are further in Euclidean distance on the principal component plane.
Outbreak Prediction Model
We trained logistic regressions only for data sets in which there was at least 1 d in which an outbreak was detected and at least 1 d in which no outbreak was detected. In total, we trained 60 different logistic regressions: 12 for cluster 6; 9 each for clusters 1, 2, 3, 5, and 7; and 3 for cluster 4. Of the 60 regressions, 52 were trained on prevaccination data and 8 on postvaccination data. The accuracy of the model on the test set varied from 39% to 99%, the area under the receiver operating characteristic curve (AUC) varied from 0.17 to 0.82 in the test set and from 0.54 to 0.98 in the training set, and the percentage of positive labels (that is, an indication of whether an outbreak of a given size will occur on a given day) in the test set varied from 0% to 89% (Figure 2). Generally, when the classification model was predicting whether there would be 10 or more cases, accuracy was highest, but a large majority of the labels in the test set data were negative; in other words, there were very few days with 10 or more cases per cluster. The models with higher accuracy were those with the highest class imbalance; that is, they had close to all true or all false outcomes, and therefore, the model could easily predict just true or just false for every instance and still have high accuracy. About half of the models had an AUC between 0.50 and 0.65.

Graph of logistic regression accuracy compared with the percentage of positive labels in the test set.
We next limited the results to logistic regressions in which the test set data had between 35% and 65% positive labels, where a positive label signifies the occurrence of an outbreak. Class imbalance (that is, an unequal fraction of cases with positive v. negative labels) was common because the occurrence of an outbreak in the data was typically of low frequency. The resulting balanced test sets can provide a more reliable picture of model performance because they have large samples of both days with and without outbreaks. The subset of test sets that fit this description limited the results to 20 different logistic regressions: 5 regressions from cluster 3, 4 each from clusters 5 and 7, 3 each from clusters 1 and 2, and 1 from cluster 4. Clusters 6 and 8 did not have any balanced test sets. All of the balanced test sets were prevaccination. The accuracy of the logistic regression models on the test set ranged from 45% to 63% (Figure 3), and the AUC ranged from 0.42 to 0.66 on the test set and 0.59 to 0.96 on the training set.

Graph of logistic regression accuracy compared with the percentage of positive labels in the balanced test sets where there are 35% to 65% positive labels.
To draw conclusions about important features, we further limited the regression results to those models that achieved at least 55% accuracy on a balanced test set. There were 9 such logistic regressions, and all were prevaccination (Table 2). From cluster 3, the best-performing logistic regression, with 63% accuracy and AUC 0.55, was that of predicting whether there would be 10 or more cases in the next 3 d, followed by predicting whether there would be 2 or more cases in the next day with 56% accuracy and AUC 0.48. From cluster 5, the best-performing logistic regression was that of predicting whether there would be no cases in the next day (62% accuracy, AUC 0.65), followed by predicting whether there would be 2 or more cases in the next 2 d (55% accuracy, AUC 0.59). From cluster 1, the best-performing logistic regression was that of predicting whether there would be 2 or more cases in the next 3 d (60% accuracy, AUC 0.57), followed by predicting whether there would be no cases in the next day (58% accuracy, AUC 0.51). From cluster 7, the best-performing logistic regression was that of predicting whether there would be 10 or more cases in the next 3 d (59% accuracy, AUC 0.45), followed by predicting whether there would be 2 or more cases in the next day (57% accuracy, AUC 0.57). Lastly, from cluster 2, the best-performing logistic regression was that of predicting whether there would be no cases in the next day (55% accuracy, AUC 0.53).
Most Predictive Features in Logistic Regressions with High Accuracy on a Balanced Test Set

No strong pattern was observed for prediction accuracy as a function of prediction window or outbreak size (Table 2). Four of the 9 most accurate regressions were for predicting an outbreak of 2 or more cases, 3 were for predicting no cases, and 2 were for predicting an outbreak of 10 or more cases. Five of the regressions had a 1-d prediction window, 1 regression had a 2-d prediction window, and 3 regressions had a 3-d prediction window.
Using the feed-forward feature selection method, we identified 36 of the most predictive features in total for the 9 logistic regression models with high accuracy on the balanced test sets (Table 2). The most common predictive feature (constituting 11 of the 36 most predictive features) was incident cases among the total population from 3 to 32 d prior. However, it was never the most important feature in any of the 9 models. The second most common predictive features (each constituting 5 of the 36 most predictive features) were the number of tests from 4 to 33 d prior and test positivity from 13 to 28 d prior. Other features include incident cases in the incarcerated population (4 of 36), county deaths (4 of 36), population size (3 of 36), county incident cases (2 of 36), county hospitalizations (1 of 36), and county vaccinations (1 of 36). Despite the feed-forward feature selection method, the absolute value of the coefficients of the top 4 features of each model did not always align with the order in which they were chosen by the algorithm. The first feature selected had the highest coefficient absolute value in only 4 of the 9 models.
Sensitivity Analysis
We reran the analyses using 4 facility clusters instead of 8. The 4 clusters of corrections facilities were of similar size except for cluster 3, which included only the Phoenix facility (Supplementary Table S1). There were a total of 44 different models; of these, 12 had test set data with between 35% and 65% positive labels, and 8 had an accuracy greater than 55%. The accuracy of the 8 logistic regressions ranged from 56% to 68%, and the AUC ranged from 0.53 to 0.71 on the test set and 0.60 to 0.84 on the training set (Supplementary Table S2). The most common predictive feature (constituting 9 of the 32 most predictive features) was test positivity from 2 to 34 d prior. The second most common predictive feature (constituting 6 of the 32 most predictive features) was the number of tests administered from 2 to 30 d prior. Other features include county deaths (5 of 32), incident cases among the incarcerated population from 16 to 34 d prior (4 of 32), incident cases among the total prison population (incarcerated and staff) from 0 to 5 d prior (3 of 32), county hospitalizations (3 of 32), and total prison population (2 of 32). These features were similar to those of the base-case scenario with 8 clusters and again highlight the importance of considering county-level data in predicting outbreaks.
Discussion
We identified predictors of COVID-19 outbreaks in prison facilities using machine learning. Not surprisingly, important features identified in this analysis were number of tests carried out in a facility and incident cases, suggesting that investment in case surveillance is important. This is consistent with previous modeling efforts that focused on forecasting COVID-19 using the case counts from prior days.11–14 Intuitively, one would expect past incident cases and testing levels to correlate with future reported incident cases. In the Pennsylvania Department of Corrections, mass testing began early on during the outbreak in almost every facility, enabling daily identification of asymptomatic and symptomatic people. These findings suggest that as COVID-19 continues to spread in correctional facilities, it is important for state governments to invest in surveillance activities and to continue testing, vaccination, and other preventive measures.
County deaths, hospitalizations, and cases were also important predictors, further highlighting a link between community and facility COVID-19 spread. These predictors were most important in clusters 1, 2, and 3, which include prisons in rural areas. Prior work has found a similar link via correlations in COVID-19 cases among prison staff 19 and spikes in prison COVID-19 cases following a spike in community COVID-19 cases. 20 Fortifying relationships and data sharing between correctional facilities and public health management teams in surrounding communities may help better manage community spread of infection through correctional facilities. When community cases of infection grow, these may be early signs to implement stricter employee testing and visitation restrictions within correctional facilities. 21 Future research should also be conducted on the corollary of when best to ease these restrictions.
Facility-level characteristics, such as cumulative cases, vaccination rates, wastewater surveillance, and incarcerated populations broken out by race and ethnicity or by age, were not found to be predictive. This could be due in part to facility clustering, in which the clusters have similar facility-level features but the added noise in each feature prevents strong predictive relationships from appearing. It is also plausible that since policies were evenly implemented across facilities in Pennsylvania, the model did not identify any facility-level or individual-level characteristics as predictive of outbreaks, as has been the case in other state prison systems. 15
Our results are limited by the fact that the only test sets that had a balance of days with an outbreak and days without an outbreak were in the prevaccination period; outbreaks were less common in the postvaccination period data that we had. With additional data postvaccination, it is possible there would be more diversity in the test sets, as the sample size of the test set would be larger. Another way to increase the number of observations is to increase the size of the clusters. However, as cluster size increases, applicability of the results to individual facilities may diminish. That said, the recent rise in cases and decrease in vaccine effectiveness among vaccinated populations with variants such as omicron 22 may mean our results may still be applicable as immunity wanes and certainly for future pandemics without effective vaccines. This is more likely to be true of predicting cases than deaths or hospitalizations, as newer variants have been associated with lower disease severity. 23 Beyond COVID-19, the approach outlined in this article is applicable for determining the importance of predictive features for other infectious disease outbreaks even when few data are available. Our analysis shows that logistic regression is an interpretable and effective machine learning approach for predicting infectious disease outbreaks in a prison setting and that, for large-scale infectious disease outbreaks, it is important to consider community spread as a potential predictive feature.
Other data limitations likely affect the conclusions of this work. It is likely that there are inconsistent data collection methods between facilities. For example, wastewater testing occurred at different intervals for different facilities, so data may have been collected nonuniformly throughout the state. In addition, there could be inaccuracies in the recorded data, such as overreporting, underreporting, or reporting delays. Notably, few deaths and hospitalizations were reported in the data. Moreover, much of the staff COVID-19 data on incident cases and vaccination were self-reported. Our methodological approach also has some important limitations. Logistic regression assumes that observations are independent, which may not be true in our context as outbreaks from one day could carry over into outbreaks on another day. Similarly, logistic regression assumes no multicollinearity among features, but increases in testing could lead to increases in reported cases, for example. Other assumptions of logistic regression that are not as strong in our context include no extreme outlier observations and a linear relationship between features and the logistic prediction of whether an outbreak occurs. Given the dynamic nature of the COVID-19 outbreak and the population demographics within the prison, it is possible that underlying distributions differ between test and training sets, which could explain low AUC values in the test set. Finally, if the test set is unbalanced, imbalance correction could lead to biased predictions when used with logistic regression. 24
This article attempts to understand what data can help a prison system predict an impending COVID-19 outbreak. Our method, while not especially accurate with the data we were able to obtain, could be useful when there are sufficient data to train an accurate logistic regression. Logistic regression is an ideal approach given its interpretability and predictive ability even when data are not abundant. Furthermore, despite limitations in our sample size and especially the number of facilities, our method provides insights into some predictors of an impending COVID-19 outbreak and the relevance of testing and also tracking community rates of infection. This is valuable when correctional facilities must make budget-constrained and labor-constrained decisions about data collection and analysis. While autoregression models have been used to predict COVID-19, our analysis suggests that augmenting such models with community-level infection data can improve predictive accuracy.
Existing public health structures do not adequately facilitate collaboration between correctional facilities and across other government and health care sectors that enable the real-time analysis of data and predictive analytics. Analysis of existing linkages between states’ departments of health and departments of corrections revealed that only 9 states had a comprehensive working relationship between corrections and health departments during the peak of COVID-19. 25 Because of high rates of churn of individuals through correctional systems, higher transmission dynamics, especially for respiratory infections due to poor ventilation and older buildings, and organizational challenges in large correctional systems that require significant coordination between health and security staff, prediction models that provide any opportunity to mobilize limited resources in these settings allow correctional systems to respond to infection proactively, before large outbreaks. In addition, prediction models that use local facility and community data may provide more flexibility in COVID-19 policies that are facility specific and enable the opening (resumption of recreation, visitation, etc.) and closing of facilities, as opposed to statewide correctional system policies.
Our analysis suggests that correctional facilities should monitor and use data on community infection to predict—and thus better respond to—outbreaks in their facilities. These efforts should not be limited to COVID-19 but should include any large-scale infectious disease outbreak that may involve institution-community transmission. This represents an opportunity for impactful state government interagency collaboration and data sharing. Fortifying correctional facilities with the ability to monitor local community rates of infection and also continue to test incarcerated people and staff can help correctional facilities better prepare for future infectious disease outbreaks.
Supplemental Material
sj-docx-1-mpp-10.1177_23814683231222469 – Supplemental material for Predicting COVID-19 Outbreaks in Correctional Facilities Using Machine Learning
Supplemental material, sj-docx-1-mpp-10.1177_23814683231222469 for Predicting COVID-19 Outbreaks in Correctional Facilities Using Machine Learning by Giovanni S. P. Malloy, Lisa B. Puglisi, Kristofer B. Bucklen, Tyler D. Harvey, Emily A. Wang and Margaret L. Brandeau in MDM Policy & Practice
Footnotes
The authors declared no potential conflicts of interest with respect to the research, authorship, and/or publication of this article. The authors disclosed receipt of the following financial support for the research, authorship, and/or publication of this article: This work was funded by an NIH RADx Award, grant 3UG1DA050072-02S3. MB was partially supported by grant R37-DA15612 from the National Institute on Drug Abuse.
References
Supplementary Material
Please find the following supplemental material available below.
For Open Access articles published under a Creative Commons License, all supplemental material carries the same license as the article it is associated with.
For non-Open Access articles published, all supplemental material carries a non-exclusive license, and permission requests for re-use of supplemental material or any part of supplemental material shall be sent directly to the copyright owner as specified in the copyright notice associated with the article.