
Abstract
Keywords
Introduction
Several contracts between payers and drug manufacturers have emerged in efforts to manage the costs and/or uncertainties associated with introducing new drugs to formularies.1–4 These contracts are used in several countries.3–10 The contractual mechanisms include simple price reductions, price-volume agreements, and complex value-based schemes, as well as contracts involving dose caps or trial periods. There is a broad terminology used to discuss these contracts including risk sharing agreements, product listing agreements, patient access schemes, value-based pricing, outcomes-based contracting, managed entry agreements, and risk sharing agreements, with terminology varying by the structure of the agreements (e.g., financial v. outcomes-based contracts) and geography. Although terminology varies, we use the term “risk sharing agreement” (RSA), consistent with recent literature. 1
Despite the widespread use of RSAs, one study of RSAs in the United Kingdom found that “there was no consensus over which of the schemes was best,” 11 and a survey of RSAs used in Asian countries “did not identify which strategies are most effective in promoting cost containment and/or greater access.” 5 The large number of RSAs in existence, along with the variations in their structure and use, lead to questions about the relative advantages of each type. In particular, it would be useful for payers and formulary managers to know whether there are situations that call for the use of one type of RSA instead of another, and what tradeoffs are involved in choosing each contract. However, there are very few empirical studies that demonstrate the impact of RSAs.8,10,12–14 There are practical challenges to conducting empirical research in this area as specific contract details are often confidential,3,9,15–18 and there is typically only one agreement in place in any jurisdiction for a specific drug/payer combination, which limits the ability to conduct direct comparisons. We are not aware of any empirical studies that involve direct comparisons of RSAs.
The literature contains several mathematical models of RSAs. 1 Two simulation models were used to estimate the impact of RSAs in which the manufacturer of a biologic used in the treatment of rheumatoid arthritis would rebate the payer for the cost of first-line treatment for patients who discontinued treatment within 3 months of treatment initiation.19,20 Three studies investigate the impact of price-volume agreements and outcomes-based RSAs on the incentives of either the manufacturer or the payer.21–23 Mahjoub et al. investigated the impact of the time to evaluate clinical response on a manufacturer’s profit in an outcomes-based RSA. 21 Zaric and O’Brien investigated whether implementing a price-volume agreement leads to more accurate budget impact forecasts from manufacturers. 22 Gavious et al. 23 investigated a setting where the manufacturer and payer simultaneously provide a volume estimate, and the risk sharing mechanism involves payments from the manufacturer to the payer as well as payment from the payer to the government. There are several game-theoretic models of RSAs.14,18,24–27 Zhang et al. 28 develop a game-theoretic model to investigate the optimal design of a price-volume agreement when there is asymmetric information about market size, and Levaggi and Pertile 29 investigate value-based pricing in the presence of asymmetric information about the benefit of new drugs.
We are aware of three studies that directly compare different types of RSAs. Zaric and Xie develop two two-period models, one of an outcomes-based RSA and the second of a delisting arrangement. 30 Levaggi 31 compares an uncertain “listing process” with a value-based RSA, and Critchley and Zaric 32 extend Levaggi’s analysis 31 to include promotional effort by the manufacturer.
Prior mathematical models of RSAs do not consider the importance of variability in outcomes—the models described above evaluate expected outcomes of RSAs but do not consider variability. However, tradeoffs between expected return and risk have long been recognized as important in finance 33 and other fields. Thus, in this article we develop a common modeling framework that can be used to compare outcomes for several different types of RSAs when market size, benefit per patient, and cost per patient are all uncertain. We use the model to evaluate the impact of six different RSAs on the mean and variance of total drug costs, the mean and variance of net monetary benefits (NMB), the probability that drug costs exceed an arbitrary threshold, and the probability of negative NMB. These results are important to several entities directly involved in or effected by formulary decisions and RSA negotiations, including payers, formulary managers, and manufacturers.
From a technical standpoint, our model has two novel features. First, our model makes use of compound random variables, 34 which are often used to model total claim size in insurance and risk analysis applications, 35 but to our knowledge, have not previously been used to examine the impact of RSAs. Second, our model explicitly considers risk and variability in RSA outcomes and thus addresses an important gap in the literature.
Modeling Risk Sharing Agreements
In this section, we introduce a model of spending and health benefits following the introduction of the new drug. We introduce six special cases of the model, which allow us to evaluate drug spending and NMB under commonly used RSAs. Notation is summarized in Table 1. Let
Summary of Notation
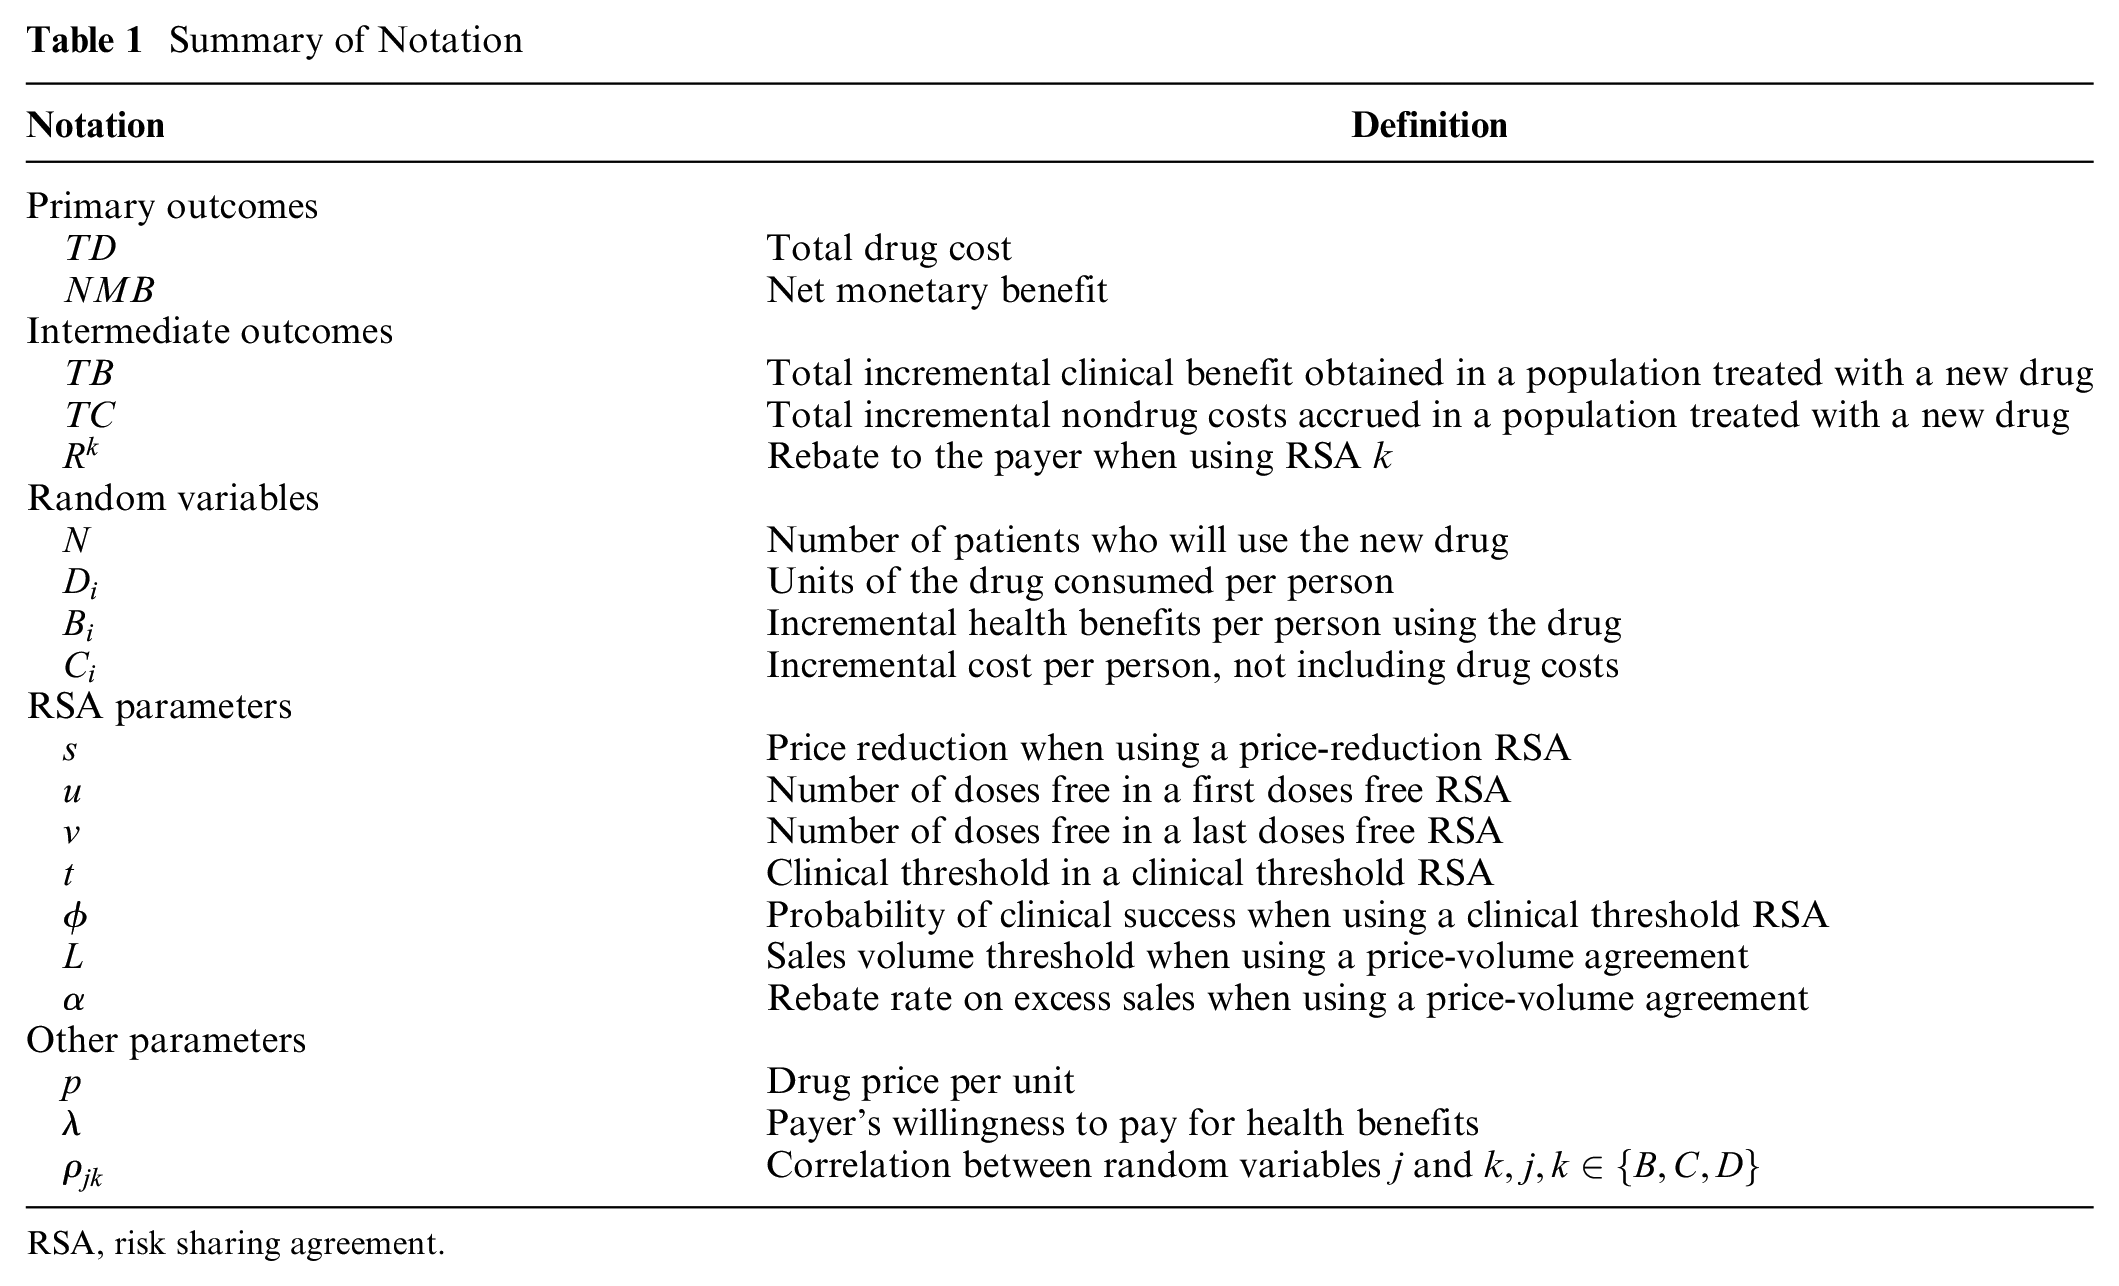
RSA, risk sharing agreement.
At the time that a new drug is introduced to a formulary the number of patients and the amount of drug consumed per person are unknown. Let
Let

We use this framework to model costs, benefits, and NMB for two reasons:
This framework allows us to model uncertainty in the size of the patient population for a new drug; the drug consumption per person; and the actual benefits experienced per person. Uncertainty in these quantities has been noted among the reasons for implementing RSAs37–39 or implied by the structure of some RSA contracts (e.g., uncertainty in clinical success for bortezomib
40
). In addition, this allows us to represent total drug cost (
It provides a common, flexible method to estimate the impact of RSAs in which differences in outcomes between RSA contracts are due to contract parameters rather than realizations of random variables.
We model six different RSAs. Examples of each are described elsewhere. 4
Price reduction: There is a price reduction of
First doses free: There is no payment for the first

and the total drug cost becomes
Last doses free: The payer pays the full price for the first

and the total drug cost becomes
Clinical threshold RSA: If the benefit for a patient is less than a threshold

and let
Price-volume agreement (PVA): If total drug sales volume exceeds a rebate level

This can be rewritten as
Cost-effectiveness RSA: If
In each case,
We analyze the performance of each RSA with respect to six outcomes: expected total drug cost; variance in total drug costs; probability that total drug costs exceed any given threshold; expected NMB; variance in NMB; and probability that NMB is positive.
Before analyzing the impact of these RSAs we formally state five assumptions:
Assumption 1 means that we only consider drugs that would be cost-effective if they were free. If this were not true, then there is no way that the drug could be made cost-effective through any of the RSA contracts examined in this article. Assumption 2 states that the RSA mechanism does not have an impact on the number of individuals who use the drug. This is reasonable if the drug treats a limited and very clearly defined condition, or if there are no competitors. We relax this assumption in a later section where we investigate whether RSAs change the incentives for promotion. Assumption 3 states that the RSA mechanism does not have any impact on the distributions of the incremental benefit of the drug, the nondrug costs among individuals who use the drug, and the amount of drug consumer per person. This is reasonable if dosing and drug usage guidelines are exogenous and based on clinical guidelines and not affected by the existence of an RSA. Assumption 4 is consistent with discussions of mean-variance tradeoffs in finance, 33 and the results from a survey of payer and manufacturer representatives from the United States and the European Union. 16 Assumption 5 is made to simplify the formal proofs.
Impact of RSAs on Drug Costs and Total Net Monetary Benefits
In this section, we examine the impact of each of the six RSAs defined in the previous section.
Mean, Variance, and Distribution of Total Drug Costs
We first analyze the impact of the RSAs on total drug cost. We focus on mean and variance of total drug costs because two objectives of RSAs are reduced costs and reduced uncertainty in costs. In Proposition 1, we state the impact of each RSA on drug costs compared to a scenario with no RSA in place. All formal proposition statements and proofs are shown in the supplemental appendix.
i. The expected total drug cost is reduced by each RSA.
ii. Variance in total drug costs may increase or decrease using a cost-effectiveness RSA or a clinical threshold RSA. For all other RSAs the variance in total drug costs is reduced.
iii. The probability that drug costs exceed any given threshold is reduced by each RSA.
The three properties discussed in Proposition 1 are desirable to payers and formulary managers in that they can help reduce costs (part i), make costs more predictable (part ii), and reduce the likelihood of exceeding a fixed budget (part iii). Conditional on a drug being listed, all six RSAs reduce total expected drug costs and reduce the probability that drug costs exceed some threshold. Of note, the price-reduction RSA, which should be the simplest to implement, leads to both a reduction in drug costs and a reduction in the variability in drug costs relative to not having an RSA in place.
A potentially unexpected result in Proposition 1 is that variance in drug costs may actually increase when using a cost-effectiveness RSA or a clinical threshold RSA. In both cases this happens because the variance in costs depends on other random variables. In the case of a cost-effectiveness RSA, the variance in total drug costs also depends on the health benefits, nondrug costs, and the WTP threshold, all of which contribute to total drug cost through the rebate term. For the intuition, consider the case when
In Proposition 2, we state that there can be multiple ways to structure RSAs to have the same expected costs.
i. RSA parameter values can always be found such that a price reduction, first doses free, last doses free, clinical threshold, and PVA have the same expected total drug costs.
ii. If the expected total drug cost in a cost-effectiveness RSA is positive, then RSA parameter values can be found to set the expected total drug costs equal to any of the other RSAs.
This result is important for two reasons. First, it allows a formulary manager who is only interested expected total drug costs the flexibility to choose any of the six RSAs studied in this paper and achieve equivalent results. Second, it allows for “fair” comparisons between RSAs when there are multiple objectives (such as the mean and variance in total drug costs). If Proposition 2 did not hold, then comparisons among RSAs would need to consider the preferences of decision makers over multiple outcomes (e.g., by specifying a utility function). Thus, Proposition 2 is the basis to interpret the next result.
In Proposition 3, we formally state that some RSAs with equivalent expected total drug costs can be rank-ordered in terms of their effect on variance in drug costs.
Suppose that RSA parameters have been chosen so that the expected total drug costs are the same with a price reduction, first doses free, last doses free, and clinical threshold RSA. Then the variance in total drug costs can be ranked. In particular, a last doses free RSA always has the lowest variance in total drug costs, and a price reduction RSA always has the second lowest variance in total drug costs. If drug consumption per person and incremental benefits obtained per person are independent, then a clinical threshold RSA has the highest variance in total drug costs in this group.
Proposition 3 says that when

When
This ranking in variance should be important to payers and formulary managers because two objectives of RSAs are reduced costs and reduced uncertainty in costs—consistent with Assumption 4 and portfolio theory. 33 If these are the only two criteria that formulary managers care about, then there is no reason to choose an RSA with relatively high variance in total drug costs rather than an RSA with relatively lower variance in total drug costs. A formulary manager who chose a high-variability option would need to have criteria other than total expected drug costs and variability in total drug costs. For example, the ranking in (2) suggests that a last doses free RSA dominates a price reduction RSA in terms of the impact on expected costs and variability in costs. However, ease of implementation might justify a preference for a price reduction over a last doses free RSA.
Mean, Variance, and Distribution of NMB
In this section, we analyze the impact of the six RSAs on NMB. The results mirror those presented in the previous section. In Proposition 4, we state the impact of each RSA on NMB compared to a scenario with no RSA in place. These results may be of interest in settings where cost-effectiveness is formally considered as part of the formulary approval process (e.g., public drug plans in Canada).
i. The expected NMB increases under each RSA.
ii. The variance in NMB is reduced for a cost-effectiveness RSA, and may increase or decrease for all other types of RSAs.
iii. Each RSA reduces the probability of experiencing negative NMB.
As with expected costs, all six RSAs have two desired effects on NMB: they all lead to an increase in expected NMB and they all reduce the probability of experiencing negative NMB. As in Proposition 1, there is a counterintuitive result regarding variability in NMB. For five of the six RSAs considered, implementing an RSA can increase the variability in NMB relative to not having an RSA in place. Thus, an RSA that reduces costs and reduces uncertainty in costs can increase uncertainty in NMB.
In Proposition 5, we formally state that RSA parameters can always be found so that the RSAs have equivalent expected NMB, and in Proposition 6, we state that the variance in NMB can be ranked for some RSAs.
RSA parameter values can always be found so that the expected NMB is the same for any pair of RSA contracts among those studied in this paper.
Suppose that RSA parameters are such that the expected NMB is the same using a price reduction, first doses free or last doses free RSA. If the drug cost per person is independent of the health benefits and the nondrug costs per person, then the variance in total drug costs can be ranked. In particular, a last doses free RSA has the lowest variance in NMB, a price reduction has the second lowest variance, and a first doses free RSA has the greatest variance.
Mathematically, the result of Proposition 6 is

The implications of Proposition 6 are similar to Proposition 3: If a formulary manager cares about expected NMB and variability in NMB, then it is unclear why they would choose an RSA that results in high variability in NMB (i.e., a first doses free RSA) when they could choose one that results in the same expected NMB and lower variability in NMB. As is the case with total drug costs, the last doses free RSA dominates the price reduction RSA, but ease of implementation may justify a preference for a price reduction RSA. We note that the ordering of the first doses free, last doses free, and price reduction is the same for total drug costs (2) as it is for NMB (3). Thus, a decision maker who is only considering these three RSAs and who is only concerned with the mean and variance of total drug costs and NMB should always weakly prefer a price reduction RSA versus a first doses free RSA, and should always weakly prefer a last doses free RSA versus a price reduction RSA.
Examples
We illustrate with several examples. Our base case parameters (Table 2) are based on introducing pomalidomide plus dexamethasone for the treatment of relapsed and/or refractory multiple myeloma
41
to a small patient population, such as a Canadian province. Multiple myeloma represents approximately 1.5% of all new cancer cases in Canada.
42
In 2020, there are expected to be 3400 total new cases in Canada,
43
and in 2017 there were approximately 1210 cases in Canada’s largest province.
44
As there are multiple treatments for this indication,
45
it is not expected that all patients would receive pomalidomide. The examples are intended to be illustrative: the objective of this section is to highlight the differences among the RSAs and to illustrate the results of the previous sections, not to make a specific prediction. We use the standard deviation as the measure of variability in our examples so that variability is expressed in the same units as the mean. Let
Base Case Parameter Estimates for Numerical Examples a

NMB, net monetary benefit; QALY, quality-adjusted life year; RSA, risk sharing agreement.
Parameter values of D, B, and C are the result of several intermediate calculations. Rounded values are shown in the table.
Figure 1a shows the values of

Parameter values for which RSAs have the same expected total drug costs. (a) RSA parameters for which a first doses free RSA and a last doses free RSA have the same expected total drug costs as a price reduction RSA. (b) RSA parameters in which a PVA has the same expected total drug costs as a price reduction RSA. Three lines are shown corresponding to rebate levels of L = Q = μDμN, L = 0.75Q, and L = 0.5Q.
Proposition 5 states that we can find RSA parameter values to yield the same expected total NMB. In Table 3, we show combinations of parameters required to achieve
RSA Parameters to Achieve

RSA, risk sharing agreement; WTP, willingness to pay.
For each case where the drug would not be cost-effective, the RSA parameters are set so that the expected cost of the drug is reduced enough to make the drug cost-effective with the given RSA.
“No RSA Needed” is indicated if
In the previous sections, we stated that the impact of the RSA contracts on variability in total drug cost and NMB could be mixed. In the remaining examples, we illustrate this finding by examining the ratio of the standard deviation in a given outcome (total drug cost or NMB) when an RSA is in place to the standard deviation when an RSA is not in place. Let
In Figure 2a, we show

(a) fTDk for price reduction, first doses free, last doses free, clinical threshold, and cost-effectiveness RSA as a function of the price reduction (s). Parameters of the first doses free, last doses free, and clinical threshold RSAs are adjusted so that they all have the same expected total drug costs as a price reduction RSA for each level of price reduction. (b) fTDk for a PVA and cost effectiveness RSA as a function of the rebate rate (α). For the PVA, three lines are shown corresponding to rebate levels of L = 1.1Q, L = Q, and L = 0.75Q.
In this example, the cost-effectiveness RSA yields approximately a two thirds reduction in the standard deviation in total drug costs. The line is flat (
In Figure 2b, we show
In Proposition 1, we stated that variability in drug costs could increase when using either a clinical threshold RSA or a cost-effectiveness RSA. In Figure 3a, we show the impact of a clinical-threshold RSA on variability in total drug costs (i.e.,
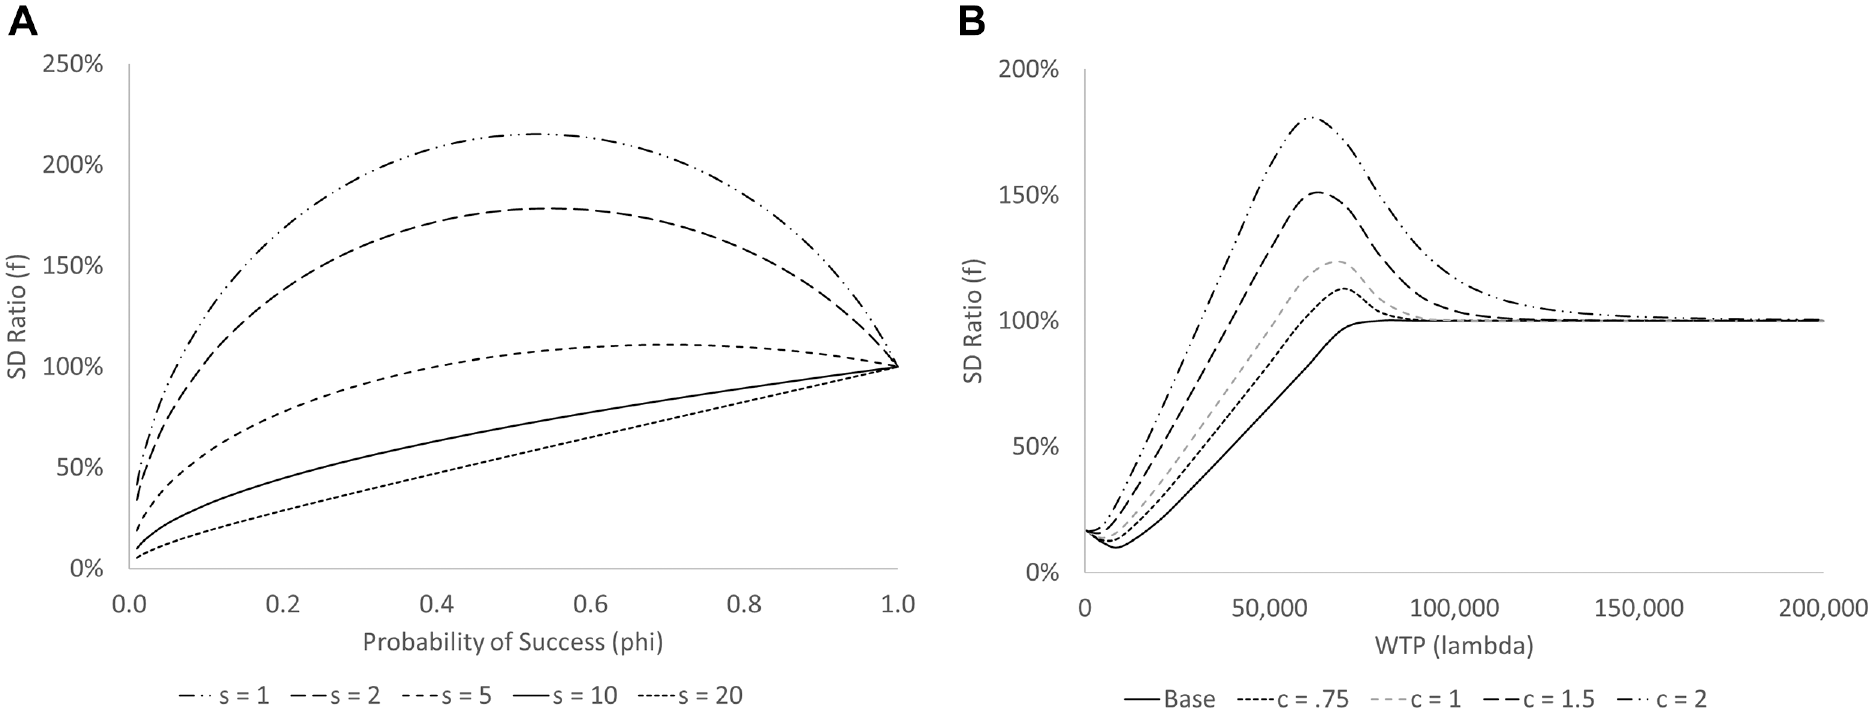
(a) Ratio
In Figure 3b, we show the impact of a cost-effectiveness RSA on variability in total drug costs (i.e.,
We also investigate the impact of each RSA on variability in NMB. Let

(a) Ratios
In additional analyses (not shown) we found that the correlations between drug costs, incremental benefits, and incremental nondrug costs (i.e., the values of
Risk Sharing Agreements and Incentives for Promotion
Assumption 2 stated that the RSAs do not have an impact on the distribution of
Formally, Proposition 7 states that
Discussion and Conclusions
In this article, we develop a model in which the number of patients, the amount of drug consumed by each patient, and the benefits achieved by each patient are not known at the time that a formulary listing decision must be made. We investigate the impact of six common RSAs on drug expenditures and NMB. Our analysis adds to existing literature by explicitly considering the impact that RSAs have on variability in costs and NMB, which, to our knowledge, has not been addressed by previous mathematical models of RSAs. In addition, the model is flexible and could contribute to future analyses of other RSA contracts.
Our analysis yields several insights:
All six RSAs considered in this article can reduce expected total drug costs, reduce the probability that total drug costs exceed any threshold, increase expected NMB, and reduce the probability of negative NMB. Thus, a decision maker whose objective is one of these four measures can achieve success with any of the six RSAs studied in this article.
Since the parameters of the RSAs can be adjusted so that any pair of RSAs has the same expected NMB, a decision maker whose objective is expected NMB can design RSA contracts in such a way that they should be indifferent between RSAs. Similarly, the parameters of all RSAs except a cost-effectiveness RSA can be adjusted so that they have the same expected total drug costs. Thus, a decision maker whose objective is expected total drug costs can design RSA contracts in such a way that they should be indifferent between those five RSAs.
For some RSAs, if they are designed so that they have the same expected performance, then they can be ranked in terms of their impact on variability in these outcomes. This applies to the price reduction, first doses free, and last doses free RSA when considering NMB, and also includes the clinical threshold RSA when considering total drug cost. Decision makers should only consider high-variability contracts if factors other than cost and variability influence their decisions.
The cost-effectiveness RSA and the clinical threshold RSA can both increase variability in total drug costs relative to not having an RSA in place, and all RSAs except the cost-effectiveness RSA can increase variability in NMB relative to not having an RSA in place. Decision makers should be aware of this potential unintended consequence when negotiating RSA contracts.
The clinical threshold RSA may seem appealing because it promises “pay-for-performance,” in that drug costs are only incurred when clinical success is achieved. However, this RSA can have the unintended consequence of increasing variability in both total drug costs and NMB.
None of the RSA contracts analyzed in this article provide an incentive for manufacturers to counteract the RSA by increasing their level of marketing spending.
In a survey of pharmaceutical decision makers in Europe, 85% of respondents indicated that they believed that “innovative agreements” might be preferable to simple price reductions if they could offer a greater reduction in cost or could be better at managing uncertainty. 37 However, there is some evidence to suggest that payers do not fully benefit from more complex RSAs due to administrative burden,11,47 and a review of performance-based RSAs in Italy confirmed that the administrative burden of implementing RSAs may be high. 9 Arguments are often made that financial-based RSAs are preferred over other RSAs because they are easier to implement. 48 Our study adds that a simple price reduction is also better at reducing variability in total drug costs and variability in NMB than a clinical threshold RSA and a first doses free RSA, and has mixed results when compared to a PVA or a cost-effectiveness RSA; and that the clinical threshold RSA, cost-effectiveness RSA, and PVA may all have unintended consequences. Thus, new and innovative RSA designs may not be in the best interest of those formulary managers who are trying to manage costs and uncertainty.
This study has limitations. Assumption 3 states that the RSA mechanism does not have any impact on the distributions of the incremental benefit of the drug, the nondrug costs among individuals who use the drug, and the amount of drug consumed per person. This may not hold if a particular RSA is accompanied by efforts to improve adherence. 49 However, the results of Propositions 2, 3, 4, and 6 would still hold as one could find RSA parameters so that the RSA had the same expected total drug cost or expected total NMB. Some authors have argued that price controls may inhibit innovation.50–52 This is outside the scope off the current analysis. However, many of the results in this article focus on comparisons between RSAs given the decision to implement one.
There are many promising directions for future research. We assumed that the costs and benefits for each patient were independent of the number of patients. This assumption could be relaxed to allow benefits to vary in the number of patients, which may be reasonable if patients who are less likely to benefit were reached when the total number of patients is large. We investigated a small number of RSA structures. One of the key results of this article is that, in some circumstances, RSAs can be ranked for decision makers who care about the mean and variance in total drug costs and NMB. Future research may consider the use of utility functions to combine outcomes in cases where a ranking is not possible, or in cases where a decision maker is also concerned about other outcomes. The approach taken in this article can be easily adapted to consider more complex arrangements, such as progressively larger discounts in volume, applied at an individual or population level. The approach used in this article can also be extended include parameter uncertainty.
Supplemental Material
sj-pdf-1-mpp-10.1177_2381468321990404 – Supplemental material for How Risky Is That Risk Sharing Agreement? Mean-Variance Tradeoffs and Unintended Consequences of Six Common Risk Sharing Agreements
Supplemental material, sj-pdf-1-mpp-10.1177_2381468321990404 for How Risky Is That Risk Sharing Agreement? Mean-Variance Tradeoffs and Unintended Consequences of Six Common Risk Sharing Agreements by Gregory S. Zaric in MDM Policy & Practice
Footnotes
The author(s) declared no potential conflicts of interest with respect to the research, authorship, and/or publication of this article.
The author(s) disclosed receipt of the following financial support for the research, authorship, and/or publication of this article: Financial support for this study was provided in part by a grant from the Natural Sciences and Engineering Research Council of Canada (NSERC), and the J. Allyn Taylor & Arthur H. Mingay Chair in Management Science. The funding agreements ensured the author’s independence in designing the study, interpreting the data, writing, and publishing the report.
References
Supplementary Material
Please find the following supplemental material available below.
For Open Access articles published under a Creative Commons License, all supplemental material carries the same license as the article it is associated with.
For non-Open Access articles published, all supplemental material carries a non-exclusive license, and permission requests for re-use of supplemental material or any part of supplemental material shall be sent directly to the copyright owner as specified in the copyright notice associated with the article.