
Abstract
Researchers are testing the feasibility of using the artificial intelligence tools known as large language models to create synthetic research participants—artificial entities that respond to surveys as real humans would. Thus far, this research has largely not been designed to examine whether synthetic participants could mimic human answers to policy-relevant surveys or reflect the views of people from non-WEIRD (Western, educated, industrialized, rich, and democratic) nations. Addressing these gaps in one study, we have compared human and synthetic participants’ responses to policy-relevant survey questions in three domains: sustainability, financial literacy, and female participation in the labor force. Participants were drawn from the United States as well as two non-WEIRD nations that have not previously been included in studies of synthetic respondents: the Kingdom of Saudi Arabia and the United Arab Emirates. We found that for all three nations, the synthetic participants created by GPT-4, a form of large language model, on average produced responses reasonably similar to those of their human counterparts. Nevertheless, we observed some differences between the American and non-WEIRD participants: For the latter, the correlations between human and synthetic responses to the full set of survey questions tended to be weaker. In addition, although we found a common tendency in all three countries for synthetic participants to show more positive and less negative bias (that is, to be more progressive and financially literate relative to their human counterparts), this trend was less pronounced for the non-WEIRD participants. We discuss the main policy implications of our findings and offer practical recommendations for improving the use of synthetic participants in research.
Since ChatGPT’s launch on November 30, 2022, 1 large language models (LLMs)—a class of artificial intelligence technology that enables ChatGPT and similar artificial intelligence systems to process written text, interact with people, and write essays—have been increasingly applied in behavioral science. (GPT stands for generative pretrained transformer, a kind of LLM.) Because LLMs develop their capabilities by examining vast amounts of material written by humans, 2 researchers have speculated that they might be able to mimic human thinking and even serve as realistic stand-ins for human participants in survey research studies.3–6 If they can, the approach could transform behavioral science, making survey-based research simpler, less costly, and faster—and, importantly, enabling researchers and institutions with limited resources to conduct studies that would otherwise be out of reach.
In a key step toward applying LLMs in survey research, several studies have shown that GPTs can be used to create artificial, or synthetic, participants—simulations of human participants whose demographic and other characteristics, such as age, gender, ethnicity, and socioeconomic status, are specified by researchers.7–10 Such work has sparked our interest in exploring the feasibility and challenges of using GPT-generated synthetic survey participants in two areas of research that have not received much attention.
One has to do with policy development. So far, research using synthetic participants has focused on basic psychological and behavioral insights. For example, researchers have conducted studies examining whether humans and synthetic participants exhibit similar personality traits 9 or whether psychological experiments previously conducted on humans can be replicated with synthetic participants. 8 However, researchers have largely neglected the potential of using synthetic participants for policy-related research, such as testing whether synthetic participants could reliably mirror the policy opinions of humans. If pretesting on synthetic participants were feasible, it would enable policymakers to iron out many aspects of their plans before soliciting the views of human participants, thereby reducing the labor and expense involved in obtaining and surveying human volunteers.
The second overlooked area involves the cultural diversity of synthetic participants. Most previous research has studied population samples from WEIRD (Western, educated, industrialized, rich, and democratic) countries. 11 One reason for this skewing is that human participants from non-WEIRD nations are often more challenging to recruit, because they are either underrepresented on popular platforms (such as Prolific)12,13 or costlier to recruit through these channels. If synthetic participants could accurately simulate the views of people from underrepresented countries, this capability would create new opportunities to conduct inclusive, globally relevant research. In particular, it could enable researchers to examine cultural variations in behavior, attitudes, and policy opinions without the logistical and financial constraints associated with recruiting international participants.
Accordingly, we have designed a study, discussed next in brief and in more detail in our Supplemental Material, to address both neglected research areas at once. Our study examines the similarity between human and synthetic participants across samples from three countries—the Kingdom of Saudi Arabia (KSA), the United Arab Emirates (UAE), and the United States—in three policy-relevant domains: environmental sustainability, financial literacy, and female participation in the labor force.
We selected participants from the KSA and UAE because those nations have been omitted from the scarce research that focuses on synthetic participants who mirror people from non-WEIRD countries. 14 We selected participants from the United States for comparison because it is a WEIRD nation.
Concerning the selected policy domains, we chose sustainability because it is one of the most pressing societal challenges of significant interest to policymakers worldwide and in the KSA and UAE specifically.15,16 Financial literacy was selected because overconsumption, the use of credit, and low savings rates are key concerns facing policymakers in both the KSA and the UAE.17–19 Likewise, we addressed female participation in the labor force because increasing female representation in the workplace has proven challenging in these countries.20–23
In the remainder of this article, we first define synthetic participants more fully and briefly review past behavioral science research into them. Then we describe our study evaluating their similarity to humans and discuss the findings and policy implications.
Synthetic Participants in Behavioral Science
Synthetic participants are artificially created agents that are modeled after humans who have specified characteristics.8–10 As an example, imagine researchers who want to know the views of a 30-year-old woman from the KSA who is employed, married, and extraverted and has a master’s degree. They could instruct a GPT or another LLM to create a synthetic participant to answer survey questions from the perspective of a person with these characteristics.9,10 Instead of being trained on or examining real people’s profiles, LLMs are trained on large, diverse data sets containing text from a wide range of sources. This training allows the models to imitate the language use, conversational style, and likely viewpoints of individuals with specific traits. The model’s algorithms generate responses that reflect the predicted opinions of someone with the specified characteristics, allowing researchers to explore hypothetical perspectives without relying on direct input from real individuals.
As we have already noted, so far, research on synthetic participants has primarily focused on basic psychological and behavioral insights, such as examining the extent to which synthetic participants display personality traits comparable to those of humans or exploring the feasibility of replicating human psychological experiments using synthetic participants (see Table 1 for an overview of past studies). The results have been mixed.
Overview of research on synthetic participants, in chronological order
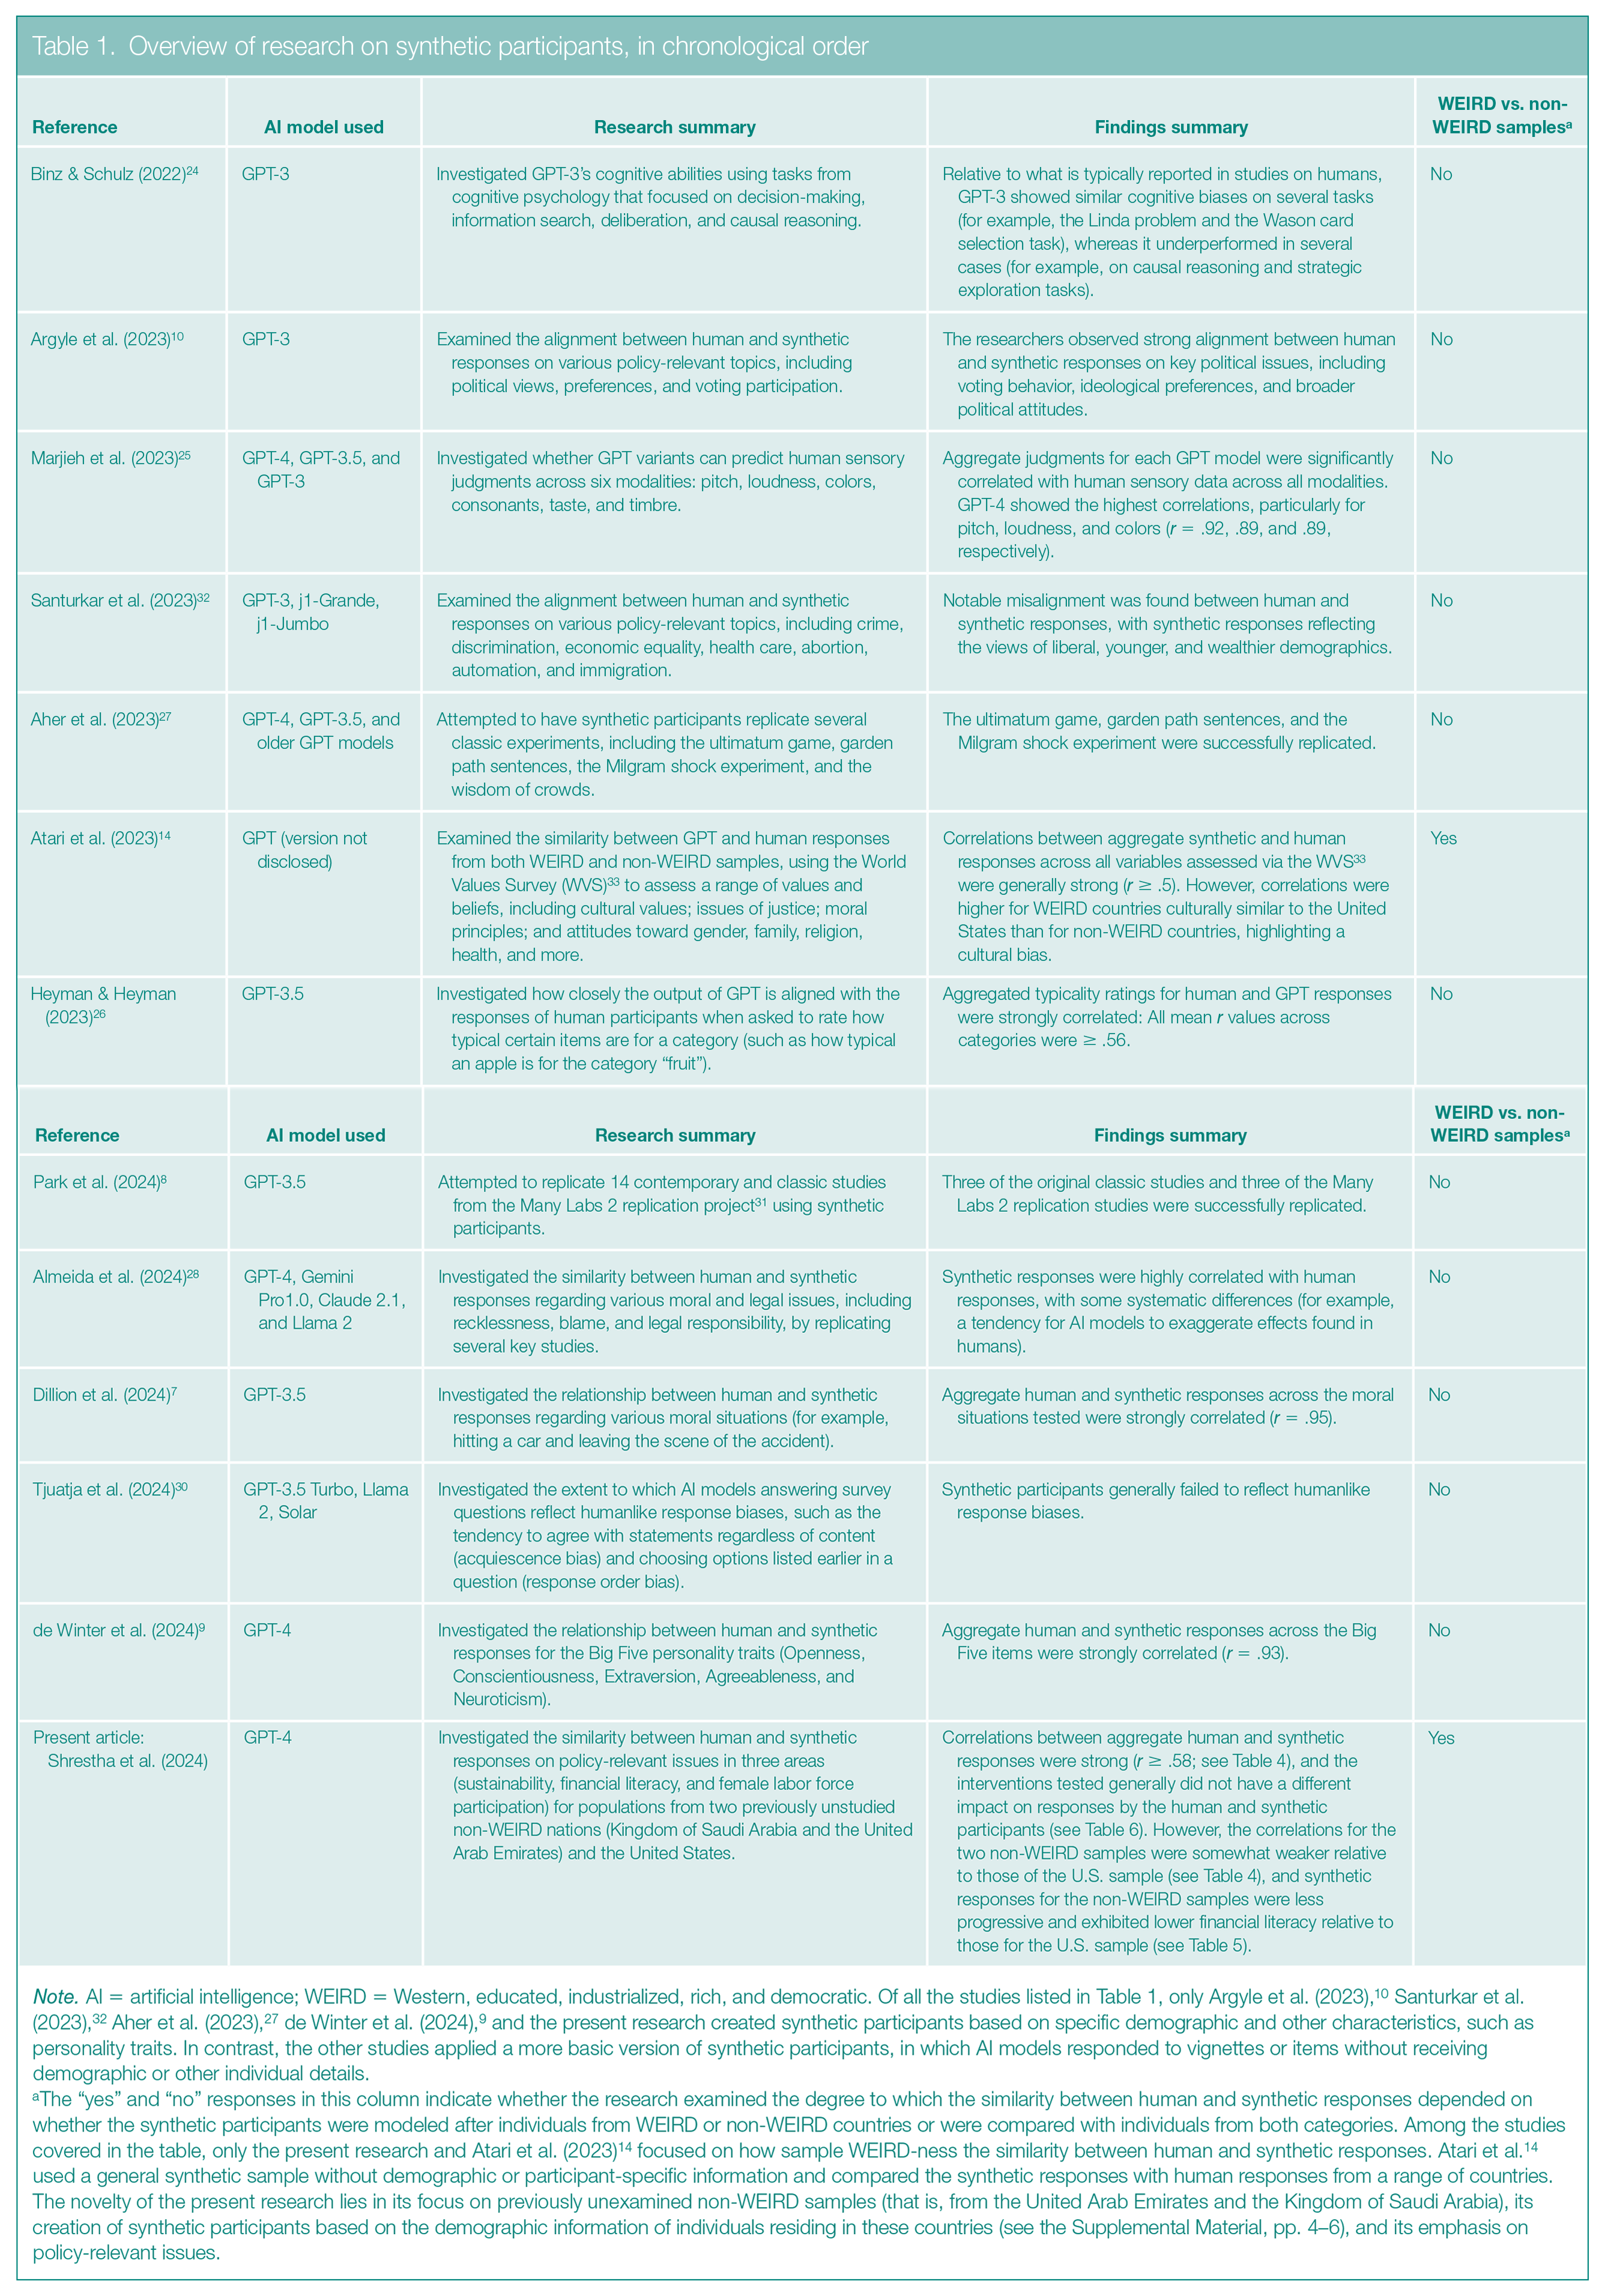
Note. AI = artificial intelligence; WEIRD = Western, educated, industrialized, rich, and democratic. Of all the studies listed in Table 1, only Argyle et al. (2023), 10 Santurkar et al. (2023), 32 Aher et al. (2023), 27 de Winter et al. (2024), 9 and the present research created synthetic participants based on specific demographic and other characteristics, such as personality traits. In contrast, the other studies applied a more basic version of synthetic participants, in which AI models responded to vignettes or items without receiving demographic or other individual details.
The “yes” and “no” responses in this column indicate whether the research examined the degree to which the similarity between human and synthetic responses depended on whether the synthetic participants were modeled after individuals from WEIRD or non-WEIRD countries or were compared with individuals from both categories. Among the studies covered in the table, only the present research and Atari et al. (2023) 14 focused on how sample WEIRD-ness the similarity between human and synthetic responses. Atari et al. 14 used a general synthetic sample without demographic or participant-specific information and compared the synthetic responses with human responses from a range of countries. The novelty of the present research lies in its focus on previously unexamined non-WEIRD samples (that is, from the United Arab Emirates and the Kingdom of Saudi Arabia), its creation of synthetic participants based on the demographic information of individuals residing in these countries (see the Supplemental Material, pp. 4–6), and its emphasis on policy-relevant issues.
On the positive side, various studies, mostly involving participants from WEIRD countries, have found that synthetic participants made moral judgments similar to those of living human samples 6 and even displayed similar Big Five personality traits (Openness, Conscientiousness, Extraversion, Agreeableness, and Neuroticism). 9 Moreover, they displayed humanlike cognitive biases (such as the framing effect, where their responses changed on the basis of whether a choice was presented as a gain or a loss), 24 sensory judgments (such as distinguishing between similar and different colors), 25 and perceptions of object typicality (such as whether an apple is a typical example of the category “fruit”). 26 GPT technology has also successfully replicated several classic and contemporary economic and psychology experiments.8,27,28 For example, in a scenario that simulated the classic Milgram experiment (which explored obedience to authority), 29 synthetic participants who had been told they were administering electric shocks to others started disobeying the experimenter and ceased to administer the putative shocks at voltage levels similar to those at which humans stopped. 27
On the negative side, in some research, GPTs have demonstrated weak logical reasoning abilities 24 and, unlike humans, have responded to survey questions in ways that were unaffected by how the questions were worded. 30 In other work, LLMs sometimes have not reproduced the results of experiments that used human participants. For example, Peter S. Park and his colleagues 8 used synthetic participants to try to replicate the results of 14 contemporary and classic studies included in a project known as Many Labs 2, in which researchers are trying to replicate the results of a set of past studies in psychology with a new sample of human participants. 31 In six of the studies involving synthetic participants, more than 90% of the participants exhibited the “correct answer effect,” providing identical survey responses that rendered the data unanalyzable. In the remaining eight studies, synthetic participants replicated the results of only 37.5% of both the original studies and the Many Labs 2 studies in which researchers attempted to replicate the results of the original studies.
Results from the sparse policy-relevant research using synthetic participants to address societal challenges have been mixed as well. Of two studies based in the United States, one showed that human and synthetic participants were misaligned on topics ranging from abortion to automation, 32 whereas the other demonstrated aligned voting intentions and political views. 10 The few studies that have compared human and synthetic participants from non-WEIRD and WEIRD nations examined responses to the World Values Survey, which measures values and beliefs, such as views on gender equality and attitudes toward work. 33 Those studies found weaker alignments for participants from non-WEIRD nations than for participants from the United States. 14
The Study
Overview
In our study, we created synthetic counterparts of participants from the KSA, UAE, and United States and had both participant types answer questions related to the policy domains of environmental sustainability, financial literacy, and female participation in the labor force. We analyzed each country’s data separately. For each domain, participants answered a series of questions about their attitudes and participated in experiments that asked them to predict how they or a fictitious character would behave in different scenarios. All participants answered all attitudinal questions and participated in all three behavioral experiments. Each participant answered 43 questions.
Our main aims were to test (a) how closely the human and synthetic participants aligned on the attitudinal and behavioral variables (that is, whether their answers to the survey questions were similar) and (b) whether our experimental interventions (the presentation of particular scenarios) affected the answers of the human and synthetic participants similarly.7–9,28 We assessed alignment by correlating the two groups’ aggregate responses to all attitudinal and behavioral questions and also by measuring the mean differences in responses to each question. We also examined whether the extent of agreement between the responses of human and synthetic participants was consistent across the three different countries. All research materials, data, GPT prompts (the requirements fed into the system to create the participants), and analysis codes are available via the Open Science Framework: https://osf.io/rm594/?view_only=21baf42192e64c018a72c73e69a18368
Further Details on Human & Synthetic Participants
The sample sizes, mean ages, and genders of our human participants are broken down by country in Table 2 (for the rationale behind our sample sizes, see the Supplemental Material, p. 3).
Sample size, age, & gender for all human participants who completed the study & for those participants who were eligible for analyses after exclusions
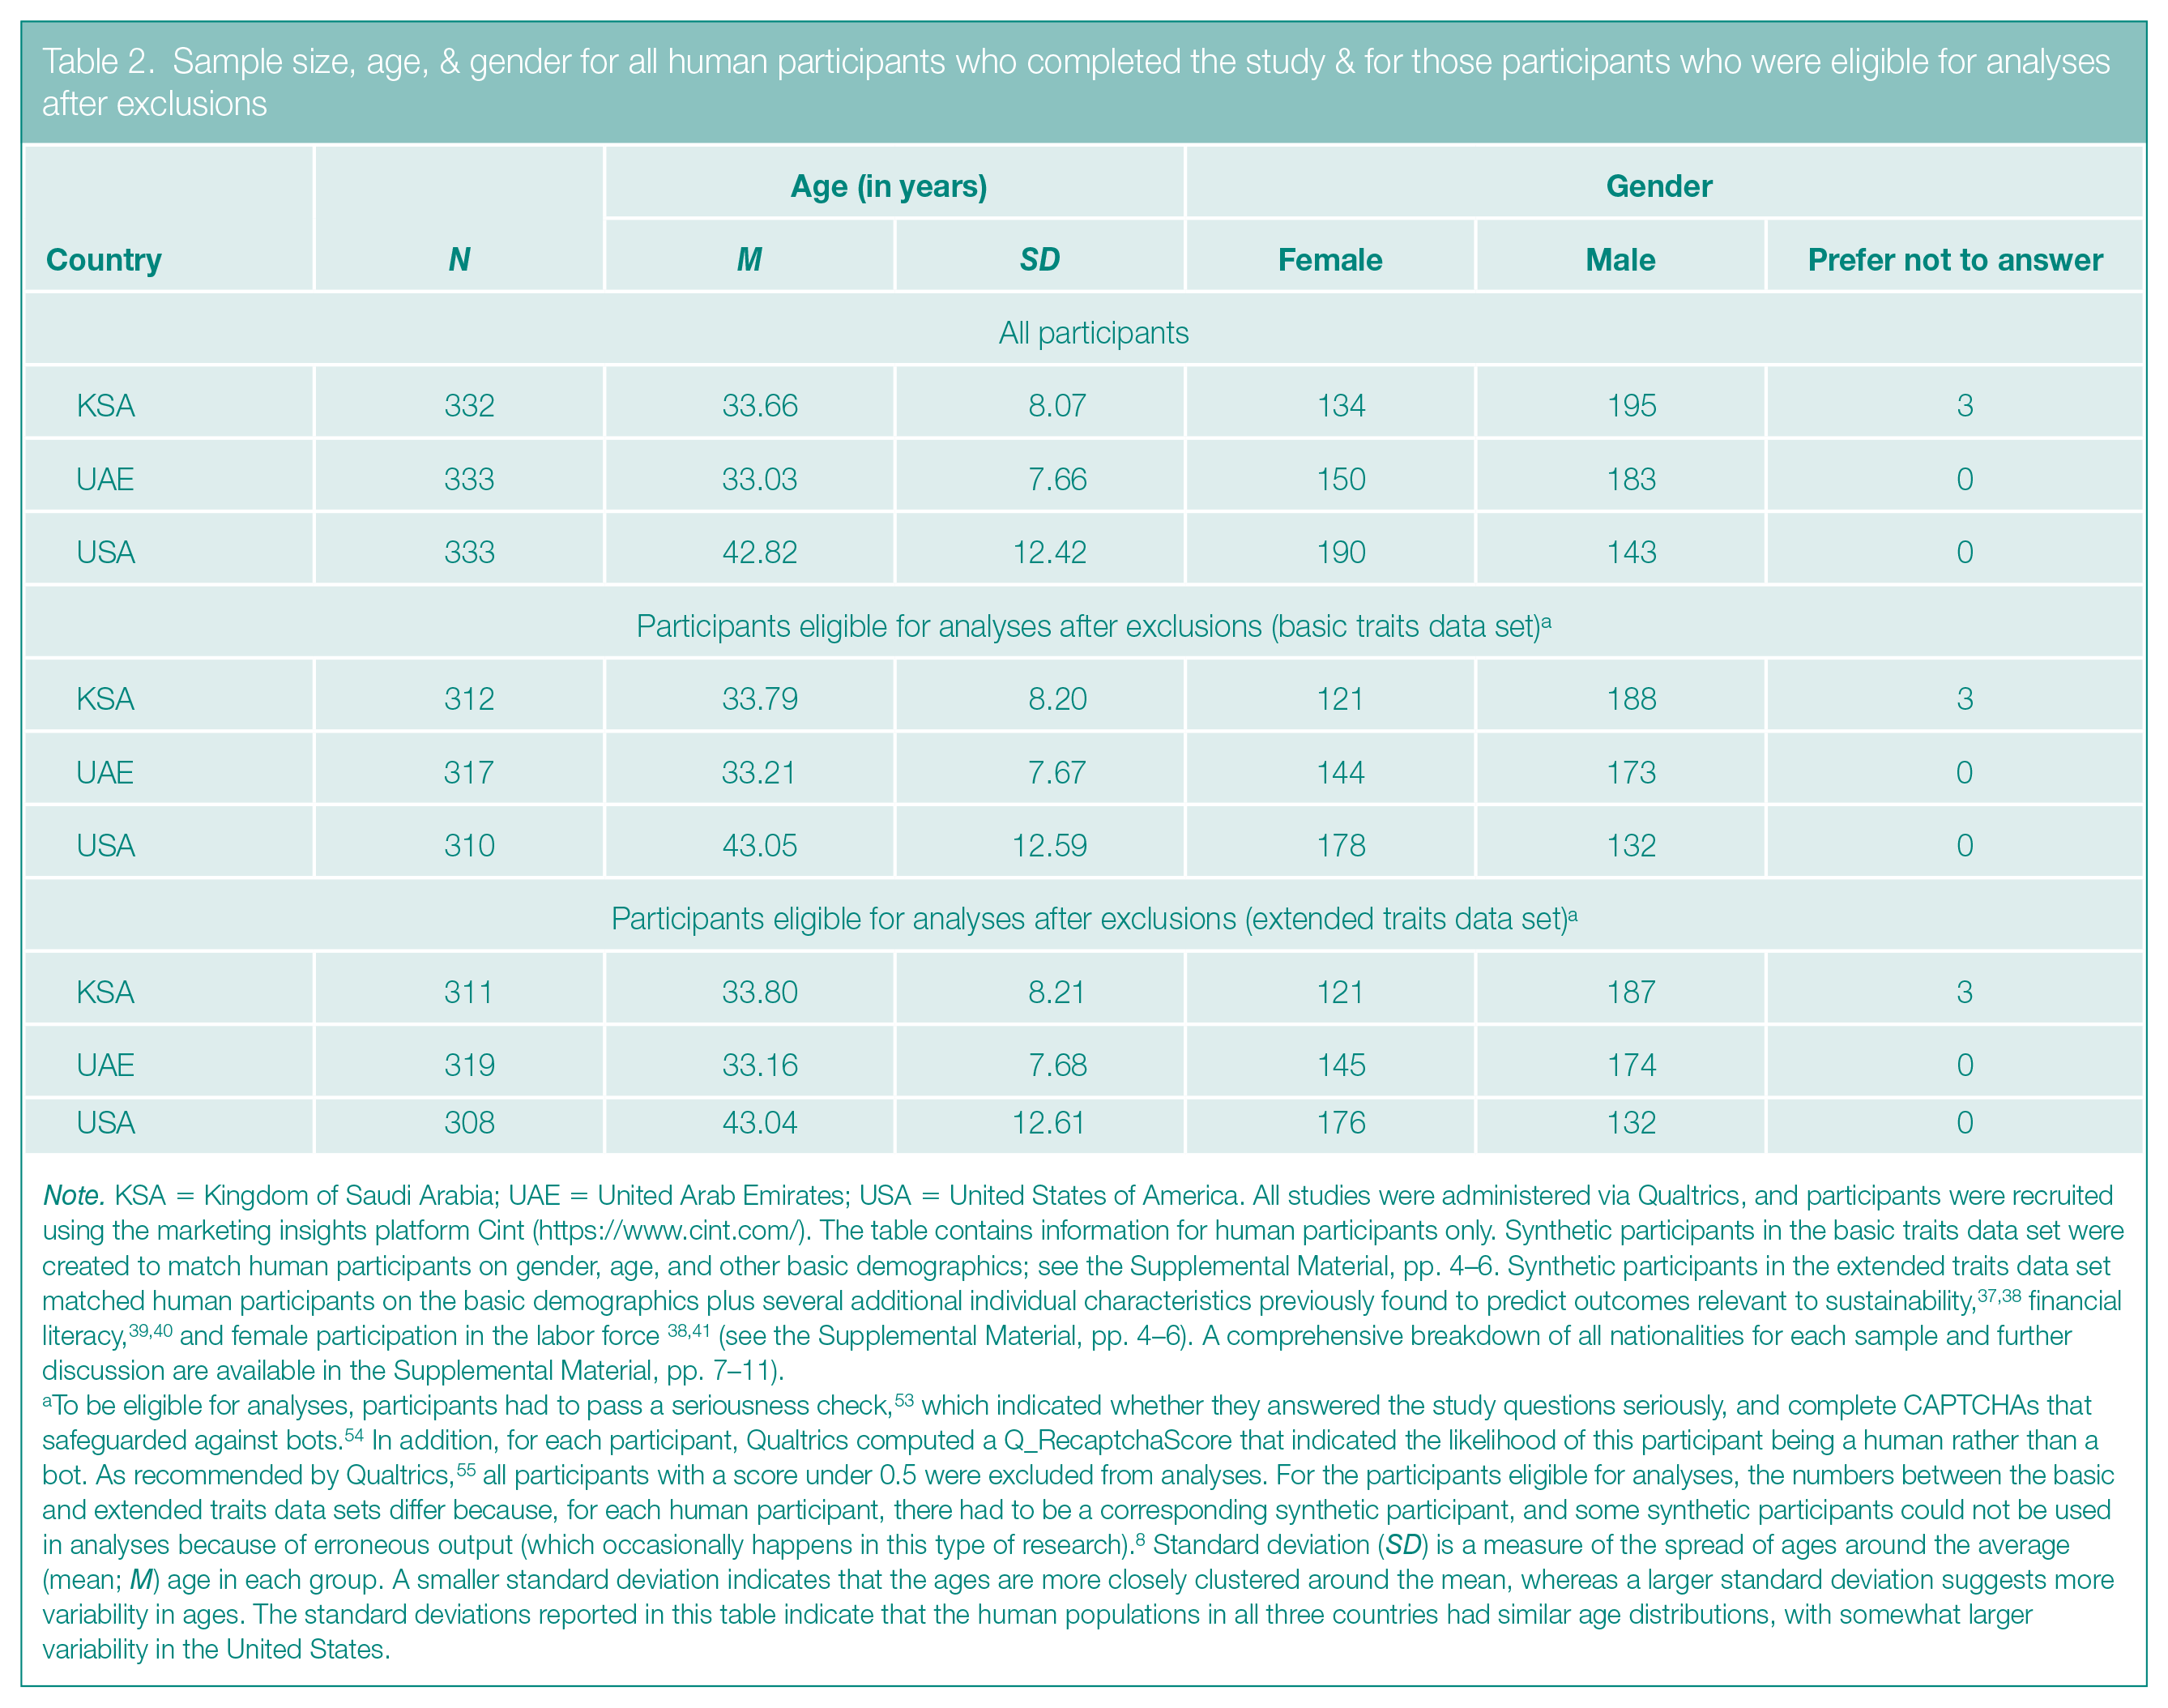
Note. KSA = Kingdom of Saudi Arabia; UAE = United Arab Emirates; USA = United States of America. All studies were administered via Qualtrics, and participants were recruited using the marketing insights platform Cint (https://www.cint.com/). The table contains information for human participants only. Synthetic participants in the basic traits data set were created to match human participants on gender, age, and other basic demographics; see the Supplemental Material, pp. 4–6. Synthetic participants in the extended traits data set matched human participants on the basic demographics plus several additional individual characteristics previously found to predict outcomes relevant to sustainability,37,38 financial literacy,39,40 and female participation in the labor force 38,41 (see the Supplemental Material, pp. 4–6). A comprehensive breakdown of all nationalities for each sample and further discussion are available in the Supplemental Material, pp. 7–11).
To be eligible for analyses, participants had to pass a seriousness check, 53 which indicated whether they answered the study questions seriously, and complete CAPTCHAs that safeguarded against bots. 54 In addition, for each participant, Qualtrics computed a Q_RecaptchaScore that indicated the likelihood of this participant being a human rather than a bot. As recommended by Qualtrics, 55 all participants with a score under 0.5 were excluded from analyses. For the participants eligible for analyses, the numbers between the basic and extended traits data sets differ because, for each human participant, there had to be a corresponding synthetic participant, and some synthetic participants could not be used in analyses because of erroneous output (which occasionally happens in this type of research). 8 Standard deviation (SD) is a measure of the spread of ages around the average (mean; M) age in each group. A smaller standard deviation indicates that the ages are more closely clustered around the mean, whereas a larger standard deviation suggests more variability in ages. The standard deviations reported in this table indicate that the human populations in all three countries had similar age distributions, with somewhat larger variability in the United States.
We recruited the human participants for the KSA, UAE, and U.S. samples online and selected people who resided in these countries. The nationalities of participants can be diverse, however.34–36 So, to match the synthetic participants well with the human ones, we indicated nationalities in the database. Because recruiting volunteers from the KSA and UAE can be difficult, we did not recruit representative samples of residents. However, the ratio of resident nationals to foreign residents in the KSA, UAE, and U.S. samples was broadly in line with the population characteristics of these countries.34–36 Moreover, the majority of foreign residents in the KSA and UAE samples were from non-WEIRD countries (for a comprehensive breakdown of the nationalities of the participants in each sample, see the Supplemental Material, pp. 7–11).
All synthetic participants were created using GPT-4. We wondered whether the answers provided by synthetic subjects would more closely resemble those of humans if GPT-4 were instructed to base them on more than just basic demographic information. Therefore, we created two types of participants: a set with basic features (the basic traits data set) and a set with more extensive characteristics (the extended traits data set).
To create the two groups of synthetic participants, we prompted GPT-4 to match the human participants according to their (a) basic demographic characteristics, such as their age, gender, or employment (for the basic traits data set), or (b) basic demographic characteristics plus several variables previously found to predict attitudes or behaviors related to sustainability,37,38 financial literacy,39,40 or women’s participation in the labor force,38,41 such as math anxiety or the belief that there are multiple ways to overcome any problem (for the extended traits data set). For details on the prompts, see the Supplemental Material (pp. 4–6). In addition, to probe the robustness of the findings, we also generated two synthetic participant samples as above (with the basic and extended demographic characteristics), but we used alternative prompts (see the Supplemental Material, pp. 4–6). Because the alternative prompts produced the same findings as the main prompts we used, these findings are reported in the Supplemental Material (pp. 46–72) but not in the article.
Survey Design
Recall that this study was designed around three overarching public policy themes—sustainability, financial literacy, and women’s involvement in the labor market. In relation to each theme, the survey had both attitudinal questions and a behavioral task.
The attitudinal questions assessed the degree to which participants displayed concern about the environment and climate change, handled their finances wisely, and supported women’s involvement and gender equality in the labor market. For instance, the questions asked whether participants agreed with statements such as “I worry about climate change,” asked how they grade themselves on controlling their spending, and asked whether they agreed that women should have more opportunities in all areas of life. All attitudinal questions were answered using 5-point Likert-type scales, which give respondents a range of five answers to choose from. In the case of the climate and labor questions, the choices to characterize participants’ agreement with various statements ranged from Strongly disagree to Strongly agree. For the financial questions, participants rated their financial skills on a scale ranging from Poor to Excellent (for more details, see the Supplemental Material, pp. 12–19).
In the sustainability behavioral experiment, we examined whether presenting a social norm would affect the participants’ intention to take action on behalf of the environment. 42 We randomly allocated participants to a control or treatment group and asked them to imagine that they had just booked a flight for $150 USD and could offset their flight emissions by paying an extra $0–$10 USD. We provided a table showing the percentage of emissions offset by the amount spent, ranging from 0% at $0 to 100% at $4 to as high as 250% at $10 (this task is similar to an approach called the carbon emission task discussed in reference 43). Then we asked what dollar amount (ranging from $0 to $10) they would be willing to pay to offset their emissions. Participants in the treatment group were told that 80% of passengers paid more than $8 USD to offset their emissions; participants in the control group received no such information.
In the experiment relating to financial literacy, we investigated whether synthetic participants would react as humans do to a scenario meant to induce a future-oriented mindset when making a financial decision. In other research, inducing such a mindset has encouraged people to delay gratification. 44 We randomly assigned participants to a control or treatment group and asked them to indicate how much they would save, invest, and spend (on consumption or otherwise) if they had $1,000 USD of disposable income. The total amount allocated to the three categories had to add up to $1,000. Before the task, participants in the treatment group saw a short message asking them to imagine their future selves having achieved all their financial goals. Participants in the control group saw no such message.
For the experiment relating to women in the labor market, we designed a vignette experiment to assess the extent to which synthetic and human participants are affected by two kinds of influences: normative expectations (that is, what others approve of) and empirical expectations (that is, what others do). 45 We asked participants to read four different fictional scenarios about Sarah, a new mother considering whether she should return to work. Each scenario manipulated the normative and empirical expectations Sarah was experiencing by varying whether her family approved of her going back to work (high normative expectations) or not (low normative expectations) and whether her friends returned to work after having a child (high empirical expectations) or not (low empirical expectations). After reading each scenario, the participants rated Sarah’s likelihood of returning to the workplace and whether they thought it was the right thing to do on 7-point Likert-type scales ranging from Extremely unlikely to Extremely likely and from Strongly disagree to Strongly agree, respectively. We presented all four scenarios to each participant in a random order, which allowed us to analyze the findings relating to the labor market using two approaches.
One approach, a between-subjects design, 46 is essentially the same approach we used for the other two behavioral tasks: After we grouped the participants according to which of the four scenarios they were randomized to see first, we compared the responses of the human and synthetic participants. The other approach, a within-subjects design, enabled us to analyze how strongly each of the four scenarios affected any given participant’s predictions for what Sarah would do and to then see if the synthetic and human participants were affected in the same ways. The between-subjects design avoids the risk that the order in which scenarios are presented will influence the responses, but the within-subjects design has higher power47,48 for detecting differences in how the responses of human and synthetic participants are influenced by the scenarios.
For human participants, we began the survey by having them fill out a consent form and provide data about demographic and other characteristics. Next, participants were asked to answer questions from each of the three policy domains in the following order: (a) female participation in the labor force, (b) financial literacy, and (c) sustainability. For each domain, they answered the attitudinal questions first and then turned to the corresponding behavioral task. At the end of the survey, participants were debriefed. For synthetic participants, the study followed the same order, except that they were not asked for informed consent or debriefed, given that they are not real individuals and therefore do not require the ethical procedures that must be followed for human participants. For a list of all the items we assessed, see Table S5 in the Supplemental Material (pp. 12–19). We analyzed the data for each country separately and determined the statistical significance of all results reported in the next section by applying the false discovery rate correction 49 (for details, see the Supplemental Material, p. 3).
Results
We highlight our key findings and recommendations in Table 3 and present the related data in Tables 4, 5, and 6. The full output is available in the Supplemental Material (pp. 20–45).
Policy recommendations & findings underlying the recommendations
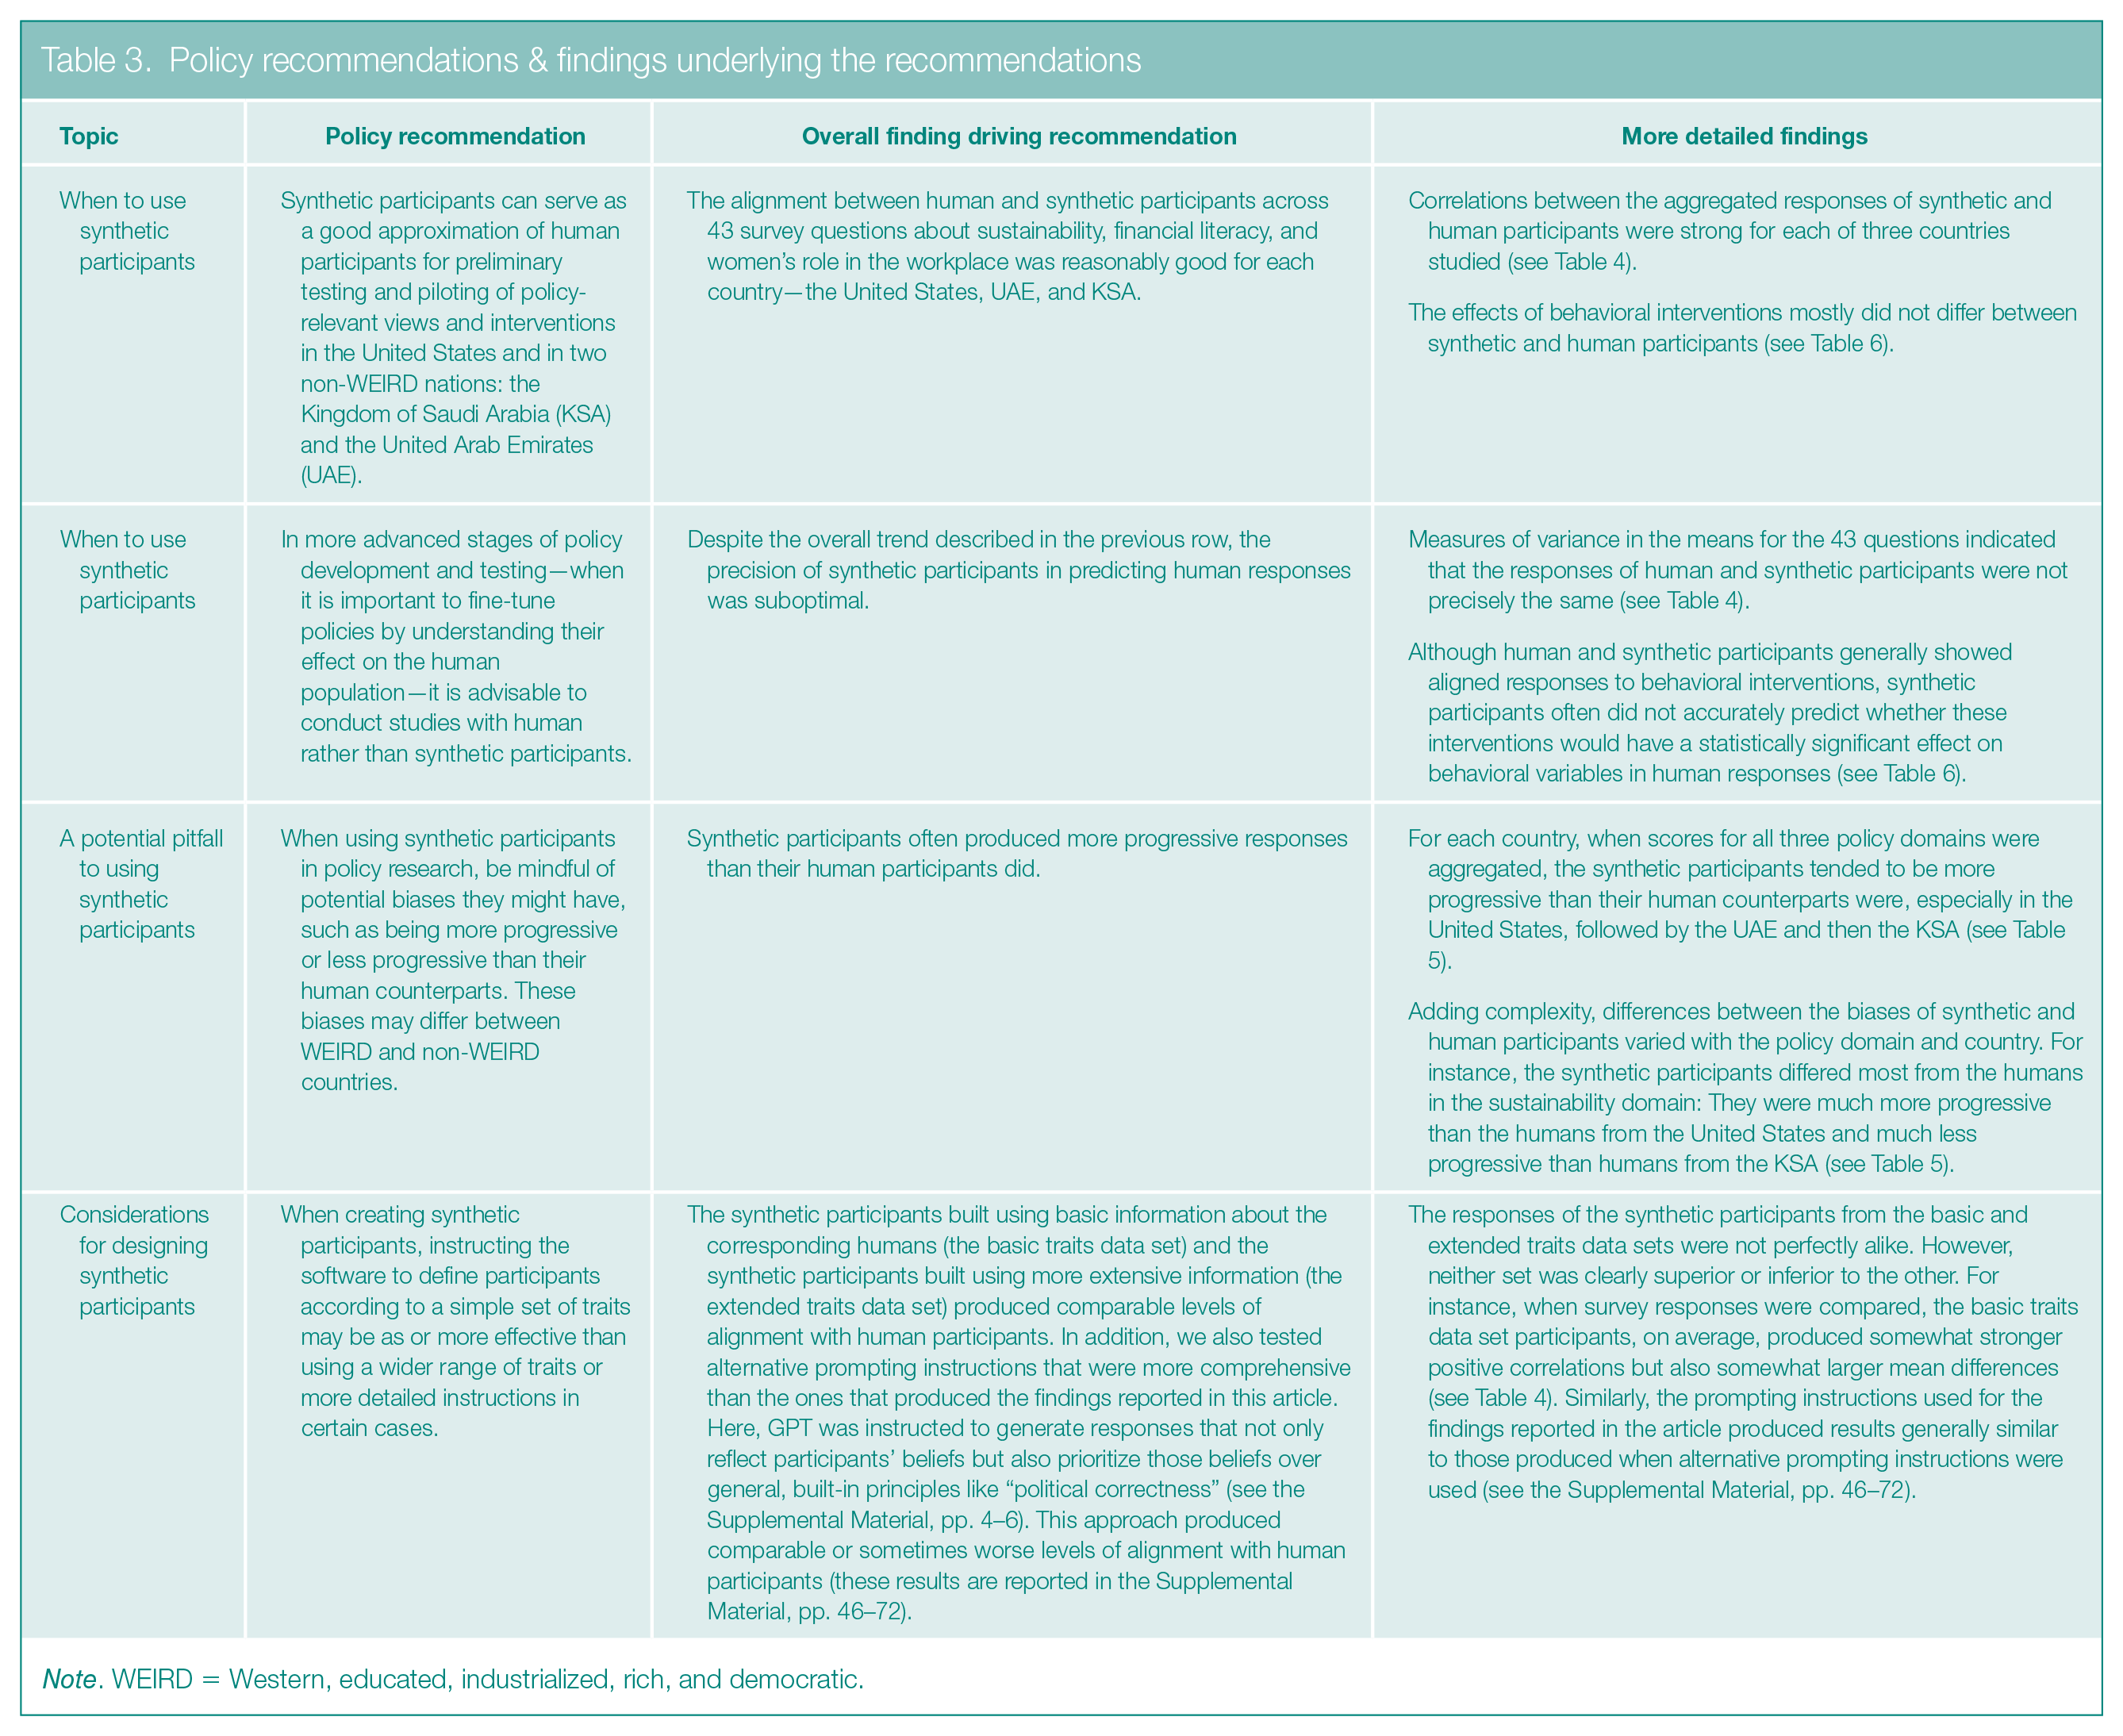
Note. WEIRD = Western, educated, industrialized, rich, and democratic.
Aggregate correlations & mean differences between the human & synthetic responses across different variables, by country & synthetic data set
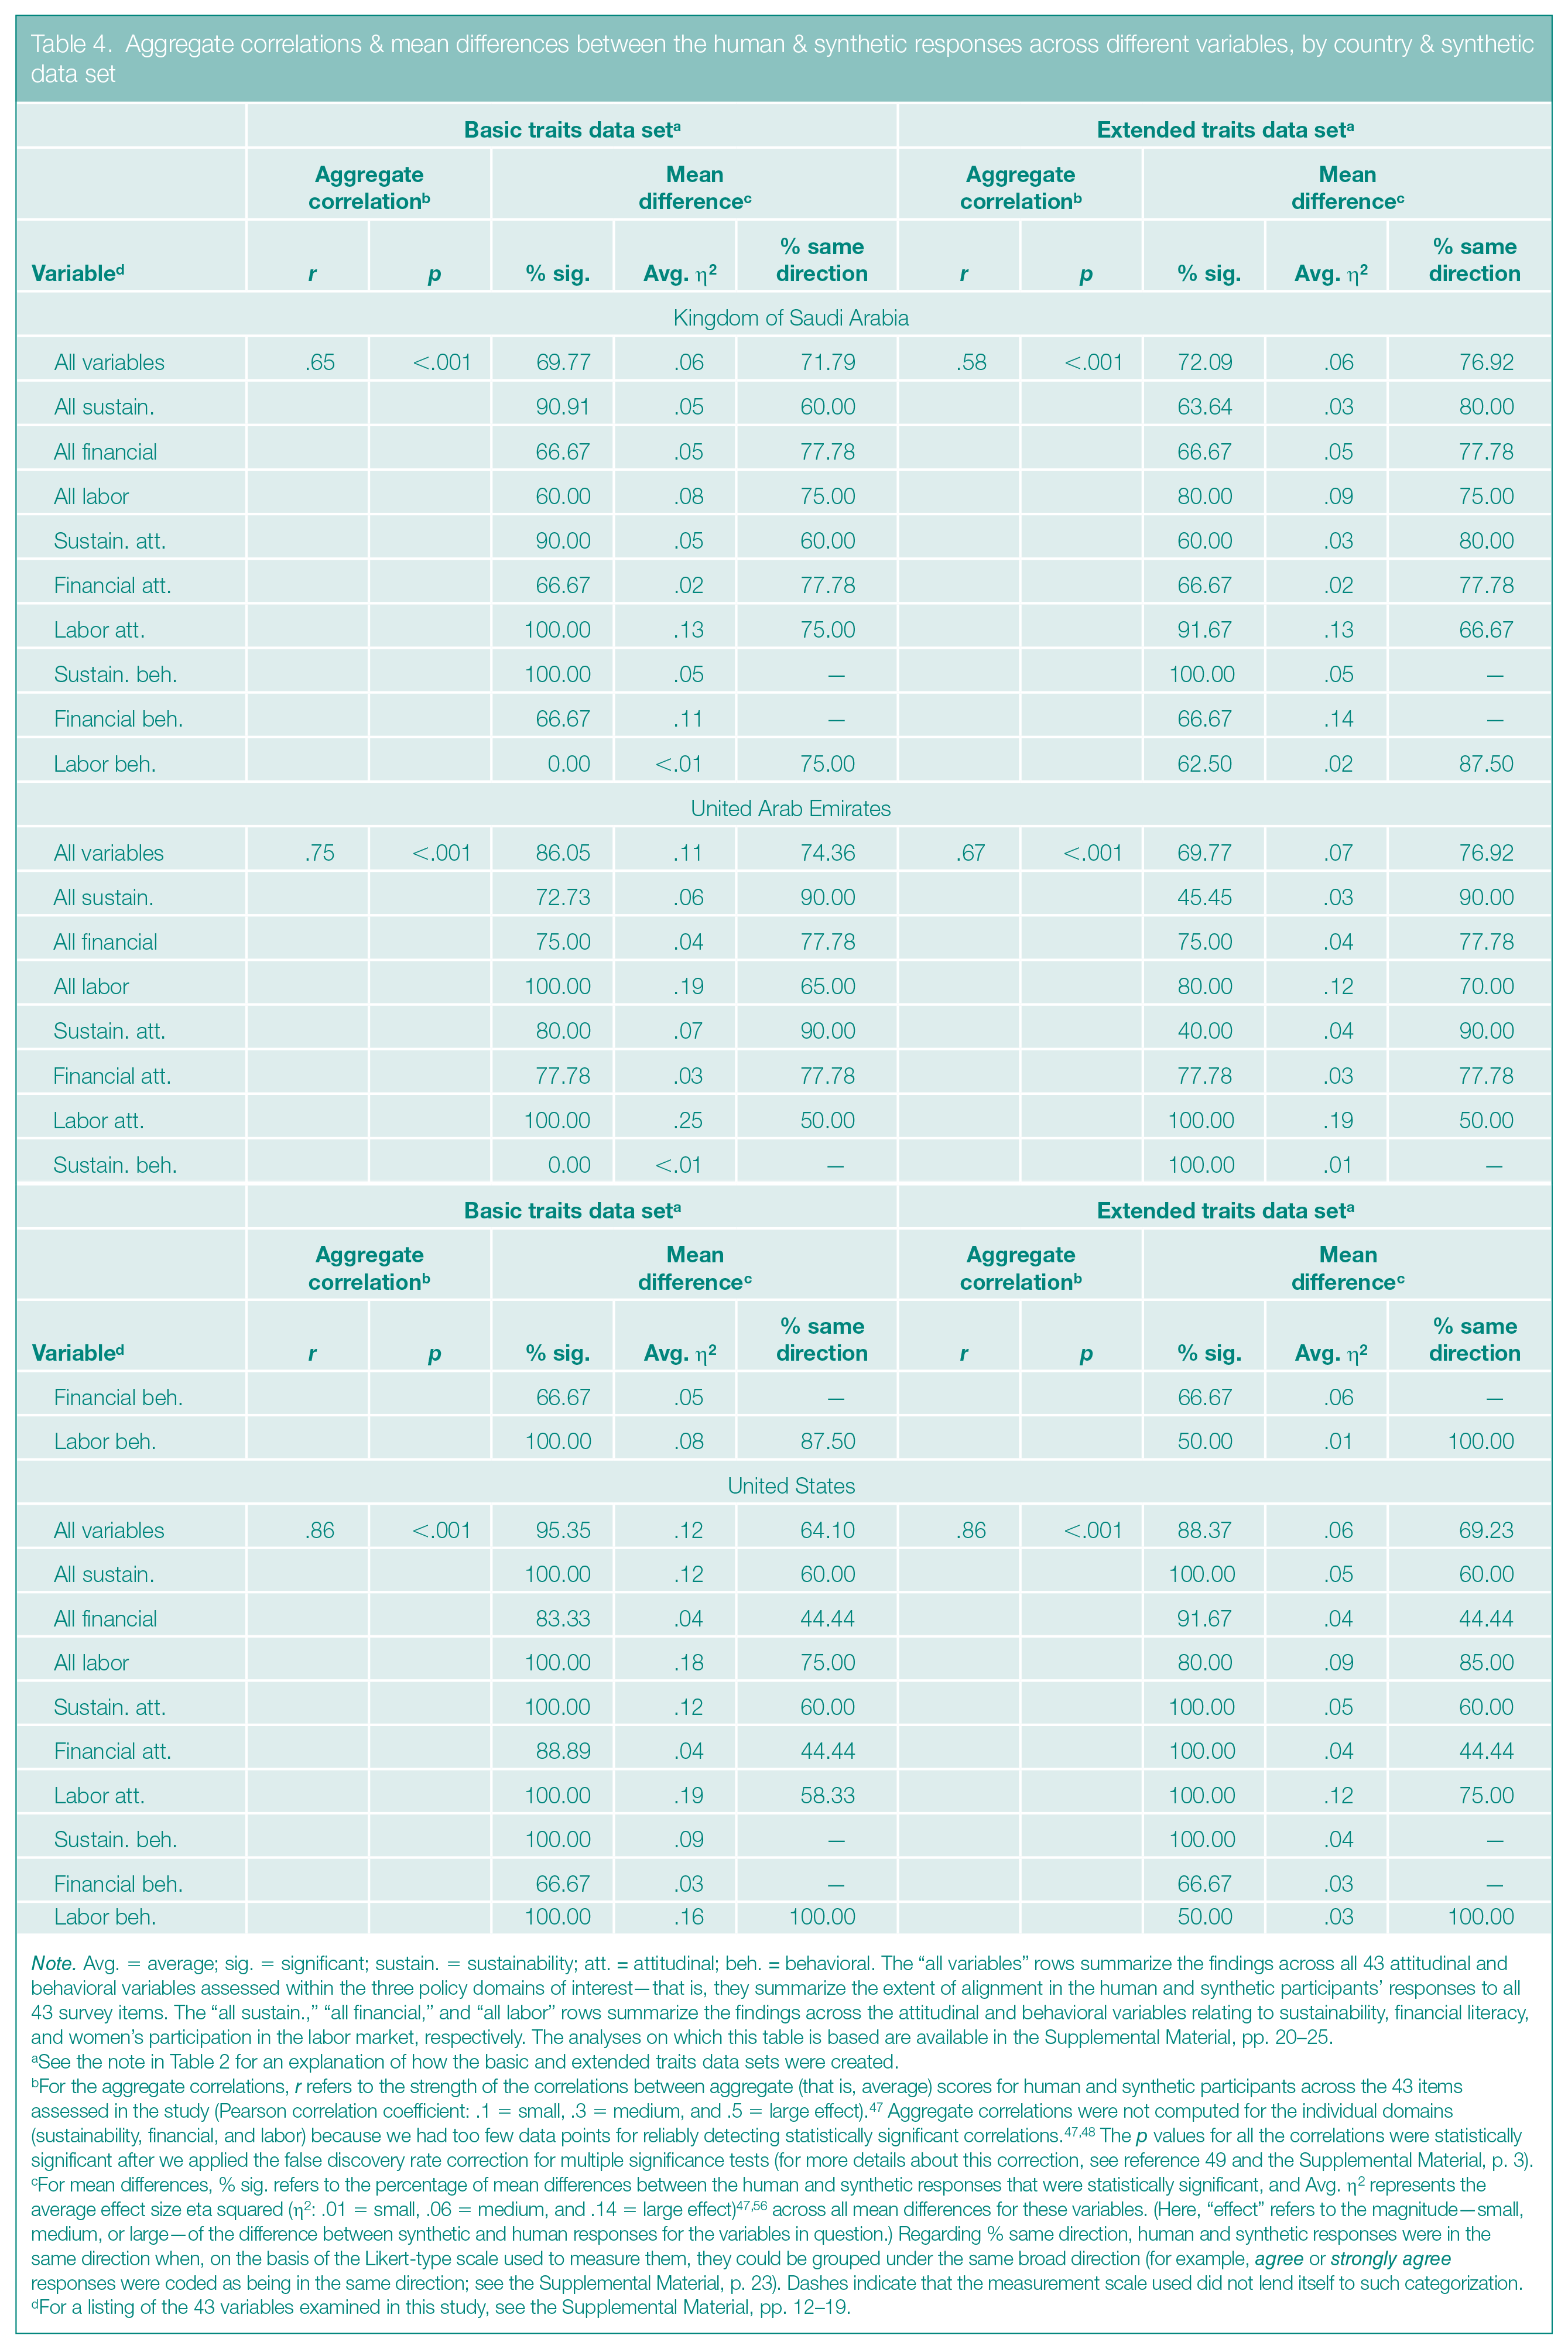
Note. Avg. = average; sig. = significant; sustain. = sustainability; att. = attitudinal; beh. = behavioral. The “all variables” rows summarize the findings across all 43 attitudinal and behavioral variables assessed within the three policy domains of interest—that is, they summarize the extent of alignment in the human and synthetic participants’ responses to all 43 survey items. The “all sustain.,” “all financial,” and “all labor” rows summarize the findings across the attitudinal and behavioral variables relating to sustainability, financial literacy, and women’s participation in the labor market, respectively. The analyses on which this table is based are available in the Supplemental Material, pp. 20–25.
See the note in Table 2 for an explanation of how the basic and extended traits data sets were created.
For the aggregate correlations, r refers to the strength of the correlations between aggregate (that is, average) scores for human and synthetic participants across the 43 items assessed in the study (Pearson correlation coefficient: .1 = small, .3 = medium, and .5 = large effect). 47 Aggregate correlations were not computed for the individual domains (sustainability, financial, and labor) because we had too few data points for reliably detecting statistically significant correlations.47,48 The p values for all the correlations were statistically significant after we applied the false discovery rate correction for multiple significance tests (for more details about this correction, see reference 49 and the Supplemental Material, p. 3).
For mean differences, % sig. refers to the percentage of mean differences between the human and synthetic responses that were statistically significant, and Avg. η2 represents the average effect size eta squared (η2: .01 = small, .06 = medium, and .14 = large effect)47,56 across all mean differences for these variables. (Here, “effect” refers to the magnitude—small, medium, or large—of the difference between synthetic and human responses for the variables in question.) Regarding % same direction, human and synthetic responses were in the same direction when, on the basis of the Likert-type scale used to measure them, they could be grouped under the same broad direction (for example, agree or strongly agree responses were coded as being in the same direction; see the Supplemental Material, p. 23). Dashes indicate that the measurement scale used did not lend itself to such categorization.
For a listing of the 43 variables examined in this study, see the Supplemental Material, pp. 12–19.
Positive & negative bias in responses to questions relating to sustainability, financial literacy, & female participation in the labor market, by country & data set
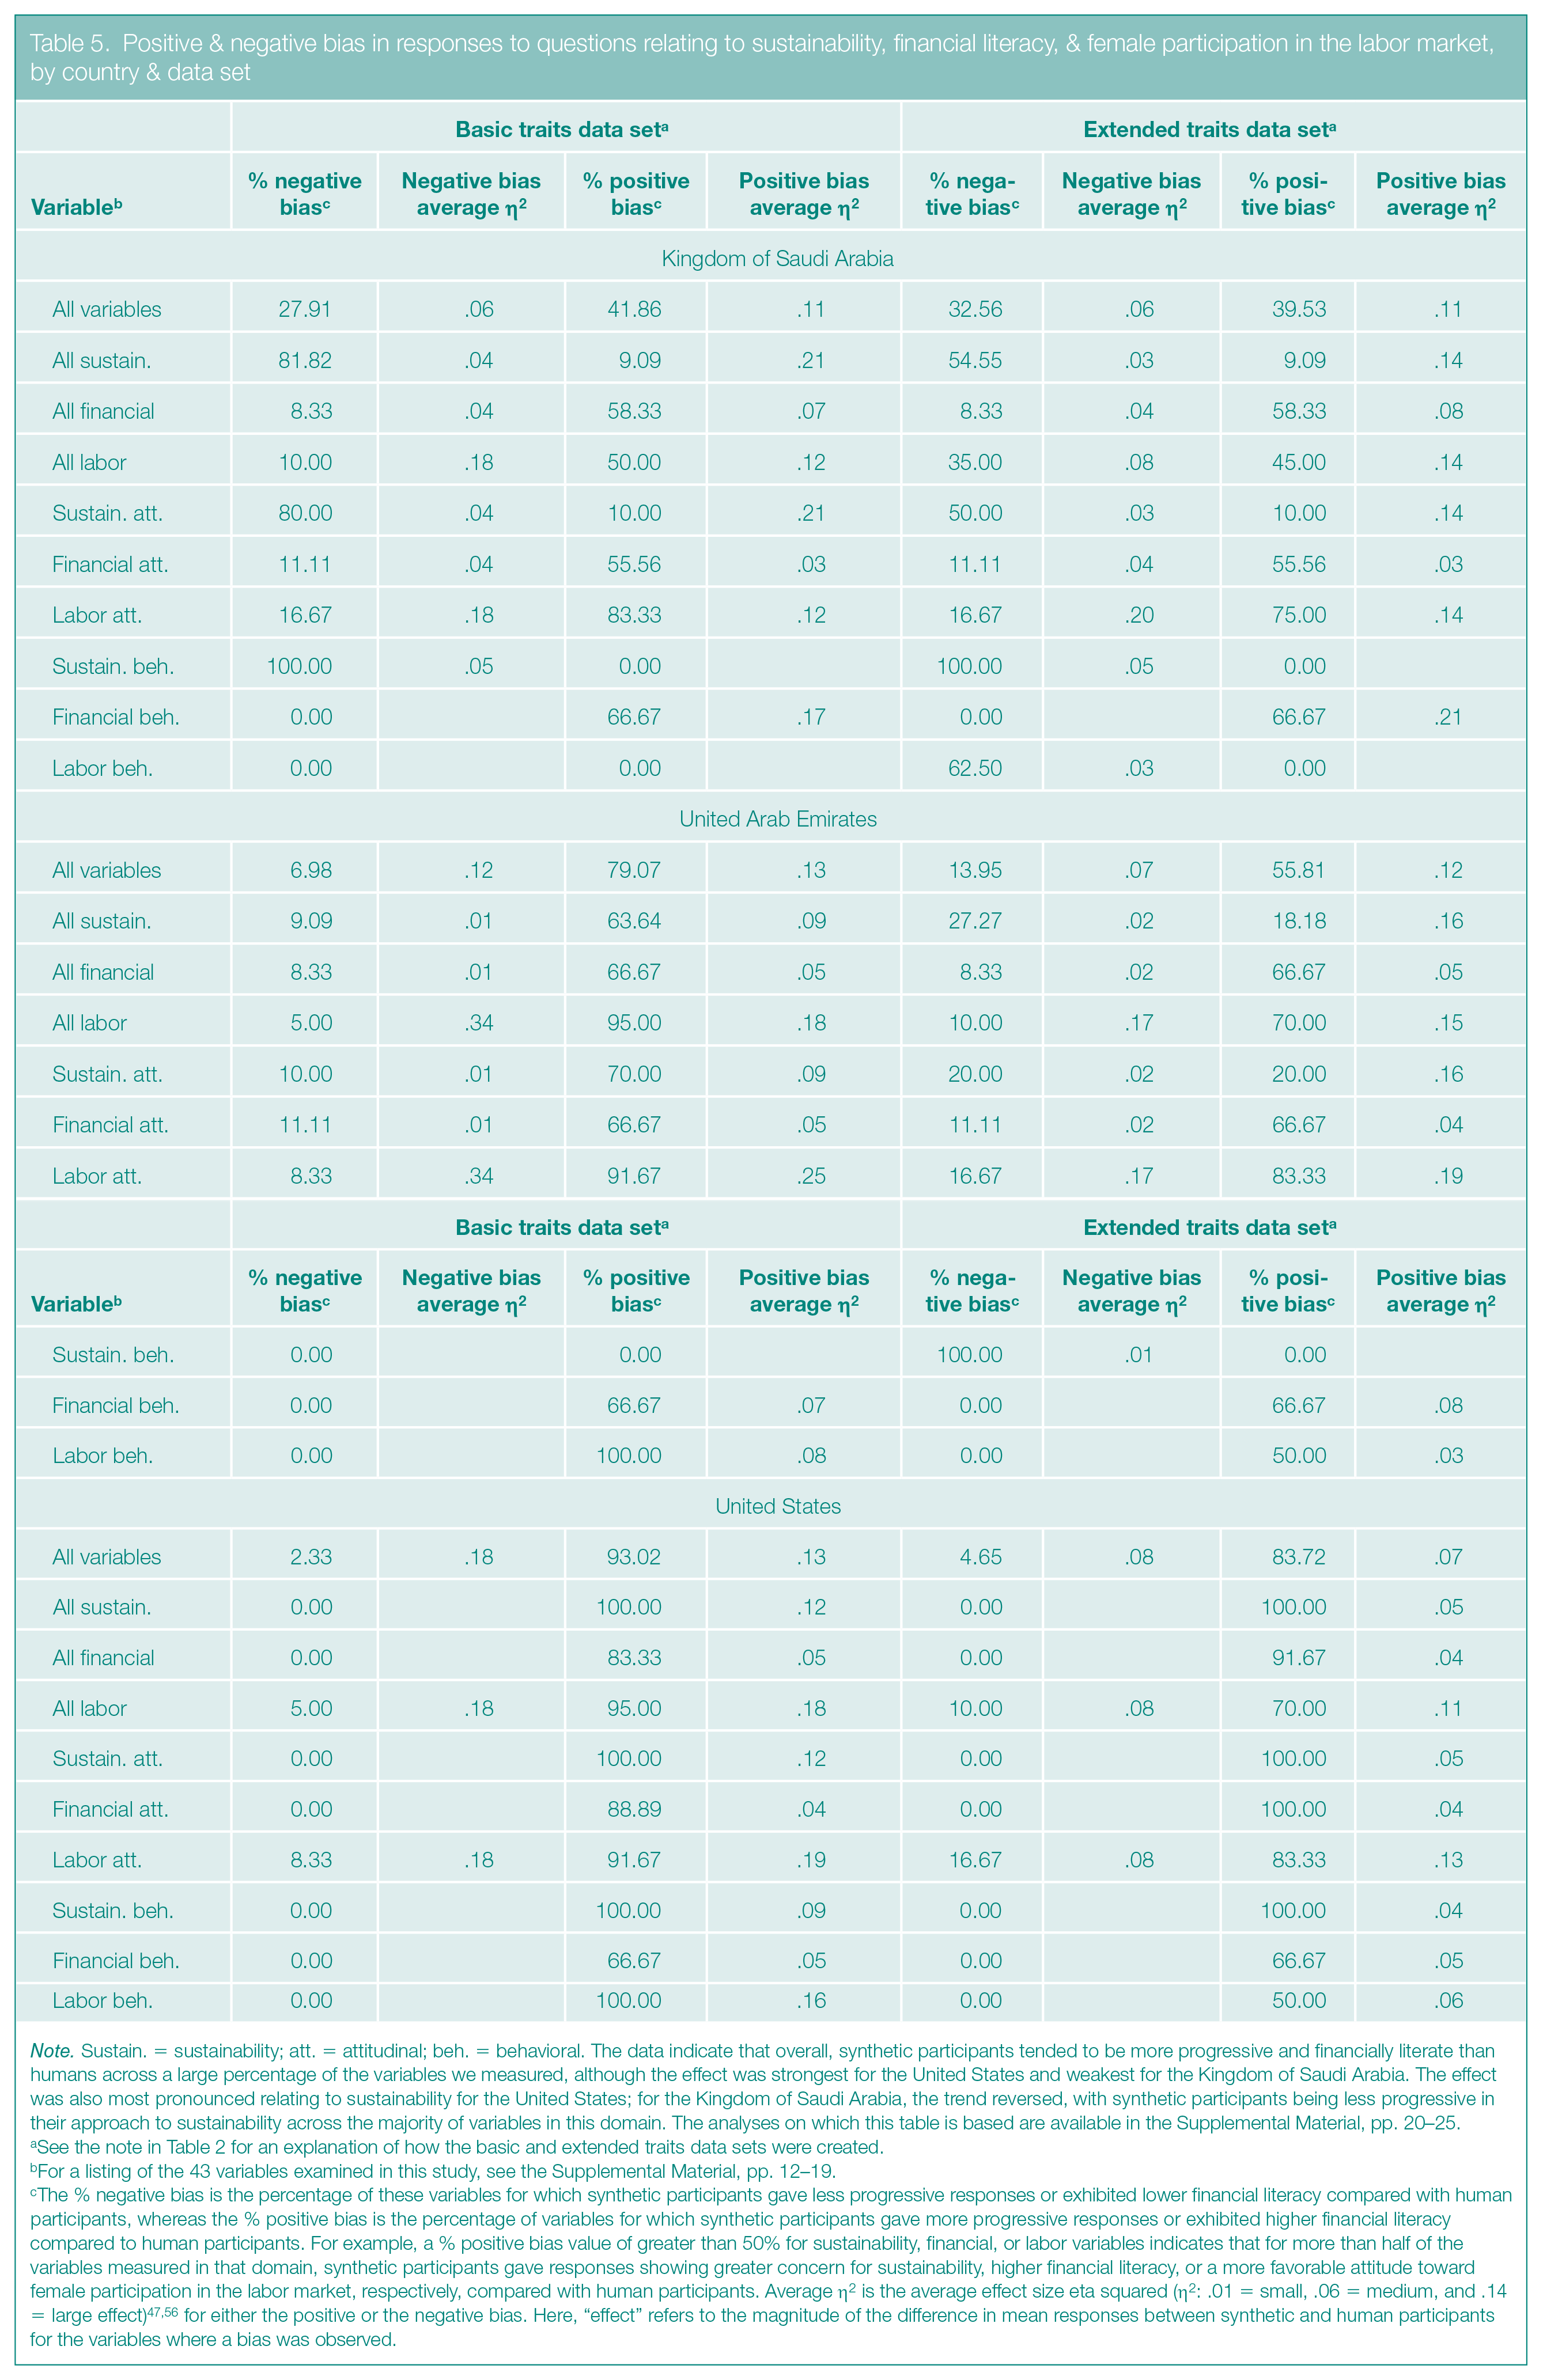
Note. Sustain. = sustainability; att. = attitudinal; beh. = behavioral. The data indicate that overall, synthetic participants tended to be more progressive and financially literate than humans across a large percentage of the variables we measured, although the effect was strongest for the United States and weakest for the Kingdom of Saudi Arabia. The effect was also most pronounced relating to sustainability for the United States; for the Kingdom of Saudi Arabia, the trend reversed, with synthetic participants being less progressive in their approach to sustainability across the majority of variables in this domain. The analyses on which this table is based are available in the Supplemental Material, pp. 20–25.
See the note in Table 2 for an explanation of how the basic and extended traits data sets were created.
For a listing of the 43 variables examined in this study, see the Supplemental Material, pp. 12–19.
The % negative bias is the percentage of these variables for which synthetic participants gave less progressive responses or exhibited lower financial literacy compared with human participants, whereas the % positive bias is the percentage of variables for which synthetic participants gave more progressive responses or exhibited higher financial literacy compared to human participants. For example, a % positive bias value of greater than 50% for sustainability, financial, or labor variables indicates that for more than half of the variables measured in that domain, synthetic participants gave responses showing greater concern for sustainability, higher financial literacy, or a more favorable attitude toward female participation in the labor market, respectively, compared with human participants. Average η2 is the average effect size eta squared (η2: .01 = small, .06 = medium, and .14 = large effect)47,56 for either the positive or the negative bias. Here, “effect” refers to the magnitude of the difference in mean responses between synthetic and human participants for the variables where a bias was observed.
Strength of responses to behavioral interventions across variables, by country, analytic approach, & data set
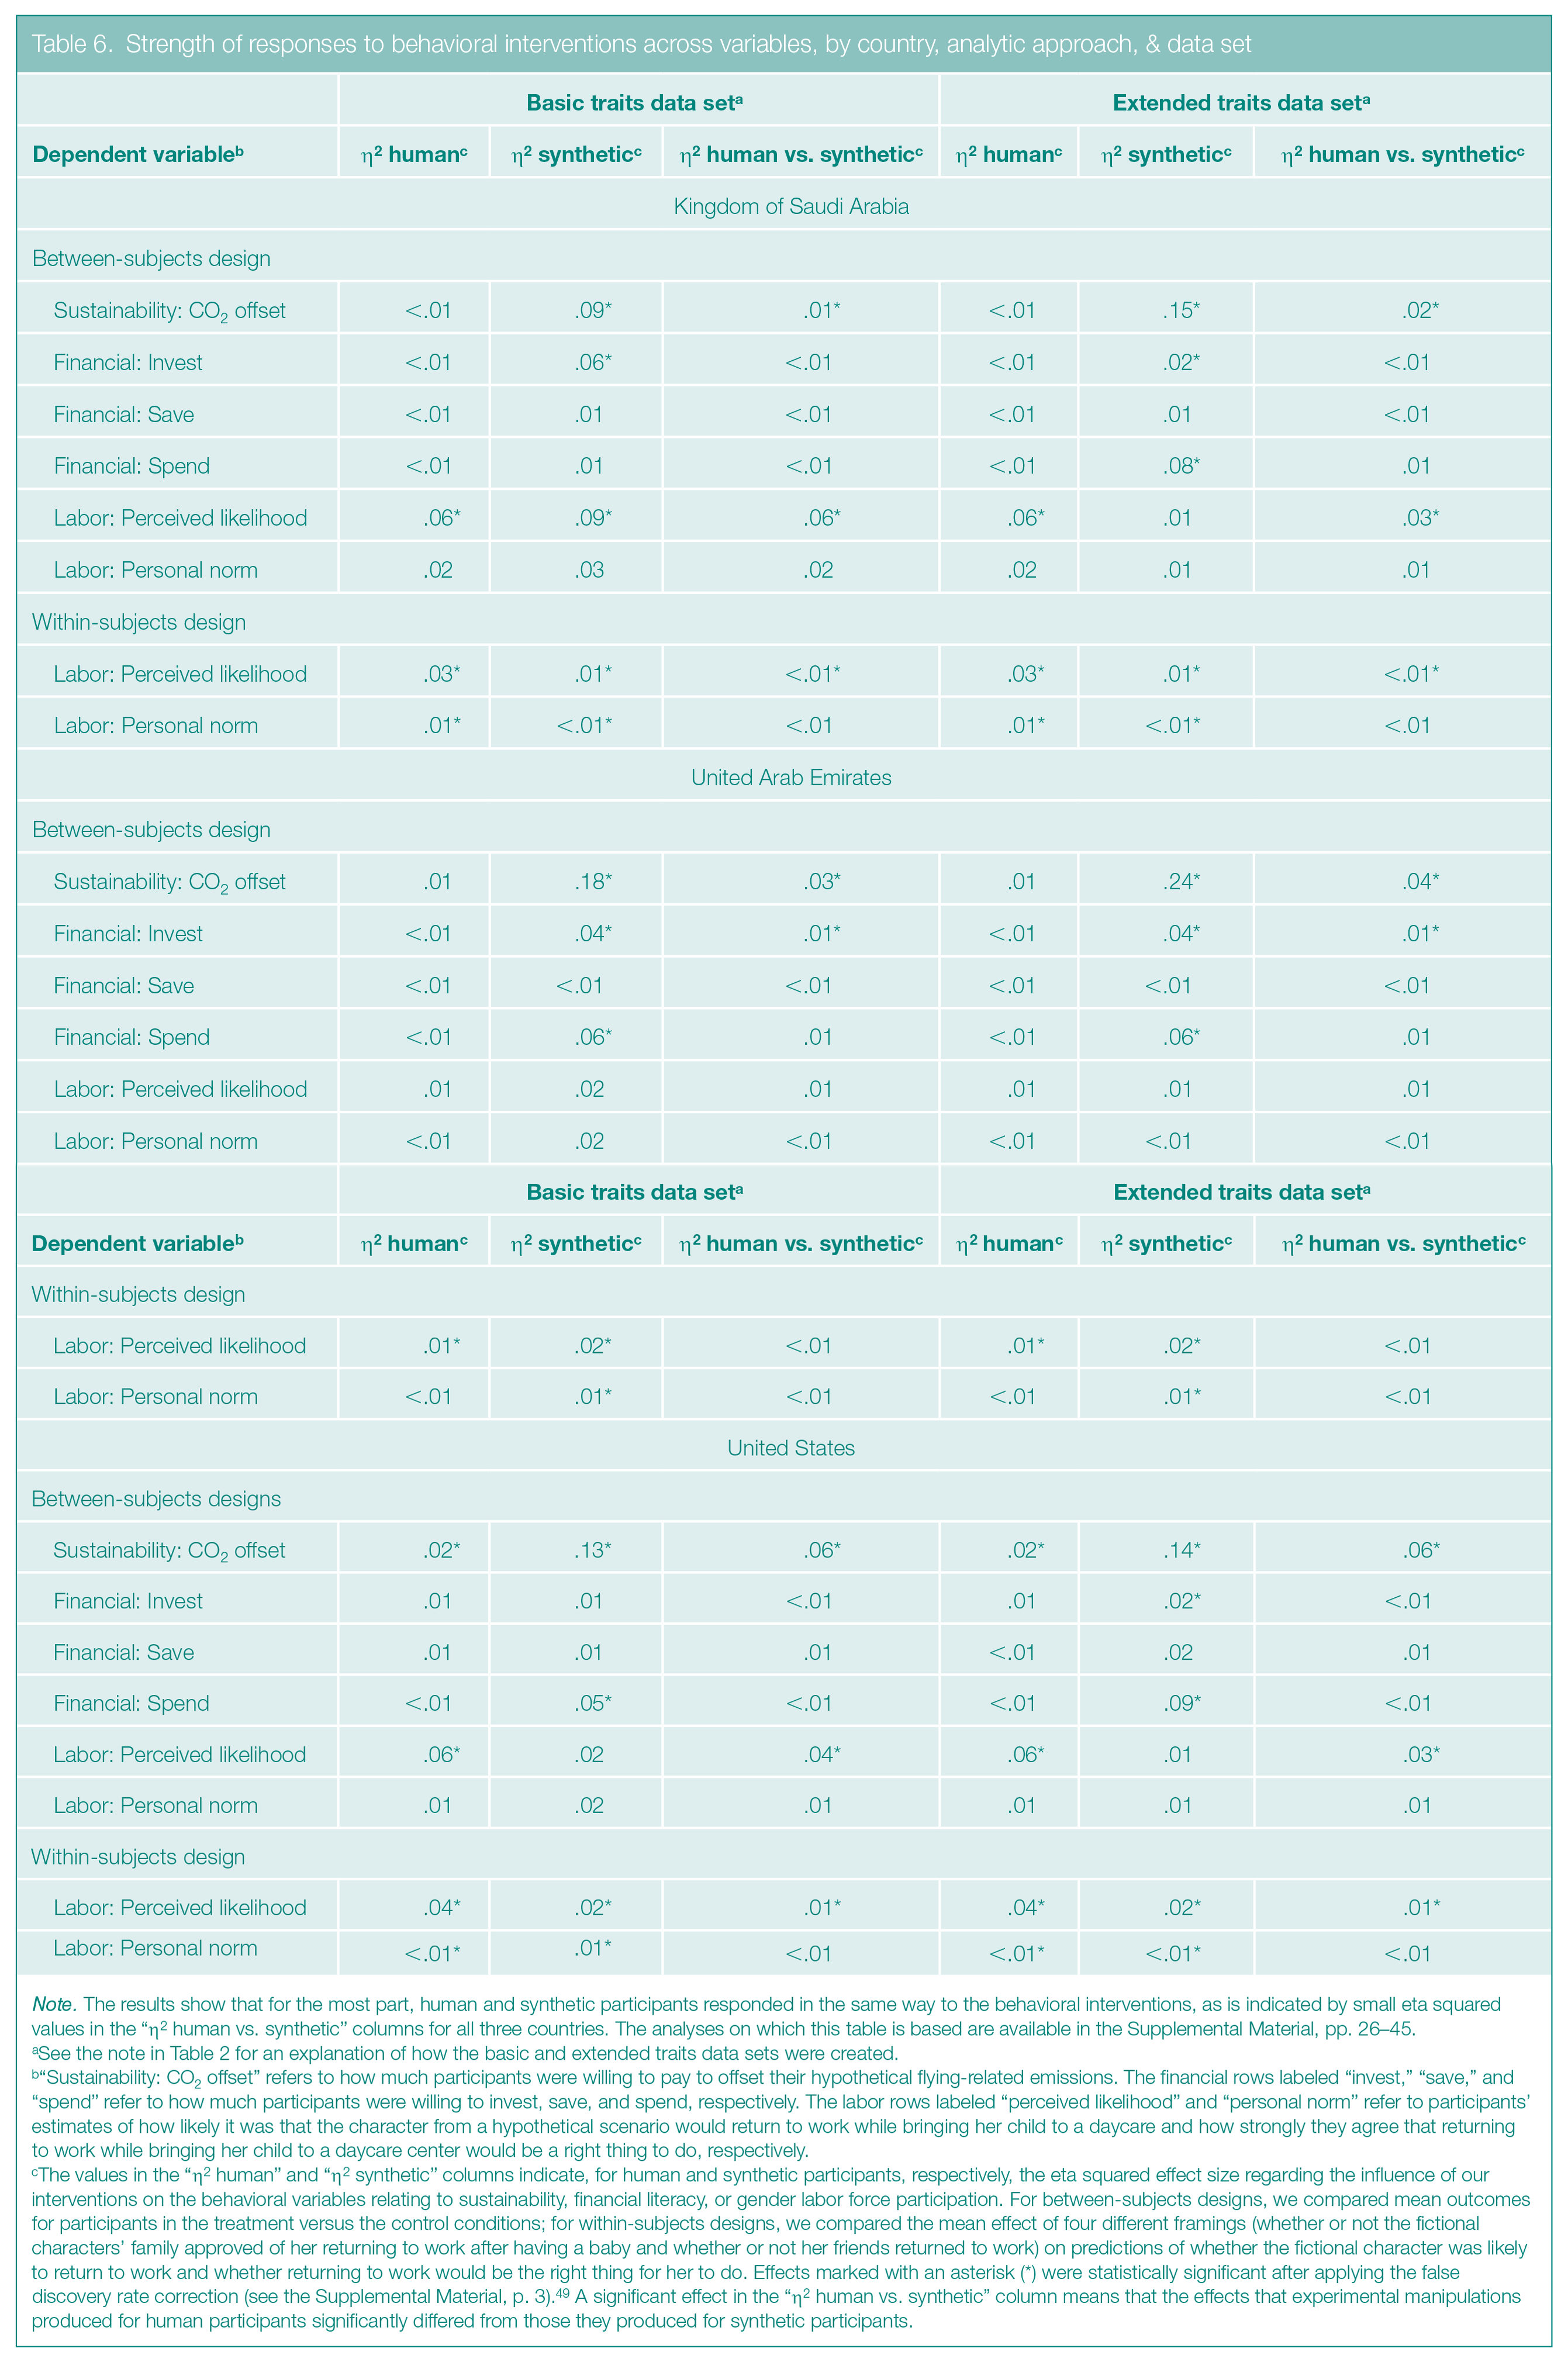
Note. The results show that for the most part, human and synthetic participants responded in the same way to the behavioral interventions, as is indicated by small eta squared values in the “η2 human vs. synthetic” columns for all three countries. The analyses on which this table is based are available in the Supplemental Material, pp. 26–45.
See the note in Table 2 for an explanation of how the basic and extended traits data sets were created.
“Sustainability: CO2 offset” refers to how much participants were willing to pay to offset their hypothetical flying-related emissions. The financial rows labeled “invest,” “save,” and “spend” refer to how much participants were willing to invest, save, and spend, respectively. The labor rows labeled “perceived likelihood” and “personal norm” refer to participants’ estimates of how likely it was that the character from a hypothetical scenario would return to work while bringing her child to a daycare and how strongly they agree that returning to work while bringing her child to a daycare center would be a right thing to do, respectively.
The values in the “η2 human” and “η2 synthetic” columns indicate, for human and synthetic participants, respectively, the eta squared effect size regarding the influence of our interventions on the behavioral variables relating to sustainability, financial literacy, or gender labor force participation. For between-subjects designs, we compared mean outcomes for participants in the treatment versus the control conditions; for within-subjects designs, we compared the mean effect of four different framings (whether or not the fictional characters’ family approved of her returning to work after having a baby and whether or not her friends returned to work) on predictions of whether the fictional character was likely to return to work and whether returning to work would be the right thing for her to do. Effects marked with an asterisk (*) were statistically significant after applying the false discovery rate correction (see the Supplemental Material, p. 3). 49 A significant effect in the “η2 human vs. synthetic” column means that the effects that experimental manipulations produced for human participants significantly differed from those they produced for synthetic participants.
Alignment Between Human & Synthetic Responses
Overall, we found that human and synthetic participants answered the survey questions similarly, although we also saw some differences between countries in how closely human and synthetic participants aligned with each other.
In one set of analyses, we assessed the alignment between human and synthetic responses on the entire set of 43 variables (that is, the combined attitudinal and behavioral questions) without separating the behavioral replies from the control and treatment groups (see Table 4; the full output is in the Supplemental Material, pp. 20–25).
First, in line with previous research, 7 we aggregated (that is, averaged) human and synthetic responses for each of the 43 variables and measured the correlations between these averages using the Pearson correlation (see note A and the notes in Tables 4, 5, and 6 for explanations of the statistical terms used in this article). The correlations for all countries were strong (r ≥ .50; 47 see Table 4), meaning that the human and synthetic responses, on average, strongly covary; that is, as human scores increase or decrease, synthetic scores increase or decrease as well. Although we found strong correlations between human and synthetic participants for each of the three countries, those for the United States were stronger than those for the non-WEIRD nations, and those for the UAE were stronger than those for the KSA (see Table 4).
Next, to gain more precise information about the extent of the alignment between human and synthetic participants, we also measured the degree of similarity between the average human and synthetic responses across the 43 variables, using between-subjects analysis of variance (ANOVA) tests. These tests revealed the degree of differences in terms of eta squared (η2), indicating the proportion of variation in respondents’ answers—ranging from 0 (0%) to 1 (100%)—that could be attributed to whether a participant was human or synthetic. Small effect sizes (that is, η2 close to or smaller than .01 and not larger than .06) would indicate that differences between human and synthetic responses are minimal, showing high similarity, on average.
For participants representing each of the three nations, we mostly found medium effect sizes (η2 close to or larger than .06 but not exceeding .14; see Table 4). In other words, the means for human and synthetic participants tended to be somewhat different although broadly in the same direction (that is, if the humans agreed with a statement, the synthetic participants might have strongly agreed but did not disagree). The medium eta squared values indicate that the ability of synthetic participants to mimic human responses is fairly good but could stand to be improved.
In addition to that set of analyses, we conducted another test to further understand how well human and synthetic responses matched. We used between-subjects ANOVAs to examine whether the responses of synthetic participants exhibited a positive or negative bias relative to the responses of the human participants. For example, a response to the sustainability variable reflected a positive bias if it indicated that sustainability was more important to the synthetic participants than to the human participants, as shown by synthetic participants having statistically significant higher mean scores for prosustainability statements (such as “People need to change their behavior to prevent climate change”) or statistically significant lower mean scores for antisustainability statements (such as “Climate change and environmental problems are exaggerated”). Conversely, a response reflected a negative bias if it showed sustainability was less important to the synthetic participants than to the human participants, as indicated by statistically significant lower mean scores for prosustainability statements or statistically significant higher mean scores for antisustainability statements. Overall, a positive bias in the sustainability or labor realm indicated that synthetic participants held more progressive views than human participants did, whereas a negative bias signaled less progressive views. A positive bias in the financial literacy realm meant that synthetic participants showed more financial competence than the human participants did, and a negative bias meant they displayed less financial competence.
As a rule and as is shown in Table 5, when responses relating to all three policy domains were aggregated, the proportion of positive bias was higher than the proportion of negative bias—in other words, the percentage of survey questions to which synthetic participants gave more progressive responses than humans did was higher than the percentage of questions to which the synthetic participants gave less progressive responses. This trend was most pronounced for the United States, where a positive bias in the basic traits data set was observed across 93.02% of the 43 survey questions and a negative bias was observed across 2.33% of those variables, but it was also notable for the UAE, with results of 79.07% and 6.98% for positive and negative bias, respectively. For the KSA, this trend was less pronounced, with a positive bias observed for 41.86% of the variables and a negative bias for 27.91% of them.
We found biases in each of the three individual policy domains, but the trends differed by country (see Table 5). The largest discrepancy in responses that occurred between the U.S. participants and the two non-WEIRD participant samples appeared in the sustainability domain: U.S. and UAE synthetic participants were more progressive than their human counterparts were for a large percentage of the variables we measured (synthetic participants from the United States showed a positive bias in their responses to 100% of the questions and negative bias in their responses to 0% of the questions; for the UAE, the numbers were 63.64% and 9.09%); the trend reversed for the KSA (where positive bias appeared in only 9.09% of responses and negative bias appeared in 81.82% of responses). In the financial realm, response discrepancies also occurred between the U.S. participants and each of the two non-WEIRD participant samples, but the discrepancies were less pronounced than they were in the sustainability domain. With respect to female participation in the labor force, we found WEIRD versus non-WEIRD discrepancies only between the U.S. and KSA participants, with a much greater proportion of responses showing synthetic U.S. participants to be more progressive than their human counterparts, compared with the lower proportion of progressive synthetic KSA participants. (The UAE profile matched that of the United States.)
The magnitude of the biases tended toward medium effect sizes. This means that, on average, synthetic participants’ responses indicated moderately higher progressiveness or financial literacy in cases of positive bias and moderately lower progressiveness or financial literacy in cases of negative bias, relative to their human counterparts across the policy domains.
The Effect of Experimental Interventions on Human Versus Synthetic Participants
When we turned to whether our experimental interventions affected responses to the behavioral variables, we found that, in general (as is shown in Table 6), the human and synthetic participants were aligned. Indeed, the effects of the interventions for the two participant types were similar, and any differences between these effects were mostly small and rarely statistically significant (see the “η2 human vs. synthetic” columns in Table 6).
However, regardless of these small differences, it was not possible to accurately predict, based on synthetic participants, when an intervention would be statistically significant for human participants. In other words, when an intervention’s effect on a specific behavioral variable was statistically significant for synthetic participants, it often was not significant for human participants, and vice versa.
Discussion
Shortly after Chat GPT’s launch, 1 behavioral researchers began exploring whether this and other LLMs could mimic humans, which generated a great deal of hype about synthetic participants potentially replacing humans in domains where assessing opinions is crucial.6,7 In our study, we found that when responses to all policy-related questions were aggregated, the alignment between human participants and their synthetic counterparts was reasonably good for all the groups we studied (that is, groups from the KSA, UAE, and United States). Indeed, the aggregate correlations between human and synthetic responses were strong and the responses were fairly (although not perfectly) alike (see Table 4). Moreover, our interventions affected the behavioral responses of human and synthetic participants similarly (see Table 6).
Nevertheless, we identified two main weaknesses in the ability of synthetic participants to match human responses to surveys. For one, the GPT often lacked precision: The mean differences between human and synthetic responses across the set of 43 survey questions were not small (as indicated by the medium η2 values; see Table 4), and the effects of our interventions on behavioral variables that were statistically significant for humans were often not significant for synthetic participants and vice versa (see Table 6). Two, the degree of alignment between human and synthetic participants from the United States somewhat differed from the alignment in the non-WEIRD participant samples: For the UAE and KSA, the aggregate correlations were generally weaker (see Table 4), and the broad tendency of synthetic participants to be more progressive and financially literate than the humans was less pronounced (see Table 5).
Policy Recommendations
Next, we list several policy implications of our findings. See Table 3 for a discussion of the rationale behind the recommendations.
Synthetic participants can serve as a good approximation of human participants for preliminary testing and piloting of policy-relevant views and interventions in the KSA, UAE, and United States.
In more advanced stages of policy development and testing—when it is important to fine-tune policies by understanding their effect on the human population—it is advisable to use human rather than synthetic participants.
When using synthetic participants in policy research, be mindful of potential biases they might have, such as possibly being more progressive than their human counterparts. These biases may differ between WEIRD and non-WEIRD countries.
When creating synthetic participants, instructing the software to define participants according to a simple set of traits may be as or more effective than using more detailed prompts in certain cases. However, because this insight is based on the prompts we used in the present research (see the Supplemental Material, pp. 4–6), it will need to be further investigated with a wide range of prompts and in relation to different policy areas.
Study Limitations
One critical issue we did not examine in our study is how synthetic participants respond to real-time shifts in public opinion, particularly those arising from sudden or significant events, such as terror attacks or pandemics. In real life, such changes can occur rapidly and strongly affect public views on policy-relevant questions. It is possible that the opinions expressed by synthetic participants may not evolve as quickly as those of human participants. It would be useful for researchers to investigate this issue.
We also recognize that it is important to examine the constraints on the generalizability of our research. 50 Across the three policy domains of interest, we used a broad range of attitudinal and behavioral items; we either adopted them from various sources or created them from scratch (see the Supplemental Material, pp. 12–19). We expect our findings to generalize to the type of survey questions we used within the policy domains we explored. Nevertheless, GPTs’ responses to various survey questions or scenarios may vary depending on whether this or related content is present in their training data.51,52 Therefore, if more researchers begin studying whether synthetic participants can predict human responses to policy-relevant questions, the training data may increasingly contain information on how synthetic participants respond to various policy issues. Consequently, efforts to replicate our study could yield different findings.
As we have already mentioned, we did not recruit representative samples of participants but instead ensured that the ratio of resident nationals to foreign residents in the samples from the three countries was broadly in keeping with the ratios in their actual populations (see the Supplemental Material, pp. 7–8). We did not consider sample representativeness to be crucial in our study because our project—the first to investigate the alignment between human and synthetic participants from both WEIRD and non-WEIRD countries on policy-relevant questions—was essentially exploratory. Our aim was to gather preliminary evidence assessing this alignment rather than to conclusively answer more complex questions, such as whether alignment depends on population representativeness or which specific demographics might drive any differences. Future researchers can address these and similar questions as this field develops. Additionally, our findings should not be assumed to extend to non-WEIRD countries outside the KSA and UAE, as our research focused specifically on those two nations.
Conclusion
In spite of the study’s limitations, we are encouraged by the similarities we found in the responses to policy-related survey questions given by synthetic and human participants and that the similarities appeared in the responses of participants from non-WEIRD as well as WEIRD nations. We hope our findings and the open scientific questions will inspire researchers to further investigate the feasibility of using synthetic participants in the policy domains we explored as well as in other areas (such as public health, consumerism, and risk behavior)—and to do so in multiple non-WEIRD countries.
Supplemental Material
sj-docx-1-bsx-10.1177_23794607241311793 – Supplemental material for Beyond WEIRD: Can synthetic survey participants substitute for humans in global policy research?
Supplemental material, sj-docx-1-bsx-10.1177_23794607241311793 for Beyond WEIRD: Can synthetic survey participants substitute for humans in global policy research? by Pujen Shrestha, Dario Krpan, Fatima Koaik, Robin Schnider, Dima Sayess and May Saad Binbaz in Behavioral Science & Policy
Footnotes
Declaration of Conflicting Interests
The author(s) declared the following potential conflicts of interest with respect to the research, authorship, and/or publication of this article: Pujen Shrestha, Fatima Koaik, Robin Schnider, and Dima Sayess are affiliated with the Ideation Center, a think tank for the consulting firm Strategy&. These affiliations had no influence on the design, execution, analysis, or interpretation of this study.
Funding
The author(s) disclosed receipt of the following financial support for the research, authorship, and/or publication of this article: The research was funded by the Ideation Center, Strategy& Middle East.
Notes
References
Supplementary Material
Please find the following supplemental material available below.
For Open Access articles published under a Creative Commons License, all supplemental material carries the same license as the article it is associated with.
For non-Open Access articles published, all supplemental material carries a non-exclusive license, and permission requests for re-use of supplemental material or any part of supplemental material shall be sent directly to the copyright owner as specified in the copyright notice associated with the article.