
Abstract
The author investigates whether the Great Migration closed or mitigated racial disparities in career advancement. Using linked historical census data, tracking individuals from the early twentieth century, the author analyzes the occupational mobility of Black and White men who came of age during the Great Migration. The author uses two longitudinal analyses of occupational status over a 30-year period (e.g., 1900–1930 and 1910–1940) to compare career trajectories across racial and migratory groups. The results show that Black men who left the Jim Crow South for northern states—rapidly growing industrial areas in particular—experienced the same level of career mobility as those who remained in the South. Furthermore, northern Black men attained higher occupational status than southern Black men who had migrated to the North, indicative of a career mobility ceiling experienced by Black migrants. While starting their careers at different occupational levels, White men enjoyed significantly greater career mobility in both the South and the North. These findings imply that the Great Migration, despite escaping the worst versions of Jim Crow, maintained racial gaps in career mobility. This descriptive longitudinal account of occupational attainment underscores the durable impact of racialized opportunity structures even amid economic modernization.
Attempting to escape apartheid and extreme poverty in southern states, more than 6 million African Americans migrated to northern cities during the 1910s and 1920s, a demographic movement known as the Great Migration. 1 Tolnay (2003) emphasized that push factors in the Jim Crow South—extreme economic hardship and racial oppression—drove the Great Migration. For example, plantation sharecropping and rigid job segregation left most African Americans landless and stuck in low-wage work, while Jim Crow disenfranchisement, poor schools, and even lynching violence made life untenable. In addition, pull factors in northern cities, especially World War I–era factory labor shortages and new industrial jobs, lured migrants with the promise of better wages.
Research has shown that this migratory population was heterogeneous in terms of residential origins (both urban and rural), levels of literacy, and migration motivations (Alexander 1998; Maloney 2002; Marks 1989). Southern Black migrants settled disproportionately in the rapidly growing urban and industrial centers of the Midwest—such as Chicago, Detroit, Milwaukee, and Cincinnati—reshaping the demographic composition of northern states (Tolnay 2003). However, Black individuals who migrated North still faced high levels of poverty and residential segregation (Duncan and Lieberson 1959; Hauser 1965; Lieberson 1963; Restifo, Roscigno, and Qian 2013; Walters and Briggs 1993) and were largely excluded from higher education (Du Bois 1900; Duncan and Duncan 1968).
This study focuses on career mobility inequalities—the sequential progression of labor market positions as indicated by “occupational status” across the life course—for generations born between the abolition of slavery in 1865 and the civil rights era. During this period, virtually all Black Americans faced systemic oppression under Jim Crow laws, which were far more severe in the southern United States (Margo 2007; Massey and Denton 1993; Meeker and Kau 1977).
Despite long-standing debates over the push and pull factors that shaped the Great Migration (Tolnay 2003), many scholars have attributed the seemingly upwardly mobile careers of Black migrants to more favorable sociopolitical and economic conditions in the North (Frazier 1957). Northern states are thought to have offered better access to expanding industrial hubs, primarily in automotive production and steel manufacturing, and relatively fewer discriminatory barriers in the labor market. In this view, Black workers in the North experienced steeper occupational trajectories than their southern counterparts (Taeuber and Taeuber 1958 [1964]). This interpretation also aligns with the “logic of industrialism” (Feldman and Feldman 1969; Kerr et al. 1960; Levy 1966; Treiman 1970), which posits that disadvantaged groups, such as Black Americans in the early twentieth century, stand to benefit from modernization and economic growth.
This study revisits that interpretation using newly available linked historical census data from the early twentieth century to descriptively assess complete career trajectories. I examine career mobility gaps between southern Black men who migrated North, southern Black men who never migrated North during their work lives, northern Black men, southern White men, and northern White men. Career mobility is defined as the extent to which individuals attain progressively higher socioeconomic positions (i.e., occupations) after initial labor market entry. The ideal type pattern is a growth curve, reflecting workers’ continuous adaptation to, and benefiting from, industrial and labor market changes.
Most prior research on racial inequality in occupational attainment during the Great Migration relies on cross-sectional data, such as the Integrated Public Use Microdata Samples. Analyses of the 1920 1 percent census sample confirm steep racial hierarchies in the labor market: Black men, including southern migrants to the North, had substantially lower average Duncan socioeconomic index (SEI) scores and were less likely to hold white-collar jobs than European immigrants (Adelman and Tolnay 2003). In the same data, Tolnay (2001) showed that among Black men living in northern states, those born in the South exhibited disadvantages in labor force participation and occupational status (SEI). For a later period, examining censuses between 1940 and 1980, Eichenlaub, Tolnay, and Trent Alexander (2010) also cast doubt on whether leaving the South benefited the occupational status of Black men.
Yet these studies could not observe career mobility because they compared levels SEI levels for Black migrants and nonmigrants at a single point in time. Most historical mobility analyses use only two observations per individual (e.g., first and current occupation), which limits inference about inequalities within career growth. In contrast, this study provides a descriptive contribution by tracing multidecade occupational trajectories for key combinations of race and migratory status. Using full-count censuses linked across multiple successive ones between 1900 and 1940, I (1) observe SEI trajectories over the life course, (2) compare career progression between southern Black migrants and southern Black nonmigrants, and (3) examine racial disparities in career mobility within both northern and southern regions in the first four decades of the twentieth century (i.e., while the Great Migration unfolded).
In doing so, this study extends the literature in two ways. First, it explicitly combines race and domestic migration status to assess how their joint configuration shaped career trajectories in the early Great Migration. Second, by focusing on the 1900–1940 period it complements Boustan’s (2016) Competition in the Promised Land, which analyzes the later Second Great Migration (1940–1970), when millions of Black Americans moved into established northern Black communities and transformed postwar urban labor and housing markets. The analysis captures earlier cohorts of southern migrants, born only a few decades after the abolition of slavery, who came of age before the mid-twentieth-century industrial expansion, and asks whether moving North altered their occupational status trajectories.
Data and Analytical Approach
Individual-level data are drawn from historical U.S. censuses (Ruggles et al. 2024) to observe men’s occupational status early and later in their working lives. I construct two cohort panels by linking individuals across multiple census years: one cohort is first observed in 1900 and again in 1910, 1920, and 1930 (born 1874–1881), and a second cohort is first observed in 1910 and again in 1920, 1930, and 1940 (born 1884–1891). These 30-year intervals capture a substantial portion of the career span, from young adulthood into late career.
From the full-count 1900 census and 1910 census, I draw men who were employed, not enrolled in school, 19 to 26 years old, and born in the United States or Canada (as well as their parents). 2 Only male respondents are selected because female labor market participation was still low before World War I. I then a build panel dataset by using the Integrated Public Use Microdata Samples Multigenerational Longitudinal Panel (MLP) crosswalks (Helgertz, Price, et al. 2020; Ruggles et al. 2025). The MLP crosswalk uses a probabilistic method to link individuals between any two censuses. It first selects all potential matches on the basis of sex, birthplace, and birth year (±3 years) and then scores name agreement using Jaro-Winkler similarity (≥0.70) in first and last names (Helgertz, Ruggles, et al. 2020). 3 Successful links receive a unique historical identifier for individuals observed in two consecutive censuses. Repeating this procedure produces longitudinal datasets of men first observed in 1900 (through 1930) and in 1910 (through 1940). These de facto panels capture the multidecade occupational trajectories for the 1874–1881 and 1884–1891 cohorts.
Table 1 presents information on data selection, linkage, and attrition. The leftmost column lists the baseline year population of interest: n = 962,789 (1900 census) and n = 1,239,508 (1910 census). These individuals are successfully linked to the subsequent three censuses at average rates of 39.6 percent and 41.3 percent, respectively, which is consistent with methodological reports of 40 percent to 50 percent between any two censuses (Ruggles et al. 2025). Although the linkage rate is similar for different early-career class positions, Black men (≈21 percent) are linked at a lower rate than White men (≈42 percent), which has been documented in the literature (Nelson 2025). Within racial groups, southern and northern residents report similar MLP match percentages: the key comparison groups. The analysis retains individuals with nonzero SEI in all three follow-up censuses, yielding analytical samples of 255,167 (1900–1930, born 1874–1881) and 360,500 (1910–1940, born 1884–1891). This selection necessarily excludes men who died or emigrated before 57 years of age.
Historical Census Linkages and Analytical Sample Selection.
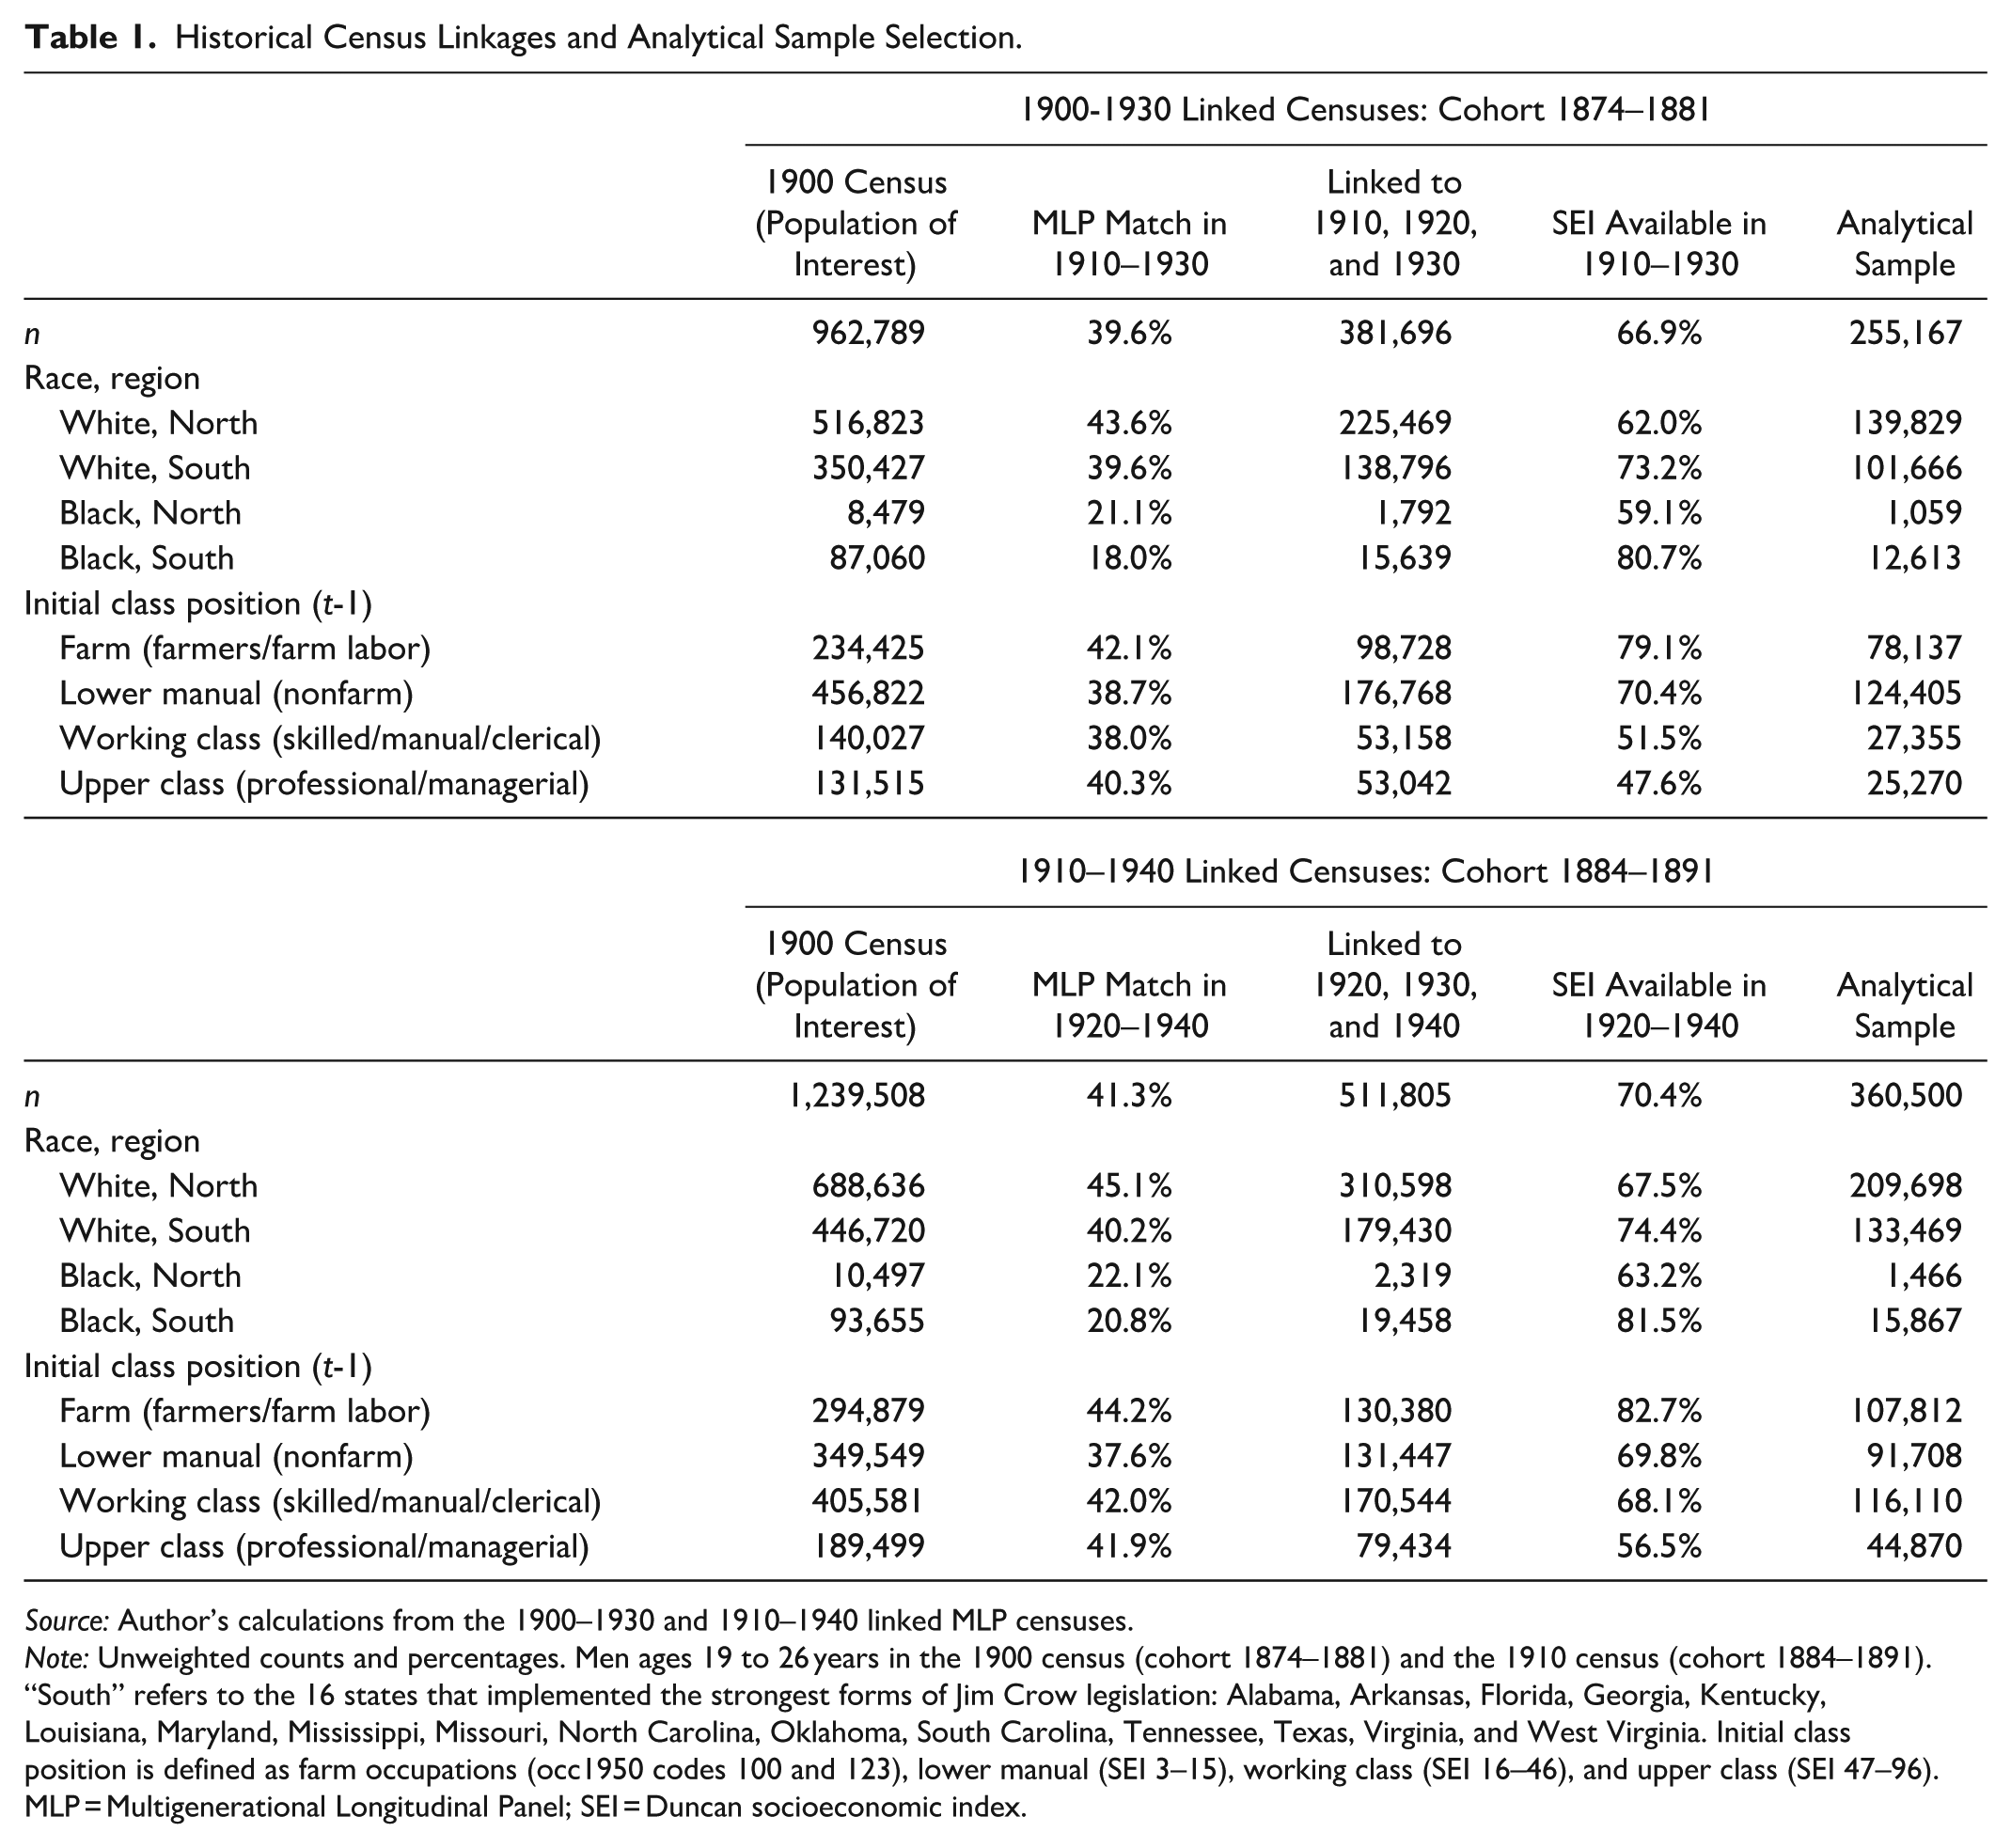
Source: Author’s calculations from the 1900–1930 and 1910–1940 linked MLP censuses.
Note: Unweighted counts and percentages. Men ages 19 to 26 years in the 1900 census (cohort 1874–1881) and the 1910 census (cohort 1884–1891). “South” refers to the 16 states that implemented the strongest forms of Jim Crow legislation: Alabama, Arkansas, Florida, Georgia, Kentucky, Louisiana, Maryland, Mississippi, Missouri, North Carolina, Oklahoma, South Carolina, Tennessee, Texas, Virginia, and West Virginia. Initial class position is defined as farm occupations (occ1950 codes 100 and 123), lower manual (SEI 3–15), working class (SEI 16–46), and upper class (SEI 47–96). MLP = Multigenerational Longitudinal Panel; SEI = Duncan socioeconomic index.
Sample selection on employment (nonzero SEI at all follow-ups) differs across groups. Among Black men, 59.1 percent of northern residents versus 80.7 percent of southern residents are retained (1900–1930 panel, similar rates for 1910–1940). Because exclusion is concentrated among those with no reported occupation, the retained subsample of northern Black men is more positively selected on sustained employment. Consequently, among Black men, the North-South differences in SEI levels and slopes should be interpreted as the upper bounds of any northern advantage.
To address selective linkage and attrition across successive censuses, I construct sequential stabilized inverse probability weights (IPWs) that model the probability of an individual being successfully linked from one census to the next. For each linkage (1900–1910, 1910–1920, 1920–1930, etc.), a logistic regression of successful linkage is fitted on key baseline covariates including age, marital status, relationship to household head, urban residence, occupation, and birthplace region. This generates predicted probabilities of linkage, which are inverted to form weights for linked individuals. Following Bailey, Cole, and Massey (2020), stabilized weights are calculated by multiplying the marginal probability of linkage by the inverse of the predicted probability, which reduces variance relative to unstabilized IPWs. The stabilized weights from each linkage are then multiplied together to form a panel weight. 4 This procedure reweights the longitudinal sample to represent the baseline population while accounting for differential probabilities of linkage and survival across multiple censuses. From here on, all reported figures are weighted.
In addition to race, key time-varying sociodemographics are drawn from each census: occupational status (SEI), age, state of residence, school enrollment (binary), marital status (never married, married, divorced, and widowed), and parenthood (number of children in the household). Table 2 presents weighted descriptive statistics for all variables used. All models condition only on a parsimonious set of variables—school enrollment, marital status, and parenthood—because these shape labor supply and occupational access at these ages (Schulz and Maas 2012) and may vary across racial or migration groups. Table 2 further shows average career progression between respondents’ early 20s and late 50s, as well as expected life-course patterns in marital status and parenthood. Comparing initial class position (t-1) across the 1874–1881 and 1884–1891 cohorts also highlights the dramatic early twentieth-century economic transformation: substantially more men entered the working class rather than the lower manual class.
Descriptive Statistics of Analytical Samples.

Source: Author’s calculations from the 1900–1930 and 1910–1940 linked Multigenerational Longitudinal Panel censuses.
Note: Inverse probability weights are applied to adjust for differential linkage or attrition across censuses, reweighting the linked sample to the population of interest. Weights are constructed by the author following Bailey et al. (2020). Men ages 19 to 26 years in the 1900 census (cohort 1874–1881) and the 1910 census (cohort 1884–1891). “South” refers to the 16 states that implemented the strongest forms of Jim Crow legislation: Alabama, Arkansas, Florida, Georgia, Kentucky, Louisiana, Maryland, Mississippi, Missouri, North Carolina, Oklahoma, South Carolina, Tennessee, Texas, Virginia, and West Virginia. Initial class position is defined as farm occupations (occ1950 codes 100 and 123), lower manual (SEI 3–15), working class (SEI 16–46), and upper class (SEI 47–96). SEI = Duncan socioeconomic index.
SEI
Career mobility, the focus of the study, is measured using the SEI, a continuous, hierarchical indicator of occupational socioeconomic standing (Duncan 1961). The SEI combines occupation-level education and income from the 1950 U.S. census and is assigned by mapping reported occupations to occ1950. It has been widely used in research on intragenerational mobility (Kalleberg and Mouw 2018). The SEI scale is fixed (0–96 and 3–96 among valid occupations), so within-person changes reflect occupational moves rather than rescaling. Although the SEI correlates with occupational prestige scores (Stricker 1988), the two are conceptually distinct: SEI more directly captures economic standing. The relative ordering is also fairly stable over time (Featherman and Hauser 1977; Hauser and Warren 1997), supporting comparisons of occupational status trajectories over the 40-year window studied. 5
Model
I estimate hierarchical linear growth curve models, also known as multilevel models or hierarchical linear models, which allow for random intercepts (Raudenbush and Bryk 2002). This approach is commonly used in analyses of occupational careers, specifically the SEI slope, with random intercepts for individuals and geographical areas (e.g., Schulz and Maas 2010). Hierarchical linear models also help address clustering of standard errors at each observation level, which in this study are individuals (level 1), who are nested in states (level 2).
The key independent variable combines race and domestic migration pathways, creating five categories for individuals with no recent international migratory background: northern White, southern White, northern Black, southern Black (never migrated), and southern Black (who migrated North during their adult lives). “Southern” refers to the 16 states that implemented the strongest Jim Crow legislation (Higgs 1977). 6 For these five categories, both respondents and their parents were born in the United States or Canada. Thus, the analysis concentrates on racial (Black-White) career growth gaps and excludes comparisons with recent (European) immigrant groups.
Equation 1 is used to fit growth curve models that are based on respondents’ age, interacted with the five-category race/migration variable:

where SEI
ijt
indicates occupational status of individual i, residing in state j, observed at time t (i.e., census year). The time-varying level 1 variables include individual’s age and all other sociodemographic control variables (
Results
Growth Curves
As expected, there is descriptive evidence of the Great Migration of Black Americans from the Jim Crow South in the early twentieth century. Using two cohort panels of linked censuses, among Black men ages 19 to 26 years and residing in the South in 1900, 5 percent ever resided in a northern state by 1930 (cohort 1874–1881). For those first observed in the 1910 census (cohort 1884–1891), the share is 6.3 percent by 1940. Moreover, in the 1900–1930 panel, 36 percent of Black men ever observed in northern states (and in the 1910–1940 panel 39 percent) were residing in the Jim Crow South around age 20, underscoring the rapidly changing racial composition of northern states in this period.
Next, the analysis examines how race and interstate migration shape career mobility, focusing on moves from the South to the North. The central question is whether southern Black men who migrated North experienced greater occupational mobility than southern Black men who remained in the South and whether racial disparities, including relative to White men, were smaller in the North. Figure 1 displays growth curves of occupational status. These are the estimated marginal effects on SEI for five analytical groups: northern White men, northern Black men, southern White men, southern Black men who migrated North, and southern Black men who never migrated.

Black-White and North-South gaps in career mobility, by birth cohort and baseline census.
Figure 1 shows that Black-White gaps in both initial occupational status (intercepts) and subsequent career mobility are large in the southern states and at least as large in the northern states. In both cohorts, the SEI gap between northern White and northern Black men mirrors the gap between southern White and southern Black men. To convey substantive magnitude beyond statistical significance, gaps are benchmarked to the within-cohort standard deviation of SEI: the Black-White gap at labor market entry is roughly 0.25 SD for the 1874–1881 cohort and about 0.5 SD for the 1884–1891 cohort. Notably, northern Black men enter the labor market at slightly higher occupational levels than southern Black men (about 3 SEI points), for both migrants and nonmigrants. These descriptive patterns provide no evidence that racial inequality in career mobility is smaller in regions with weaker Jim Crow regimes or more expansive opportunity structures.
Comparing within race and by migration status, the intercepts in Figure 1 indicate that southern Black men who migrated North began their work lives in slightly higher status occupations than those who remained in the South (around 20 years of age). The gap is small (less than 1 SEI point), but it is consistent with modest positive selection of African Americans into migration to the North (Collins and Wanamaker 2014; Eichenlaub et al. 2010).
Importantly, the strength of career mobility of southern Black men who migrated North during adulthood (Figure 1, orange squares, dashed line) appears indistinguishable from that of southern Black men who never migrated (Figure 1, green circles, solid line), in particular for the linear slope (occupational progression) and to a large degree for the quadratic term (late-career deceleration). On average, these two groups of southern Black men follow parallel occupational trajectories. In other words, southern Black men who moved to the more prosperous, industrializing northern states did not experience steeper career mobility than those who remained in the South. At face value, this suggests that North-migrating workers encountered similar structural disadvantages in occupational attainment as their nonmigrant peers.
In both panels of Figure 1, southern Black men who migrated North lag behind northern-born Black men (purple diamonds, solid line), underscoring the importance of regional origin within racial groups. These gaps are also visible in the growth curves. In the left-hand graph of Figure 1 (cohort 1874–1881), the linear SEI slope is similar, with greater divergence later in the career; in the right-hand graph (cohort 1884–1891), the SEI slope is noticeably steeper for northern Black men.
Marginal Slopes of SEI
To aid interpretation of the growth-curve inequalities shown in Figure 1, Table 3 reports the marginal effects (dy/dx) of age on occupational status (SEI), conditional on all controls and a random intercept. These estimates incorporate both the linear and quadratic components of the growth curve model and thus summarize the average instantaneous rate of change in SEI for each group. Expressed in SEI points per year, these slopes provide an interpretable metric of career progression that is directly comparable across groups.
Estimated SEI Slopes from Growth Curve Models, by Birth Cohort.

Source: Author’s calculations from the 1900–1930 and 1910–1940 linked Multigenerational Longitudinal Panel censuses.
Note: Inverse probability weights are applied to adjust for differential linkage or attrition across censuses, reweighting the linked sample to the population of interest. Weights are constructed by the author following Bailey et al. (2020). Values in parentheses are standard errors; all estimates are statistically significant at p < .001. Men ages 19 to 26 years in the 1900 census (cohort 1874–1881) and the 1910 census (cohort 1884–1891). “South” refers to the 16 states that implemented the strongest forms of Jim Crow legislation: Alabama, Arkansas, Florida, Georgia, Kentucky, Louisiana, Maryland, Mississippi, Missouri, North Carolina, Oklahoma, South Carolina, Tennessee, Texas, Virginia, and West Virginia. Growth curve models include time-varying controls for marital status, number of children, and school attendance (model 1). Model 2 additionally includes initial class position observed in the baseline year (1900 and 1910). This variable includes farm occupations (occ1950 codes 100 and 123), lower manual (SEI 3–15), working class (SEI 16–46), and upper class (SEI 47–96). N = 255,167 (1900–1930), n = 360,500 (1910–1940). SEI = Duncan socioeconomic index.
Concentrating on model 1 (main analysis), the results indicate substantial Black-White differences in career mobility slopes within the northern states in both cohorts: 1874 to 1881 (.148 vs. .224) and 1884 to 1891 (.138 vs. .180). Contrasting these estimates, conditional on initial occupational levels, suggests a narrowing of racial inequality in career growth rates during the early twentieth century. In the South, however, the disadvantage of Black men remained large and stable across cohorts (.122 vs. .219 and .081 vs. .170). 7
The slope estimates also mirror the visual evidence of within-race slope inequalities by migration background in the northern states: northern Black men exhibit greater career mobility than southern Black men who migrated North in both cohorts (.148 vs. .089 and .138 vs. .073).
Most pertinent to the research question are the slopes for southern Black men by migration status. For the older cohort (1874–1881), nonmigrants display a slightly steeper progression than migrants (.122 vs. .089). The younger cohort (1884–1891) shows similar slopes (.081 vs. .073). The pairwise differences of the SEI slopes (defined as nonmigrants minus migrants) are also small and statistically nonsignificant: Δ = .033 (SE = .020, p = .130) in the 1900–1930 panel and Δ = −.008 (SE = .020, p = .684) in the 1910–1940 panel. Thus, southern Black men who migrated North do not exhibit greater career mobility than nonmigrants.
Finally, model 2 in Table 3 adds the initial class position, measured in the baseline censuses of 1900 and 1910, to account for variation in early-career stratification. Comparing results with model 1 indicates nearly identical point estimates between the two specifications. This reduces the possibility that observed SEI slope differences are driven by differential occupational sorting of race-migration groups around 20 years of age.
Conclusion
The aim of this study was to assess whether the Great Migration enabled Black Americans to escape southern racial oppression and achieve greater career mobility in the industrial North. Using full-count, linked historical censuses, I model the occupational trajectories of Black and White men over three decades. The analysis indicates that, contrary to some versions of modernization theory and the “logic of industrialism,” migrating North was not associated with greater career advancement. Southern Black men who moved North exhibited occupational mobility similar to those who remained in the South. Furthermore, Black men, regardless of region of origin, experienced markedly lower career mobility than their White counterparts. These findings reveal the persistence of racial inequality, even in the context of one of the most significant “moving to opportunity” migration episodes in U.S. history. Sequential stabilized IPWs are applied to mitigate selective linkage and attrition; however, they are not a cure-all and do not make the analysis equivalent to a perfectly linked panel with random attrition. 8
Rather than serving as a steeper ladder of economic opportunity, the results suggest that the rapidly emerging industrial hubs of the early twentieth-century North reproduced structural racial/ethnic hierarchies in economic distribution and social mobility, much like those in the South. Although Jim Crow laws and institutional frameworks were undoubtedly more explicit in the South (Frazier 1957), previous studies have shown that labor markets in northern cities remained racially stratified (Boustan 2015). Despite differences in legal regimes and political institutions, racial discrimination and exclusion were pervasive in the expanding sectors of automotive production, steel manufacturing, and new service occupations (Sundstrom 1994).
To explain the enduring racial disparities in career growth, one must first recognize the nature of racial oppression in American capitalism. Scholars have long observed that Black workers in the North were perceived as a permanent subproletariat (Appel 1966). Supporting this view, cross-sectional analyses have shown that their occupational status was, on average, even lower than that of many European immigrants who arrived in midwestern states in the early twentieth century (Adelman and Tolnay 2003). The economic marginalization of Black workers was not incidental but functional, sustaining a labor hierarchy that privileged White workers and maintained capitalist production relations (Bonacich 1976; Featherman and Hauser 1976). By occupying the lowest rungs of the occupational structure, Black workers constituted a cheap, segmented labor pool that suppressed overall wage growth and limited class solidarity among workers (Bonacich 1972).
Second, the timing of the Great Migration to the North may have been historically disadvantageous. European immigrants who arrived in the late nineteenth and early twentieth centuries were able to ride the wave of early industrial expansion in the North. In contrast, many Black migrants entered northern labor markets only after occupational ladders had already been monopolized by White workers, including a diverse group of European immigrants (Lieberson 1980). When opportunities arose in booming sectors such as steel and automotive manufacturing, employers favored White immigrants over Black workers for higher status jobs (Taeuber and Taeuber 1958 [1964]). As Derenoncourt (2022) and Boustan (2015) have shown, northern responses to Black migration often hardened structural barriers in the labor market rather than dismantling them. This dynamic is reflected in the growth curve models: northern Black men advanced slightly further than North-migrating southern Black men, suggesting that earlier entry into industrial urban economies shaped exposure to constrained opportunity structures.
The results for observed occupational mobility during the Great Migration on the basis of full-count censuses of 1900 and 1910 are consistent with early cross-sectional studies conducted on the 1940–1980 censuses for a later period of North migration (Eichenlaub et al. 2010). Collins and Wanamaker (2014) documented sizable gains in occupation-based income levels for southern-born Black migrants between 1910 and 1930. My focus differs because it examines career slopes—SEI trajectories (1900–1940)—rather than single-point attainment, and I find no steeper SEI growth for migrants than for southern stayers. These patterns are not contradictory: migrants may have realized level income gains upon arrival while not experiencing faster subsequent occupational progression.
The contribution of this study is merely descriptive and concentrates on revealing the full careers of Black men and White men in the early twentieth century. This exercise reveals nearly identical career mobility patterns for North-migrating Black workers and those who remained in the South. This is despite the fact that migrants are typically positively selected on observed and unobserved characteristics that make them more likely to succeed in the labor market. On the basis of these results, I argue that neither industrial growth nor moving away from Jim Crow states positively altered the career mobility trajectories of southern Black migrants. The logic of industrialism, which assumes that modernization diminishes the salience of ascriptive traits, is contradicted on this occasion. The Great Migration should not be seen as a straightforward success story of economic uplift. Although it undeniably reshaped the demographic landscape of the United States and improved absolute living conditions for many Black families, it did not close the racial career mobility gap for those who moved. Northern states were far from the “land of opportunity” but rather a differently configured racial regime—one that appeared more open but operated through subtler, yet equally powerful, mechanisms of racial exclusion and economic stratification.
Footnotes
1
Most studies use African Americans or Black (or black) Americans, sometimes interchangeably. Hereafter, I use Black (capitalized) to indicate the broader racialized demographic group.
2
Canadian-born individuals are included to reflect the relatively open U.S.-Canada border during these cohorts’ formative years (late nineteenth century).
3
Compared with some alternative matching strategies available for linking historical census datasets, the MLP crosswalk should prioritize sample size over a somewhat higher chance of mismatch. However, empirically, the MLP offers very high match rates and precision (Helgertz, Price, et al. 2020).
4
Cumulative stabilized IPWs are trimmed at the 1st and 99th percentiles within each cohort (results are similar using 0.5th and 99.5th thresholds or trimming step-specific stabilized weights prior to multiplication). After trimming, weights are renormalized to have a mean of 1.
5
Comparability also relies on the occ1950 recode, which standardizes census occupations to “permit analysis across all years from 1850 forward” (Ruggles et al. 2024). Some early titles lack direct 1950 equivalents, and vague categories (e.g., laborer, farm laborer) are lumped, adding noise. Such error may attenuate slopes rather than generate spurious mobility. Models that control for initial class position (![]() ) further mitigate concerns that baseline miscoding drives the results.
) further mitigate concerns that baseline miscoding drives the results.
6
Alabama, Arkansas, Florida, Georgia, Kentucky, Louisiana, Maryland, Mississippi, Missouri, North Carolina, Oklahoma, South Carolina, Tennessee, Texas, Virginia, and West Virginia.
7
Pairwise differences of the slopes of SEI per year for White, North versus Black, North confirm reduced inequality: Δ = .076, SE = .02, p < .001 (1874–1881 cohort) and Δ = .042, SE = .02, p < .05 (1874–1881 cohort). The pairwise differences between Black and White men in the South remain the identical in both cohorts: Δ = .098, SE = .004, p < .001.
8
Furthermore, because retention on the employment criterion is lower among northern Black men, the analytic northern Black sample is more positively selected on sustained employment; if anything, the North-South differences among Black reported here likely overstate a northern advantage.