
Abstract
In this data visualization, the author depicts four measures of jail incarceration, drawing attention to the growth, variation, and disparities in jail incarceration across the rural-urban continuum in recent decades. Jails are the front door of the criminal legal system and admit millions of people each year. Yet jails have received little attention in sociological research, and existing research tends to focus on large, urban facilities. Here the author analyzes panel data organized at the county-year level to depict variation in four measures of jail incarceration across the rural-urban continuum since 1978. The author finds that jail incarceration rates have tended to increase across the period, but the urban incarceration rate has declined since 2007 as the rural incarceration rate continues to increase. Most people in jail are legally innocent and have not been convicted of a crime, and the Black/white disparity in jail incarceration has decreased over time.
Keywords
Jails are the front door of the criminal legal system and touch millions of lives each year. Local institutions, jails are typically operated by counties and incarcerate people who are awaiting trial or serving short sentences of less than a year. In 2018, U.S. jails admitted 10.7 million people and held an average of 738,400 people on a given day (Zeng 2020). By contrast, prisons are state or federal facilities that incarcerate people convicted of crimes and serving sentences of more than a year. In 2018, prisons in the United States admitted about 600,000 people and held more than 1.4 million people (Carson 2020).
Despite their reach, jails have received little attention in sociological research, and existing research tends to focus on large urban facilities. John Irwin’s (1985) classic study The Jail defined the institution as one designed to manage the urban underclass, or “the rabble,” whose offensiveness to social norms is more determinative than their criminal offense. Since then, research on jail incarceration has focused largely on urban contexts, yet recent work highlights the growth of incarceration outside urban areas and variation in jail incarceration rates among communities (Kang-Brown and Subramanian 2017; Simes 2021). Drawing on panel data organized at the county-year level, this visualization depicts four key measures of jail incarceration to document differences in jail incarceration across the rural-urban continuum in recent decades.
Methods
Using the Vera Institute of Justice’s Incarceration Trends Dataset, I examine variation in four measures of jail incarceration: the total jail population rate, total jail admission rate, pretrial jail population rate, and Black/white jail population rate ratio (for which data are available only from 1990). The urbanicity measure collapses the six categories of urbanicity defined by the National Center for Health Statistics Urban-Rural Classification System for Counties to four by combining medium with small metropolitan areas and micropolitan (an urban area with a population between 10,000 and 50,000 people) with all other, noncore areas. The former is counted as “small/mid metro” and the latter as “rural.” A county is counted as “urban” if it is one of the core counties of a metropolitan area with at least a million people, and a county is counted as “suburban” if it is within that surrounding metropolitan area.
Results
Four key findings emerge from Figure 1. First, there is observable variation in jail incarceration rates across the rural-urban continuum and across time. Second, rural jail population and admission rates have surpassed those in all other places, including urban ones: by 2018, the median rural jail admission rate was about 80 percent greater than the median urban rate. Third, observed increases in the total jail population rate are largely explained by increases in the pretrial jail population, not increases in the number of people who have been convicted of a crime. The pretrial jail population rate has tended to increase with the total jail population rate, suggesting that more people are remanded or held on bail. Fourth, racial disparity in jail incarceration has generally decreased in counties at every level of urbanicity since 1995.
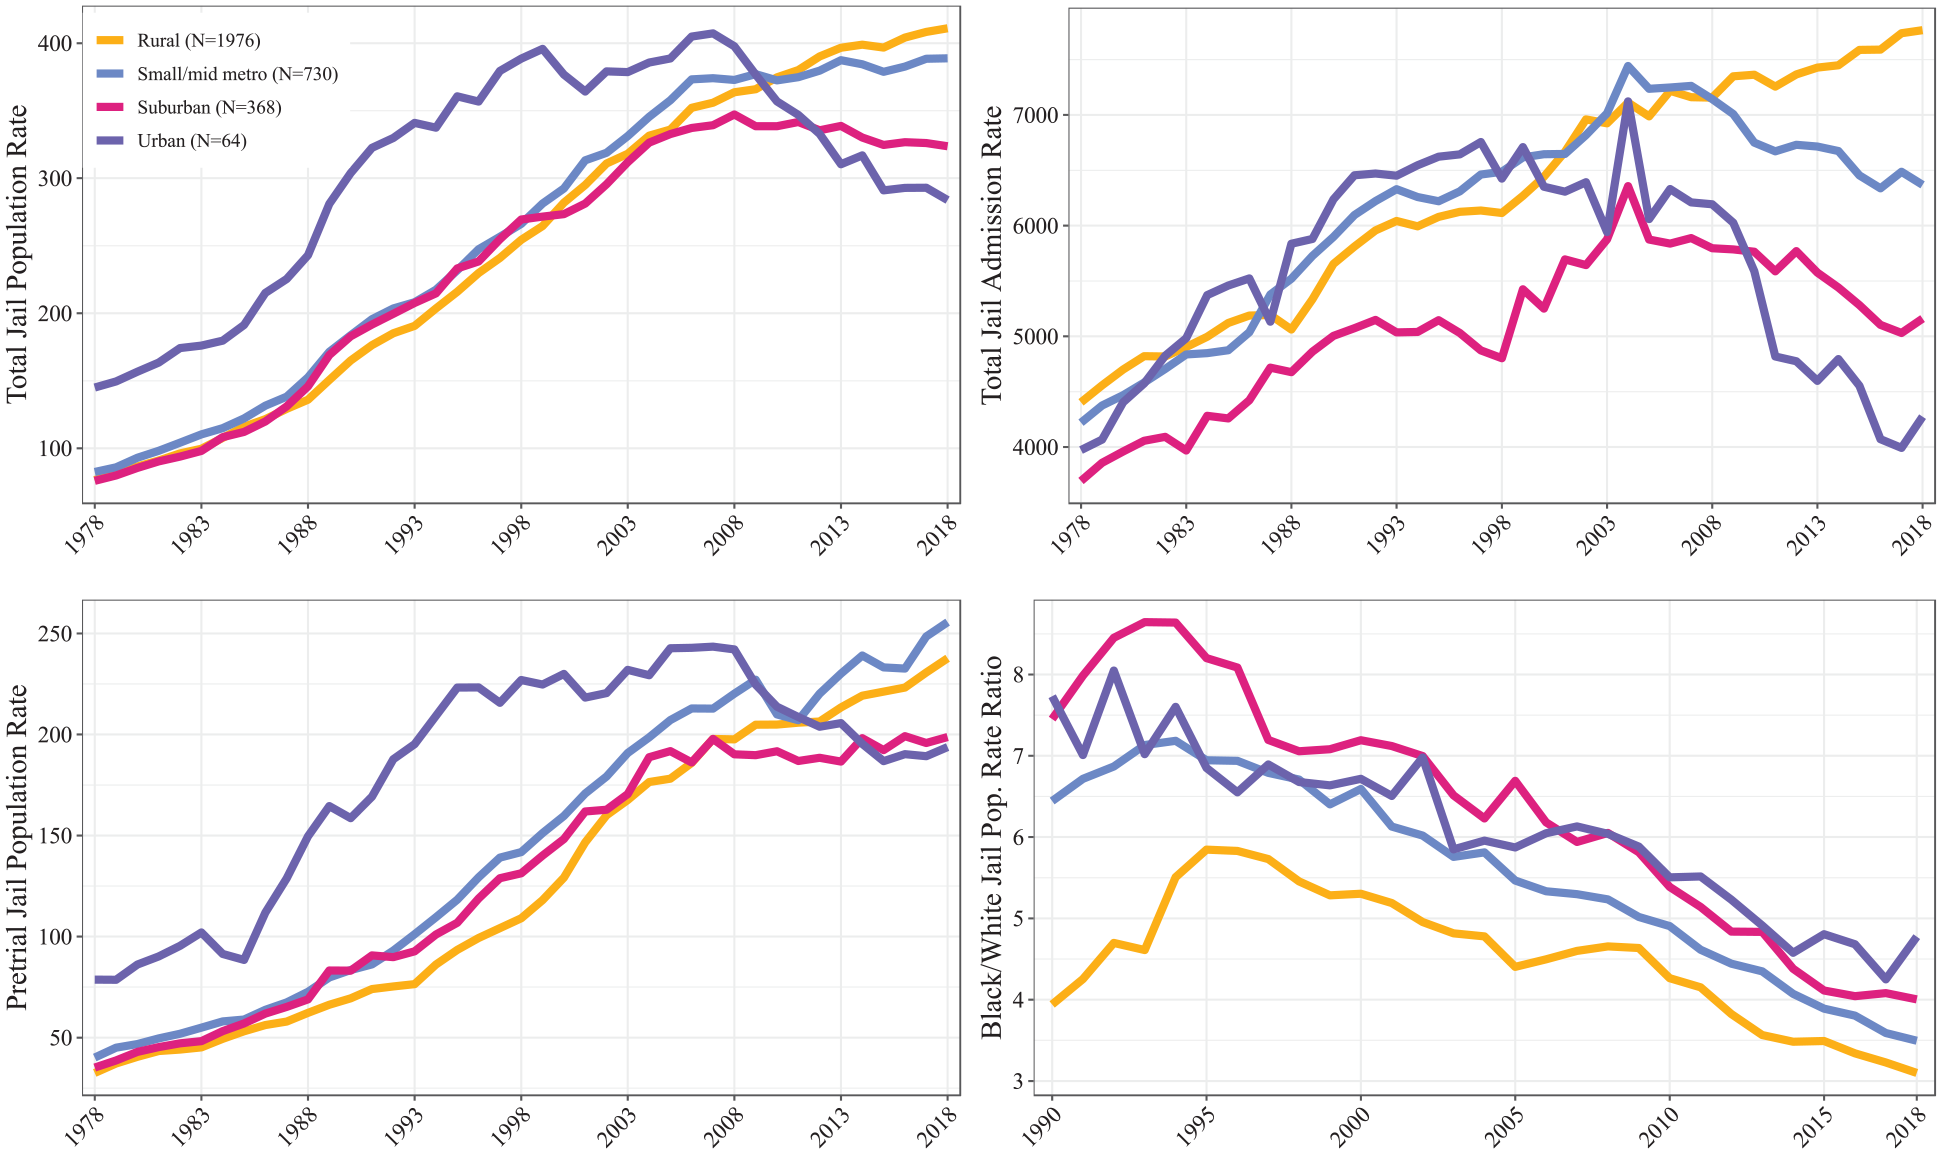
Total jail population, total jail admission, and pretrial jail population rates, 1978 to 2018, and Black/white jail population rate ratio by county urbanicity, 1990 to 2018.
Taken together, these findings show jail incarceration rates are differentiated by county urbanicity and challenge popular depictions of incarceration, which is often treated as an urban phenomenon. Until 2010, the urban jail population rate surpassed rates in all other places, in large part because of the buildup of mass incarceration and the war on drugs, which targeted communities of color in urban neighborhoods and increased racial disparity in incarceration (Beckett 2000; Tonry 1995; Tonry and Melewski 2008). Following the drug war’s retreat from its main urban front and decarceration efforts, urban incarceration rates steadily declined while incarceration rates in other places continued to increase, although explanations for these increases remain unclear. By 2018, jail incarceration rates in rural counties were the highest in the country. This highlights the need for research on jail incarceration in rural contexts that examines its nature, explanations for its continued increase, and its consequences. More generally, the present visualization suggests that research on jail incarceration should attend to local context and continue to consider local policies, practices, and values shaping jail incarceration.
Supplemental Material
sj-docx-1-srd-10.1177_23780231241255582 – Supplemental material for Visualizing Jail Incarceration across the Rural-Urban Continuum, 1978 to 2018
Supplemental material, sj-docx-1-srd-10.1177_23780231241255582 for Visualizing Jail Incarceration across the Rural-Urban Continuum, 1978 to 2018 by Timothy Ittner in Socius
Footnotes
Supplemental Material
Supplemental material for this article is available online.
Author Biography
References
Supplementary Material
Please find the following supplemental material available below.
For Open Access articles published under a Creative Commons License, all supplemental material carries the same license as the article it is associated with.
For non-Open Access articles published, all supplemental material carries a non-exclusive license, and permission requests for re-use of supplemental material or any part of supplemental material shall be sent directly to the copyright owner as specified in the copyright notice associated with the article.