
Abstract
The authors redress the commonplace narrative of rural decline. Data from the decennial censuses since 1980 reveal that rural growth is often counted as metro growth; that is, it is added to the expanding universe of metro counties. First, nonmetro counties (defined in 1980) grew from 55 million people in 1980 to roughly 70 million in 2020. Yet, because of nonmetro-to-metro reclassification, the 2020 census reports a nonmetro population of only 46 million. Second, nonmetro growth has been due almost entirely to endogenous growth of minority populations. Reclassification transferred disproportionate shares of America’s rural White population to the metro side of the demographic ledger, leaving behind rural minorities. Third, these racial differences in growth–both endogenous population growth and growth due to reclassification–are most apparent in the South, where most rural minorities live. Our goal is to provide both substantive and didactic lessons for studying population growth and decline.
Large shares of rural people and communities have been “left behind” in today’s global economy (Curtis and Kulcsár 2019; Fuguitt 1971). Lagging rural regions have been unable to participate fully in America’s urban-based economy, instead facing high unemployment, persistent poverty, and “deaths of despair” (i.e., opioid deaths and gun violence, including suicides) (Brown, Mettler, and Puzzi 2021; Curtis et al. 2019; Monnat et al. 2019; Slack and Jensen 2020). This is a familiar narrative, but one that tells only part of the story—the most pessimistic part. The demographic paradox, which we identify here, is that many rural counties have flourished over recent decades, an empirical fact hidden from public and academic view by the binary way the Office of Management and Budget (OMB) classifies people and places as either metropolitan (metro) or nonmetropolitan (nonmetro). The urbanization of rural America since 1980 has meant that literally hundreds of nonmetro counties have been officially reclassified by OMB as metro (Jiang et al. 2022; Johnson and Lichter 2020). That growing rural communities are often transferred to the urban side of the demographic ledger is not always fully appreciated or, worse, is simply ignored.
In this article we offer both substantive and didactic lessons about the process of urbanization and the underlying mechanics of population growth and decline. This is a timely issue. Since the 2016 U.S. presidential election, the scholarly and policy spotlight has shined on rural America, perhaps as never before, while the valid measurement of the size and composition of rural people and places has seemingly become increasingly problematic (National Academies of Sciences, Engineering, and Medicine 2016; Pipa and Geismar 2021). How should rural development or policy interventions be targeted (Deller and Conroy forthcoming)? Unfortunately, how “rural” is conceptualized and defined is often arbitrary, especially as the spatial and symbolic boundaries that separate rural and urban people and places have shifted and become increasingly ambiguous over time (Lichter and Brown 2011).
Our overriding goal is to identify and unpack these interpretative problems. Specifically, we use recently released county data from the 2020 U.S. decennial census along with previous censuses to address three specific objectives. First, we highlight America’s new demographic reality, one showing that uneven interdecadal trajectories of population growth and decline are due both to (1) endogenous population changes in counties classified consistently over time as nonmetro and (2) population transfers that result from nonmetro-to-metro reclassification of growing counties. We point to the long-term implications of this demographic winnowing process, which over successive decades has “left behind” America’s least resilient rural counties—those unlikely to grow now or into the future.
Second, we highlight substantial racial and ethnic variation in rural growth and decline processes, due both to endogenous population change and reclassification. Metro reclassification, in particular, is likely to draw disproportionately from predominately White and rapidly growing counties, especially at the suburban fringe—exurbia. They are gobbled up at the periphery by outward expanding metro regions. This has heightened the unusually rapid uptick of racial diversity in “left behind” rural areas.
Third, we show how racial differences are rooted demographically in widely divergent regional trends in rural population growth and decline processes. In the South, for example, endogenous rural population declines, especially among Whites, have been amplified over time by nonmetro-to-metro reclassification of growing counties. Without moving, rural Whites have increasingly joined the metro mainstream. For southern rural Blacks, endogenous population decline rather this reclassification is a characteristic demographic feature in the South.
Background
The Rural Narrative of Chronic Population Decline
The conventional narrative is that rural America has been in long-term decline—hemorrhaging jobs and people to burgeoning cities and suburban areas (Johnson and Lichter 2019; Ulrich-Schad and Duncan 2018; Wuthnow 2018). In fact, the U.S. nonmetro population peaked in 1940, when 75 million people, or 57 percent of all Americans, lived in small towns, in the open countryside, or on farms (Gibson 2018). Today, 46 million people representing just 14 percent of the 2020 U.S. population reside in nonmetro areas.
For much of rural and small town America, its historic dependence on agriculture and natural resources has dampened prospects for population growth and economic development. In America’s agricultural heartland, the ongoing mechanization and consolidation of agricultural production has reduced employment opportunities and diminished the economic viability of family farms and the small rural towns that serve them (Lobao and Meyer 2001). Alternative energy sources, new environmental regulations (e.g., the Clean Air Act of 1970), and competition from natural gas have wrecked economic havoc on Appalachia’s coal country (Mayer, Malin and Olson-Hazboun 2018). U.S. coal production today is at 45-year low (U.S. Energy Information Center 2021). The U.S. timber industry—jobs in logging, sawmills, and furniture production—has faced ongoing global competition and trade wars (Muhammad 2020). Even the rural manufacturing sector, which has historically provided more jobs and higher earnings than agriculture and mining, faces sustained competition from offshoring (Crowley, Payne, and Kennedy 2020; Low 2017).
The Paradox of Rural Decline
The social and economic problems in rural America today are well documented and real (Bailey, Jensen, and Ransom 2014; Clark, Harper, and Weber 2022; Tickamyer, Sherman, and Warlick 2017). Population losses have been both chronic and widespread across rural America over the past century. Nearly 50 percent of all currently defined nonmetro counties in fact had already reached their population peak by 1950 or even earlier (Johnson and Lichter 2019). But as we argue here, the usual narrative of rural decline is incomplete without taking a longer term perspective that recognizes the zero-sum element built into the nation’s geographical classification system. The urbanization of rural America is best characterized as a selective demographic winnowing process, one whereby many growing nonmetro counties have fueled metro growth at nonmetro America’s expense. Since 1960, in fact, 753 of all nonmetro counties (nearly 25 percent) have been redefined by the OMB as metro (Johnson and Lichter 2020). Some rural counties have been reclassified as new metropolitan statistical areas (MSAs) in their own right (Elliott and Perry 1996). Many more nonmetro counties have been enveloped by outward expanding metro growth at the rural-urban fringe (Lichter, Brown, and Parisi 2021). Population growth in this case represents suburban or exurban development that, by OMB definitions, is functionally integrated with the metro core.
The 2020 decennial census has revealed that the U.S. population overall increased by 7.5 percent between 2010 and 2020. Growth has been concentrated in America’s metro counties, which increased by 8.8 percent over the past decade. In contrast, nonmetro counties experienced absolute population decline for the first time ever. The U.S. population increased but only because metro growth offset the .6 percent overall decline in nonmetro counties (Dobis et al. 2021). To be sure, post-2010 nonmetro population declines have been small but nevertheless are spatially widespread. Roughly two thirds of the all nonmetro counties lost population between 2010 and 2020, which is unprecedented in American demographic history (Marema 2021).
Past-decade estimates of county growth rates are typically based on OMB’s metro and nonmetro delineations at the time of the 2020 census. This has the benefit of representing endogenous population growth in a fixed or constant set of nonmetro counties (for more discussion, see Fuguitt, Heaton, and Lichter 1988). The disadvantage is that population growth in transitioning counties—those defined earlier in the decade as nonmetro but later as metro—is counted as metro rather than nonmetro growth. A fixed end-of-decade definition of metro and nonmetro counties introduces a downward bias in nonmetro population growth rates by excluding rapidly growing counties.
The demographic paradox is clear. Over the past four decades, a significant share of nonmetro America’s fastest growing counties have been lost to metro reclassification, with population and economic growing accruing to America’s rapidly expanding universe of metro counties. For rural America today, chronic population decline or depopulation is, at least as it measured officially by the U.S. Census Bureau, a product of its own success (i.e., growing up to metro status). The administrative boundaries that define rural America are not fixed but shift over time, but this is rarely acknowledged in the larger social science literature.
Rural Population Decline: Racial and Regional Variation
These interpretative problems are further compounded when attention turns to regional patterns and racial and ethnic diversity. Nonmetro population declines have been spatially uneven—from region to region and even from state to state—and are seemingly driven by divergent patterns of growth and decline among White majority and minority populations. The 2020 census showed that racial and ethnic minority populations were responsible for all of the nation’s population growth over the past decade. The White alone population (excluding mixed-race Whites) declined nationally for the first time ever between 2010 and 2020, by nearly 9 percent (Jensen et al. 2021). Our analyses show that overlapping patterns of rural and White population declines represent a singular demographic feature of population redistribution and change in America.
White Population Decline in the Heartland
White population declines seemingly have been most pronounced in the nation’s rural areas, while racial and ethnic minorities have concentrated in metro counties. Indeed, large swaths of the rural agricultural Midwest—from North Dakota to the panhandle of Texas—saw population declines between 2010 and 2020. Other areas, especially in recreational areas in the upper Great Lakes, experienced substantial growth because of net migration (Allen and Winchester forthcoming). But this is the exception rather than the rule. In Iowa, for example, nearly 80 percent of its growth occurred in just four counties—the most populated metro counties (Lynch 2021). Sixty-eight counties, mostly rural, lost population between 2010 and 2020. The rural Midwest has experienced White net out-migration for decades but now faces chronic population decline as a result of population aging and natural decrease from high mortality and low fertility (Johnson 2020). Not surprisingly, America’s mostly White rural and agricultural heartland lags bicoastal and urban population centers on most indicators of economic and social well-being (Hauer, Saunders, and Shtob 2022).
Our working assumption is that rural population decline, from both endogenous population change and reclassification, is likely to be affected by racially uneven growth patterns. New rural growth of racial and immigrant minority populations has provided some demographic relief, but it is no panacea for chronic rural decline. Still, roughly 200 nonmetro counties since 2010 grew only because minority growth exceeded non-Hispanic White population decline (Lichter and Johnson 2020). Beadle County, a small rural county in central South Dakota, is illustrative of rural White population decline and growing racial diversity. Between 2010 and 2020, the non-Hispanic White adult population declined by more than 9 percent, even as total adult population increased by 5.7 percent (U.S. Census Bureau 2022). Population growth occurred because the non-White and Hispanic populations increased over the past decade from 1,466 to 3,315 people (126 percent). But this pattern of White decline and non-White growth was the exception rather than the rule. In most rural counties, minority population growth was insufficient to offset White population declines (Lichter and Johnson 2020).
In America’s agricultural heartland, rural minority growth (e.g., Beadle County) has contributed to endogenous population growth. Less often appreciated is that White rural population decline is amplified by reclassification. South Dakota again illustrates the interpretative problems. The Sioux Falls metro area includes four counties: Minnehaha (where Sioux Falls is located), Lincoln, and Turner counties to the south and McCook County to the west. McCook and Turner counties are recently reclassified counties, becoming metro only after the 2000 census. Between 2010 and 2020, McCook County’s population increased by .1 percent, while Turner County’s population increased by .4 percent (Marema 2021). These positive growth rates are admittedly modest but nevertheless contrast sharply with absolute population declines overall among South Dakota’s nonmetro counties. More important, the administrative transfer of McCook and Turner from the nonmetro to metro side of the population ledger exacerbates rural population decline (mostly White population decline) while “leaving behind” South Dakota’s other rural counties with decades-long histories of chronic population decline.
Race and Rural Population Decline in the South
Depopulation is a signature demographic feature in America’s agricultural heartland (Johnson and Lichter 2019). In the South, however, White and minority population growth and decline processes historically have unfolded unevenly over geographic space. For example, much of central Appalachia—mostly White and rural—has experienced chronic population losses over many decades. In fact, endogenous nonmetro population declines over the past decade were higher nationally in West Virginia (-6.6) than any other state. In Kentucky’s coal country, every county in eastern Kentucky declined in population between 2010 and 2020 (U.S. Census Bureau 2021a). In coal country, rural decline also reflects decade-to-decade reclassification in expanding metro regions. In West Virginia, only eight counties experienced population growth, with the most rapid gains in the outlying and most recently reclassified suburbs of Washington, D.C., and Hagerstown, Maryland. For example, the counties of Berkeley (17.2 percent) and Jefferson (7.9 percent) were two of the fastest growing counties in West Virginia, located in the eastern panhandle of the state, within commuting distance of Hagerstown and Fredrick, Maryland, and even Washington. 1 Berkeley and Jefferson counties, formerly rural, are also overwhelmingly non-Hispanic White (i.e., more than 80 percent in 2020, according to the U.S. census).
Race-based patterns of endogenous growth and reclassification are likely to be much different in central Appalachia than the rest of the South. The overwhelming share of America’s rural Blacks live in the South, often in so-called rural Black Belt counties, which extend in an arc from the Mississippi delta to the Piedmont areas of North Carolina. 2 They are located mostly in poor and languishing agricultural counties of the South, a legacy of the old slave and plantation economy of the nineteenth century (Gibbs 2003). Throughout the early twentieth century, the “Great Migration” reshuffled regional racial and regional settlement patterns (Tolnay 2003). Not unlike Whites in the rural Midwest, endogenous rural Black population declines in the South are rooted in an agrarian past and expressed by continuing out-migration that has fueled unprecedented population growth in metro employment centers in the South and elsewhere (Ambinakudige, Parisi, and Grice 2012; Tolnay 2003). Wimberley (2010) showed that the share of southern Blacks living in Black Belt counties (defined as 25 percent Black or more) declined from 56 percent to 47 percent between 1980 and 2015.
Reclassification also undoubtedly plays a role—perhaps even a large role—in the urbanization of southern rural Blacks and other racial minority populations (Cromartie 2006). The outward territorial expansion of rapidly growing southern metro areas—Atlanta, Charlotte, and Raleigh—suggests that nonmetro-to-metro reclassification may have siphoned off many growing rural counties with sizable minority populations. The new suburbs in outlying areas of metro Atlanta provide a case in point. The Atlanta MSA is made up of Fulton County—its core—and more than two dozen much smaller counties, including nine “new” fringe counties that were added after the 1990 census enumeration. Several had large Black or minority populations that were gobbled up by metro reclassification. In Merriweather County, for example, the non-White population in 2020 was 57 percent. Other newly reclassified Atlanta suburbs, such as Heard County, were 85 percent White. The implication here is that nonmetro-to-metro reclassification may have contributed both to growing racial diversity in the suburbs and to White rural decline. Slow-growing rural counties, especially in the Black Belt, have been “left behind” by continuing urbanization and reclassification. This may portend a kind of rural ghettoization or segregation of minority populations (Green 2020).
The Present Study
Academic interest in rural America has perhaps never been greater (for special review issues, see Clark et al. 2022; Lichter and Ziliak 2017; Slack and Jensen 2020). Unfortunately, the implications of rural endogenous growth and reclassification for research and public policy often go unrecognized or are underappreciated. Growing rural-urban disparities—in poverty, health outcomes, and school test scores—may be a statistical chimera, a result of the urbanization of many thriving rural spaces (Brooks et al. 2020; Wright, Ellis, and Tiao 2022). The fluidity of metro and nonmetro boundaries can distort the interpretation of longer term population and economic trends, both in nonmetro and metro areas. Our study, as a didactic exercise, shows that rural growth and decline results from endogenous population change and county reclassification. It also provides cautionary lessons, both substantive and methodological, regarding the commonplace narrative of widespread rural decline and urban growth.
Methods
Data
We use county data from the 2020 decennial census, along with comparable census tabulations from the 1980 to 2010 censuses. The Decennial Census P.L. 94-171 Redistricting Data Summary Files were released on August 12, 2021 (U.S. Census Bureau 2021a). These are official counts that provide the basis for redistricting and reapportionment. Data summary files provide 100 percent population counts for all 3,141 counties, which we use as geographic building blocks throughout our analyses. Unlike data on cities and communities, counties have few boundary changes over time and provide full geographic coverage of the entire U.S. population. 3
To identify demographic sources of growth, we also draw on historical data on natural increase and net migration from the Census Bureau Population Estimates Program and the National Center for Health Statistics. For the period from 2010 to 2020, data on natural increase come from the Census Bureau population estimates released in 2021 (U.S. Census Bureau 2021b). 4 Net migration is the difference between in- and out-migration, which is also equal to the difference between population change and natural increase.
Census Geography: Definitions of Metro and Nonmetro
MSAs consist of one or more counties that contain an urban nucleus of 50,000 or more people (i.e., principal cities) and outlying counties that, on the basis of commuting data, are economically integrated with the metro core. 5 Nonmetro counties, which we focus on here, represent a residual category that includes counties that are not metro.
Following Fuguitt et al. (1988), we used both fixed and contemporary (or floating) universes of metro and nonmetro counties as defined by OMB. Fixed definitions are based on a beginning- or end-of-period universe of metro and nonmetro counties. A 1980 fixed universe of nonmetro counties, for example, would include all counties defined as nonmetro on the basis of OMB’s metro classification in 1983, on the basis of tabulations from the 1980 census. A 2010 fixed definition defines the nonmetro universe of counties on the basis of the 2010 census results (which were released in 2013). In either case, the metro and nonmetro universe of counties is fixed over the period from 1980 to 2020; the same universe of nonmetro counties is tracked over each decade since 1980. Because of metro reclassification, however, the 2010 fixed universe includes several hundred fewer nonmetro counties than the 1980 fixed universe. The important point is that a fixed universe allows us to estimate endogenous growth and decline over time.
A contemporary or floating definition, in contrast, allows the universe of nonmetro counties to change each decade. That is, the nonmetro population in 1980 is based on a nonmetro universe of counties defined by OMB in 1983, after the 1980 census (and after reclassification, which accounts for county population changes between 1970 and 1980). OMB’s 2020 classification (on the basis of the 2020 results) is yet to be released. To identify the 2020 universe of metro and nonmetro counties, we therefore use OMB’s 2018 designation (see the “Results” section). Unlike fixed definitions, a contemporary or floating universe of nonmetro counties means that population size each census year (i.e., 1980, 1990, 2000, 2010, and 2020) is based on different numbers of nonmetro counties while retaining the same conceptual definition of “rural” or nonmetro over time.
Endogenous Growth and Reclassification
Our baseline analyses focus on overall nonmetro growth and decline, which can be partitioned into (1) population change in the universe of counties classified as nonmetro throughout the study period (i.e., endogenous change) and (2) population change that results from administrative transfers of counties from nonmetro to metro status (i.e., reclassification). Subtracting population change (on the basis of a fixed universe) from population change (on the basis of a contemporary universe) measures growth due to metro-to-nonmetro reclassification. For consistency, we use a 2010 fixed universe of nonmetro, focusing on counties that transition from nonmetro to metro any time between 1980 and 2010. We show that long-term rural population decline resulted in part from success, at least as measured by the reclassification of growing nonmetro counties.
Our disaggregation of population change into its two components also is expected to reveal substantial differences over time between Whites and non-Whites. We illustrate how recent nonmetro population decline has resulted from disproportionately large transfers of nonmetro Whites into newly reclassified metro suburban fringe counties. For our purposes, we focus primarily on non-Hispanic Whites. All other groups, including mixed-race populations, are categorized as non-White or minority. Finally, we show that rural growth and decline processes are closely tied to regional differences in racial composition, especially racial disparities in the shares of nonmetro decline due to reclassification. Here, we distinguish among census-defined regions (i.e., North, Midwest, South, and West) but place the analytical spotlight mostly on the South, both because of its rapid growth over the study period and because much of the rural minority population, especially Blacks and Hispanics, reside in the South.
Results
Metro Growth and Nonmetro Decline
The National Picture
The U.S. population grew from 225 million people in 1980 to 331 million in 2020, spread unevenly over than 3,141 metro and nonmetro counties. The metro population increased substantially, from 170 million to 285 million during the period, while the nonmetro population declined from 54 million to 46 million people. This means that metro cities and suburbs accounted for all U.S. population growth since 1980, offsetting absolute declines of 8 million rural people over the same period. The urbanization of the U.S. population continues apace, while many rural areas have languished.
This divergence in metro and nonmetro population since 1980 is clearly revealed in Figure 1. These results are based on a fixed 2010 universe that reflects growth both from endogenous change and reclassification. The paradox is that a substantial share of metro population growth over the past four decades is the direct result of counties being reclassified from nonmetro to metro.

Metro and nonmetro population growth, fixed 2013 metro and nonmetro universe, 1980 to 2020.
To better illustrate the point, Figure 2 provides a U.S. map of all counties using a fixed 2013 metro and nonmetro universe over the entire study period. It identifies counties that were reclassified from nonmetro to metro status any time between 1980 and 2010. 6 These results reveal that 23 million—roughly 20 percent of nonmetro residents—were redefined as metro over the period from 1980 to 2020 (data not shown). The spatial boundaries that define metro and nonmetro areas are highly fluid, complicating the assessment of growth and decline across time and geographic space. The so-called rural-urban divide arguably obfuscates the increasing interconnections—social, demographic, and economic—between rural and urban America. It renders rural-urban comparisons increasingly suspect, perhaps even misleading in some cases.

Metro and nonmetro areas, 2013, by classification status between 1980 and 2010.
Urbanization reflects changes in the relative population size in metro and nonmetro counties, which in part is a direct result of administrative changes since 1980 in the number of metro counties. In 1980 there were 719 metro counties, increasing to 1,183 by 2020. The number of metro counties will soon grow again, when OMB releases its next installment of new MSAs and metro counties on the basis of the 2020 census results. Many newly reclassified counties are expected to became MSAs in their own right. 7 Other newly classified metro counties will be added to existing MSAs; they represent new suburban growth at the metro fringe (see Figure 2). For example, the Atlanta MSA has added several new metro counties since 1980, each drawn from the universe of nonmetro counties. Nonmetro and metro population growth and decline represent a zero-sum game, one that is seemingly played out at the expense of nonmetro America.
Reclassification and Incipient Rural Decline
The administrative reclassification of people and places—decade after decade—implies that an increasing share of those counties “left behind” in nonmetro America are less likely to prosper in the future. They typically have smaller populations, are more dependent on declining extractive or other industries, and are spatially removed from outward expanding growth at the suburban fringe. 8 Demographic resilience in “left behind” counties has been sapped by chronic out-migration of young adults of reproductive age, population aging, and the excess of deaths over births (i.e., natural decrease).
Growth trends presented in Figure 3 make this point, showing population growth differentials each decade since 1980. Here we document growth and decline since 1980 on the basis of fixed numbers of nonmetro counties in 1980 and 2010, as well as a floating definition that changes each decade because of reclassification. 9 Thus, by definition, the 1980 fixed and contemporary universes reported here yield nonmetro populations of the same size in 1980, and diverge thereafter. The nonmetro population based on a fixed 2010 universe intersects in 2010 with the floating (or contemporary) definition and declines by 2020, reflecting both endogenous decline during the 2010s and the effects of reclassification between 2013 and 2018.

Nonmetro population change, 1980 to 2020, by floating and fixed definitions of the universe of nonmetro counties.
As expected, Figure 3 plainly reveals rapid overall population growth over the past four decades using a fixed 1980 universe of nonmetro counties. Using this definition, nonmetro counties increased from nearly 56 million people in 1980 to more than 71 million in 2020. These data tell a far different story, one of rural growth, rather than the more familiar story of nonmetro decline. In contrast, a 2010 fixed universe of nonmetro counties yields a much flatter population growth trajectory over the study period. By the decade of the 2010s, nonmetro counties experienced endogenous population decline for the first time in U.S. history. The lesson is clear: In each census from 1980 to 2020, the number of nonmetro counties, the size of the nonmetro population, and the pace of population growth depend on which definitions of metro and nonmetro are used. To our main point, the choice of definitions—fixed or floating—has potential implications for the conclusions drawn about the demographic, economic, and social health of rural and urban America. This matters because many longitudinal sources of rural data, from omnibus sample surveys or government studies (e.g., the Current Population Survey [CPS]), are based on a floating universe of nonmetro counties.
Lagging population growth in “left behind” nonmetro counties is further illustrated in Figure 4. Here, we disaggregate all U.S. counties into three categories: (1) nonmetro counties throughout the study period, (2) metro counties throughout the study period, and (3) counties reclassified from nonmetro to metro during the study period (i.e., between the 1980 and 2010 fixed universes). As expected, the lowest annual growth rates are observed in counties continuously defined as nonmetro between 1980 and 2010. Although nonmetro growth rates rebounded during 1990 to 2000 after a decade of almost no growth during the 1980s, nonmetro growth slowed during the 2000s and then experienced an absolute population decline in the 2010s (on the basis of a fixed 2010 universe of nonmetro counties).

Percentage change in population, by classification status, 1980 to 2020.
What is especially striking is that population gains in nonmetro-to-metro transition counties actually exceeded endogenous growth in continuously defined metro counties for each decade between 1980 and 2010. After 2010, these new metro counties experienced slightly lower rates of population growth than metro counties did, but their growth during the past decade has yet to be fully reflected in OMB’s reclassification on the basis of the 2020 census. Reclassification of the nonmetro universe of counties in 2023 will likely only reinforce observed declines among continuously defined nonmetro counties while adding additional growth to the metro side of this demographic ledger.
Nonmetro Counties Left Behind: Net Migration and Natural Increase
The lack of demographic resilience among “left behind” nonmetro counties is further revealed in Figure 5. Here we disaggregate population growth each decade into parts due to net migration (i.e., the difference between in- and out-migration) and natural population change (i.e., natural increase or decrease measured by the difference between births and deaths). In each decade, both net migration and natural increase were higher in nonmetro-to-metro transition counties than in nonmetro counties.
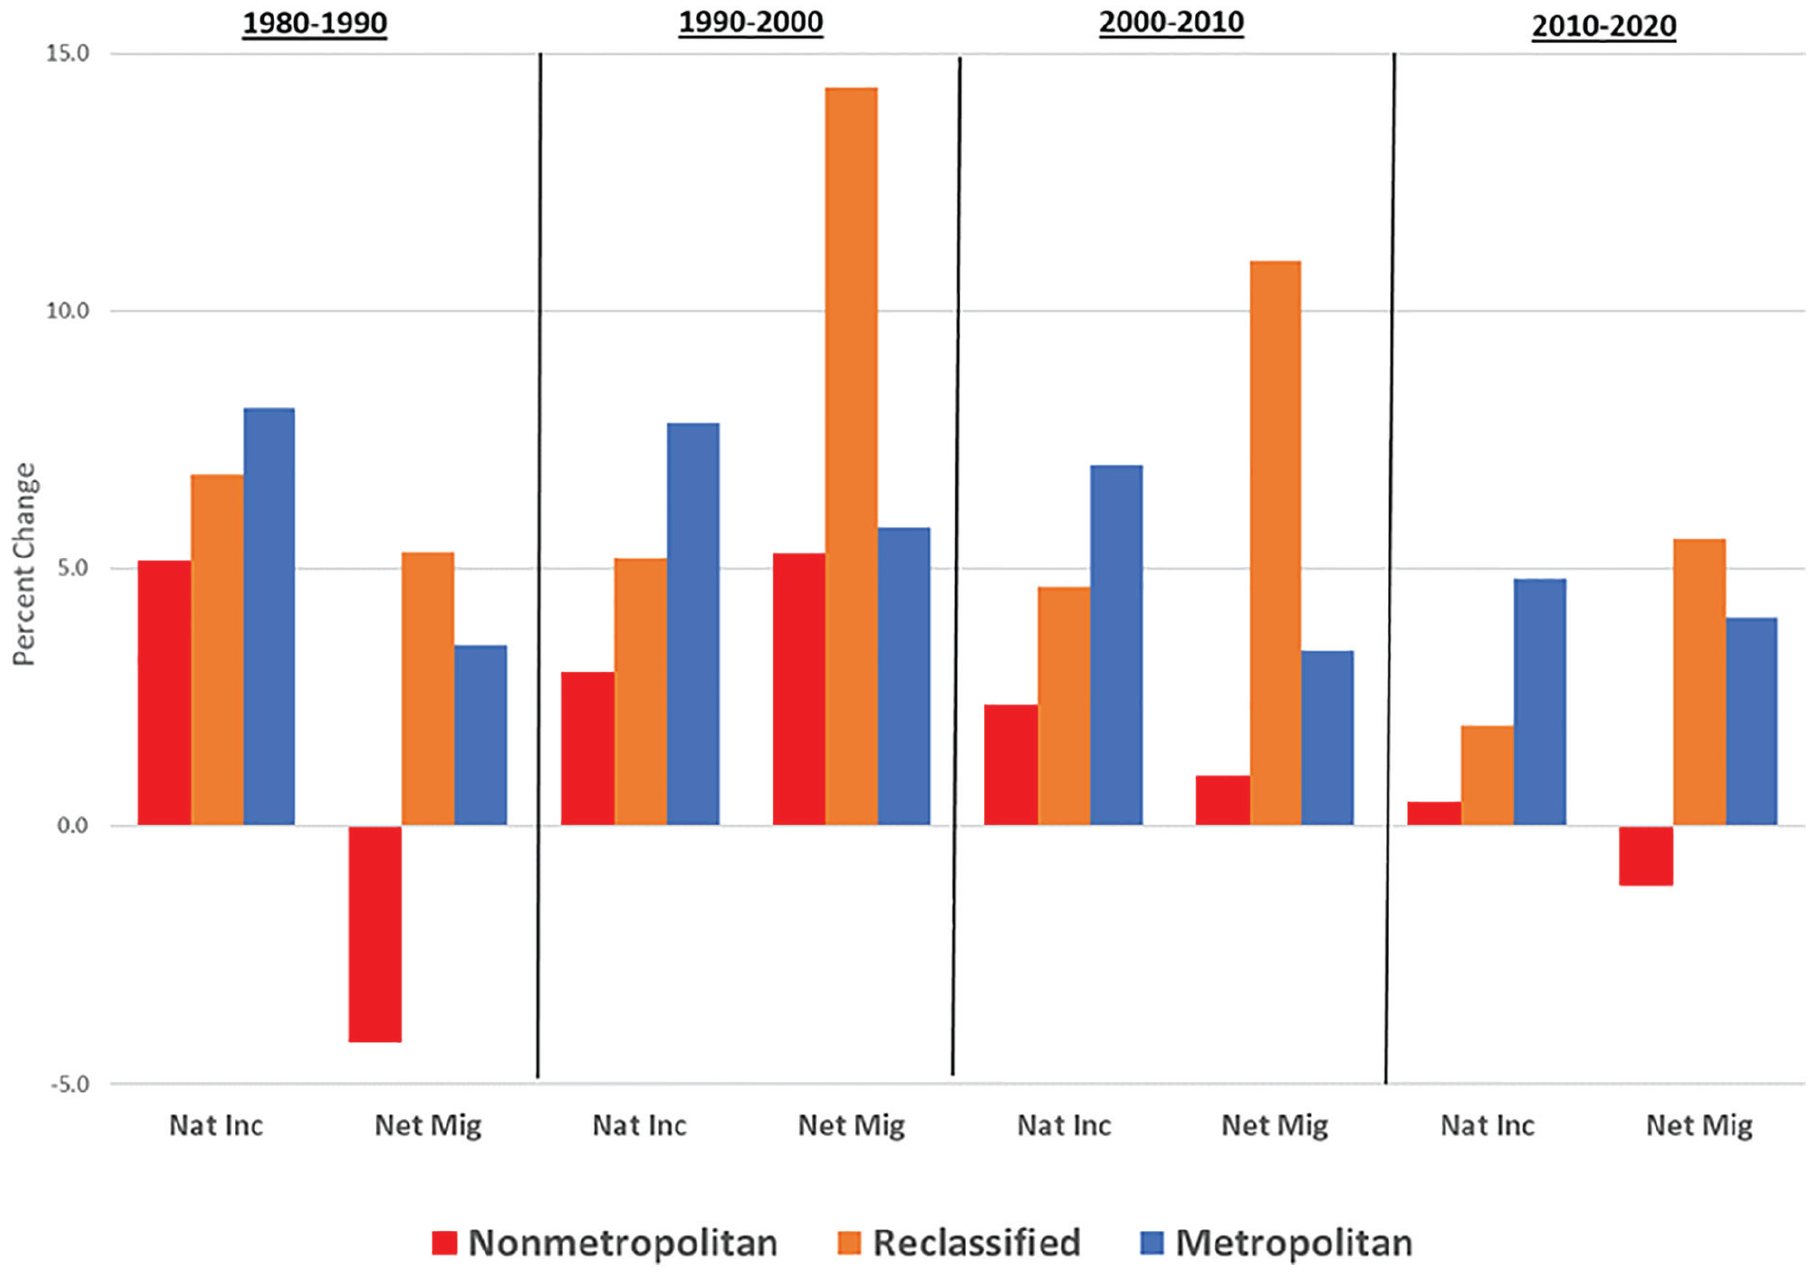
Percentage change in net migration and natural increase, by classification status, 1980 to 2020.
Perhaps surprisingly, nonmetro-to-metro transition counties, each decade, also experienced higher—often substantially higher—rates of net migration than the metro populations they joined. During the nonmetro population “rebound” of the 1990s (Johnson and Fuguitt 2000), for example, net migration rates in nonmetro-to-metro transition counties were more than double the rates observed in either metro or nonmetro counties. Natural increase has declined over time, especially in nonmetro areas, where population aging has led to elevated death rates while chronic out-migration of young adults has depleted the female population of reproductive age. In the 2010s, nonmetro natural increase was the lowest on record and, unlike previous decades, no longer fully offset net out-migration. This resulted, for the first time, in absolute nonmetro population decline over the past decade. The demographic effects of reclassification—the selective winnowing of fast-growing nonmetro counties—is now starkly revealed in those languishing rural areas “left behind” by urbanization.
Racial Disparities in Rural Growth and Decline
White Decline, Minority Growth
With growing racial and ethnic diversity, national patterns may increasingly mask racial variations in rural population growth and decline. Figure 6, for Whites (upper chart) and non-Whites (lower chart), respectively, replicates national rural trends (Figure 3) to illustrate patterns of endogenous growth and growth from reclassification. Not surprisingly, trends for Whites largely mirror rural trends nationally (cf. Figure 6 and Figure 3), albeit in exaggerated form. Using a contemporary definition, the rural White population declined from 48.0 million to 34.5 million between 1980 and 2020. Moreover, using a 2010 universe of counties, the White population already had begun to decline during the 2000s, a decade earlier than the absolute declines observed for the nonmetro population overall.

White and non-White nonmetro population change, 1980 to 2020, by floating and fixed definitions of the universe of nonmetro counties.
These patterns of White rural population decline differ sharply from minority trends (Figure 6, lower chart), which reveal upward trends between 1980 and 2020, regardless of whether fixed or floating definitions are applied. For example, using a contemporary definition, which includes both endogenous growth and population growth from reclassification, the nonmetro minority population increased from 7.7 million in 1980 to 10.8 million in 2020. It is also the case, unlike patterns among Whites, that non-Whites experienced endogenous growth during the 2010s on the basis of a fixed universe of nonmetro counties (i.e., the 2010 universe tracked through 2020). Racial diversity is now accelerating rapidly, both because of White population decline and minority population growth.
Reclassification and Endogenous Population Change
White and non-White population change culminates in overall nonmetro growth or decline each decade (Figure 7, top panel). With the exception of the nonmetro population boom of the 1990s, nonmetro growth was due almost entirely to minority growth (compare blue and gray bars). But over the past decade, overall nonmetro growth could no longer be ensured by minority growth. Rural minority growth was no longer sufficient to offset White population decline.

Aggregate nonmetro population change, endogenous change and reclassification, by race.
The rural White and non-White populations “lost” to metro reclassification have been large, as shown in Figure 7 (bottom panel). This figure shows aggregate population gains among counties that transitioned from nonmetro to metro status in every decade between 1980 and 2000. The blue bar indicates the total population each decade that was lost to reclassification. In the 1980s, nonmetro counties lost nearly 2 million people to reclassification; roughly three fourths of these were Whites. Reclassification took an especially heavy demographic toll on nonmetro growth during the decades of the 1990s and 2000s. What is different over the past two decades is that growth in reclassified counties now comes mostly from minorities, not Whites. This is most evident in the past decade, when almost all of the growth in reclassified counties was due to minority growth. This shift in the racial makeup of population growth in reclassified counties presumably is rooted in increasing racial diversity in newly reclassified metro suburban counties, which have experienced extraordinary growth of minorities over recent decades (Jensen et al. 2021; Lichter, Thiede, and Brooks forthcoming). 10
To place these results in a broader spatial context, we also compare nonmetro growth and decline in Figure 8 with metro patterns over the period from 1980 to 2020. Here, we estimate and compare rates of White and minority population growth in nonmetro, nonmetro-to-metro transition, and metro counties. Whites in newly reclassified metro counties experienced exceptionally high rates of growth in comparison with either metro or nonmetro counties. Since 2000, the nation’s White population grew only in those counties that transitioned from nonmetro to metro status.

Percentage change in non-Hispanic White and minority population, by classification status, 1980 to 2020.
Growth rates were much different among America’s minority populations. In each decade from 1990 onward, minority growth rates have declined in nonmetro, transition, and metro counties. For each decade, however, minority growth rates in (continuously defined) nonmetro counties were positive but lower than metro rates. This contrasts with transition counties, where minority growth rates exceeded those in (continuously defined) metro counties after 1990. Disproportionately high minority growth rates in newly reclassified metro counties clearly have contributed to the acceleration of racial diversity in metro America since 1980.
Regional Disparities in Rural Growth and Decline
The regional restructuring of population growth rates raises questions about patterns of rural minority growth. This is especially true in the South, which is economically heterogenous and racially diverse. It is where Blacks are overrepresented in the nation’s rural population. Moreover, growth of Hispanics in established gateways in Texas (especially in the lower Rio Grande valley) and Florida (e.g., Cubans), as well as in new Hispanic destinations in Oklahoma, Arkansas, and the Carolinas, have contributed to especially rapid growth among minority populations. But it is unclear, a priori, whether rural minority growth is due mostly to endogenous growth or to growth from reclassification.
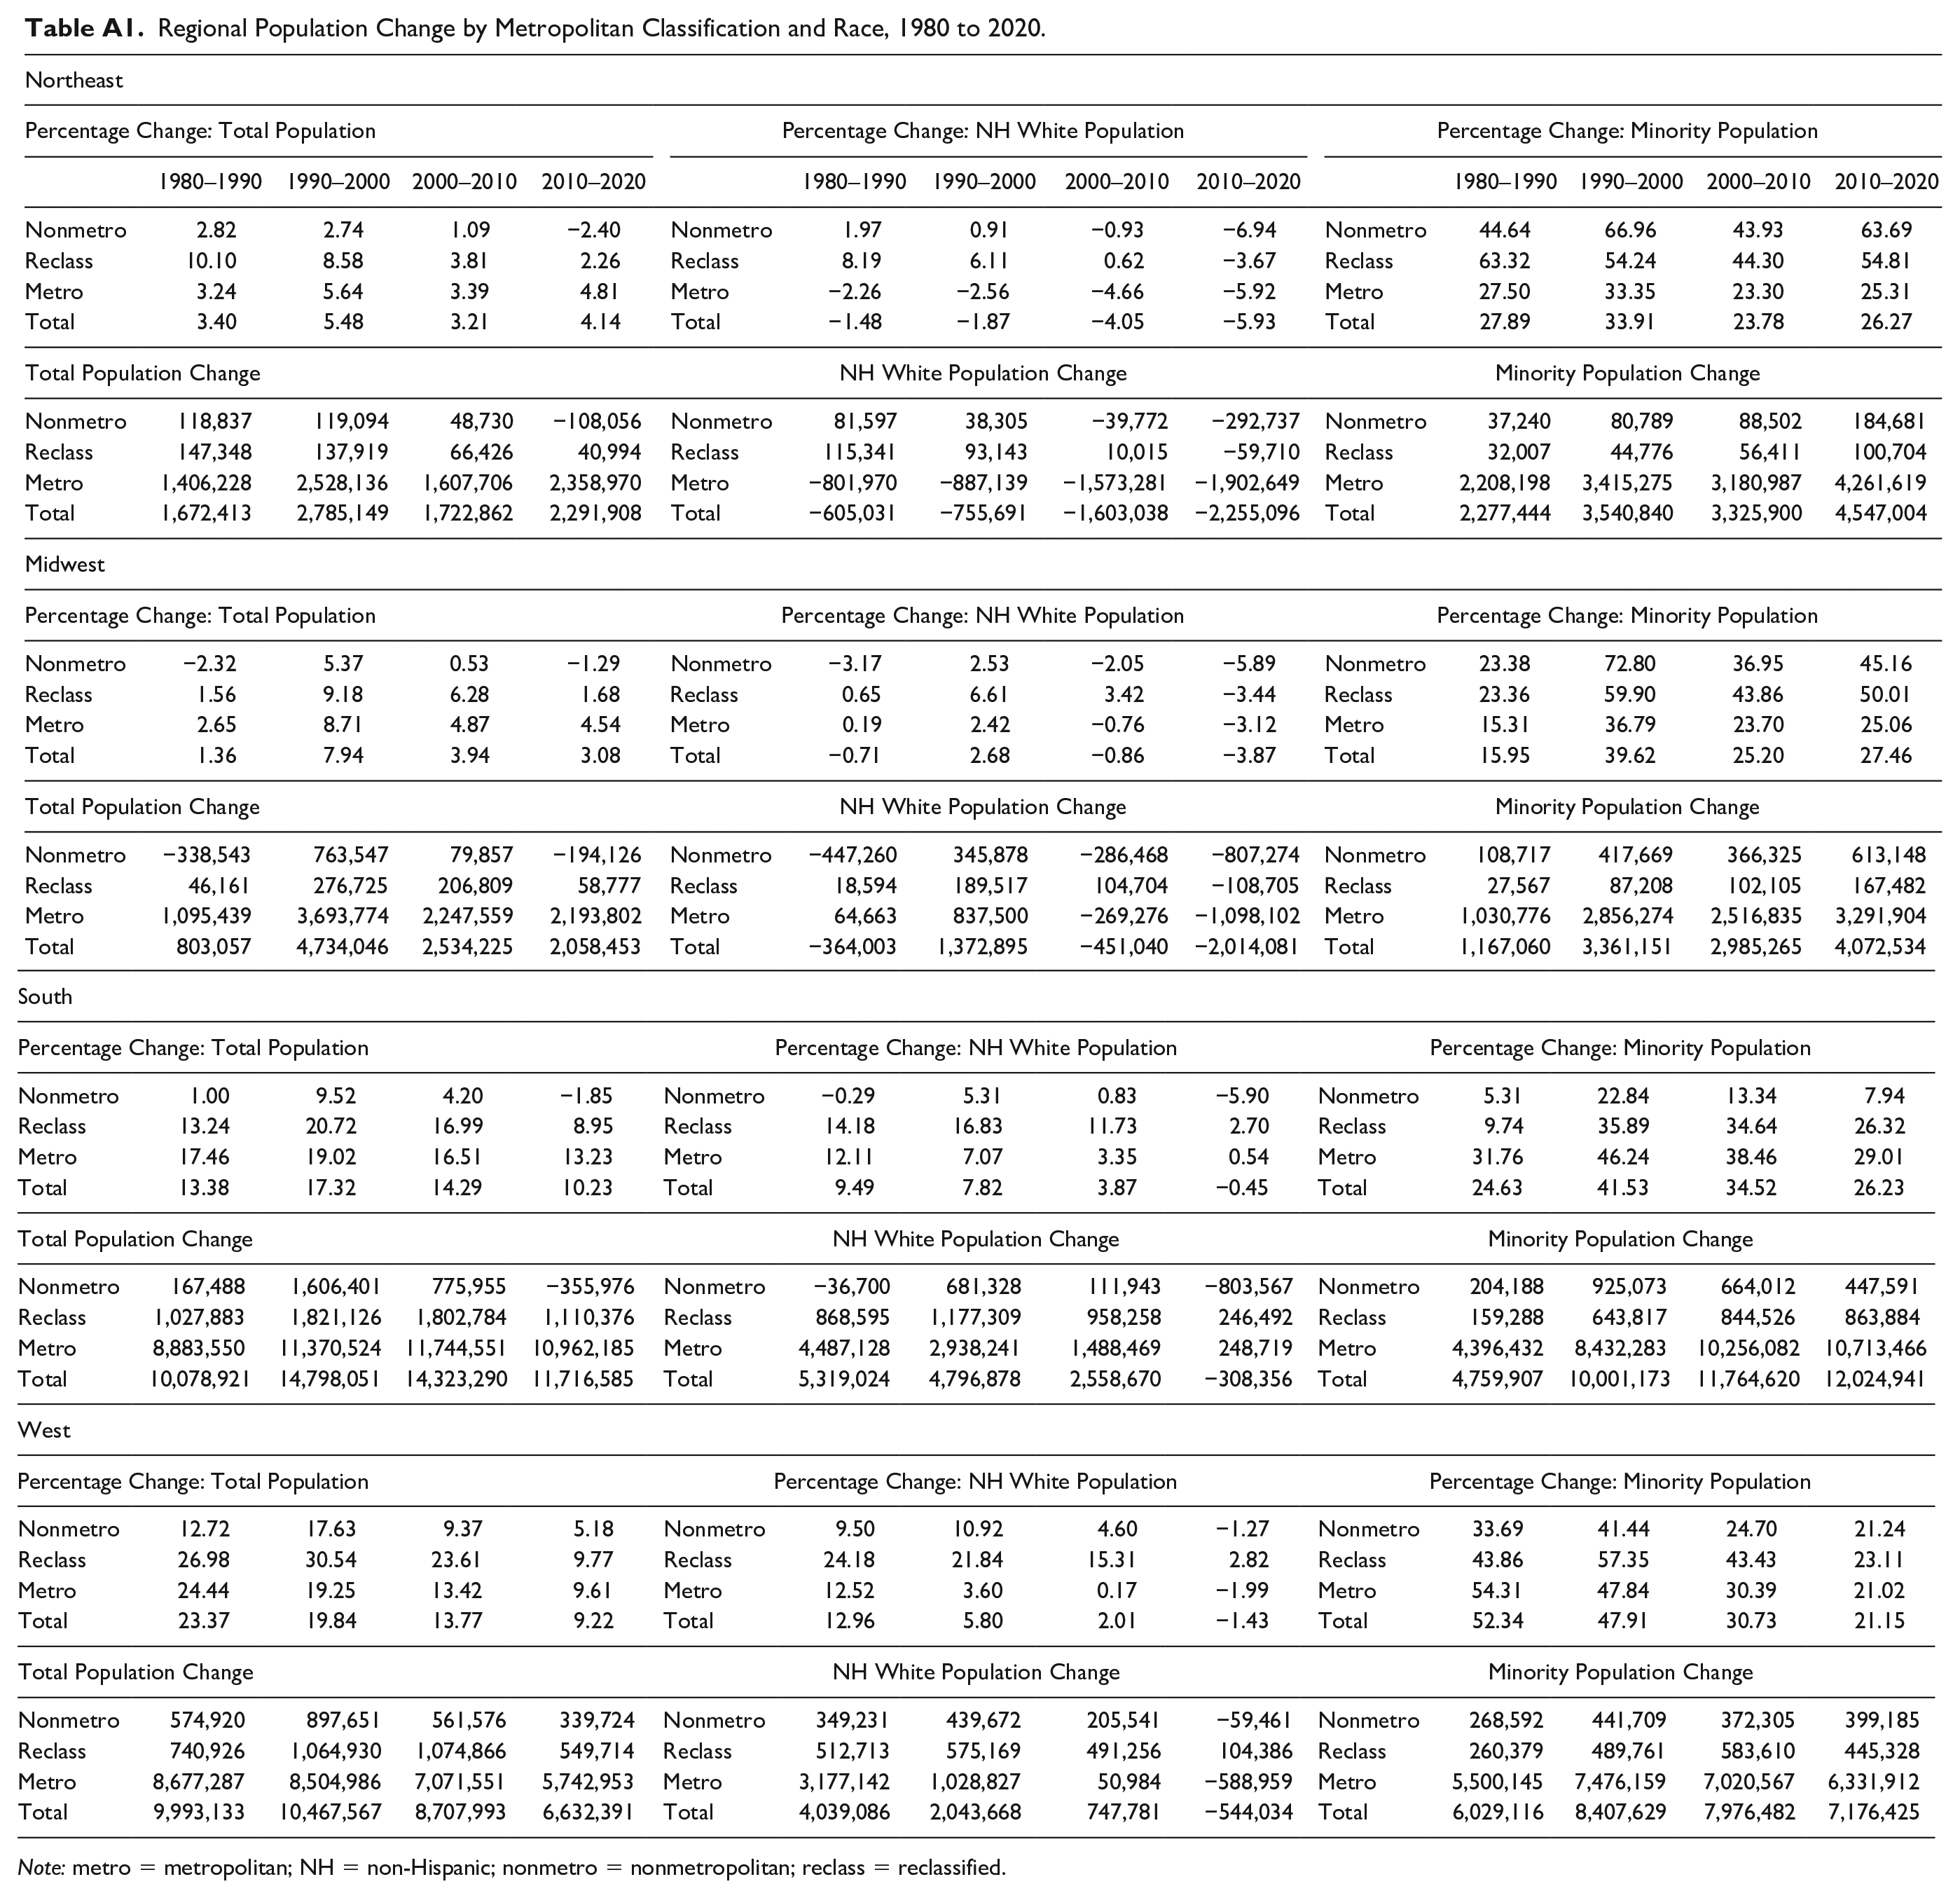
Figure 9 provides information about percentage growth rates among minorities and Whites in the South in nonmetro, transition, and metro counties. 11 Rural minorities in the South experienced substantial growth each decade between 1980 and 2010, peaking between 1990 and 2000, when nearly 1 million non-Whites were added to the South’s rural population (see regional disaggregation in the Appendix). These growth rates are based on a fixed 2010 nonmetro universe. Growth in reclassified counties was even higher, often markedly higher (e.g., 35.9 percent in the 1990s), but nonetheless remains lower than metro rates each decade.

Percentage change in non-Hispanic White and minority populations in the South, by classification status, 1980 to 2020.
Figure 9 also provides comparative estimates of White growth in the South. The key point here is that rural White growth in the South has languished since 1980. Since 2010, the White population decline in southern nonmetro counties has been unprecedented, dropping by nearly 6 percent (more than 800,000 White residents). White declines over the past decade were further exacerbated by nonmetro-to-metro reclassification, which resulted in another 246,000 rural Whites’ being transferred to the metro side of the demographic ledger (see the Appendix). Significantly, modest White population growth (.54 percent) in continuously defined metro counties is now insufficient to prevent overall White declines (−.45 percent) in the South. Roughly 2.5 million Whites were added to South’s population during the first decade of the new century. A decade later, in the 2010s, White growth was replaced by decline; indeed, the White population in the South declined for the first time (by more than 300,000 people).
White population declines over the past decade were nevertheless smaller in the South than in any other region (see the Appendix). In the Northeast, for example, the size of the White population declined overall by nearly 2.3 million, and White declines were evident in nonmetro, nonmetro-to-metro transition, and metro counties.
Discussion
Rural and urban America are increasingly interdependent (Lichter and Brown 2011). As we have shown here, this is apparent in the zero-sum element built into the way we classify rural and urban America and measure comparative growth. In longitudinal analyses, population growth in nonmetro counties is, paradoxically, often represented as “decline” because many of the fastest growing nonmetro counties have been redefined as metro. To focus strictly on rural areas, as they are classified today, is to “select” on the dependent variable (i.e., on the basis of population decline) and to risk misinterpreting social change.
Indeed, contrary to our commonplace understanding, many rural parts of America, especially those predominately White counties enveloped by outward metro sprawl, have thrived over recent decades. Metro-nonmetro administrative boundaries change over time, but this is rarely acknowledged in previous studies of urban or rural America or of the so-called rural-urban divide. Perhaps most troubling, at least from a rural development standpoint, is that ongoing administrative transfers of rural people to metro areas means that many rural counties “left behind” have become even less likely to rebound economically—to grow and prosper. Depopulation is a portent of the future.
Implications for Research and Policy
What is rural? A 2016 National Academy of Sciences report focused on “rationalizing rural area classification,” revisiting OMB’s official measures of rural or nonmetro, as well as other familiar measures that define population along the rural-urban continuum (National Academies of Sciences, Engineering, and Medicine 2016). Over time, conventional county-level measures of rurality had become less strongly associated with key social and economic indicators, such as welfare receipt, poverty, or employment. Economic inequality, both between and within rural counties, is also on the rise (Thiede et al. 2020). Accurately targeting “rural” areas for economic development, by the U.S. Department of Agriculture and by nongovernmental organizations (e.g., the Housing Assistance Council, the Center for Rural Affairs), is especially difficult without a clear understanding of shifting metro and nonmetro boundaries and reclassification. OMB recently proposed but subsequently withdrew plans to redefine MSAs and their constituent counties, requiring more stringent criteria that effectively made the likelihood of nonmetro-to-metro reclassification more difficult (Office of Management and Budget 2021a). 12
Our analyses inform this discussion by highlighting the large and often unappreciated demographic implications of both endogenous growth and reclassification. For rural-oriented scholars and urban and community sociologists, our study provides several key lessons going forward. First, at a minimum, our results suggest that many rural counties are thriving, often growing more rapidly than the universe of metro counties they join. The problem is that their growth is not “counted” as nonmetro or rural growth. The interpretative difficulties of reclassification extend well beyond issues of population growth (Hunter and Simon 2021; Li, Westlund, and Liu 2019). Is the widening gap in rural-urban mortality, for example, due wholly or in part to the transfer of growing, more affluent, and healthy counties (and people) from the nonmetro to metro side of the ledger, leaving behind declining, poorer, and less healthy nonmetro counties (Brooks, Mueller, and Thiede 2020; Elo et al. 2019)? Future studies of rural public health call for a more nuanced, and accurate, discussion of changing health conditions in rural areas. This means acknowledging reclassified counties, from rural to urban, which arguably represent an untold rural success story that provides possible lessons for rural development, population health, and long-term sustainability.
Second, our analyses highlight the fact that spatial boundaries are not fixed but fluid and often ambiguous. Yet this is rarely reflected in large multipurpose social and demographic longitudinal databases or surveys, such as the annual CPS, the American Community Survey, or the Panel Study of Income Dynamics. In the CPS, for example, tracking cyclical trends in rural employment reflect both endogenous change in local employment as well as reclassification (Slack, Thiede, and Jensen 2020). Without moving, households may shift residence from nonmetro to metro over the time series. It is difficult if not impossible to claim with any confidence whether rural economic conditions have actually changed or, instead, that the rural sample of respondents has changed. One solution is that the CPS and other omnibus national panel or repeated cross-sectional studies could routinely provide both current and floating metro-nonmetro definitions of residence over the time series.
Third, the technical issues associated with defining metro and nonmetro areas are difficult, but the conceptual problems are seemingly intractable. Rural or nonmetro areas, as they are defined today, may be rural-like in size and morphology. In trend studies, however, counties that were officially defined as nonmetro in the past are instead usually defined as metro throughout the entire time series. The interpretative implications are often unclear, even in metro areas that presumably benefit from nonmetro-to-metro reclassification and growth. Jiang et al. (2022) recently showed that reclassification boosts metro population growth directly but also indirectly by affecting changes in population composition (e.g., age distribution). In research on residential segregation, neighborhoods typically are based on tract data drawn from the universe of metro counties defined at the end of the period (i.e., a 2020 metro universe). In the typical study, metro segregation indices are estimated for MSAs that included counties that were officially defined previously by OMB as nonmetro (Logan and Stults 2021; Menendian, Gambhir, and Gailes 2021). This raises an obvious conceptual question: how can some small MSAs today be regarded conceptually as metro in earlier periods (say, in 1980) when these counties were then officially defined as nonmetro and lacked the usual markers of urbanity (e.g., size, density, morphology)? There is seemingly no straightforward technical solution to this interpretative problem (Fuguitt et al. 1988). It is a problem that nevertheless calls for greater clarity in discussions about how rural and urban counties are defined and redefined over time and how both fixed and floating definitions may distort long-term social trends and our understanding of rural-urban disparities. 13
Conclusion
This research serves an important didactic goal. The burgeoning interest in rural America (and in spatial inequality, more generally) means that accurately tracking rural social and economic change is essential for good sociological research and theory (Edelman 2021). 14 Rural America is a “moving target,” and the boundaries that separate rural from urban America are often blurred (Lichter and Brown 2011). This makes implementing cost-effective public policy increasingly difficult (Dumont and Davis 2021; Pipa and Geismar 2021). Policy debates today often center on whether sustainable rural development requires targeting resilient rural communities with the most potential for future growth while triaging lagging rural areas (Bryant and Cooper 2021; Peters 2019; Topolsky 2021). Our results suggest that resiliency is being defined downward over time as growing and economically vibrant nonmetro counties are transferred to the metro side of the demographic ledger. As a demographic winnowing process, reclassification has “left behind” rural counties least likely to grow or to respond to local rural development efforts.
Footnotes
Appendix
Regional Population Change by Metropolitan Classification and Race, 1980 to 2020.
| Northeast | ||||||||||||||
| Percentage Change: Total Population | Percentage Change: NH White Population | Percentage Change: Minority Population | ||||||||||||
| 1980–1990 | 1990–2000 | 2000–2010 | 2010–2020 | 1980–1990 | 1990–2000 | 2000–2010 | 2010–2020 | 1980–1990 | 1990–2000 | 2000–2010 | 2010–2020 | |||
| Nonmetro | 2.82 | 2.74 | 1.09 | −2.40 | Nonmetro | 1.97 | 0.91 | −0.93 | −6.94 | Nonmetro | 44.64 | 66.96 | 43.93 | 63.69 |
| Reclass | 10.10 | 8.58 | 3.81 | 2.26 | Reclass | 8.19 | 6.11 | 0.62 | −3.67 | Reclass | 63.32 | 54.24 | 44.30 | 54.81 |
| Metro | 3.24 | 5.64 | 3.39 | 4.81 | Metro | −2.26 | −2.56 | −4.66 | −5.92 | Metro | 27.50 | 33.35 | 23.30 | 25.31 |
| Total | 3.40 | 5.48 | 3.21 | 4.14 | Total | −1.48 | −1.87 | −4.05 | −5.93 | Total | 27.89 | 33.91 | 23.78 | 26.27 |
| Total Population Change | NH White Population Change | Minority Population Change | ||||||||||||
| Nonmetro | 118,837 | 119,094 | 48,730 | −108,056 | Nonmetro | 81,597 | 38,305 | −39,772 | −292,737 | Nonmetro | 37,240 | 80,789 | 88,502 | 184,681 |
| Reclass | 147,348 | 137,919 | 66,426 | 40,994 | Reclass | 115,341 | 93,143 | 10,015 | −59,710 | Reclass | 32,007 | 44,776 | 56,411 | 100,704 |
| Metro | 1,406,228 | 2,528,136 | 1,607,706 | 2,358,970 | Metro | −801,970 | −887,139 | −1,573,281 | −1,902,649 | Metro | 2,208,198 | 3,415,275 | 3,180,987 | 4,261,619 |
| Total | 1,672,413 | 2,785,149 | 1,722,862 | 2,291,908 | Total | −605,031 | −755,691 | −1,603,038 | −2,255,096 | Total | 2,277,444 | 3,540,840 | 3,325,900 | 4,547,004 |
| Midwest | ||||||||||||||
| Percentage Change: Total Population | Percentage Change: NH White Population | Percentage Change: Minority Population | ||||||||||||
| Nonmetro | −2.32 | 5.37 | 0.53 | −1.29 | Nonmetro | −3.17 | 2.53 | −2.05 | −5.89 | Nonmetro | 23.38 | 72.80 | 36.95 | 45.16 |
| Reclass | 1.56 | 9.18 | 6.28 | 1.68 | Reclass | 0.65 | 6.61 | 3.42 | −3.44 | Reclass | 23.36 | 59.90 | 43.86 | 50.01 |
| Metro | 2.65 | 8.71 | 4.87 | 4.54 | Metro | 0.19 | 2.42 | −0.76 | −3.12 | Metro | 15.31 | 36.79 | 23.70 | 25.06 |
| Total | 1.36 | 7.94 | 3.94 | 3.08 | Total | −0.71 | 2.68 | −0.86 | −3.87 | Total | 15.95 | 39.62 | 25.20 | 27.46 |
| Total Population Change | NH White Population Change | Minority Population Change | ||||||||||||
| Nonmetro | −338,543 | 763,547 | 79,857 | −194,126 | Nonmetro | −447,260 | 345,878 | −286,468 | −807,274 | Nonmetro | 108,717 | 417,669 | 366,325 | 613,148 |
| Reclass | 46,161 | 276,725 | 206,809 | 58,777 | Reclass | 18,594 | 189,517 | 104,704 | −108,705 | Reclass | 27,567 | 87,208 | 102,105 | 167,482 |
| Metro | 1,095,439 | 3,693,774 | 2,247,559 | 2,193,802 | Metro | 64,663 | 837,500 | −269,276 | −1,098,102 | Metro | 1,030,776 | 2,856,274 | 2,516,835 | 3,291,904 |
| Total | 803,057 | 4,734,046 | 2,534,225 | 2,058,453 | Total | −364,003 | 1,372,895 | −451,040 | −2,014,081 | Total | 1,167,060 | 3,361,151 | 2,985,265 | 4,072,534 |
| South | ||||||||||||||
| Percentage Change: Total Population | Percentage Change: NH White Population | Percentage Change: Minority Population | ||||||||||||
| Nonmetro | 1.00 | 9.52 | 4.20 | −1.85 | Nonmetro | −0.29 | 5.31 | 0.83 | −5.90 | Nonmetro | 5.31 | 22.84 | 13.34 | 7.94 |
| Reclass | 13.24 | 20.72 | 16.99 | 8.95 | Reclass | 14.18 | 16.83 | 11.73 | 2.70 | Reclass | 9.74 | 35.89 | 34.64 | 26.32 |
| Metro | 17.46 | 19.02 | 16.51 | 13.23 | Metro | 12.11 | 7.07 | 3.35 | 0.54 | Metro | 31.76 | 46.24 | 38.46 | 29.01 |
| Total | 13.38 | 17.32 | 14.29 | 10.23 | Total | 9.49 | 7.82 | 3.87 | −0.45 | Total | 24.63 | 41.53 | 34.52 | 26.23 |
| Total Population Change | NH White Population Change | Minority Population Change | ||||||||||||
| Nonmetro | 167,488 | 1,606,401 | 775,955 | −355,976 | Nonmetro | −36,700 | 681,328 | 111,943 | −803,567 | Nonmetro | 204,188 | 925,073 | 664,012 | 447,591 |
| Reclass | 1,027,883 | 1,821,126 | 1,802,784 | 1,110,376 | Reclass | 868,595 | 1,177,309 | 958,258 | 246,492 | Reclass | 159,288 | 643,817 | 844,526 | 863,884 |
| Metro | 8,883,550 | 11,370,524 | 11,744,551 | 10,962,185 | Metro | 4,487,128 | 2,938,241 | 1,488,469 | 248,719 | Metro | 4,396,432 | 8,432,283 | 10,256,082 | 10,713,466 |
| Total | 10,078,921 | 14,798,051 | 14,323,290 | 11,716,585 | Total | 5,319,024 | 4,796,878 | 2,558,670 | −308,356 | Total | 4,759,907 | 10,001,173 | 11,764,620 | 12,024,941 |
| West | ||||||||||||||
| Percentage Change: Total Population | Percentage Change: NH White Population | Percentage Change: Minority Population | ||||||||||||
| Nonmetro | 12.72 | 17.63 | 9.37 | 5.18 | Nonmetro | 9.50 | 10.92 | 4.60 | −1.27 | Nonmetro | 33.69 | 41.44 | 24.70 | 21.24 |
| Reclass | 26.98 | 30.54 | 23.61 | 9.77 | Reclass | 24.18 | 21.84 | 15.31 | 2.82 | Reclass | 43.86 | 57.35 | 43.43 | 23.11 |
| Metro | 24.44 | 19.25 | 13.42 | 9.61 | Metro | 12.52 | 3.60 | 0.17 | −1.99 | Metro | 54.31 | 47.84 | 30.39 | 21.02 |
| Total | 23.37 | 19.84 | 13.77 | 9.22 | Total | 12.96 | 5.80 | 2.01 | −1.43 | Total | 52.34 | 47.91 | 30.73 | 21.15 |
| Total Population Change | NH White Population Change | Minority Population Change | ||||||||||||
| Nonmetro | 574,920 | 897,651 | 561,576 | 339,724 | Nonmetro | 349,231 | 439,672 | 205,541 | −59,461 | Nonmetro | 268,592 | 441,709 | 372,305 | 399,185 |
| Reclass | 740,926 | 1,064,930 | 1,074,866 | 549,714 | Reclass | 512,713 | 575,169 | 491,256 | 104,386 | Reclass | 260,379 | 489,761 | 583,610 | 445,328 |
| Metro | 8,677,287 | 8,504,986 | 7,071,551 | 5,742,953 | Metro | 3,177,142 | 1,028,827 | 50,984 | −588,959 | Metro | 5,500,145 | 7,476,159 | 7,020,567 | 6,331,912 |
| Total | 9,993,133 | 10,467,567 | 8,707,993 | 6,632,391 | Total | 4,039,086 | 2,043,668 | 747,781 | −544,034 | Total | 6,029,116 | 8,407,629 | 7,976,482 | 7,176,425 |
Note: metro = metropolitan; NH = non-Hispanic; nonmetro = nonmetropolitan; reclass = reclassified.
Acknowledgements
The authors acknowledge the helpful comments of the editors and the external reviewers.
Funding
The author(s) disclosed receipt of the following financial support for the research, authorship, and/or publication of this article: This research was supported in part by an Andrew Carnegie Fellowship from the Carnegie Corporation of New York and by the New Hampshire Agricultural Experiment Station in support of Hatch Multi-State Regional Project W-4001 through joint funding of the National Institute of Food and Agriculture, U.S. Department of Agriculture, under award 1013434, and the state of New Hampshire. Barbara Cook of the Carsey School of Public Policy provided geographic information system support. The content is solely the responsibility of the authors and does not necessarily represent the official views of the agencies supporting their research.
1
Metro Monongalia County also grew rapidly (10.0 percent). It is home to West Virginia University in Morgantown.
2
Black Belt counties were originally defined by the region’s deep black loam soil, which was well suited to cotton production, but later were redefined by racial composition. The Black Belt today usually includes roughly 200 counties located in former Confederate states that meet some percentage threshold of the African American population (e.g., 25 percent or 33 percent).
3
Concerns about both the quality of the 2020 census and the impact of the Census Bureau’s differential privacy algorithms on the accuracy of the 2020 census remain unresolved at this time (![]() ). However, for highly aggregated analyses such as ours, any biases in patterns or trends are likely to be small.
). However, for highly aggregated analyses such as ours, any biases in patterns or trends are likely to be small.
4
Births and deaths for the final year of estimates (July 1, 2019, to June 30, 2020) were adjusted to represent the nine-month period ending April 1, 2020. For each state, provisional data from the National Center for Health Statistics (![]() ) were used to calculate what percentage of the births and deaths in the state from the final year of the estimates (July 1, 2019, to June 30, 2020) occurred between July 1, 2019, and April 1, 2020. The state percentage was then applied to each county in the state to estimate births and deaths from July 1, 2019, to April 1, 2020. Given the early onset of coronavirus disease deaths in the New York City metro area, the calculations of deaths were made separately for the counties in New York State that were part of the New York metro area and for counties in the remainder of the state.
) were used to calculate what percentage of the births and deaths in the state from the final year of the estimates (July 1, 2019, to June 30, 2020) occurred between July 1, 2019, and April 1, 2020. The state percentage was then applied to each county in the state to estimate births and deaths from July 1, 2019, to April 1, 2020. Given the early onset of coronavirus disease deaths in the New York City metro area, the calculations of deaths were made separately for the counties in New York State that were part of the New York metro area and for counties in the remainder of the state.
5
An MSA is a “Core Based Statistical Area associated with at least one Urban Area that has a population of at least 50,000. The MSA comprises the central county or counties containing the core, plus adjacent outlying counties having a high degree of social and economic integration with the central county or counties as measured through commuting” (![]() :37778). For purposes of delineating new MSAs, or removing MSAs, the “main” or “central” county requires at least one urban area of 50,000 or more population. The principal city is the largest city in the “core” or “main” county of the MSA.
:37778). For purposes of delineating new MSAs, or removing MSAs, the “main” or “central” county requires at least one urban area of 50,000 or more population. The principal city is the largest city in the “core” or “main” county of the MSA.
6
Using OMB’s preliminary 2018 metro classification provides additional insights into likely implications of post-2013 metro reclassifications. OMB’s 2020 classification is yet to fully reflect changes based on the 2020 census results. An updated classification will not be made available until 2023 or 2024. The criteria for designating new MSAs and metro counties was released by OMB on July 16, 2021, and reported in the Federal Register (![]() ).
).
7
OMB recently identified 384 MSAs, up significantly from the 257 identified in 1983 (after the 1980 census count). Many of the 127 newly designated MSAs since 1980—former nonmetro counties—represent single-county urban regions. These 127 new MSAs can be viewed as rural population “winners” that have become freestanding metro areas.
8
An exception is a significant number of nonmetro recreation and retirement counties that are doing well demographically and are likely to continue to do so (Golding and Winkler 2020; ![]() ).
).
9
To be clear, the floating definition shows nonmetro population in 1980 on the basis of the universe of nonmetro counties in 1983, the 1990 nonmetro population on the basis of the nonmetro counties as they were defined in 1993, and so forth. The 2020 universe is based on population estimates in 2018 and as such does not yet fully reflecting population changes between the 2010 and 2020 census counts.
10
The number of nonmetro counties (and people) lost to reclassification is not fully reflected in our estimates for 2010 to 2020. We used a fixed 2010 universe of counties. However, in additional analyses (not shown) using a fixed 2020 universe of nonmetro counties (on the basis of 2018 classification; see the “Methods” section), our conclusions are unchanged. Today, the growth in reclassified counties is coming largely from America’s burgeoning minority population.
11
12
The new criteria would mean that some currently defined metro counties, mostly fringe areas of existing metro regions or small MSAs, would revert to nonmetro. The conceptual problem is that there is little if any statistical or anecdotal evidence that America is now becoming more rural or less urban or metro-like. The proposal was abandoned following widespread criticism by a broad cross-section of scholars, nongovernmental organizations and policy groups, in part because of concerns that lagging nonmetro counties would be forced to compete for federal funding with newly designated and better resourced nonmetro counties that were formerly classified as metro.
13
Using a beginning-of-period definition of metro areas as an alternative also is problematic; newly classified metro counties would be excluded in the analyses. Estimates of metro segregation in 2020 would be missing large numbers of counties that first became metro in 1980 (![]() ). One possible but imperfect solution is to include counties (as metro or nonmetro) only at the time they are officially defined as metro or nonmetro (i.e., a floating definition). The downside is that over-time comparisons include a different set of counties or tracts from decade to decade.
). One possible but imperfect solution is to include counties (as metro or nonmetro) only at the time they are officially defined as metro or nonmetro (i.e., a floating definition). The downside is that over-time comparisons include a different set of counties or tracts from decade to decade.
14
Not surprisingly, the politics of rural and urban America have shifted considerably since the election of Donald Trump in 2016 (Johnson and Scala 2020; Monnat and Brown 2017; ![]() ).
).