
Abstract
Research, advocacy, and archival projects related to incarceration often lack knowledge about the ongoing conditions of carceral facilities, and myriad challenges prevent stakeholders from successfully conducting outreach with incarcerated people. Using a case study of archival materials contributed to PrisonPandemic, wherein letters and phone calls were invited and accepted from people incarcerated in California during the coronavirus disease 2019 pandemic, the authors demonstrate a novel outreach method using web scraping and postal mailing. They analyze PrisonPandemic’s outreach, rejection rates, and response rates to 20 county jail systems from October to December 2021. The authors find that scraping and mailing help overcome typical challenges associated with conducting outreach with this population. Scraping and mailing can create a comprehensive sampling frame to achieve response rates comparable with that of traditional outreach methods to nonincarcerated populations. The authors discuss applications beyond pandemic periods and incarcerated populations, as well as the benefits, challenges, and ethical implications of using scraping and mailing.
Understanding what happens inside carceral facilities, especially through outreach to incarcerated people, is both essential and challenging. Many features of the criminal legal apparatus—including penal policy (Clear 2007), visitation (de Jong et al. 2022), community supervision (Bonta et al. 2008), and prisoner society (Liu, Pickett, and Baker 2016)—have been referred to as a “black box”; accordingly, researchers have worked hard to gain access to these domains. All carceral facilities (e.g., state and federal prisons, reentry facilities, and immigrant detention facilities) are challenging to access, and jails are a particularly opaque domain. But jail incarceration, the gateway to the criminal legal system, is an exceedingly common experience, with nearly six times as many people cycling through jails compared with prisons each year, with consequences for individuals, families, and communities (Turney and Conner 2019). Given the ubiquity of jail incarceration in the United States, its frequent omission from carceral studies is particularly egregious.
Jail incarceration is so common and its consequences so severe that researchers, advocates, and archivists have a sustained need to know about the conditions of county jails and the people incarcerated within them. However, because of a lack of information transparency—a result of cultures of silence (Page 2011), misleading data and policies (Doob and Sprott 2020; Holden 2023), the fractured nature of county-level authority (Littman 2021), and the bias of institutional communications (Garland 1990; Lynch 2015; Page 2011)—such information is neither readily available nor feasibly producible. These obstacles prevent even government agencies from obtaining information on the conditions and operations of local jails (Tchekmedyian 2022). Therefore, collecting information from people incarcerated in jails is important for understanding this sizable population that is largely missing from discussions of the causes, conditions, and consequences of this form of criminal legal contact.
In this article, we outline a novel method of outreach consisting of web scraping and postal mailing that can be used by researchers, advocates, and archivists to contact people incarcerated in carceral facilities (and one that can be adapted for outreach in other domains). Using a case study of archival materials contributed to our project, PrisonPandemic, in which we accepted letters and phone calls from incarcerated people in California during the pandemic, we focus on the specific case of outreach to people in county jails. We use original data from PrisonPandemic, for a sample of California county jail systems, to document and quantify our outreach (by mailing letters to people in jail) and to compile a catalog of return-to-sender mail (which we define as mail rejected by a jail facility or post office and sent back to us). We calculate and describe patterns of response (stories we received from a specific facility after outreach to that facility) and rejection (the letters returned from jails and post offices). We find our method of scraping and mailing yielded a comprehensive sampling frame and achieved a response rate comparable with that of traditional outreach methods to nonincarcerated populations (albeit one that varied across counties). The primary reasons for rejected mail were related to custody (usually indicating that someone was no longer in jail), suggesting that response rates depend at least partially on organizers’ ability to quickly mobilize web-scraping data during limited windows of accuracy and to develop standardized rules and procedures related to outreach.
Methodological Challenges to Reach Incarcerated People
Incarcerated people are a hard-to-reach population by design. 1 Incarceration necessarily isolates individuals from society and silences their voices. Many people inside carceral facilities spend their lives trying in vain to tell their stories to the free world (O’Connor 2003), and many researchers and advocates try in vain to hear these stories. Commonly used national surveys relying on households to sample respondents exclude incarcerated people (Pettit and Sykes 2015). Given the stark racial stratification in incarceration, research that excludes incarcerated people effectively masks stagnating rates of educational attainment, political engagement, and wages among Black people (Pettit 2012). A sampling frame that is inclusive of, or even exclusively for, engaging incarcerated people does not readily exist; rarely does one know how many people are in a given carceral system, let alone the particularities of that population or a means of systematically contacting them. Moreover, all researchers, not just those focused on incarcerated people, are adapting and innovating their methods amid a broader trend of traditional outreach methods’ decreasing yields. Over the past 50 years, mail survey responses have dropped from 70 percent to 20 percent (Stedman et al. 2019), and phone survey responses are hovering around 6 percent (Kennedy and Hartig 2019).
Furthermore, since the late 1970s, obtaining research approval from relevant agencies, such as local sheriffs’ departments and state departments of corrections, has been notoriously difficult (McCorkel 2022; Reiter 2016) and rarely translates into institutional support in the field required to conduct research. Such arrangements can also be slow, fragile, and vulnerable to crises, such as a global pandemic, and can underscore the realities of working with street-level bureaucrats with limited resources (Turney et al. 2017). A primary justification for the extensive gatekeeping of carceral research is that incarcerated people are a “vulnerable population,” a designation that is not without cause. History is rife with examples of the social and medical sciences’ subjecting incarcerated people to inhumane and unethical experimentation (Reiter 2009). 2 Incarcerated people are also rendered vulnerable to nonmedical and nonexperimental research by the very nature of their deprivations. Even taken-for-granted aspects of research, such as participant remuneration, are ethically complicated or simply made impossible when working with this population (Turney et al. 2017). Potential participants might fear being retaliated against for talking to researchers or that disclosure might influence their case; it can be challenging to evaluate and navigate those concerns. Carceral scholars continue to debate whether incarcerated people can consent to research at all, considering the deeply coercive nature of incarceration (Reiter 2021). These barriers are structured into incarceration and incarceration research, stopping scholars actively trying to do incarceration research and disincentivizing others before they begin (Reiter 2014).
Despite the many barriers that have developed between researchers and incarcerated people since the late 1970s, particularly determined researchers have had success in conducting research with this population. Prisons are the most represented empirical site among this small but important body of research. Prison ethnographers were tasked with the unique challenge of reinventing their form after traditional ethnography became all but impossible inside. They broadened their empirical domains, taking their work internationally (Cunha 2014) and exploring locations outside and around carceral facilities as sites of punishment (McCorkel 2022). Some qualitative researchers continue to access prison interiors and produce work in numerous substantive areas, including gender and incarceration (Sumner and Sexton 2016), solitary confinement (Reiter et al. 2020), penal labor (Gibson-Light 2018; Gibson-Light and Seim 2020), preparations for release (Seim 2016), and parole hearings (Greene and Dalke 2020).
In addition to issues of access are the conditions of access. The notable research detailing the myriad challenges of conducting incarceration research (e.g., Fox, Zambrana, and Lane 2011; Jeffords 2007; Kreager and Kruttschnitt 2018; Megargee 1995; Reiter 2014; Trulson, Marquart, and Mullings 2004) near universally concludes that institutional collaborations are necessary to gain access but are far from reliable. Some researchers have been quite successful in partnering with local agencies to develop and validate jail-based forensic instruments for assessing mental health and risk (e.g., Steadman et al. 2005; Teplin and Swartz 1989). With the notable exceptions in which incarcerated people are the primary investigators (e.g., Walker 2022b), virtually all incarceration research is done using such arrangements. Some scholars have been critical of this strategy (e.g., Megargee 1995; Reiter 2014), arguing that it is predicated on arrangements that benefit and legitimize carceral institutions and severely limit the possibilities of research and potentially bias data. Furthermore, involving incarcerated people in research that may be seen as critical of correctional agencies poses risk to participants. Carceral institutions are notorious for retaliating against perceived dissent from incarcerated people (Calavita and Jenness 2013; Robertson 2008); thus, researchers should consider how institutional actors are involved. Some researchers have responded to these restrictions by using public records requests to access institutional documentation of prisoner health (e.g., Li et al. 2022; Sugie et al. 2023) or by interviewing formerly incarcerated individuals in the community (e.g., Reiter 2016; Sanders et al. 2022). This latter approach may be more limited than is often credited, in that formerly incarcerated individuals represent a fundamentally different population and one that can be similarly “hard to reach” (Ellis 2021).
Complications with Jail Incarceration Research
Irwin’s (1985) aptly titled The Jail was the first major modern research endeavor to explore jail incarceration. In that seminal work, Irwin drew on his own incarceration experience and interviews with others to investigate the criminogenic climate of county jail systems. The small collection of researchers who have entered jails in the intervening time have done so on the shoulders of that initial ethnography, expanding Irwin’s “rabble” thesis (Backstrand, Gibbons, and Jones 1992), updating descriptions of the heterogeneity of jail populations (Petersilia, Turner and Fain, 2020), and assessing the punitiveness of these systems (May et al. 2014). One recent piece especially effectively studies jails as a social system: Walker’s (2022b) ethnography of time, race, and social organization in a California county jail, which was made possible only by the “experiential access” (Walker 2022a:557) he gained while incarcerated there. Other research projects, such as the Jail and Family Life Study (Turney 2020), have conducted longitudinal qualitative interviews of people incarcerated in jails. Similarly, other scholars have used publicly available, but somewhat limited, data sources, often combining official county jail data with data from the U.S. census, the American Community Survey (ACS), and state departments of health (Reinhart and Chen 2020, 2021). These studies are valuable but limited, as researchers must plan their work around the severe restrictions imposed by the carceral domain and often must choose between research designs that would otherwise be suboptimal or alter the work entirely (Reiter 2014, 2016; Turney 2020).
The Case of PrisonPandemic
PrisonPandemic provides an illustrative approach to learning about the experiences of people in carceral facilities. An archival project developed in response to the coronavirus disease 2019 (COVID-19) crisis, PrisonPandemic includes stories from people incarcerated in California jails and prisons. In the frantic early days of what would become an era of mass death (Sugie et al. 2023), our team of faculty members and graduate students knew that the pains of COVID-19 would be felt differently by incarcerated people than their nonincarcerated counterparts and, accordingly, wanted to develop options to allow this population to directly communicate their experiences. We saw that carceral facilities were laying off nonessential staff members, suspending visitation, and canceling research projects. Our team intuited—from prior experience living in, working in, and conducting research in these facilities—poor institutional transparency about the crisis unfolding inside. At first, we raised money to donate protective equipment to local carceral facilities; through informal outreach among our networks of incarcerated people and their loved ones, we realized that people were desperate to share their experiences. We were eager to accept and disseminate incarcerated people’s stories for public sharing, but we first had to develop an ethically acceptable and institutionally feasible means of receiving stories from incarcerated people.
Ethical Considerations
Conducting outreach with incarcerated people as an institutionally affiliated project involves a multitude of ethical considerations. Our research team acknowledged a strong ethical obligation to incarcerated people. We identified and addressed potential risks to incarcerated people sharing their stories with PrisonPandemic. One ethical concern was preventing prison staff members from identifying and retaliating against incarcerated contributors (Calavita and Jenness 2013; Robertson 2008) while respecting archive contributors’ desires to share personal, individualized stories. We were also concerned with ethically communicating with incarcerated people, as we were limited (e.g., by guidance from campus counsel, resources, academic quarters that resulted in student support turnover every 10 weeks) in what we could ask, share, and provide to participants. Finally, we considered the potential systemic harm of web scraping publicly available jail roster data to conduct outreach with incarcerated people. Given that booking information is traded within a privatized informational economy that performs an extralegal digital punishment (Lageson 2020), we questioned whether such data should exist at all and considered the ethics of using it ourselves.
PrisonPandemic also went through the procedures outlined by our institution’s institutional review board (IRB); it was ultimately deemed to be outside the scope of IRB oversight as an archival project. 3 PrisonPandemic turned to the best practices of community-engaged research (Newman et al. 2011), archival science (Culbertson and Lanthorne 2021), and oral history (Oral History Association 2009) to establish protection and anonymization practices. We also established a community advisory board of previously incarcerated and system-impacted people to consult on outreach and story processing practices (for a more general discussion on the ethics of our archiving process, see Arroyo-Ramirez et al. 2025; Rowland, DeCaro, and Reiter forthcoming). To help with ethical communication, we worked with campus counsel to develop outreach language that was clear about how stories would be processed and shared. Ultimately, PrisonPandemic took appropriate steps to mitigate potential harms and weighed them against the benefit of hearing directly from incarcerated people during a time of unprecedented danger, deciding in favor of outreach.
Declarative bodies (e.g., IRBs, agency review boards) vary substantially by institution, including in their assessment of what types of projects require a full formal review and what is required of that review. Considering this variation in the context of incarcerated people’s heightened vulnerability, we encourage those interested in scraping and mailing to take a proactive and critical approach to outreach, including but not limited to consulting with their IRBs. Conventional approaches to carceral research may involve institutional collaborations as part of their ethical and methodological frameworks. However, given the context of the COVID-19 crisis (e.g., locked down carceral facilities, rapidly changing carceral conditions, and concerns about possible institutional violations relating to incarcerated people’s health and safety), PrisonPandemic needed to innovate a responsive and comprehensive outreach method that did not depend on gatekeeping by county correctional systems. Indeed, research collaborations with county correctional systems were largely on hold during the pandemic. Even if researchers could gain access to carceral facilities during this time, we were concerned about the possibilities of carceral staff retaliating against contributors, and it would have been logistically challenging, if not impossible, to initiate and establish timely partnerships with all of California’s 58 county agencies.
Outreach Process
Our outreach process evolved quickly in the early days of the COVID-19 pandemic. We developed a process that was broadly comprehensive for all carceral facilities in California and able to respond quickly to new outbreaks. Our primary outreach included large-scale mailings to carceral facilities: first state prisons (in 2020) and then county jails (in 2021 and later), as well as federal prisons and immigration detention facilities. Between fall 2020 and spring 2022, we sent direct mail letters into facilities, asking people to voluntarily share their stories by calling our hotline or mailing a letter to our post office box. We accepted that this approach would be resource intensive. It required, among other things, individually sending tens of thousands of letters to incarcerated people, fundraising to cover the costs of stamps, and consistently staffing a hotline.
Direct mail outreach also required a strategy for identifying individual people’s names and addresses inside carceral facilities. At first, when we initially reached out to prisons, we searched the Internet for common last names (such as “Jones” and “Gonzalez”), input these names into California’s state prison system “inmate locator,” and generated lists of people for whom undergraduate letter writers could contact. 4 This initial process was slow and inefficient. Obtaining roster information using common last names was difficult and unreliable, letter writing labor was slow and constrained our weekly outreach goals, mistakes occurred while addressing and sending mail, and our coverage of each facility’s population was poor. Within a few months, however, we developed a more efficient process for scraping rosters of entire prison and jail facilities, our labor supply grew, and we frequently wrote to all people incarcerated in a facility. We use this considerable learning curve to think about PrisonPandemic as a blueprint for future projects wishing to contact incarcerated people using the scraping and mailing method, asking the following research questions: How did we create a sampling frame (of the population of people incarcerated in jail)? What are strategies for reaching out to people in this sampling frame? What special considerations (e.g., length of stay, court dates, sentencing) do these strategies warrant? What are the successes (e.g., rate of response [ROR]) and challenges (e.g., rate of return to sender [RTS]) associated with this approach?
Our approach to contacting incarcerated individuals for this archive is generalizable, flexible, responsive, and relevant to other research projects and populations beyond pandemic periods (and beyond carceral settings, a point we return to later). Obtaining complete rosters of incarcerated people provides researchers an appropriate sampling frame to achieve a representative and generalizable sample. The method is applicable across a range of correctional systems (e.g., county jails, state and federal prisons, reentry facilities, immigrant detention facilities) and population sizes. The outreach process is the same for correctional systems with populations of 15,000 and those with populations of 10. Reaching out in this way allowed us to quickly triangulate new empirical insights (e.g., the affective response to infection surges) as events rapidly unfolded, and to respond to new priorities both internal (e.g., archive expansion, storage space) and external (e.g., outbreak locations) to the project. Scraping and mailing was developed as a response to decreased institutional transparency during a time when information was most critical, but these methods are also applicable to nonpandemic periods. In fact, populations, incarcerated or otherwise, are rarely hard to reach by choice; the very forces that render them “hard to reach” are those that urge us to find innovative ways to make contact (Reiter 2014).
Data and Methods
Starting in October 2020, we wrote letters to tens of thousands of individuals incarcerated in facilities across California, asking them to share their stories through our hotline or post office box. 5 PrisonPandemic was driven by the urgency of the COVID-19 crisis, and thus we did not consistently track the totality of our outreach effort. We estimate we sent 43,000 letters to 180 adult facilities. As of November 2023, we had received more than 3,700 letters and 800 calls from 129 facilities spanning county jails, forensic and state hospitals, state and federal prisons, and immigration detention centers. We began systematically documenting our outreach activities in the fall of 2021, tracking the numbers of letters sent to each facility (predominantly jails, the primary focus of this article, during that time) and the date these letters were sent. 6 We focus here on outreach to 20 county jail systems from October through December 2021.
Data
We conducted outreach to 20 county jail systems during fall 2021. We generated original data documenting the number of letters sent; the numbers of calls and letters received in response to our letters; and the number of our sent letters that were returned to sender, defined as letters that were rejected (by a carceral facility or post office) and returned to us through the mail. We used secondary data sources to construct county-level characteristics to compare our analytic sample of 20 counties with all counties in the state. These sources include ACS 5-Year Data, 2016 to 2020 (ACS5); the California Board of State and Community Corrections (BSCC) Jail Population Trends Dashboard (2021); Politico’s coverage of the 2020 presidential election; and the Jail Data Initiative (JDI), a database comprising daily web scrapes of available county jail rosters.
Outreach Process
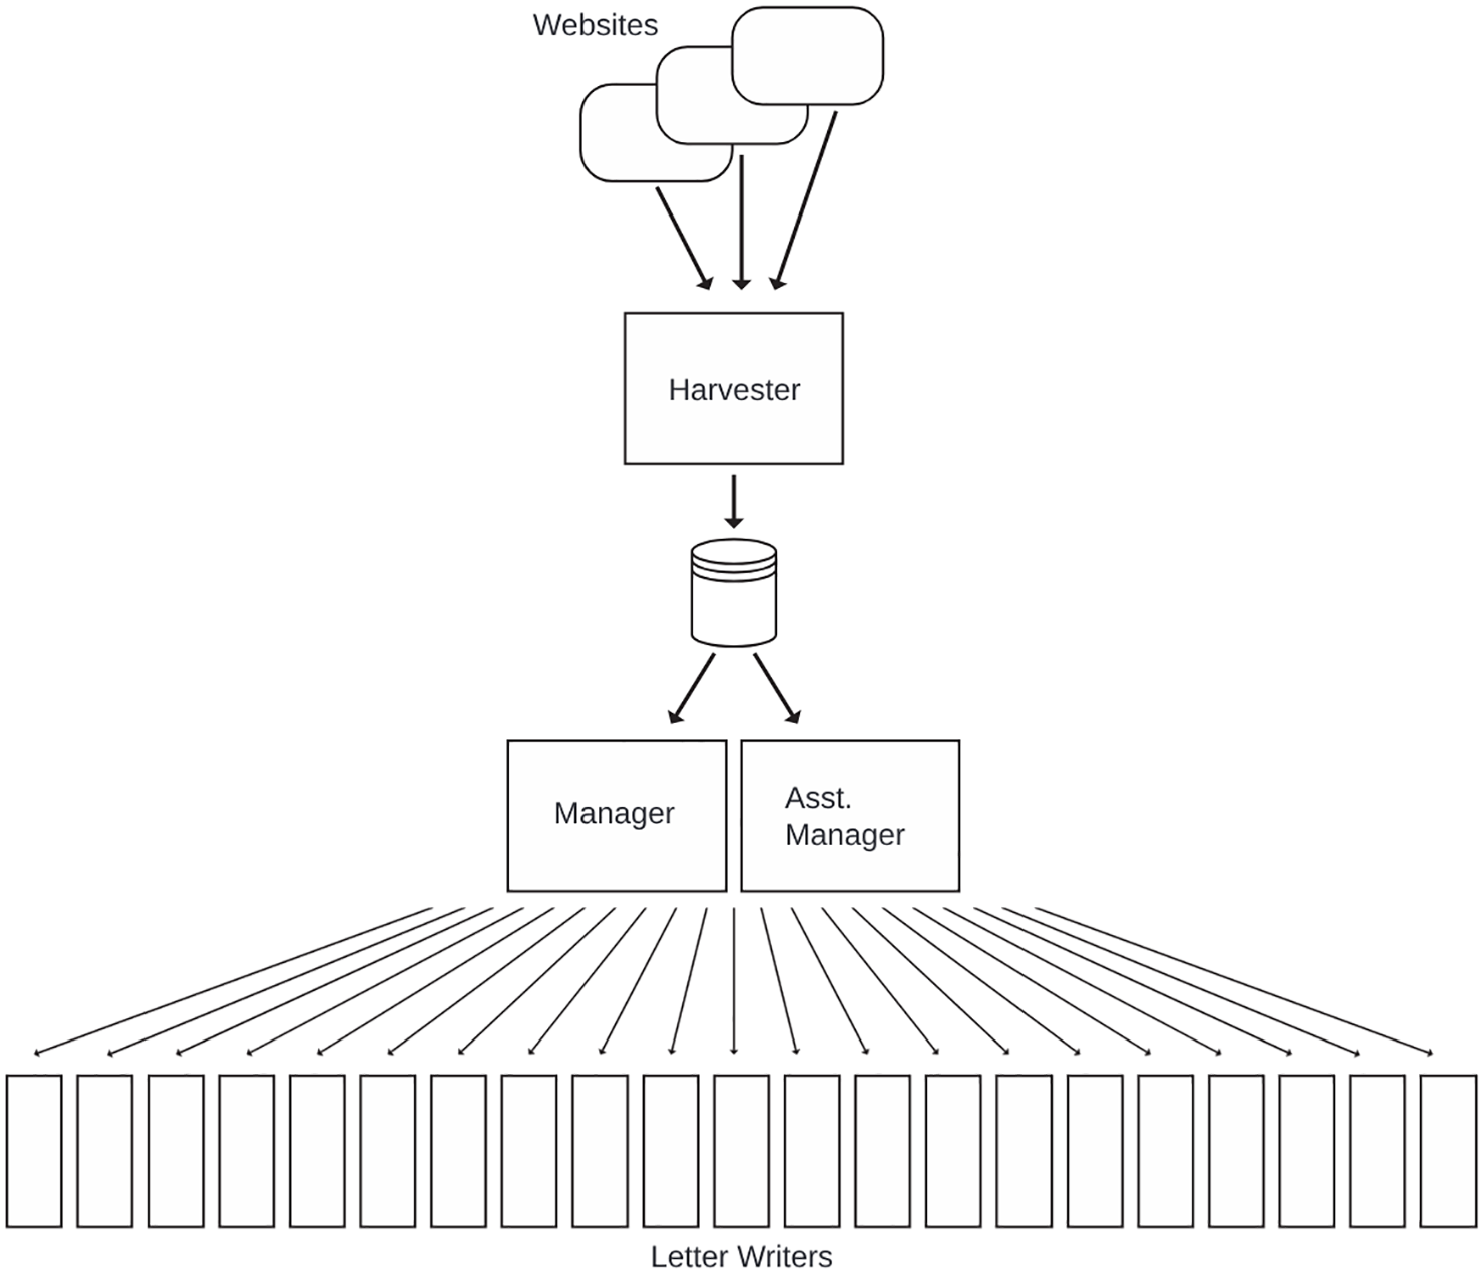
During fall 2021, the outreach team comprised 35 undergraduate students each writing a minimum of 80 letters per week, one graduate student and one undergraduate student assistant managing the assignments to the letter writers (hereafter, managers), and one graduate student responsible for harvesting the contact information from publicly available Web sites (hereafter, harvester) (see Figure 1). Jail agencies (or their contractors) manage these publicly available Web sites and list information about people currently incarcerated. These Web sites are typically used by individuals (often loved ones or attorneys of the incarcerated) to look up relevant information (e.g., location, court dates, charges) about one person at a time and use restrictive interfaces oriented toward that purpose. By writing web-scraping programs—scripts to programmatically access these Web sites or the application programming interface underlying them, performing exhaustive queries for all individuals in custody at that time, and downloading their data to a local database—we circumvented interface limitations and retrieved large batches of records.
Outreach Team Organization and Workflow.
The web-scraping harvester worked one or more weeks ahead of the other teams to script web-scraping applications for as many facilities as was required to meet the weekly quota of 2,800 letters (35 students writing 80 letters each). The information required for sending letters varies across counties and facilities but generally include first and last name, current housing facility, identification number, and housing location. We collected data through programmatically accessing county and agency web applications. However, because these applications and their hosts are independent of each other, they did not share functionality or, for the most part, architecture, requiring each agency and county to be scripted individually. We chose to write our own web-scraping applications, but similar information is available for many U.S. jails through JDI. 7
The harvester stored collected data in a central data frame for managers to access and evenly divide across the 35 letter writers. Letter writers had one week to verify the individual was still in custody (using the relevant jail Web sites), address and send a printed copy of the outreach template (see Appendix A) for every verified individual assigned to them, and document their work. Managers provided students training materials, including a letter template and general guidance on how to conduct this process.
Many institutions have strict requirements for incoming mail, including, but not limited to, prohibiting address labels and certain types of inks. These rules are usually but not always made explicit in agency documents. For parsimony and to prevent mass rejections, we adopted general practices that satisfied the strictest requirements we encountered; this included hand-addressing all envelopes with a pencil. The letters themselves were printed, and students wrote their signatures and the recipients’ names. Managers also provided additional instructions, such as address and postage rules, each week relevant to the specific county jail systems that were assigned (see Appendix B). Over the outreach process, we required additional stricter documentation for completed assignments. In fall 2021, we began requiring dated photographs of completed letters to be sent to managers weekly. This additional step allowed us to more confidently estimate the number of letters sent.
Measures
Letters Returned to Sender
Some outreach letters were rejected and returned through the mail (by a carceral facility or post office), marked “return to sender.” We logged each RTS letter, recording its intended county, postmark date, and any written, stamped, or printed artifacts on the returned envelope. This documentation allowed us to produce an exact count of RTS letters by county. We calculated a rate of RTS by dividing the number of RTS by the range of estimates for letters sent (see subsequent discussion for more details on this range).
We coded each letter to describe the reason it was returned, and we calculated rates of RTS by reason and by county. Initial categories included not applicable, unknown, 8 incorrect address, incorrect identification number, rules violation, not in custody, and incorrect postage. We then collapsed these into three main categories: not in custody, sender error, and other. The not in custody category denotes letters that were returned because the intended recipient was not in custody at the time the letter was received by the jail. Common indicators of this category include stamps, stickers, or handwriting with the following language: “not in custody,” “not in service,” or simply “NIC.” The sender error category collapses several categories—incorrect address, incorrect identification number, rules violation (e.g., “no sticker labels,” “no gel ink”), and insufficient postage—that suggest that, if not for a sender error, the letter may have been successfully delivered. The other category collapses the not applicable and unknown categories, representing any reason that was unintelligible (e.g., handwritten messages such as “SUB.101”) or not obvious (i.e., no indicators or RTS).
Stories Received
We documented each letter and call we received, tracking its county of origin and postmark date. We calculated the estimated ROR by dividing the number of responses by the range of estimates for letters sent for each county (see subsequent discussion for more details).
Letters Sent
Each week during the quarter, we assigned each letter writer 80 letters to write and mail (for a total of 2,800 letters across the 35 letter writers). Even though we tracked this process more carefully compared with prior periods, there remains uncertainty about the exact number of letters sent. As a result, our measure of total letters sent, for each county jail, is a confidence level ranging from 0 to 3, with 0 representing the lowest level of confidence in the number of letters sent and 3 representing the highest level of confidence in the number of letters sent.
Our uncertainty in the number of letters sent reflects two main factors related to the pandemic era of crisis response; we expect that researchers replicating this approach could minimize this error. First, students and faculty members were still largely remote during our outreach, meaning that students wrote and sent letters on their own time, unsupervised. Second, students often experienced their own disruptions because of COVID-19 (e.g., infection, caring for sick family members, working additional hours or new jobs), and keeping a consistent letter-writing pace was often infeasible. Several weeks into fall 2021, we realized that one or two students were not writing letters. In response, we developed a process for students to submit weekly Google Forms attesting to writing their assigned letters and submitting photos of the letters addressed and stamped (in contrast to our previous method of only asking students to complete a Google Sheet noting the date they sent their letters).
To construct a measure of letters sent, the research team reviewed each assigned letter to assess if it had been sent (as noted by the student in the Google Form) and the accuracy of documentation (for an example of these categories, see Table 1). A score of 0 means that the student did not provide any indication they sent the mail; that is, the student did not record a sent date, verify individuals’ custody status, or submit an assignment for that week. A score of 1 indicates the student recorded a date sent and documented some evidence of work (e.g., the student verified and recorded the individual’s custody status) but did not upload an assignment within one week of the date sent. A score of 2 indicates that the student recorded a sent date and uploaded an assignment within a week of that date, but did not upload a photograph. A score of 3 indicates that the student recorded a date sent and uploaded an assignment with a photograph within a week of the date sent.
Examples of Outreach Records and Confidence Scores.
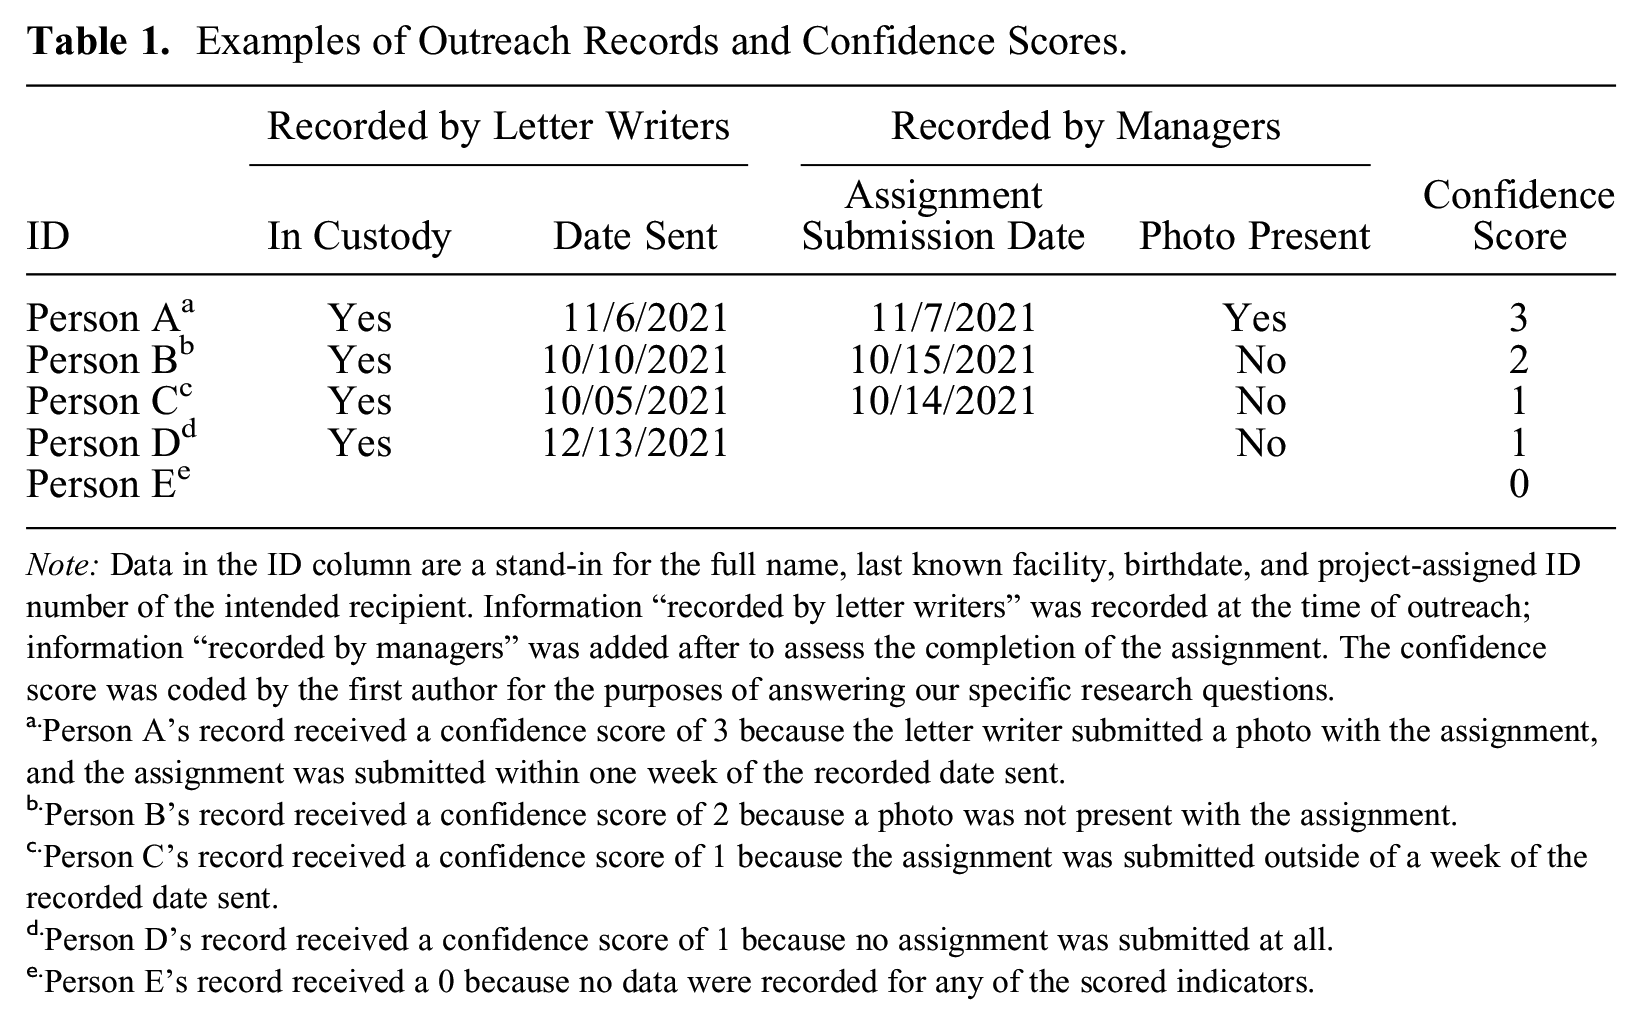
Note: Data in the ID column are a stand-in for the full name, last known facility, birthdate, and project-assigned ID number of the intended recipient. Information “recorded by letter writers” was recorded at the time of outreach; information “recorded by managers” was added after to assess the completion of the assignment. The confidence score was coded by the first author for the purposes of answering our specific research questions.
Person A’s record received a confidence score of 3 because the letter writer submitted a photo with the assignment, and the assignment was submitted within one week of the recorded date sent.
Person B’s record received a confidence score of 2 because a photo was not present with the assignment.
Person C’s record received a confidence score of 1 because the assignment was submitted outside of a week of the recorded date sent.
Person D’s record received a confidence score of 1 because no assignment was submitted at all.
Person E’s record received a 0 because no data were recorded for any of the scored indicators.
County Jail Characteristics
We compared our analytic sample of counties with all California counties. First, we compared three items specific to local jail systems: the unsentenced population, incarceration rate, and length of stay. The percentage of county jail systems’ populations that are unsentenced (i.e., awaiting adjudication of their case) comes from the BSCC’s Jail Population Trends Dashboard (the percentage of average daily population not sentenced for 2021). County incarceration rates also come from BSCC and represent the total average daily population for a given county in 2021 divided by that county’s population (sourced from the ACS5). 9
Counties’ average length of stay, defined as the number of days individuals booked into county jails remain in those jails, was not as readily available; however, this is an important consideration for conducting outreach with people in jail, who have varying lengths of incarceration. A small number of counties, such as Santa Clara (SCCGOV 2023), report average length of stay, but how their measures are operationalized is unclear (and therefore comparability across counties is unknown). To resolve this problem, we used JDI data. We calculated the average length of stay for 22 counties (12 of which were also in the analytic sample) using Kaplan-Meier (KM) survival curves and KM estimates for each jail system. We included California counties present in the JDI data that met the start- and end-time assumptions of survival analysis and had more than 150 days of data over the observation period. 10 Using the full roster of each county at t0 as the cohort under observation, we used the KM survival function to estimate average length of stay for each county, defined by the time to event (no longer on the roster). 11
Additionally, we examined county-level variables to describe similarities and differences across counties; these variables include population, percentage Republican, percentage white (non-Hispanic), percentage Black (non-Hispanic), percentage other race (non-Hispanic), percentage Hispanic, percentage working age (between 16 and 65 years), percentage in poverty, percentage with a college degree or higher, and percentage unemployed. All measures came from the ACS5, except the measure of partisanship, which came from Politico’s (2021) breakdown of county-level voting trends in the 2000 presidential election.
To examine similarities and differences between our analytic sample (n = 20) and all California counties, we performed independent t tests at the 95 percent confidence level. California comprises 58 counties; however, 2 counties do not have their own jail systems, resulting in a slightly smaller county sample for our comparisons (n = 56). For the reasons described earlier, the sample used to calculate length of stay across California includes 22 counties.
Findings
Comparing the Analytic Sample with All California Counties
First, we consider whether our analytic sample of counties is systematically different, on average, than all counties in California. Table 2 presents estimates of county-level variables for both samples. The analytic sample includes all counties (n = 20, or 44.4 percent of the total state population) we reached out to during fall 2021. Across nearly all variables, results suggest the counties included in the analytic sample are similar to all counties in the state, on average. The average population is 678,380 for all counties and 873,470 for the analytic sample of counties, and this difference is not statistically significant (p = .482). Samples have similar rates of county-level incarceration per 100,000 people (p = .986): 191.3 for all counties and 171.4 for the analytic sample. County jail populations comprise a nearly identical percentage of unsentenced individuals (p = .979): 78.8 percent and 78.5 percent. The samples are also similar across demographic variables, including percentages white (non-Hispanic), Black (non-Hispanic), other race (non-Hispanic), Hispanic, working age, in poverty, with a college degree or higher, and unemployed. The only observed statistically significant difference between our analytic sample of counties and all counties is in the percentage Republican. Statewide, the percentage of counties that voted Republican in the 2020 presidential election (39.7 percent) was higher than in the analytic sample (15.0 percent) (p = .044).
Descriptive Statistics of All Counties and Analytic Sample of Counties.
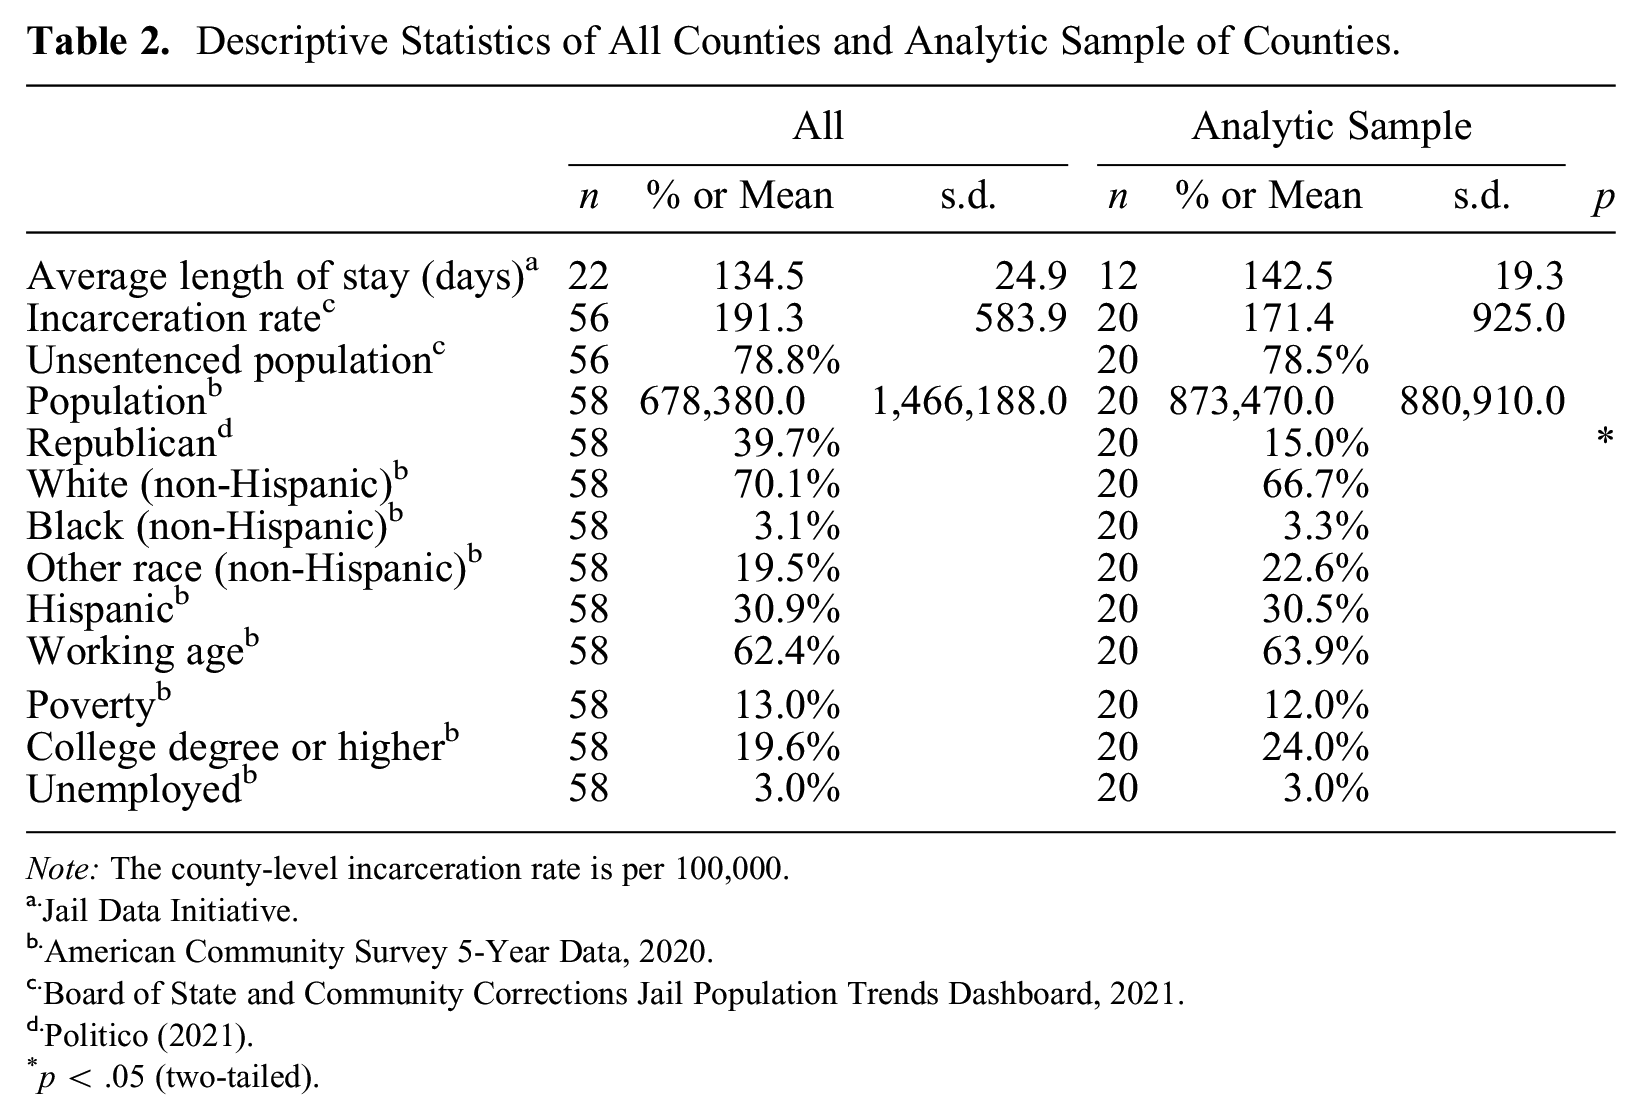
Note: The county-level incarceration rate is per 100,000.
Jail Data Initiative.
American Community Survey 5-Year Data, 2020.
Board of State and Community Corrections Jail Population Trends Dashboard, 2021.
p < .05 (two-tailed).
Length of stay has important implications in terms of RTS and response. For example, if length of stay was, on average, seven days, and it takes more than seven days from the scrape date to address, mail, and deliver letters, we would expect high RTS and low response. Similarly, we would expect longer lengths of stay to result in more letters being successfully received, and in turn lower RTS and higher response. T tests comparing differences in length of stay show no statistically significant differences, on average, between the length of stay in all counties in which we obtained length of stay data and the analytic sample (M = 134.5 vs. 142.5 days, p = .309). Additionally, a rank-sum test of medians confirms that length of stay for each sample is statistically nonsignificant (M = 136.0 vs. 140.9 days, p = .123).
RTS Rates
Figure 2 presents estimated ranges for RTS rates, understood as the number of letters rejected and returned through the mail (by a carceral facility or post office) for each letter sent, for each county in the analytic sample. The horizontal bands represent estimates based on our most and least strict inclusion criteria for estimating the number of letters sent. RTS rates are measured by the number of RTS letters received divided by the number of letters sent to each jurisdiction. In most cases, looser inclusion criteria increased the denominator and is reflected on the left pole of each band. Conversely, stricter inclusion criteria decreased the denominator and is reflected on the right pole of each band. Represented by the leftmost pair of vertical dotted lines, the lower bound for the estimated RTS rate is 0.112 and the upper bound is 0.262, indicating that a nontrivial number of letters (1 in 10, if we believe that all intended letters were sent, or 1 in 4, if we use our most conservative measures) were returned to us.
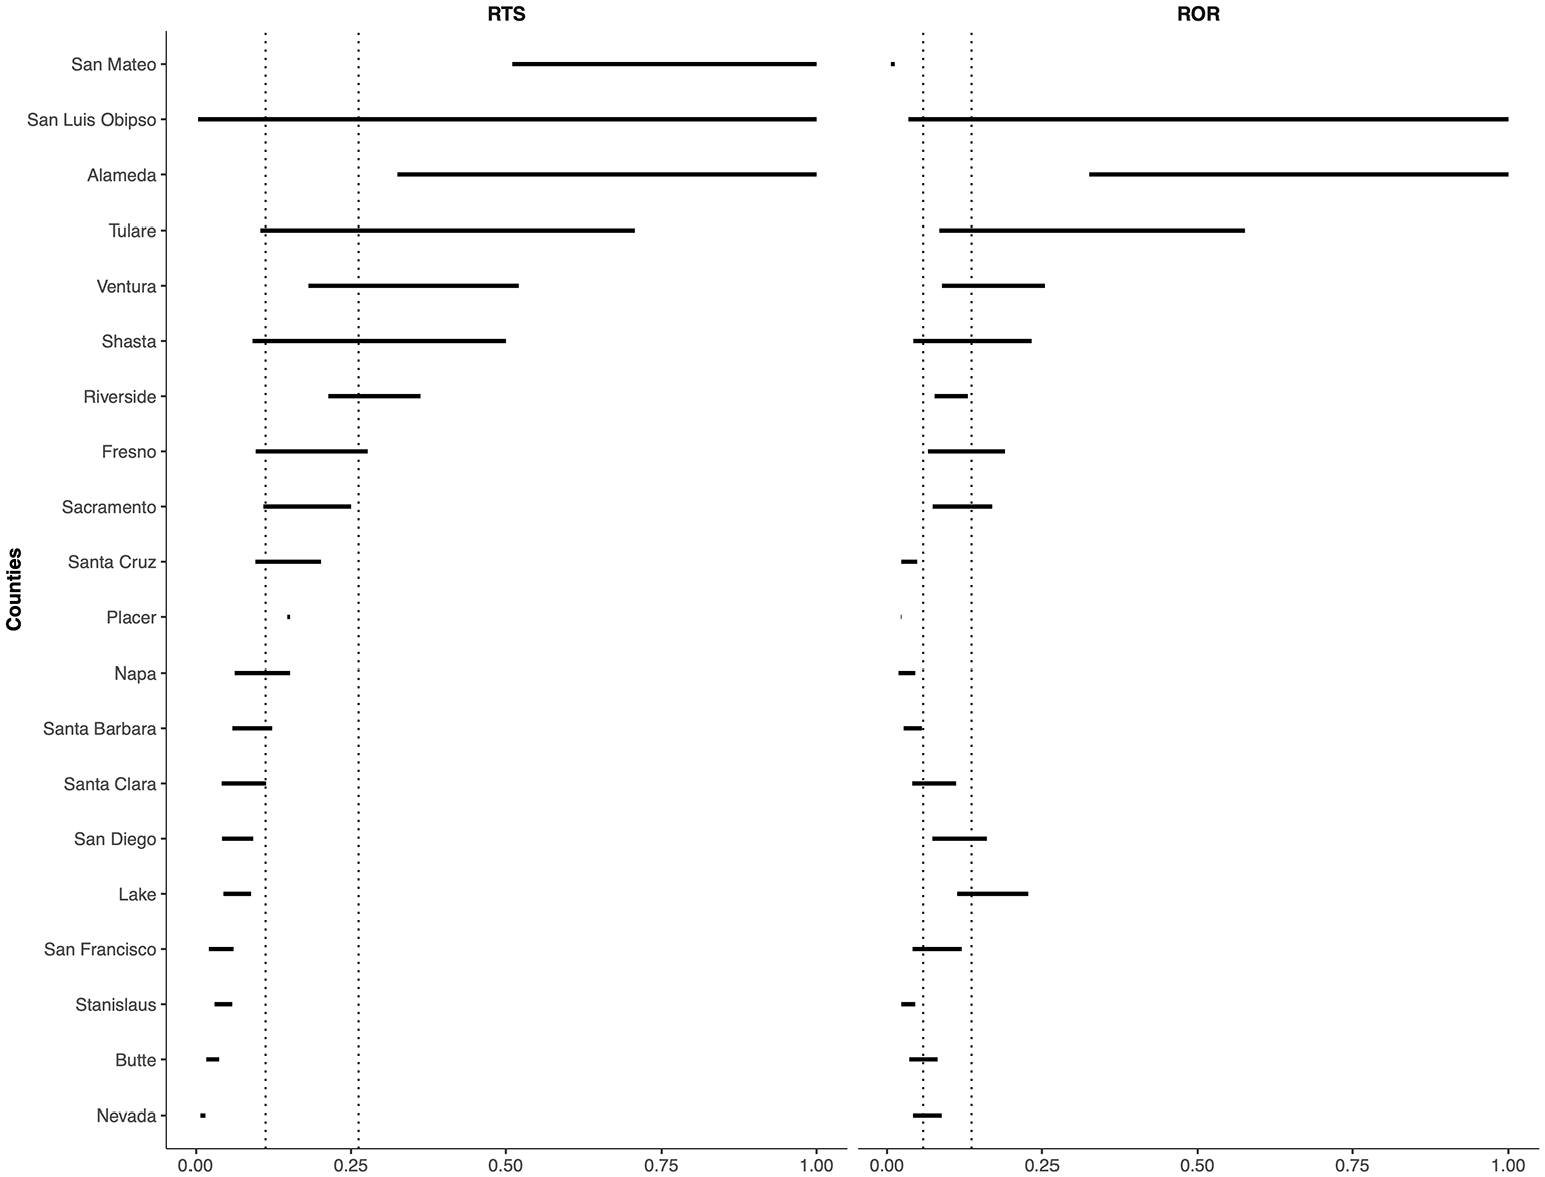
Rate of Return to Sender (RTS) and Rate of Response (ROR).
Focusing only on this average across counties obscures county-level variation. One quarter of the lower bound estimates are less than 0.021, and the top quarter ranges from 0.128 to 0.510. For the upper bound estimates, the bottom quarter contains values between 0.015 and 0.060, with the top quarter ranging from 0.510 to 1. On average, the bands show a 0.225 (s.d. = 0.274) difference between the upper and lower bound estimates, although it is less than 0.098 for more than half the counties, suggesting the level of confidence in data quality is relatively consistent between counties, with only a minority affected by lower outreach data quality. Overall, Figure 2 shows considerable variability between counties in terms of the number of letters that were rejected and returned. 12
Reasons for RTS
Table 3 presents the percentage of letters returned by RTS reason and county. For the counties in the analytic sample, we received 1,674 RTS letters: 57.2 percent were related to custody (custody error) and 24.5 percent to the outreach process (sender error), and 18.3 percent were returned for unknown reasons (other reason). Letters were most commonly returned because of custody of the intended recipient, primarily because of no longer in custody at the time of receipt. For 30 percent of counties in the sample, custody reasons constituted 100 percent of RTS letters, and for the lower third of counties, between 18.9 percent and 40 percent. Comparatively lower rates of custody error appear to be related to sender error and the small numbers of letters sent to some counties. Three of the six counties for which the percentage of other error or sender error was greater than that of custody error also have rates of sender error that are nearly twice the overall average (24.5 percent); two of the remaining three have fewer than five RTS letters each. As an exception, in San Diego (n = 85), only 40 percent of returned letters were due to custody error, 5.9 percent were due to sender error, and 54.1 percent were related to other error. Of all custody error RTS in the sample, fewer than 1 percent (0.4 percent) were coded as temp out, suggesting that although some individuals may not receive mail under certain custody arrangements, this number is relatively small.
Return to Sender (RTS) letters, by Reason Returned.
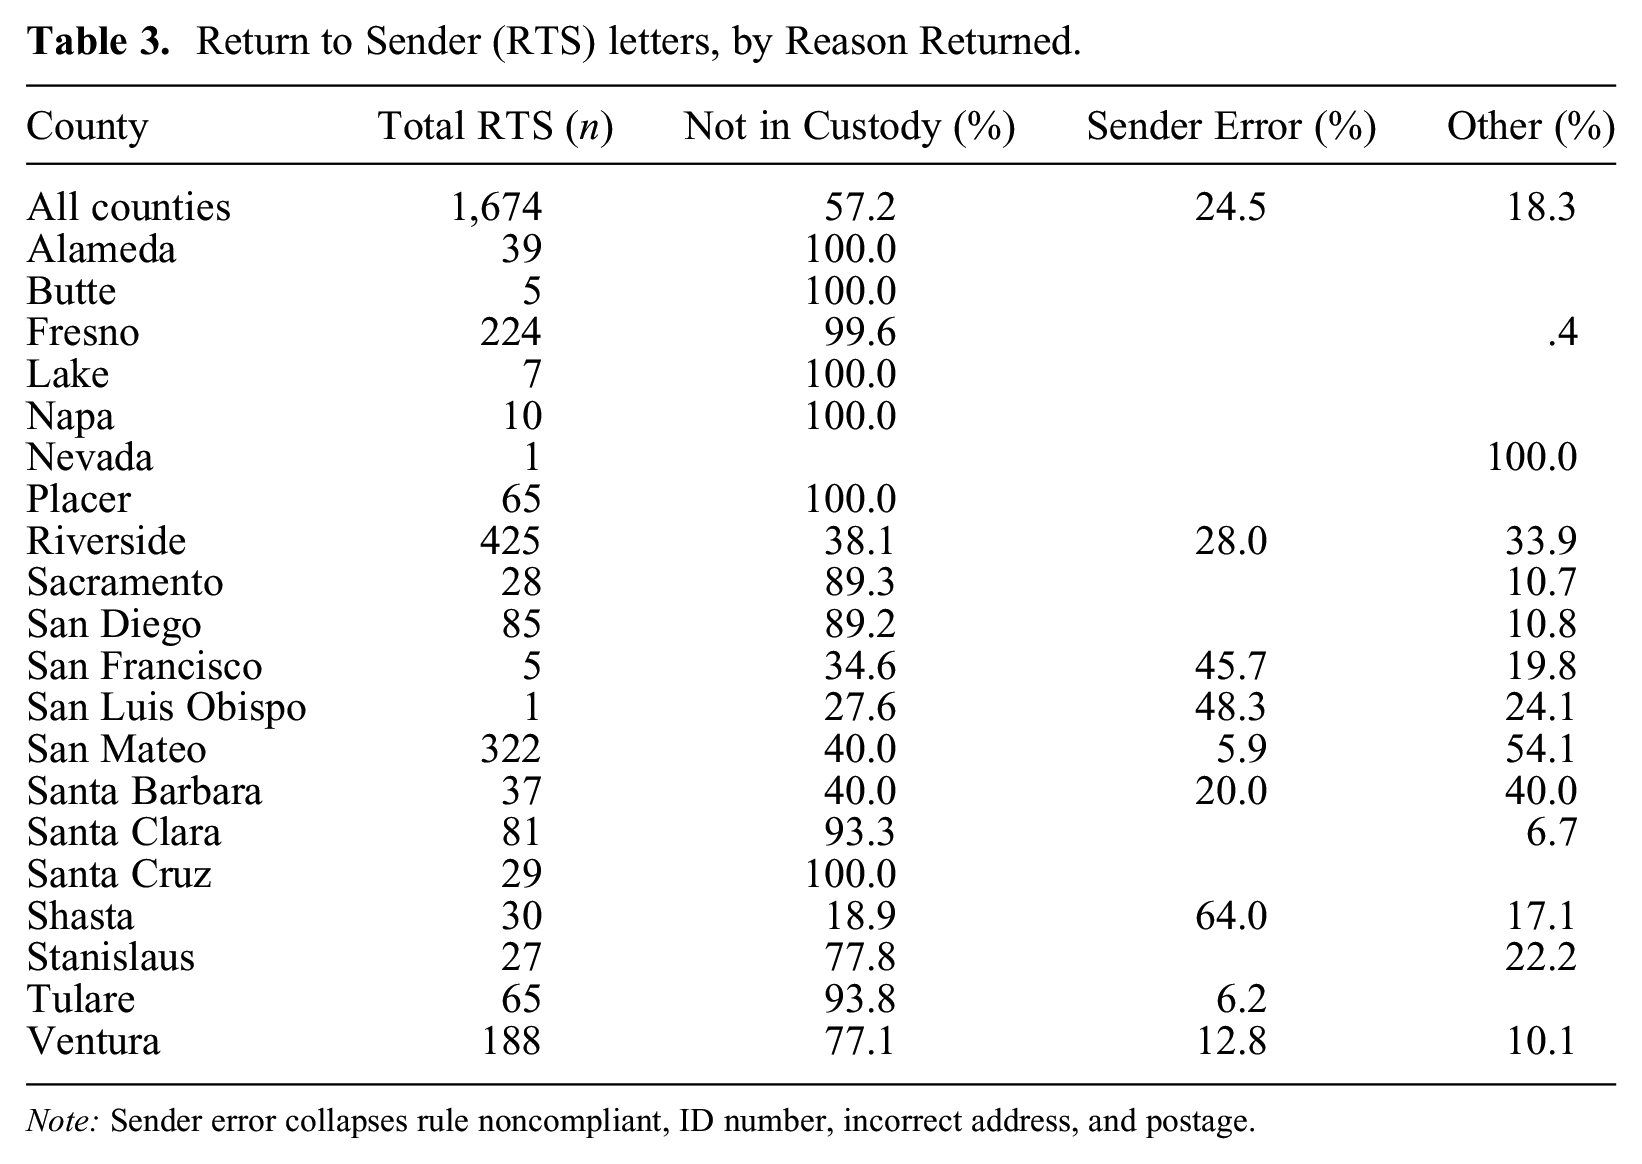
Note: Sender error collapses rule noncompliant, ID number, incorrect address, and postage.
Further breaking down the letters categorized under sender error (n = 410), 58.5 percent were the result of incorrect addresses, 25.2 percent were due to rule violations, 15.1 percent were related to incorrect names or ID numbers, and 1.2 percent resulted from insufficient postage. Given that rules violations comprise only a quarter of this category, counties with disproportionally high sender error should not be interpreted as necessarily having more rules or as more strictly enforcing their rules. Often, only one or two people were responsible for reaching out to a given county, and simple mistakes (e.g., an incorrect address) can be repeated dozens of times and, indeed, become easier to make when counties have multiple facilities and unintuitive address patterns. For example, San Mateo’s “sender error rate” is about 40 percent higher than average; San Mateo also has three county jails, two of which use mailing addresses that are the same as their street address, and one that uses a mailing address in Florida, where mail is scanned and digitally transmitted to detainees (Wang 2022). The descriptive statistics in Table 3 strongly suggest that, controlling for sender error, the most common RTS reason should be, by far, custody error. These numbers emphasize that the challenge is not necessarily in writing web scrapers to acquire up-to-date county jail roster data but in mobilizing these data while they remain accurate and in developing strict standardized rules and procedures related to outreach for many letter writers.
Response Rates
The right-hand side of Figure 2 presents estimated ranges for ROR: the number of responses (calls and letters) received for each letter sent. The rightmost pair of vertical dotted lines represent the lower (M = 0.058) and upper (M = 0.136) bounds of the estimated average ROR, depending on the most and least strict inclusion criteria for estimating the numbers of letters sent, for all counties in the sample. A quarter of the lower bound estimates are less than 0.025, and the top quarter are between 0.075 and 0.325. A quarter of the upper bound estimates are less than 0.052, and the top quarter are between 0.231 and 1. On average, the RORs show a 0.166 (s.d. = 0.249) difference between the upper and lower bound estimates, although it is less than 0.075 for more than half of the counties. 13 Overall, Figure 2’s ROR plot illustrates that, on average, for every 100 letters we sent to a county jail, we received between 6.3 and 22.9 responses from that county. Note that this rate depends on people’s willingness to respond to outreach letters. In the case of PrisonPandemic, which solicited people’s experiences of being incarcerated during the COVID-19 pandemic, people may have been especially willing to share their stories.
Discussion
In this article, we discussed PrisonPandemic to illustrate the advantages and challenges of using a method of web scraping and postal mailing to contact individuals incarcerated in high-turnover county jails. Our primary finding is that web scraping and mailing can produce jail detainee response rates comparable with those reported with more traditional outreach methods and among nonincarcerated groups (Kennedy and Hartig 2019; Stedman et al. 2019). This response rate is particularly notable given that we did not provide compensation for responding to our requests. Our data are limited to the time period in which we reached out to county jails, but we have used the same method to outreach to people incarcerated in state and federal prisons and immigrant detention facilities. Scraping and mailing enables researchers, advocacy groups (e.g., Prison Accountability Project 2023), and archival projects to engage incarcerated persons systematically across a variety of domains, using a comprehensive sampling frame.
We found considerable differences in RTS and ROR across county jail systems, revealing local-level variation in regulations and interpretations of jail policies. Even with this variation, RTS was consistently related to custody and release. The relatively high rate of return due to people no longer being in custody underscores the importance of designing a project infrastructure that can quickly translate jail roster data into properly addressed mail. Because this method is functionally the same across domains, the procedures used to outreach to jails may produce higher rates of return in domains with lower rates of population turnover (e.g., prisons). Our analysis of RTS reasons also suggests facility mail practices (e.g., limiting mail under certain custody conditions) may produce some response bias, and some subpopulations (e.g., administrative segregation units, hospitalizations) in certain facilities may be unreachable. These restrictions are not always made explicit in the documents published by jail systems, but those interested in using this method would benefit from reviewing such documents, as regulations can vary considerably.
Stakeholders benefit from carefully considering the limitations of mail-based outreach in relation to their unique projects. Compared with traditional interviewing methods, mail-based data collection may need to be more self-explanatory, lacks the ability for interviewers to control flow, cannot include audiovisual data, and may result in varied response length and depth (Megargee 1995). These considerations might present obstacles to those with a highly focused research agenda; however, many if not all of these limitations are mitigated by using mail outreach as an initial stage of contact for later over-the-phone contact (as was the case with PrisonPandemic) or in-person interviews.
Additionally, the applicability of this method varies by jurisdiction, depending on the contours of publicly available data and local law. Some states, such as West Virginia, have fully centralized their database of currently incarcerated people, not only across counties but at the state level, making it relatively easy to generate complete rosters. However, in other states, such as California, jail data are fractured across counties and require web-scraping code unique to each county’s Web site, which can become time consuming. For many counties in California, it was relatively straightforward to write web-scraping applications for Web sites containing these data; for others it was very challenging, requiring the use of machine learning, compiling and matching data from multiple sources, and third-party application programming interfaces. Successfully obtaining a roster, however, does not guarantee the ability to send mail to individuals in jail, as some counties’ publicly available data do not include all the data required by their jail’s mailroom policy. Local policies, such as the recent trend of some facilities’ banning physical mail and contracting with mail-scanning services (Wang 2022)—companies that receive physical mail on behalf of carceral facilities, scan it, and send digital copies to the intended recipients—might also have unknown consequences for mail-based outreach methods.
Finally, depending on the scale of a given project, the resources involved in scraping and mailing may be prohibitive. The cost of stamps may be insurmountable for some; however, before making that determination, stakeholders should investigate discounted rates for bulk mail and nonprofit organizations. Mailing at scale also requires a labor force (laborers and labor hours) to physically address, stamp, and mail letters to provide an appropriate level of coverage for a given population size. At our peak, we had 35 letter writers sending 80 letters a week (for a total of 2,800 letters a week); this would have taken five weeks to send letters to everyone (approximately 14,000 people) in jail in Los Angeles County. Dividing outreach activities to a single jail system across multiple weeks has its own complications due to the rapid cycling of jail populations; shorter term incarcerations and high turnover mean the accuracy of roster data from a given day quickly decays over time.
We described this outreach model of web scraping and mailing as novel, but since beginning this project, we learned of at least one other project that has used versions of this method (focusing on bailout; R. Pharr, personal communication, November 10, 2021), with mixed results. Still, this article represents the first systematic analysis of scraping and mailing. Our findings show that web scraping and mailing overcomes many of the challenges of data access and the conditions of access associated with carceral domains (i.e., state and federal prisons, reentry facilities, and immigrant detention facilities) and, in particular, county jail systems. Our findings also identify important considerations for those interested in using scraping and mailing. In addition to factors known to affect response rate, such as topic salience and incentive (Marcus et al. 2007), our findings suggest the key to desirable response rates is overcoming population churn. Particularly for high-churn domains such as jails, it is essential to design a project infrastructure that can quickly translate roster data into properly addressed mail. This design should include a strict set of practices attentive to the available labor force, celerity, accuracy, and conformity to the rules relevant to the domain. Future interventions may yield relatively higher response rates by making these processes more efficient, reducing the time between data scraping and letter sending, and lessening projects’ reliance on human labor, for example, by using computational and robot-assisted handwriting pipelines (see, e.g., Wighton 2023). We also advise others to verify the quality of the source data and the scraped data. Samples drawn from data sources that do not provide complete rosters may contain bias. Similarly, errors in web-scraping code that result in incomplete scrapes or data formatting errors may increase RTS rates. Other factors (e.g., use of handwritten vs. printed letters) may also influence rejection and response rates and are possible future avenues for experimentation. Future work should also rigorously assess the reliability and validity of scraping and mailing, particularly in domains that have established external markers and gold standards.
Our focus was on web scraping and mailing in carceral domains; however, the practice of using scraping to create a sampling frame and to gather contact information is potentially useful to researchers conducting outreach in other settings. For example, if studying public policy, one might use web scraping to compile a list of stakeholders’ contact information from a state legislation portal. If studying nursing, one might scrape the contact information from LinkedIn of registered nurses. Outreach need not be limited to mail: one can scrape and e-mail or scrape and call. For PrisonPandemic, mail was particularly useful because it is the only form of communication permitted in many facilities, and because all information required to send mail to incarcerated people is publicly available.
Returning to the context of jail incarceration, by combining more technologically advanced methods of harvesting publicly available data with analog modes of communication, we enable researchers and other stakeholders to adapt to the unique landscape of local incarceration. More importantly, our method responds to the entangled issues of jail disreputability and opacity that have plagued society for centuries. In 1771, famed prison reformer Howard (1777) described the necessity of embedding in the “gaols” (jails) for which he was responsible:
The difficulty I found in searching out evidence of fraud and cruelty in various articles, together with other sources of distress, obliged me to repeat my visits . . . after all, I suspect that many frauds have been concealed from me; and that sometimes the interest of my informants prevailed over their veracity. (p. 3)
Indeed, many researchers, advocates, and archivists would argue that little has changed in this regard in the intervening 250 years. Scraping and mailing allows us to render the otherwise invisible visible, the “hard-to-reach” reachable, whether by eliciting stories for an archival project such as PrisonPandemic or by including incarcerated people in research more broadly using an inclusive and comprehensive sampling frame. The very term hard to reach uncritically suggests a voluntary silence, a de facto refusal to participate in knowledge creation practices. In approaching the challenge of outreach to incarcerated people as an object of inquiry in and of itself, this study underscores that the very reasons for researchers to inquire into carceral facilities is the very function that renders those inside “hard to reach”: “inaccessibility is intertwined with prison administrators’ lack of accountability to the public, courts, and legislators” (Reiter 2014:421). Counter to long-standing attitudes within incarceration studies about the necessity of collaborative institutional partnerships with correctional agencies, these facts support a more critical perspective: that such arrangements jeopardize researcher objectivity and can produce unintended policy consequences (Reiter 2014). Therein lies the necessity and the counterinsurgent possibilities of new methods for conducting carceral research.
Footnotes
Appendix A: Outreach Letter Template 14
Hello [INSERT NAME HERE],
I hope this message finds you in good health! We all come across difficult times in our lives and we all have different ways of dealing with them. I just wanted to tell you, I know this hasn’t been easy, but I also know you’ve got what it takes to get through it. I may not know you personally, but I would like you to know people are thinking about you and hoping you and everyone else gets through this challenge. I found your name from a public list on [county or agency] website, but I’m not associated with [county or agency].
I am a college student and part of a team at the University of California, Irvine collecting stories about what has been happening inside facilities during the COVID-19 pandemic. One of our professors is Kristin Turney, who is on the return address. We would love to hear directly from you about your experiences. No story is too small. Some things you could share are: What has it been like to be inside during this time (either at the beginning of the pandemic, the middle, or now)? How have you felt about your safety inside? What has it been like to have reduced visitation from family and loved ones? How have you been coping with this crisis? How have the vaccinations been going at your facility? We are collecting these stories to preserve them in an archive for historical purposes with the goal that they could help lead to positive reforms.
We have two ways you and others can get in touch with us. Call our hotline at [redacted for publication], which is running Monday to Friday from 5pm to 9pm. We accept collect calls. Or mail us your letters, artwork, or other contributions to: PrisonPandemic, PO Box 4430 [redacted for publication]. We will post these stories, anonymously, on our webiste: https://prisonpandemic.uci.edu/. Unfortunately, we cannot offer legal aid. If you don't have a story yourself to share, maybe you know someone who would be interested. Sending you good thoughts-and hoping you beleive in yourself just as much as I believe in you.
Best wishes,
[INSERT LETTER WRITER’S NAME HERE]
Appendix B: Letter Writing Instructions
Important: Take photos of the letters before placing them in the envelope. Take photos of the stamped and addressed envelopes. You will need to upload these photos to Canvas for extra credit. 15
Some additional instructions and tips:
Acknowledgements
We thank the editors and reviewers of Sociological Methodology as well as our colleagues who have contributed to the development of this article, including Keramet Reiter, Gabe Rosales, Melissa Wang, Maricruz Adriana Rivas, Katherine Vine, and the entire PrisonPandemic team. We would also like to thank all our incarcerated contributors, whose willingness to bravely share their stories made PrisonPandemic possible.
Funding
The authors disclosed receipt of the following financial support for the research, authorship, and/or publication of this article: We acknowledge the instrumental support from our funders, including the Council on Library and Information Resources, the National Endowment for the Humanities, the American Council of Learned Societies, and Arnold Ventures.