
Abstract
In this article, the author demonstrates how one can use large-scale and publicly available online review data to study the rise in anxiety in the United States. Using the anxiety keyword list from the dictionary compiled by Linguistic Inquiry and Word Count, the author analyzed the text of approximately 7 million online reviews submitted by Yelp reviewers across 13 U.S. states from 2006 to 2021. The overall pattern confirms existing discourse that anxiety has been constantly rising in Western societies since 2000. Beyond documenting the overall pattern, online review data enable the disaggregation of this pattern by geographies, price levels, and individuals, thereby providing a more comprehensive and detailed picture than previously documented in existing literature. Additional analysis shows that anxiety is increasing faster than other emotions, such as anger and sadness.
Anxiety is on the rise in modern societies. The WHO (2022) estimated that anxiety affects the lives of 280 million people across the globe. The age of onset is decreasing, and the prevalence is steadily increasing, especially in Western cultures (Bandelow and Michaelis 2022). This trend not only threatens individual well-being but also affects economic productivity, making the rise in anxiety a crucial public policy issue.
Prior research has typically used smaller scale clinical data or large-scale survey data (e.g., the National Comorbidity Survey, the European Study of the Epidemiology of Mental Disorders, WHO 2022) to analyze the prevalence and trend of anxiety. In this short data visualization, I propose an alternative data source: online reviews on review Web sites. The rise of anxiety can be demonstrated on a large scale using these naturally occurring text data. The benefit of the approach proposed here is that the data are publicly available and spans more than 1 million people and 15 years, which makes data collection costless, a significant advantage over large-scale surveys. Moreover, online review data make it possible to track individuals over time, unlike large-scale cross-sectional surveys. The proposed approach does have some disadvantages, such as a lack of random representative sampling and a lack of data on demographic characteristics of reviewers.
To code the anxiety level in review texts, I rely on the Linguistic Inquiry and Word Count (LIWC) dictionary developed by Pennebaker and colleagues (see, e.g., Pennebaker, Booth, and Francis 2007; Tausczik and Pennebaker 2010). LIWC is a commonly used computational linguistic tool to examine word frequencies in written text. LIWC categorizes words into psychologically meaningful dimensions such as emotions, cognitive processes, and social focus. The dictionary has been widely applied across disciplines. For example, it has been used to study the linguistic styles of politicians (Slatcher et al. 2007), the linguistic styles of students and online reviewers (Kovács and Kleinbaum 2020), the cognitive complexity of CEOs (Graf-Vlachy, Bundy, and Hambrick 2020), and to detect fake news (Zhou and Zafarani 2020). 1
Background
There are many factors contributing to the rise of anxiety in modern life. Precarious economic conditions, such as stagnating wages, rising costs of living, student debt, and insecure work arrangements such as part-time and contract jobs, likely raise anxiety levels by increasing financial strain and uncertainty about the future (Leach et al. 2008). Economic inequality itself raises anxiety (Pickett and Wilkinson 2015). Mass urbanization also contributes to increased anxiety levels through two pathways. First, more people live in crowded cities, far from their families and other traditional support networks, which increases isolation. Second, urban environments and mass housing generally provide less access to natural light, disrupting circadian rhythms (Peen et al. 2010). Excessive social media also contributes to increased anxiety through negative social comparisons, cyberbullying, sleep disruptions, and other mechanisms (Twenge 2017; Vannucci and McCauley Ohannessian 2019). Last, research indicates that increased academic and employment pressures, the climate crisis (Obradovich et al. 2018), and the coronavirus disease 2019 pandemic (Kovács et al. 2021; Torales et al. 2020) also contribute to increasing levels of anxiety.
Anxiety can manifest adverse effects across multiple domains of life. Physiologically, anxiety activates the sympathetic nervous system, putting the body in a prolonged state of stress linked to increased risk for cardiovascular disease, gastrointestinal issues, headaches, insomnia, sexual dysfunction, and a weakened immune system (Bandelow and Michaelis 2022). Anxiety can trigger other mental health conditions, such as depression, self-medication via drug or alcohol abuse, eating disorders, and suicidal behaviors. These collectively account for the highest global burden of disability across all disease categories (Baxter et al. 2013). Socially, individuals with anxiety disorders often withdraw from relationships and shy away from school, work, or new opportunities, creating a vicious cycle of isolation and avoidance that restricts their potential. The WHO (2022) estimated that the global economy loses $1 trillion per year in productivity because of depression and anxiety disorders. Given these effects, understanding the prevalence and spread of anxiety is a crucial research question.
Data and Setting
In this study, I investigate the prevalence and trends in anxiety by analyzing online review data made publicly available from Yelp through the 2022 version of the Yelp Open Dataset, which can be accessed free of charge at https://www.yelp.com/dataset. The dataset contains 6,990,280 reviews written by 1,987,897 users. The dataset provides reviews concerning businesses located in the following states: Pennsylvania (1,598,960 reviews); Florida (1,161,545 reviews); Louisiana (761,673 reviews); Tennessee (614,388 reviews); Missouri (502,385 reviews); Indiana (489,752 reviews); Arizona (431,708 reviews); Nevada (430,678 reviews); California (348,856 reviews); New Jersey (260,897 reviews); Idaho (157,572 reviews); Alberta, Canada (109,436 reviews); Delaware (70,302 reviews); and Illinois (51,832 reviews). The Yelp data encompass reviews of all kinds of establishments, including museums, arcades, dentists, and grocery stores, but the vast majority of the reviews (>80 percent) concern restaurants. Each review contains the date of the review, a star rating, the identifier of the establishment being reviewed, the identifier of the reviewer, and review text. Yelp data and review text have been analyzed in the scientific literature. For example, Kovács, Carroll, and Lehman (2014) analyzed the text of Yelp reviews of restaurants to gauge audience authenticity perceptions.
The dataset’s coverage starts in November 2005 and ends in January 2022. However, as only a small amount of review data are available for 2005 and 2022, the plots I create focus on the period from 2006 to 2021 inclusive. Furthermore, because the 2007 version of the LIWC dictionary 2 that I use to analyze the text of reviews is in English, I analyze only reviews written in English. Finally, because analyzing the anxiety expressed in a review requires some text, I exclude reviews with fewer than five words. The resulting sample contains 6,950,673 reviews written by 1,975,678 users.
To quantify the anxiety expressed in the reviews, I use the 91 anxiety-related words and word stems in LIWC, such as afraid and nervous (see Appendix A for the full word list). I wrote a script that counts the instances of anxiety-related words and word stems in the text of each review (see Appendix B for the Python code). For each review, I divide the count of anxiety-related words by the review’s total word count to make reviews comparable. (In additional results in Appendix C, I present analyses with alternative specifications.)
Findings
The values representing the proportion of anxiety-related language are aggregated across years and geographical areas. Figure 1 illustrates the main finding, showing the average proportion of anxiety-related words in the review text on the y-axis. As Figure 1 clearly illustrates, an increasing trend is evident with approximately a 20 percent increase in the proportion of anxiety-related words in reviews from 2006 to 2021.
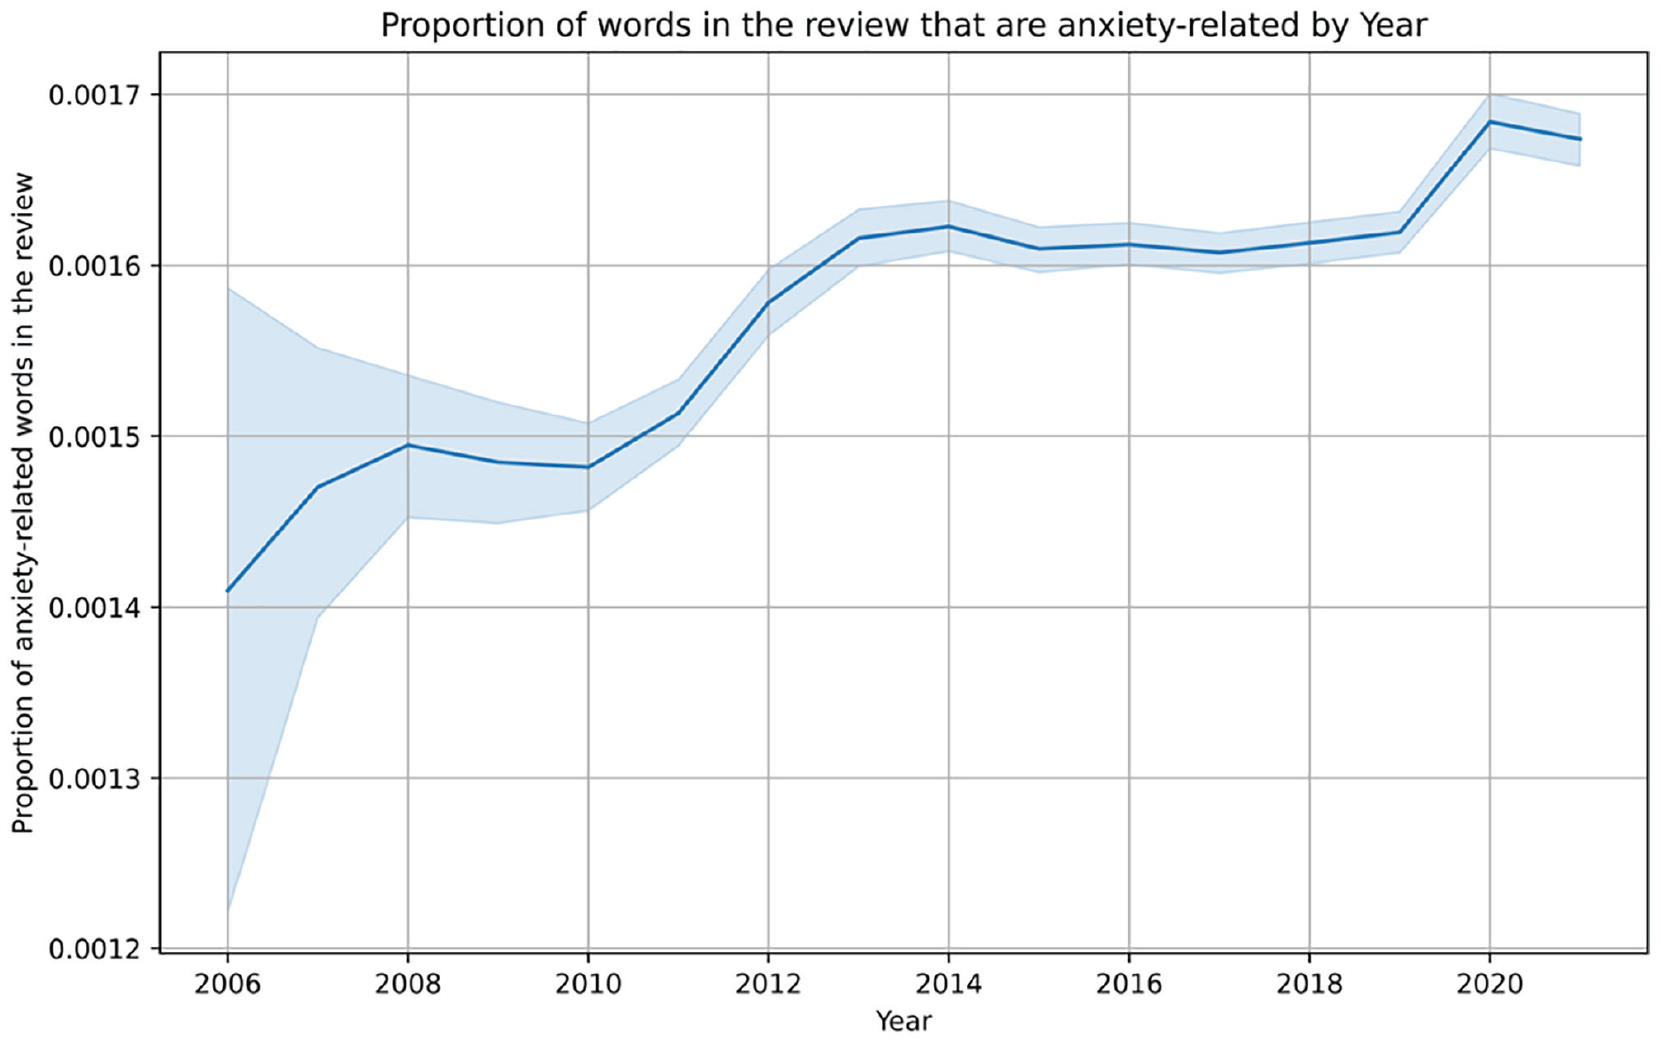
The average proportion of words in the online reviews that are anxiety related, per year. The shaded areas indicate 95 percent confidence intervals around the mean. The data are based on online reviews provided in the 2022 release of the Yelp Open Dataset. The words in the reviews were coded as anxiety related using the 2007 version of the Linguistic Inquiry and Word Count dictionary.
Robustness Checks and Additional Analyses
Geographical Heterogeneity
The data can also be used to break down reviews by geography. Figure A1 in Appendix A depicts the evaluation of anxiety in the five states with the highest review counts 3 in the dataset: Pennsylvania, Florida, Louisiana, Missouri, and Tennessee. The figure shows that anxiety has been increasing in all five states, except for Louisiana, where there has been a minimal increase since 2013. Future research could investigate why the trend in Louisiana is somewhat different from the trend in other states.
Price-Level Heterogeneity
Figure A2 in Appendix A illustrates the evaluation of anxiety, segmented by price level. In these analyses I use the price level categorization provided by Yelp for restaurants ($ = less than $10, $$ = $11–$30, $$$ = $31–$60, and $$$$ = more than $61). The figure demonstrates that anxiety levels have increased among patrons of restaurants at all price levels, indicating that the rise in anxiety affects people of various income levels (with the assumption that restaurant prices levels proxy the income of their diners).
New versus Veteran Reviewers
I also investigate whether the rise in anxiety is due to within-reviewer changes or is a composition effect attributable to new reviewers’ entering the online review arena. To do this, I categorize each review on the basis of whether it was contributed to the first year the reviewer posted a review on Yelp or in subsequent years. I then replicate the plot from Figure 1, disaggregating the data to distinguish between new reviewers and those who have been posting on Yelp for more than one year. Figure A3 in Appendix A shows the results. The figure indicates that although there is some within-reviewer increase in anxiety level, the within effect is quite muted. However, the cohort effect is much stronger, with new cohorts exhibiting higher initial anxiety levels. These patterns are consistent with, although not the direct proof of, the findings that the rise in anxiety level is especially prevalent among adolescent and young people (Twenge 2017).
Alternative Modeling Specifications
To ensure that potential variations in review length over time do not invalidate my main findings, I conducted additional analyses. In these, I estimated the change in anxiety proportion using a regression framework and controlled for review lengths. Additionally, I estimated a regression model in which the dependent variable is the count of anxiety-related keywords and included a control for review lengths. Figures A4 and A5 in Appendix A display the marginal effect results for these tests, demonstrating that the primary pattern I observed—the increase in anxiety—is robust to these alternative specifications.
Comparison of the Increase in Anxiety with the Increases in Sadness and Anger
The LIWC dictionary also provides keyword lists for two additional emotions: sadness and anger. In further analyses, I investigated whether the patterns in sadness and anger paralleled those observed in anxiety. This exploration is crucial as similar patterns in sadness and anger could alter the interpretation of the anxiety-related findings. For instance, the rise in mentions of anxiety might not be solely about increased anxiety; it could reflect a broader willingness to discuss emotions in online reviews. Therefore, using the LIWC dictionary, I coded the proportion of sadness-related and anger-related text in the reviews and compared their trends with the increase in anxiety-related proportions. Figure A6 in Appendix A shows the results. This figure shows that although there is a slight increase in words related to anger and sadness, the rise in anxiety-related words is much more pronounced. These results suggest that there is something special about anxiety, and the increase in anxiety is more than just an increase in emotionality in online reviews.
Discussion and Avenues for Future Research
In this short article, I have illustrated that online review data could be used to track changes in anxiety levels across space and time. This research augments existing findings in this field by providing an alternative method of tracking changes in anxiety levels. Although existing approaches such as interviews or randomized surveys are costly to gather on a large scale and over time, the free availability of review data across millions of reviewers, across wide geographical areas and time periods, provides a meaningful alternative to large-scale surveys. Of course, the proposed approach does have some disadvantages and limitations, such as a lack of random representative sampling and lack of data on demographic characteristics of reviewers. Furthermore, it is possible that people who are more likely to experience anxiety are also more likely to write online reviews. Future research could investigate these limitations and extend the current approach to other review Web sites, languages, and questions of interest.
Footnotes
Appendix A
Following are the anxiety-related words and word stems from the 2007 LIWC dictionary. An asterisk indicates that any ending to the word stem would qualify as an anxiety-related word; for example, alarm* includes alarming or alarmed.
Appendix B
Following is the full Python 3 code to reproduce Figure 1 in the main text.
1st, get data from https://www.yelp.com/dataset
2nd, run extract_anxiety.py, this reformats the raw data and create the analysis files
3rd, run plot_yearly_trend_ci.py, this analyzes the data and outputs the figures in PDF format
Appendix C
This appendix contains additional results and robustness checks of the main pattern
Acknowledgements
I am grateful for feedback from Airín Martinez. This article was written using feedback from ChatGPT-4.