
Abstract
U.S. voters’ affect toward such minority groups as blacks, Muslims, and transgender people has become warmer in recent years. Warming affect toward minority groups is a surprise for the influential theory of affective polarization. In arguing that voters’ partisan allegiances fuel dislike of groups associated with the opposing political party, this theory predicts that it is primarily Democratic identifiers whose affect has become warmer, as affect is assumed to reflect partisanship and little more. Yet this is not what the authors find, analyzing high-quality data from the 2012–2020 American National Election Studies. Not only have Republicans (like Democrats) become warmer toward minority groups, but this influenced voter choice and contributed heavily to the outcome of the 2020 presidential election. Voters’ affect toward social groups may matter independently of the powerful force of partisanship. The authors discuss study limitations, alongside implications for affective polarization theory, research on Trumpism, and classical sociological scholarship on liberalization.
Are negative emotions toward minority groups on the rise in the United States? The 2016 election of Donald Trump, alongside a decadelong rise in hate crimes (Koski and Bantley 2020; Levin and Reitzel 2018), are consistent with this state of affairs. Indeed, many scholars and journalists viewed Trump’s disparaging communications during his presidential campaign and years in office as fostering negative affect toward immigrants, transgender people, African Americans, Mexican Americans, Muslims, and individuals with disabilities, among others (Cineas 2021; Graham et al. 2019; Utych 2018; see also Dunbar 2018). 1
However, whether negative affect toward minority groups actually rose during Trump’s years in office is unclear, as questions about recent patterns of change in affect have received virtually no systematic attention by scholars. 2 This is perhaps surprising, given the existence of high-quality Internet surveys (Center for Political Studies 2021) from the 2012–2020 American National Election Studies (ANES). The ANES surveys usefully bracket Donald Trump’s presidency. To better set up the initial puzzle that animates this study, we start by considering relevant evidence using a rich battery of ANES feeling thermometers that ask respondents to indicate their degree of coolness versus warmth on a scale of 0° to 100°. Feeling thermometers are the most established instrument for gauging individuals’ affect toward groups, featuring centrally in existing scholarship on the subject (Iyengar et al. 2019). The eight items presented in Figure 1 below reference a range of minority groups that have historically experienced social exclusion and been the recent targets of negative communications by populist-conservative politicians and influencers. 3
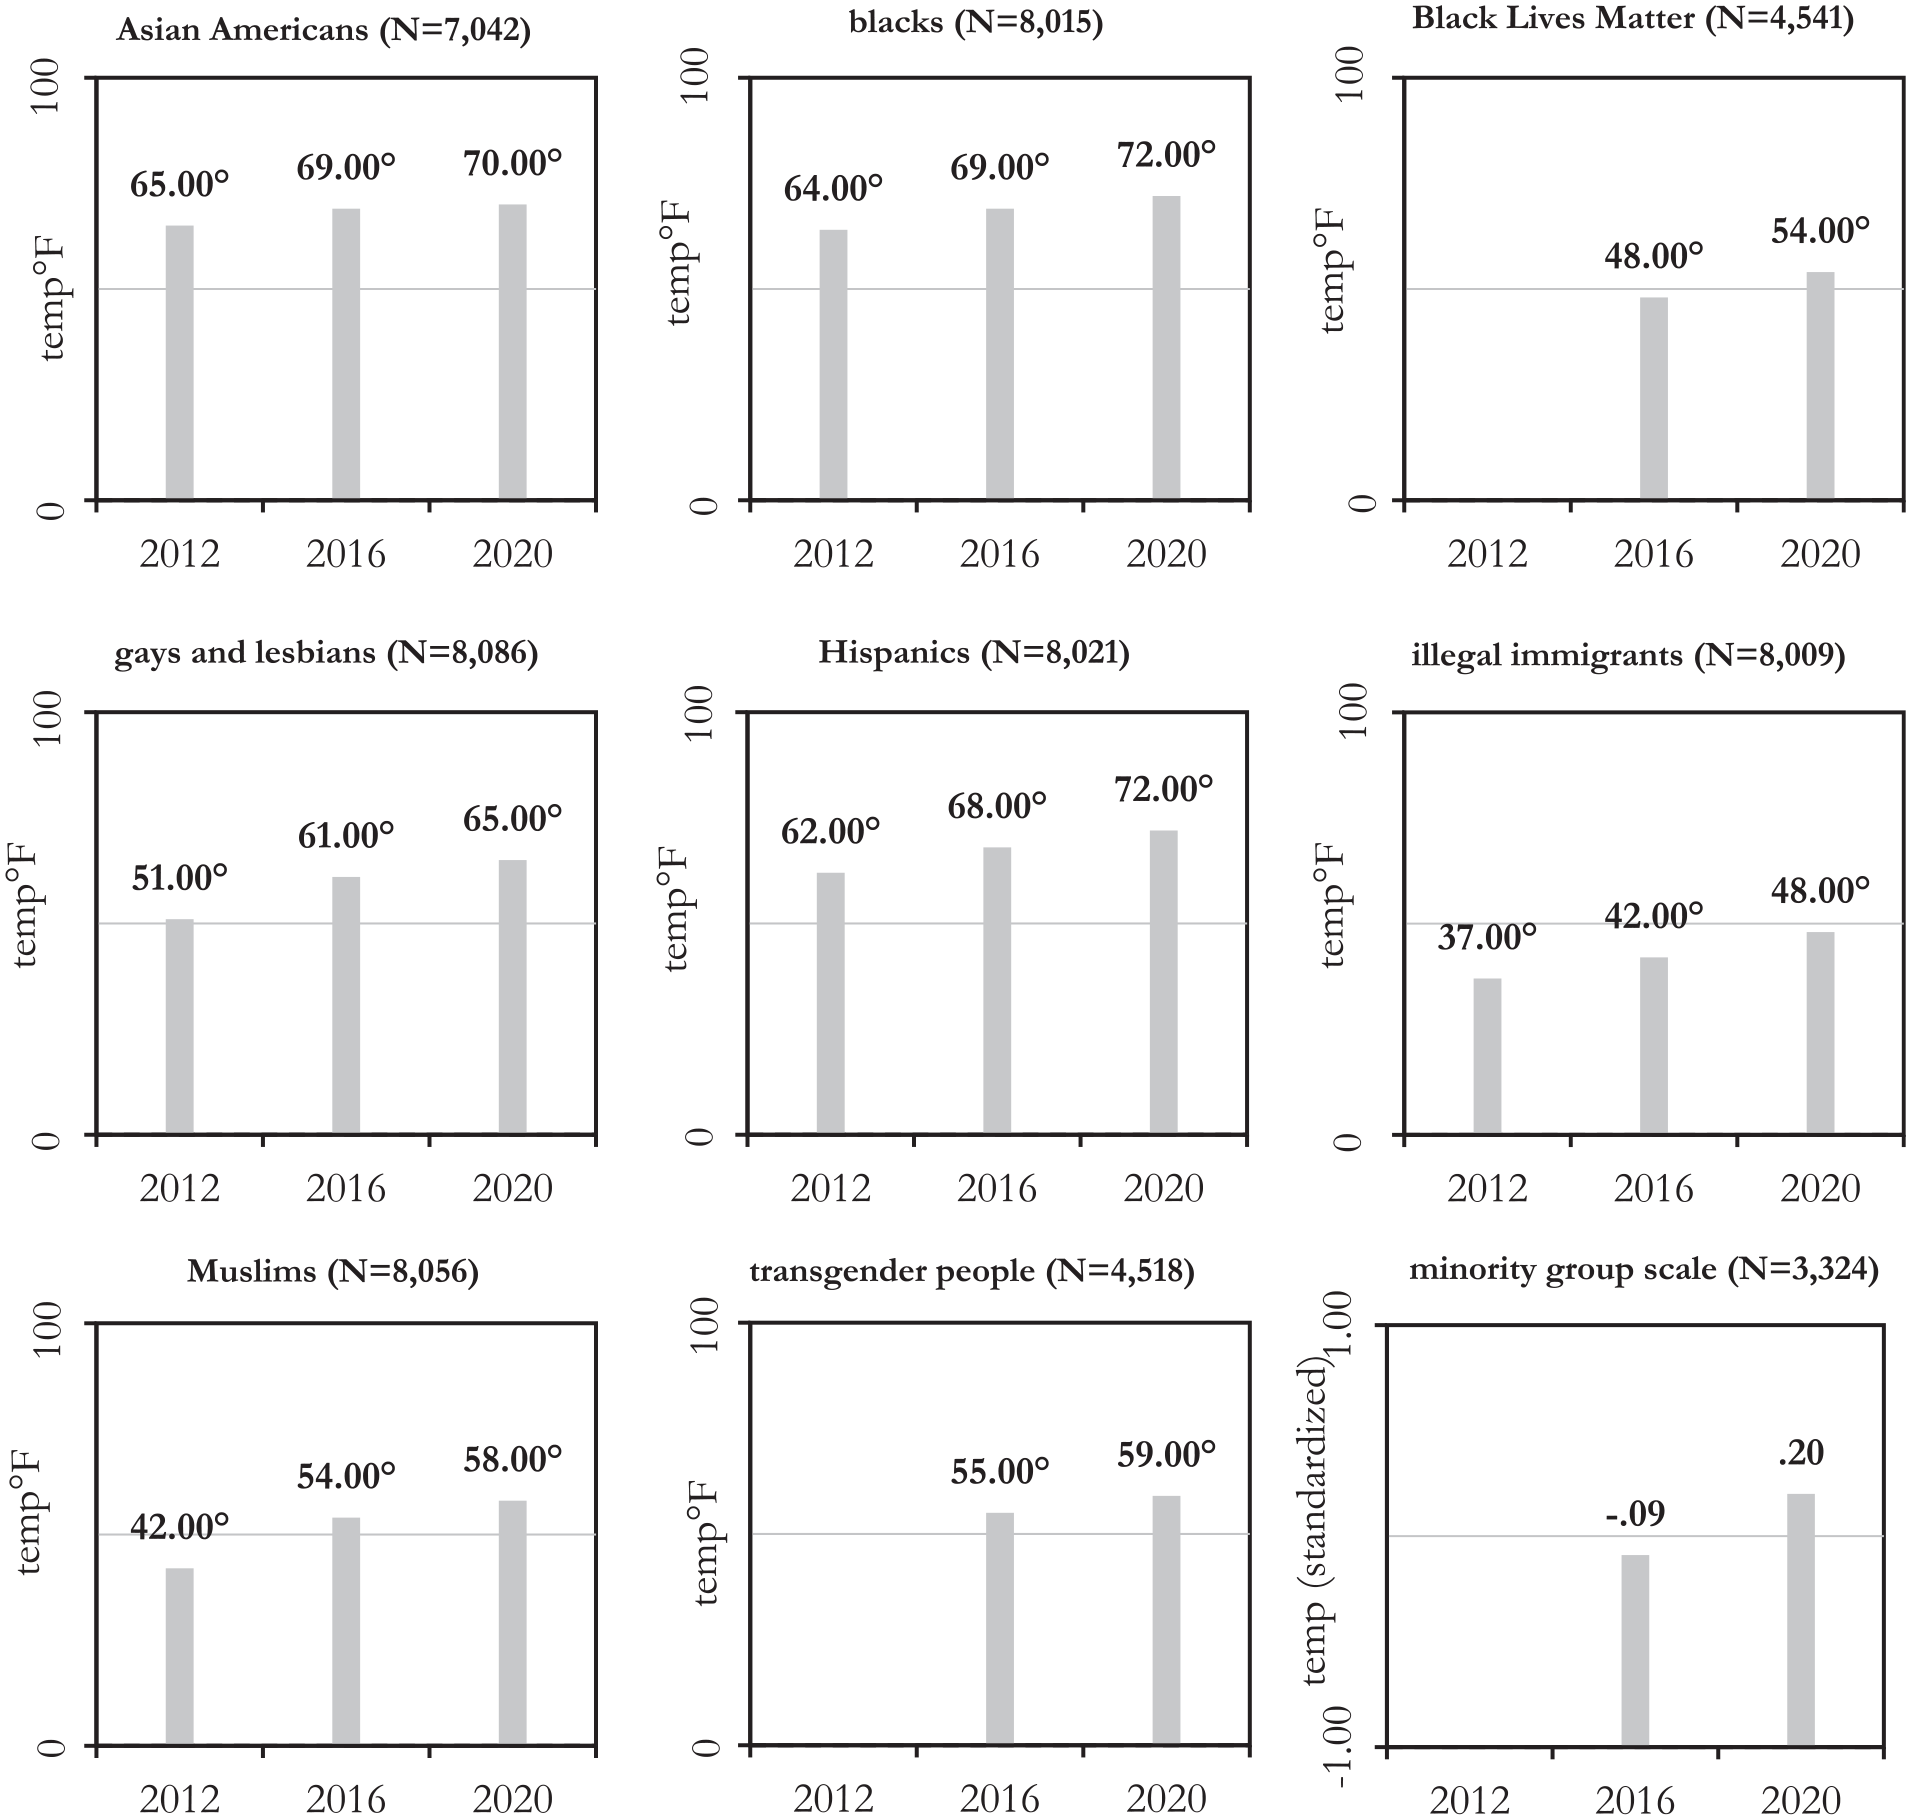
Affect toward minority groups, 2012–2020 American National Election Studies.
Between 2012 and 2020, all eight ANES items show statistically significant change in affect toward minority groups. This is also the case with respect to Figure 1’s final item, which is a scale we have constructed of the eight preceding items. But instead of temporal movement toward more negative emotions, these data point to a notably different, warming trend. Affect levels do vary across the eight groups that are referenced, yet it is the warming trend shared by all items that is the key finding at hand. This trend appears to be relatively large in magnitude. Using Figure 1’s scale, warmth increased by nearly a third of a standard unit between 2016 and 2020, a substantial change in a short period of time. 4
We complement the preceding estimates with consideration of individuals’ affect toward majority groups to probe the possibility of a parallel (or diverging) trend. To this end, Figure 2 presents feeling thermometer scores for the two majority groups that can be measured in the 2012–2020 ANES surveys: Christians and whites. 5 Figure 2’s third item is a scale of the two majority group items.

Affect towards majority groups, 2012–2020 American National Election Studies.
Trends in affect toward majority groups are statistically significant though smaller in magnitude than those observed for affect toward minority groups. What is again most notable is the overall direction of change in affect. During the same time that affect toward minority groups warmed, affect toward majority groups moved in a complementary direction by cooling between 2016 and 2020. These results hint at the possibility that Donald Trump and populist-conservative influencers’ portrayals of minority and majority groups did not have expected effects. Moreover, if trends in affect toward majority and minority groups motivated voters at the ballot box, Trump’s communications may have even backfired, contributing to his eventual exit from office.
Recent patterns of change in affect toward majority and minority groups, alongside the possibility that these trends shaped the behavior of voters, are of novel relevance to the influential theory of affective polarization (Iyengar, Sood, and Lelkes 2012; Mason 2016; Robison and Moskowitz 2019; see also Huddy, Mason, and Aaroe 2015). If they hold up in the face of systematic, multivariate analysis, the results in question may refine affective polarization theory by suggesting that voters’ affect toward groups is an independent force and does not simply reflect partisanship. For its part, affective polarization scholarship offers an inescapable challenge to the results we have presented. According to this theory, polarization between Republican and Democratic politicians has become closely linked to voters’ emotional responses to social groups. Over time, elite-driven polarization has sorted voters into more homogenous coalitions, with, for instance, LGBTQ individuals and racial minorities being more likely to identify as Democrats and whites and religious conservatives being more likely to identify as Republicans. The temporal unfolding of these processes has disposed party identifiers to feel negatively toward social groups that they associate with the out-party.
Affective polarization theory leads to a pair of skeptical hypotheses as regards trends in affect toward groups and their potential influence on the behavior of voters. First, in comparison with Democratic identifiers, Republican identifiers are far less likely to move, over time, toward warmer emotions toward minority groups (or cooler affect toward majority groups). Second, because affect toward minority and majority groups is largely reflective of partisanship, affect is unlikely to shape the behavior of voters at the ballot box once partisan loyalties are taken into account. Together, these two hypotheses present key challenges to the initial results we have presented. First, they call into question the existence of population-wide trends in affect toward minority and majority groups. Second, they cast doubt on the possibility that affect exerted any independent influence over voters in recent elections once partisanship is controlled.
In this study, we take up the challenges offered by affective polarization scholarship with an eye to the potential limits of this theory vis-à-vis warming trends in individuals’ affect toward minority groups and their influence over voter choice and elections. Taking as our point of departure the initial results, we delve further into the 2012–2020 ANES data. We first evaluate the evidence for trends in affect toward minority and majority groups among Democratic versus Republican identifiers (alongside independent identifiers). We then estimate the impact of affect toward minority and majority groups on voter choice. Guided by affective polarization theory, we incorporate partisanship (alongside controls for established forms of antiminority attitudes) in our models. We extend the analyses to predict the outcome of the 2020 presidential election, simulating the presence versus absence of the key trends in affect toward minority and majority groups. These estimates yield the necessary evidence with which to evaluate the expectations of affective partisanship theory. We seek to gauge the extent to which the initial, descriptive trends in voters’ affect toward minority (and majority) groups instead reflect a novel and theoretically relevant force in elections, alongside a broader, population-wide pattern of change in individuals’ affect toward groups.
In the first section, we review affective polarization theory’s expectations concerning affect toward minority and majority groups, alongside related research on political polarization. In the second section we outline data and measures, and in the third section we present results. We discuss study limitations in conclusion, alongside implications for affective polarization theory, research on the Trump phenomenon, and connections to past scholarship by sociologists on liberalizing trends in the United States.
Embodiment, Intergroup Emotions, and Affective Polarization
Embodiment and Intergroup Emotions Scholarship
Emotions are of long-standing interest to social scientists, and two traditions of scholarship have particular relevance to questions about affect toward minority and majority groups. For the embodiment tradition within social psychology, emotions are powerful sources of motivation (Smith-Lovin and Winkielman 2010; see also Dukes et al. 2021). As Turner and Stets (2006) express the proposition at hand, “virtually any emotional state pushes humans to behave in a particular way” (p. 47). In addition to triggering predictable behavioral responses on the part of individuals, the experience of a common emotional response can also lead to new forms of collective action.
The tradition of intergroup emotions scholarship echoes these themes, focusing in explicitly on emotional responses to minority groups. In particular, researchers have found that affect toward racial and ethnic minorities, immigrants, and LGBTQ individuals shape evaluations of, and willingness to interact with, members of these groups (Bodenhausen and Moreno 2000; Miller, Smith, and Mackie 2004; Semin and Smith 2008). According to intergroup emotions scholarship, if individuals’ affect toward minority (or majority) groups is strong, it becomes a core element of their own identities, leading to a tendency to persist over time.
From the perspectives of embodiment and intergroup emotions scholarship, population trends in which individuals come to display warmer emotional responses to minority groups (and cooler affect toward majority groups) are suggestive of a potentially far-reaching transformation. Specifically, warmer views of minority groups can be expected to exert pressure toward lower levels of hostility with respect to interactions between majority and minority group members. Social psychologists and sociologists working within these traditions rarely focus on political behavior as such. But these lines of scholarship are notably consistent with the expectation that Donald Trump’s group-centric communications may have done less than expected (and perhaps even backfired) if trends in affect toward groups shaped the behavior of voters and the outcome of the 2020 presidential election. This is an intriguing possibility. It would signal the importance of recent trends in affect toward majority and minority groups with respect to an important type of behavior (voting) and institutional context (elections). But it is speculative at best without systematic consideration and incorporation of the argument advanced by affective polarization theory.
Affective Polarization Theory
Affective polarization theory builds from an established body of scholarship analyzing partisanship, that is, identification with a political party. Although classic research demonstrated that identification as a Democrat or Republican powerfully shapes voting behavior, campaign involvement, and policy attitudes (Campbell et al. [1960] 1980; see also Bafumi and Shapiro 2009), recent work has found evidence for partisanship’s further influence with respect to such seemingly nonpolitical behaviors as hiring decisions and intimate partner choice (Gift and Gift 2015; Huber and Malhotra 2016). The key mechanism behind this wide-ranging pattern of influence involves partisanship operating as a social identity (Green, Palmquist, and Schickler 2002). Like ethnic or religious identity, partisan identifiers see their preferred party as an indicator of who they are. This means that elections create high personal stakes for voters, propelling identifiers to support their party’s candidate. It also motivates people to seek out those with similar partisan identities, avoiding and even vilifying those on the other side of the political divide.
Affective polarization theory combines partisanship as a social identity with a detailed focus on voters’ emotional responses to groups. A core dimension of social identification involves emotions, and scholars of affective polarization argue that individuals’ dislike of the out-party is as consequential as positive feelings toward the in-party (Druckman and Levendusky 2019; Iyengar et al. 2012). Voters do not just like people who identify with their party, they also feel negatively toward members of other political parties. In the United States, historical processes lie behind these tendencies, as elite-driven polarization in politicians’ messaging and legislative behavior has for decades sorted voters into more socially and ideologically homogeneous coalitions (Bonica et al. 2013; Levendusky 2009). This disposes partisan identifiers to like groups they associate with their preferred party and to dislike groups they associate with the nonpreferred party (Iyengar et al. 2019; Mason et al. 2021; Westwood and Peterson 2022). For instance, Democratic identifiers tend to view evangelicals or whites with a degree of antipathy, while Republican identifiers tend to view ethnic minorities or atheists in unfavorable terms. 6
Affective polarization theory has critical relevance to the present study’s focus on individuals’ affect toward minority and majority groups. It provides grounds for skepticism as regards the existence of population-wide trends in warming affect toward minority groups, as the expectation is that it will primarily be individuals identifying with the Democratic Party who are more susceptible, over time, to experiencing warmer emotions. Republican identifiers, for their part, may be left unmoved, or may have even trended toward greater hostility and coldness. The thematic issue raised by affective polarization scholarship is that partisanship is a key variable behind the operation of voters’ affect toward groups. If feeling thermometers for minority (and majority) groups are thus measuring voters’ partisan identities, this will not only lower estimates for time trends in affect, it will also lower estimates of individuals’ affect toward groups with respect to their voting behavior. Taking partisanship into account is thus essential in moving beyond the initial estimates we presented in the introduction.
For its part, a systematic consideration of individuals’ affect toward minority and majority groups provides an opportunity to investigate a potential blind spot in affective polarization theory. In particular, the incorporation of partisanship may return evidence of both population-wide trends in affect toward groups and a pattern of influence with respect to voting behavior. That would indicate that individuals’ affect toward minority and majority groups are less tethered to partisan identities than affective polarization theory anticipates. Scholars inside (as well as outside) the affective polarization tradition have yet to probe the preceding issues, and we seek to do so in this study.
Hypotheses
The skeptical scenario raised by affective polarization theory is that partisanship can operate as omitted variable with respect to individuals’ affect toward minority and majority groups. This leads to a pair of specific hypotheses that we consider in the analyses. As regards time trends, affective polarization theory implies that because partisanship confounds individuals’ affect toward social groups, it is mainly Democratic identifiers who have moved to warmer affect toward minority groups (and cooler affect toward majority groups). Republican identifiers, for their part, will be unlikely to experience warmer affect toward minority groups (or cooler affect toward majority groups). This should be particularly true during a period in which Donald Trump and other Republican party–aligned politicians and pundits talked about minority groups using disparaging cues and displaying negative affect, while offering more positive communications in reference to majority groups.
The second hypothesis that we consider relates to the possibility that affect toward minority and majority groups shaped voter choice and, in turn, that trends in affect levels influenced the outcome of the 2020 presidential election. This scenario would underscore the historical significance of recent patterns of change in affect toward groups, but affective polarization scholarship again provides grounds for skepticism. If affect toward minority and majority groups simply reflects partisanship, affect is unlikely to independently shape the behavior of voters (and, in turn, election outcomes) when partisan loyalties are taken into account.
Data and Measures
ANES Data
We analyze data from the three most recent ANES surveys for the 2012, 2016, and 2020 elections (Center for Political Studies 2021). ANES surveys represent the gold standard for data on voting behavior and public opinion in the United States. The ANES surveys are of substantive utility in fielding a wide-ranging battery of feeling thermometer items for affect toward eight minority groups, alongside two additional items for majority groups. Following established methodological practice in analyzing repeated surveys, the 10 feeling thermometers (and all other ANES items) that we analyze use the same question wording and response formats across the three surveys. 7
The years covered by the 2012–2020 ANES surveys coincide with Donald Trump’s emergence as a political candidate, his 2016 presidential victory, and his eventual loss in the 2020 election. Since 2012, ANES has fielded parallel face-to-face and Internet surveys. The exception was 2020, during which time the coronavirus disease 2019 pandemic precluded the ANES’ fielding of a traditional, face-to-face survey. We thus analyze the ANES’ 2012–2020 Internet surveys. 8
Measures
The 10 feeling thermometer items are summarized in Table 1. The first eight thermometers are for minority groups, and the last two items are for majority groups. The relatively diverse array of minority groups covered by the ANES items is desirable, including groups (blacks, gays and lesbians, Hispanics, “illegal immigrants,” and Muslims) that have been a focus of past research (Branton et al. 2011; Campbell and Herman 2010; Mason et al. 2021), alongside minority groups that have received comparatively less attention (Asian Americans, Black Lives Matter, and transgender people). Table 1’s final two items are for the two majority groups that can be measured in the ANES surveys (Christians and whites).
Items for Affect toward Minority and Majority Groups, 2012–2020 American National Election Studies.

Note: All items are from the 2012, 2016, and 2020 American National Election Studies Internet surveys, with the exceptions of the Black Lives Matter and transgender people items (which are available only in the 2016 and 2020 surveys).
Items are introduced with the following prompt: “We would like to get your feelings toward some of our political leaders and other people who are in the news these days. We will show the name of a person and we’d like you to rate that person using something we call the feeling thermometer. Ratings between 50 degrees and 100 degrees mean that you feel favorable and warm toward the person. Ratings between 0 degrees and 50 degrees mean that you don’t feel favorable toward the person and that you don’t care too much for that person. You would rate the person at the 50 degree mark if you don’t feel particularly warm or cold toward the person. . . . Still using the thermometer, we would like you to rate some groups.”
All items are available for the 2012–2020 analyses of time trends, with the exception of the Black Lives Matter and transgender people items (available only in the 2016 and 2020 surveys). Our inclusion of these two items means that our analysis of voter choice is restricted to the 2016 and 2020 elections. In turn, our scale of affect toward majority groups using feeling thermometers for Christians and whites is restricted to the 2016 and 2020 surveys (as is also the case for all remaining variables in the estimation sample for analyzing voter choice).
In the first part of the following analyses, we reanalyze trends in individuals’ affect toward minority and majority groups to take into account partisanship. As summarized in Table 2, we measure partisanship using two binary variables for Democratic identification and Republican identification. Identification as an independent is the reference category in regression models.
Other Variables in the Analysis, 2016–2020 American National Election Studies.

Note: All items are from the 2016–2020 American National Election Studies presidential election year Internet surveys.
By design, the three white identity politics items were asked of white respondents only.
In the second part of the analyses, voter choice in the 2016 and 2020 presidential elections is the dependent variable, and the two scales for affect toward minority and majority groups are the key independent variables of interest. As summarized in Table 2, voter choice is coded 1 for the Democratic candidate and 0 for the Republican candidate. We analyze this binary outcome variable using logistic regression models. In the course of the analyses, we test for interactions between election year and the affect scales (alongside other key covariates).
The remaining variables in Table 2 represent relevant factors behind voter choice in U.S. elections, many of which are well established in scholarship and some of which are connected to recent research innovations. The inclusion of these controls is appropriate in guarding against the risk of omitted variables when estimating the impact of individuals’ affect toward minority and majority groups as novel factors behind voter choice. This is particularly true as regards partisanship, but it is also relevant as regards the four items we use to measure racial resentment (Kinder and Sanders 1996; Sears 1988), the four items we use to measure anti-immigrant attitudes (Hooghe and Dassonneville 2018; Sides, Tesler, and Vavreck 2018), the two items we use to measure LGBTQ rights (McThomas and Buchanan 2012; Michelson and Schmitt 2021), the four items we use to measure national identity (Bonikowski 2016; Bonikowski, Feinstein, and Bock 2021), the three items we use to measure white identity politics (Jardina 2019), 9 and the three items we use to measure authoritarianism (Hetherington and Weiler 2009). Inclusion of the six resultant scales in our model of voter choice sets a deliberately high methodological bar for statistical inference. This is appropriate, as we want to guard, for instance, against the possibility that the well-known factor of racial resentment (or the more novel factor of national identity) influences both voter choice and affect toward minority groups (potentially reducing the coefficient for affect toward groups to nonsignificance).
Table 2’s remaining eight covariates are for economic and social correlates of voter choice. Economic evaluations, age, and education are continuous variables. Female, white, black, labor force participant, and south are binary variables.
Average Marginal Effects and Predicted Probability Calculations
We use average marginal effects (AMEs) to evaluate the predicted impact of affect toward minority and majority groups on voter choice. For nonlinear models, the AME provides a means of gauging the magnitude of predicted effects that is analogous to estimates from linear models (Long and Freese 2014:chap. 6). To calculate the AME with respect to a given covariate, the partial derivative is calculated for each individual in the estimation sample using observed levels of other covariates; the average of these calculations yields the AME. 10
To analyze the impact of trends in affect toward minority and majority groups on election outcomes, we use coefficient estimates and observed covariate levels to calculate the predicted probability of a Democratic candidate victory in the 2020 election under competing scenarios. The key calculation is the probability of a Democratic candidate victory in the presence versus absence of a trend in affect. For this calculation, we hold constant all covariates at observed levels and manipulate only the covariate for affect toward minority (or majority) groups. This tells us the degree to which an affect trend was instrumental in ushering Donald Trump out of office, thus providing further perspective on the historical significance of recent patterns of change in affect toward groups.
Results
Affective Polarization and Trends in Affect toward Minority and Majority Groups
Once partisanship has been taken into account, is there any evidence for trends in individuals affect toward minority groups, particularly with respect to patterns of change experienced by Republican Party identifiers? This question is central to the confrontation between affective polarization theory and our initial trends estimates that simply ignored partisanship. Figure 3’s results build from the initial estimates by analyzing patterns of change in affect toward minority groups separately for Democratic identifiers, independent identifiers, and Republican identifiers. 11
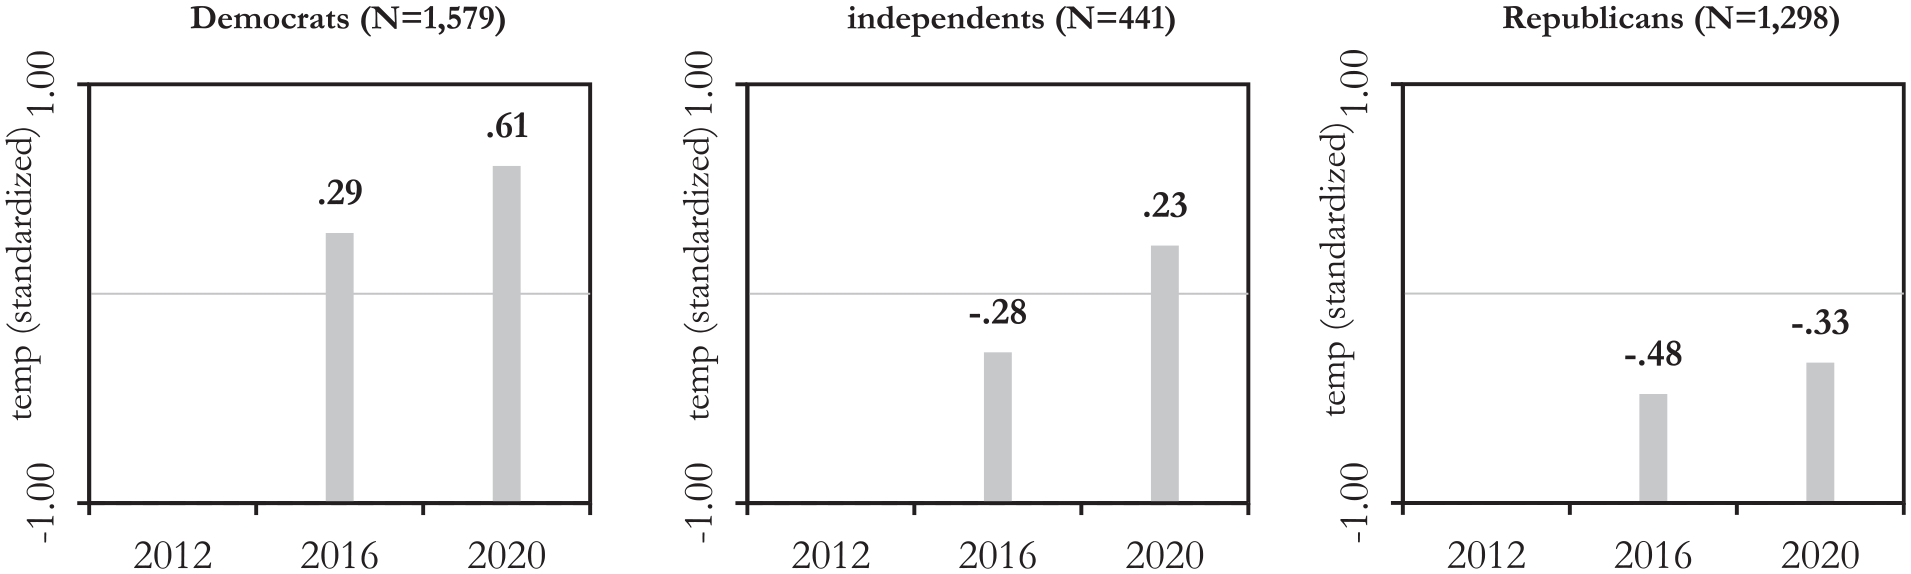
Partisan differences in affect toward minority groups, 2012–2020 American National Election Studies.
As summarized in Figure 3, there are significant trends involving warmer affect toward minority groups for all three groups of partisan identifiers. Partisanship does moderate these trends, as the magnitude of affect change varies across groups of identifiers. Independent identifiers (not Democratic identifiers) experienced the largest trend in affect, though in 2020 Democratic identifiers still exhibited the warmest level of affect toward minority groups.
It is instructive to consider the case of Republican identifiers, who experienced a nontrivial .15 standard unit increase in warmth toward minority groups between 2016 and 2020. From the perspective of affective polarization scholarship, this is unexpected and perhaps even paradoxical. The presidency of Donald Trump was characterized by a steep rise of negative communications regarding minority groups, one that should disproportionately influence those who identified with the president’s political party. But rather than moving in the direction of greater negativity or remaining unchanged in their affect, Republican identifiers’ affect toward minorities trended in a more positive direction during the Trump presidency.
What about the role of partisanship with respect to recent patterns of change in affect toward majority groups? Figure 4 presents our calculations using the scale for affect toward majority groups for Democratic, independent, and Republican identifiers. In comparison with trends in affect toward minority groups, trends in affect toward majority groups are smaller in magnitude, and independent identifiers’ affect did not change significantly over time. In contrast, changes in affect among Democratic and Republican identifiers are significant. Both Democrats and Republicans experienced a net decline in positive affect toward majority groups between 2012 and 2020. 12

Partisan differences in affect toward majority groups, 2012–2020 American National Election Studies.
Taking into account partisanship with respect to trends in affect delivers two key results. First, notwithstanding evidence for partisanship’s moderating role, Democrats and Republicans (and also independents) became significantly warmer in their affect toward minority groups. Second, Democratic and Republican identifiers also become somewhat cooler in their affect toward majority groups. The next question is whether these trends influenced voters’ behavior at the ballot box and in turn the outcome of the 2020 presidential election.
Did Affect toward Minority and Majority Groups Influence Voters?
Did affect toward minority and majority groups shape the behavior of voters in the 2016 and 2020 elections? Affective polarization theory’s argument about the strong association of voters’ partisan identities with their views of Democratic- and Republican-associated groups provides little grounds for affect toward minority and majority groups to influence voter choice once partisanship is taken into account. We use the ANES’ rich data to control for the widest possible range of confounding factors behind voter choice, including partisanship, racial resentment, LGBTQ rights, national identity, and authoritarianism (see again Table 2). We want to ensure that we are obtaining defensible estimates of affect toward minority and majority groups’ influence on voter choice, rather than inadvertently capturing the effects of partisanship, group stereotypes, or some other confounder.
Coefficients and standard errors for the resultant model of voter choice in the 2016 and 2020 presidential elections are presented in Table A1. The estimates indicate that a single-unit increase in minority group warmth raises the log odds of voting for the Democratic candidate by .800 (SE = .206). Similarly, the accompanying –1.032 coefficient (SE = .263) indicates that a unit increase in affect toward majority groups warmth lowers the log odds of Democratic candidate choice. Both estimates suggest a substantial influence on voter choice. 13 Before turning to more detailed interpretation, however, it is first appropriate to probe whether the influence of affect towards minority and majority groups’ respective influence on voters varied across the 2016 and 2020 election.
To this end, we present in Table 3 tests for gauging the significance of interactions involving election year. We do so with respect to affect toward minority and majority groups and also with respect to covariates for racial resentment, anti-immigrant attitudes, and partisanship. As summarized in the table, none of the p values associated with the interactions with election year is close to a conventional .05 level of significance. We thus retain the main effect model of voter choice in our analyses. 14
Tests for Interactions between Select Covariates and Election, 2016–2020 American National Studies (n = 2,191).
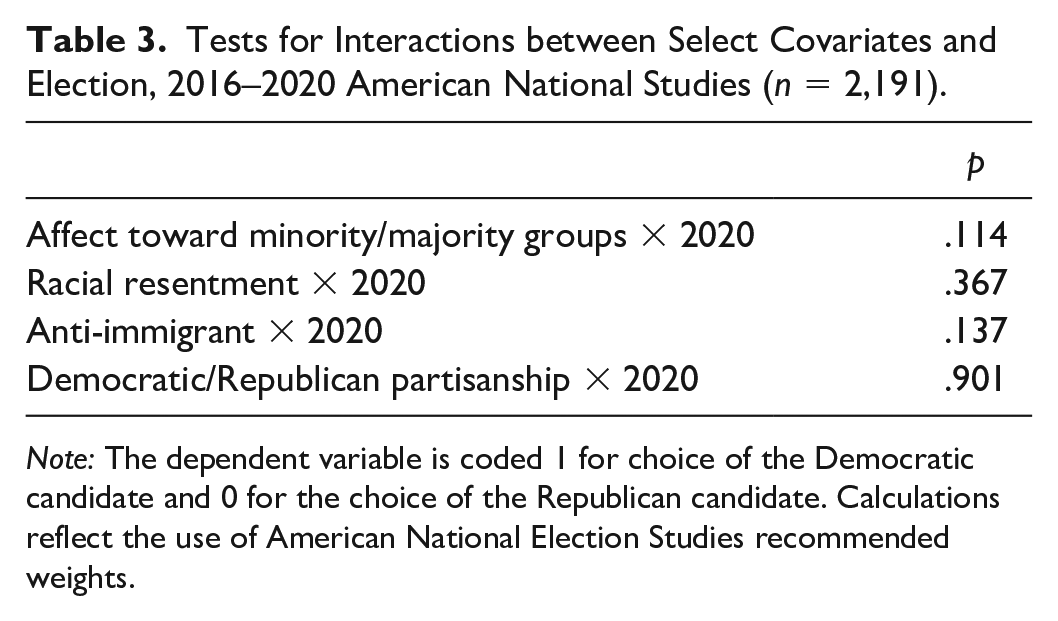
Note: The dependent variable is coded 1 for choice of the Democratic candidate and 0 for the choice of the Republican candidate. Calculations reflect the use of American National Election Studies recommended weights.
The Magnitude of the Influence of Affect towards Minority and Majority Groups on Voter Choice
The preferred, main effects model of voter choice in the 2016 and 2020 presidential elections provides evidence that affect toward both minority and majority groups were significant factors. We turn now to more detailed consideration of the magnitude of this influence, including in comparison with the effects of such better established factors as racial resentment and anti-immigrant attitudes. To this end, we present AMEs from our model in Figure 5. As indicated on the y-axis, the AME estimates indicate the predicted change in the probability of favoring the Democratic candidate in the past two presidential elections. The dotted line in the figure corresponds to a value of zero, enabling us to observe whether confidence intervals include this value, and accordingly that all estimates are significant.

Average marginal effects of select covariates on voter choice, 2016–2020 American National Election Studies.
The AME of .05 for affect toward minority groups indicates that a standard unit increase in positive affect toward minorities raises by 5 percentage points the probability of supporting the Democratic candidate in the past two presidential elections. The parallel estimate for affect toward majority groups is slightly larger in magnitude: a standard unit increase in warmth toward majority groups lowers by .06 the likelihood of voters favoring the Democratic Party candidate. At –.08, the AME for racial resentment represents a larger influence over voters, whereas the AME of –.04 for anti-immigrant attitudes suggests a somewhat smaller (though still significant) influence. In comparative perspective, then, the magnitude of minority and majority affects’ influence falls midway between the better established effects of racial resentment and anti-immigrant attitudes.
As a coda to these estimates, we test whether our key estimates are subject to a final, potential source of confounding. Here the possible confounder is white identity politics, that is, the degree to which individuals see whites as threatened by demographic change in the population. By design, the three items used by scholars to measure white identity politics (Jardina 2019) were asked only of white respondents in the 2016 and 2020 ANES surveys. In Table 4, we statistically compare our current estimates (see again Figure 5) with estimates based on a second estimation sample restricted to white respondents (and from a logistic regression model that includes the white identity politics scale as a covariate). 15
Tests for Equality of Select AMEs across Models and Estimation Samples (n = 2,191 vs. n = 1,671), 2016–2020 American National Studies.
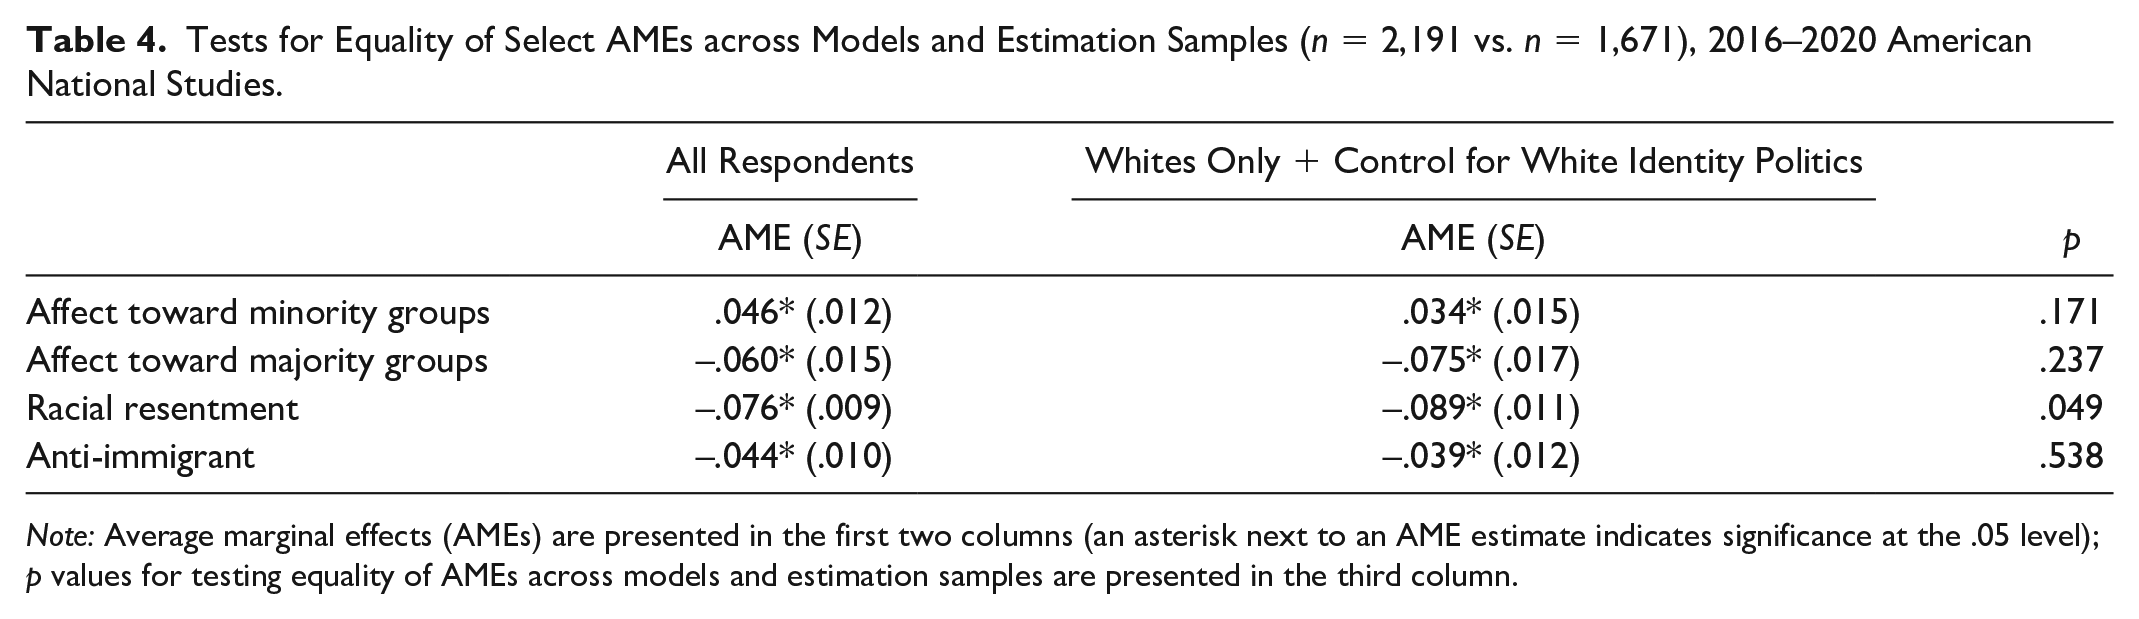
Note: Average marginal effects (AMEs) are presented in the first two columns (an asterisk next to an AME estimate indicates significance at the .05 level); p values for testing equality of AMEs across models and estimation samples are presented in the third column.
As summarized in Table 4, estimates for the respective influences of affect toward minority and majority groups on voter choice are not sensitive to the inclusion versus exclusion of the white identity politics scale. The same is true with respect to the estimate for anti-immigrant attitudes, but possibly not racial resentment (the p value for the test is quite close to .05). These results suggest that the exclusion of the white identity politics scale in the main parts of our analysis is of no consequence for testing key hypotheses relating to affect toward minority and majority groups.
Trends in Affect toward Minority and Majority Groups and the Outcome of the 2020 Presidential Election
The final question we address is how trends in affect levels shaped the outcome of the 2020 presidential election. To unpack this question, we contrast the following three scenarios: (1) the probability of a Biden victory in the 2020 election using 2016 levels of both affect toward minority and majority groups, (2) the probability of a Biden victory in the 2020 election using 2016 levels of affect toward minority groups, and (3) the probability of a Biden victory in the 2020 election using 2016 levels of affect toward majority groups. All three scenarios hold constant other covariates at their observed, 2020 levels. We present calculations for the three scenarios in Table 5.
Predicted Change in the Probability of a Biden Victory in the 2020 Presidential Election under Three Conditions, 2016–2020 American National Election Studies (n = 2,194).

Note: The dependent variable is coded 1 for choice of the Democratic candidate and 0 for the choice of the Republican candidate. Calculations reflect the use of American National Election Studies recommended weights.
Starting with the first scenario, holding both scales for affect toward minority and majority groups at their 2016 levels lowers the probability of a Biden victory by .078. As indicated in Table 5’s last column, this estimate is significant. In substantive terms, the estimate of –.078 is very large; by itself it transforms the actual margin of Biden’s 4 percentage point win into a 3.8 percentage point victory for Trump.
The second and third scenarios allow us to parse out the respective contributions of trends in affect toward minority versus majority groups. Holding constant only affect toward minority groups at its 2016 level reduces the probability of a Biden victory by .047. This is still large enough to potentially transform the Biden win into a (narrow) Trump reelection victory. At –.029, the third scenario also returns a statistically significant estimate. This estimate is smaller in magnitude than the first two scenarios’ estimates, but the .029 drop in the probability of a Democratic presidential victory still wipes out most of Biden’s observed margin of victory. Together, these estimates provide further evidence for the political and historical importance of recent trends in affect toward both minority and majority groups.
Discussion
In the United States, warming trends in individuals’ affect toward minority groups, alongside a cooling trend in affect toward majority groups, are unexpected developments in an era that saw the 2016 election of Donald Trump and a troubling escalation in hate crimes. Ours is the first study to report on these novel trends in affect, and in turn, to consider their broader, theoretical significance by analyzing linkages to voter choice and elections. Study results are enabled by high-quality surveys from the 2012–2020 ANES that bracket the emergence of Trump as a presidential candidate through his loss in the 2020 election.
Our results contribute to scholarship on the phenomenon of Trumpism, particularly as regards the potential effects of the negative emotions communicated and displayed by the sitting president in reference to minority groups. We find that rather than moving affect toward minority groups (and majority groups) toward greater consolidation of in-group dominance, Trump and his media counterparts appear to have largely failed during the period from 2016 through 2020. In retrospect, this result is in keeping with scholarship arguing that although presidents and other elected officials have opportunities to selectively respond to mass opinion, their capacity to change attitudes often tends to be quite limited (Canes-Wrone 2006; Edwards 2020; see also Druckman, Fein, and Leeper 2012). With respect to attitudes toward morality, for instance, Republican and Democratic identifiers alike have been moving in a broadly liberal direction (Baldassarri and Park 2020), despite attempts by Republican Party leaders to shift beliefs in the opposite direction. However, it is telling that up to this point many scholars have anticipated a pattern of rising, negative affect toward minority groups in response to the Trump presidency (Mason et al. 2021; Utych 2018; Westwood and Peterson 2022; see also Dunbar 2018).
Our findings concerning warming trends in individuals’ affect toward minority groups also diverge substantially from the influential theory of affective polarization (Huddy et al. 2015; Iyengar et al. 2019; see also Green et al. 2002). According to affective polarization scholarship, voters’ intense feelings toward political parties have spilled over into their patterns of affect toward groups that they associate with the in- versus out-party. In the current historical era, this is expected to dispose Republican identifiers to have persistently negative feelings toward minority groups. Moreover, insofar as all individuals’ affect toward minority and majority groups will tend to reflect the power of partisanship, this renders affect toward groups of little consequence for voter choice once party identification is properly taken into account.
This is not what we have found. Not only did Republican identifiers (like Democratic identifiers) move toward warmer affect toward minority groups between 2012 and 2020, affect toward minority groups had substantial effects on voter choice when controlling for partisanship and a wide array of other potential confounders. We emphasize that our multivariate estimates provide evidence that affect toward minority and majority groups also influenced the voting behavior of Democratic and Republican identifiers (and also independent identifiers) in an identical fashion. The far-reaching influence of partisan loyalties is clearly a key phenomenon in the current historical era, but it has not prevented the novel factor of individuals’ affect toward minority and majority groups from mattering considerably to their choice of presidential candidate. Together, these results may suggest a new limitation with respect to the theory of affective polarization.
Turning to the outcome of the 2020 presidential election, we find that over-time trends in affect toward groups had substantial impacts on the probability of a victory for the Democratic candidate. According to our regression simulations, changing the 2020 level of affect toward minority groups to its earlier, 2016 level transforms a Biden win into a loss in the general election. Not only did voters’ affect toward minority and majority groups shape their individual choice of candidate, aggregate-level trends in affect appear to have also been important in substantially eroding Trump’s chances for reelection.
From a theoretical perspective, these results help establish individuals’ affect toward minority and majority groups as a consequential mechanism behind voter choice and election outcomes. Patterns of public affect toward minority and majority groups are not simply a reflection of the established factors of partisanship and group stereotypes. They instead represent a novel set of processes that are eminently worthy of scholarly investigation in the 2020 presidential election and other political contexts as well.
Conclusions
Beyond the arena of political behavior and elections, are there domains of individual and collective action that have been shaped by recent patterns of change in individuals’ affect toward minority and majority groups? Earlier scholarship on intergroup emotions (Bodenhausen and Moreno 2000; Miller et al. 2004; Semin and Smith 2008) provides grounds for such an expectation, insofar as affect toward minority groups has been found to shape evaluations of, and willingness to interact with, members of these groups. Whether this applies in the contemporary historical era is intriguing yet unclear, and the current study results provide grounds for renewed investigation.
In the face of warming trends in affect toward minority groups, the ANES feeling thermometer data simultaneously reveal large, between-group differences in affect (see again Figure 1). Such groups as “illegal immigrants” and the Black Lives Matter movement elicit notably cooler affect in contrast to Hispanics or gays and lesbians. Recent trends across all the ANES minority group items are a reality, one that has been our primary focus in this study. Still, these trends have not displaced generally negative patterns of affect toward a number of specific groups, and this phenomenon is worthy of further study.
Inequalities in emotional responses to different minority groups are an important bridge to scholarship on minority stereotypes and hierarchies in the United States. We would emphasize that the present study results are largely consistent with the thrust of this scholarship, which has unpacked the operation of such central forms of animus as racial resentment (Kinder and Sanders 1996; McVeigh and Estep 2019; Sears 1988; see also Bonilla-Silva 2019) and xenophobia (Brader, Valentino, and Suhay 2008; Hooghe and Dassonneville 2018; Newman 2013). We have sought to incorporate the insights of this scholarship in controlling for racial resentment and anti-immigrant attitudes (as well as LGBTQ rights, national identity, authoritarianism, and white identity politics). For scholarship on minority stereotypes and modern forms of animus, a more novel point of study relevance relates to how affect toward minority and majority groups can change in ways that are historically consequential.
We conclude with by noting a pair of study limitations, alongside an as yet unpacked connection to a prior strain of scholarship. The first limitation concerns mechanisms behind recent trends in affect toward minority and majority groups. By design, our study has focused on the relevance of affect toward minority and majority groups with respect to voter choice and recent elections. Given evidence that recent patterns of change in affect toward minority and majority groups have been of considerable political consequence, we believe that there is ample warrant for further work on the conditions that facilitated the unfolding of these trends.
A second study limitation concerns how the perennial issue of social desirability may confound study results. We believe the unobtrusive design of the ANES Internet surveys, alongside the evidence we have presented concerning similar trends in affect toward minority groups among Democratic and Republican identifiers (as well as white respondents), is closely in line with the unfolding of a real trend in individuals’ emotional responses. From a methodological perspective, evidence that voters’ affect toward minority (and majority) groups strongly predicts candidate choice is likewise telling, for predictive validity would be low to nil if the feeling thermometer items were simply measuring individuals’ strategic compliance with perceived norms. Still, insofar as the ANES data we have analyzed contain no means of directly measuring social desirability itself, we acknowledge that the possibility of remaining bias cannot be ruled out and is deserving of further consideration.
Finally, the results we have reported, particularly as regards the large warming trend in individuals’ affect toward minority groups, potentially resonate with a classic and much earlier line of sociological scholarship. To the initial surprise of researchers in the 1970s and 1980s, repeated surveys probing individuals’ support for rights, liberties, and diversity found evidence for a dramatic pattern of liberalization in attitudes (Nunn, Crockett, and Williams 1978; Smith 1990; Stouffer [1955] 1992). How precisely, the trends in affect we have unearthed relate to such longer term patterns of opinion change (e.g., Hout 2021) may be useful to investigate.
Footnotes
Appendix A
Coefficient Estimates and Standard Errors for Logistic Regression Model of Voter Choice, 2016–2020 American National Election Studies (n = 1,671; White Respondents Only).

| Coefficient (SE) | |
|---|---|
| Constant | −2.282*(1.080) |
| 2020 | −.587 (.349) |
| Affect toward minority groups | .605* (.260) |
| Affect toward majority groups | −1.312* (.302) |
| Democratic partisanship | 2.861* (.409) |
| Republican partisanship | −1.386* (.388) |
| Racial resentment | −1.548* (.197) |
| Anti-immigrant | −.692* (.232) |
| LGBTQ rights | .318 (.277) |
| National identity | −.228 (.206) |
| Authoritarianism | −.193 (.174) |
| Economic evaluations | .465* (.135) |
| Age | −.001 (.010) |
| Education | .100* (.048) |
| Female | −.100 (.257) |
| White | — |
| Black | — |
| Labor force participant | −.290 (.310) |
| South | −.676* (.268) |
| White identity politics | .395 (.201) |
Note: The dependent variable is coded 1 for choice of the Democratic candidate and 0 for choice of the Republican candidate. Calculations reflect the use of American National Election Studies recommended weights. Wald χ2 (df = 16) for model = 257.390; pseudo-R2 = .719.
p < .05.
Acknowledgements
We thank Keera Allendorf and the editors and reviewers of Socius for comments.